July 2026: Upward pressure on gas and power prices provides support for Utilities in 2H 2026
What You Need to Know
The breakdown of the Middle East ceasefire and the renewed closure of the Strait of Hormuz in July have revived inflationary pressures from rising energy prices and triggered a further increase in interest rates. While energy stocks were the main beneficiaries of the rebound in oil and gas prices – the MSCI World Energy index rallied in July and beat the broader market (MSCI World) by more than 10% – utilities also gained on the back of rising power prices. However, since the start of the Iran war at the end of February, utilities stocks have broadly fallen around the world, underperforming both the MSCI World benchmark and the MSCI Energy index. The exception is Europe: the MSCI Europe Utilities index has now recovered all its losses since February and is trading at pre-war levels again, while Asia (MSCI Asia Utilities) has suffered the steepest declines – nearly 10% – during the military conflict in the Middle East (see Table 1). Year-to-date in 2026, the MSCI World Utilities index has kept pace with the broader market but trails energy stocks by a wide margin (around 20%). Meanwhile, the year-to-date performance of utilities across regions remains highly uneven: utilities in Europe (+17%) and the USA (+8%) continue to post solid gains, while Asian utilities are slightly in negative territory (see Table 1).
Table 1 Index Performances

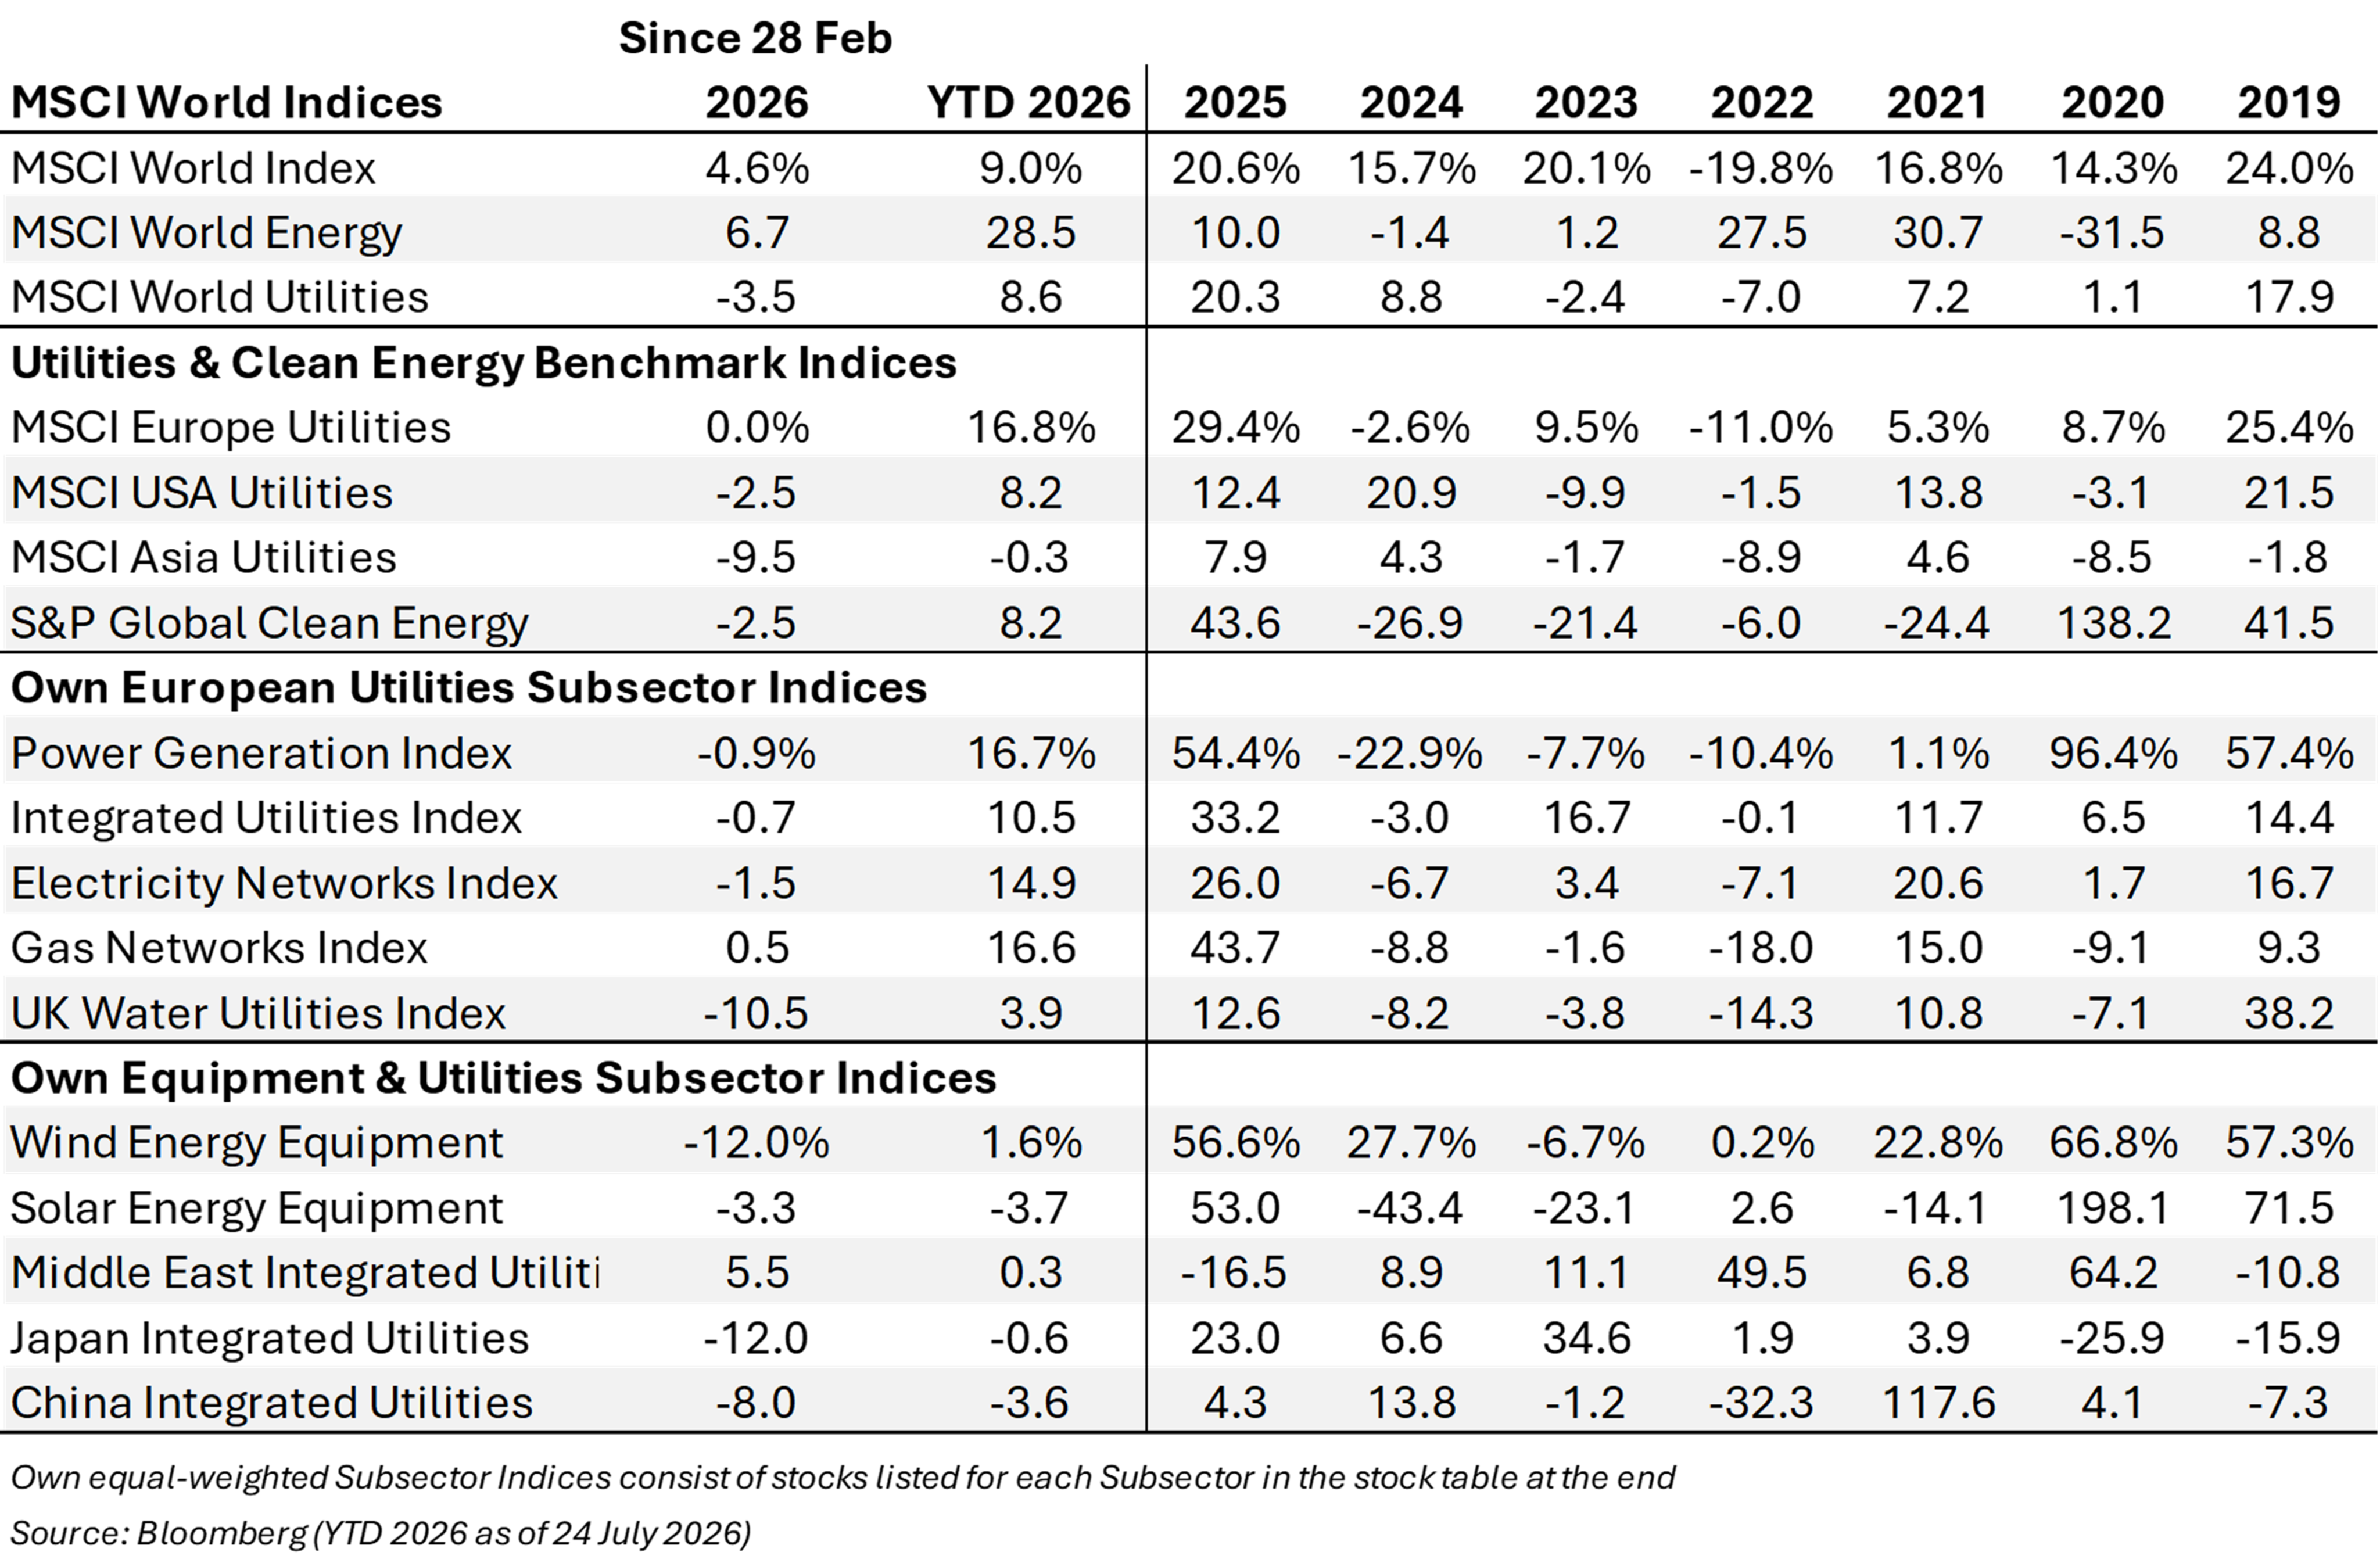
The strong year-to-date performance of the MSCI Europe Utilities index is also reflected in double-digit gains for our equal-weighted utilities subsector indices, with “Power Generation” and “Gas Networks” showing the strongest share price performances in 2026 (see Table 1). Even UK utilities are holding on to a year-to-date gain, despite this subsector losing more than 10% since the start of the Iran war on the back of rising energy prices. Similarly, our equal-weighted utilities indices for Japan and China have fallen by 12% and 8%, respectively, since 28 February 2026, resulting in year-to-date declines of 0.6% and 3.6%, respectively. Finally, after the S&P Global Clean Energy Index suffered double-digit declines in both June and July, its year-to-date performance has moderated to single-digit gains. This pullback in clean-tech stocks is also reflected in the sharp correction of our equal-weighted wind and solar energy equipment indices, which now post year-to-date returns of +1.6% and -3.7% (see Table 1).


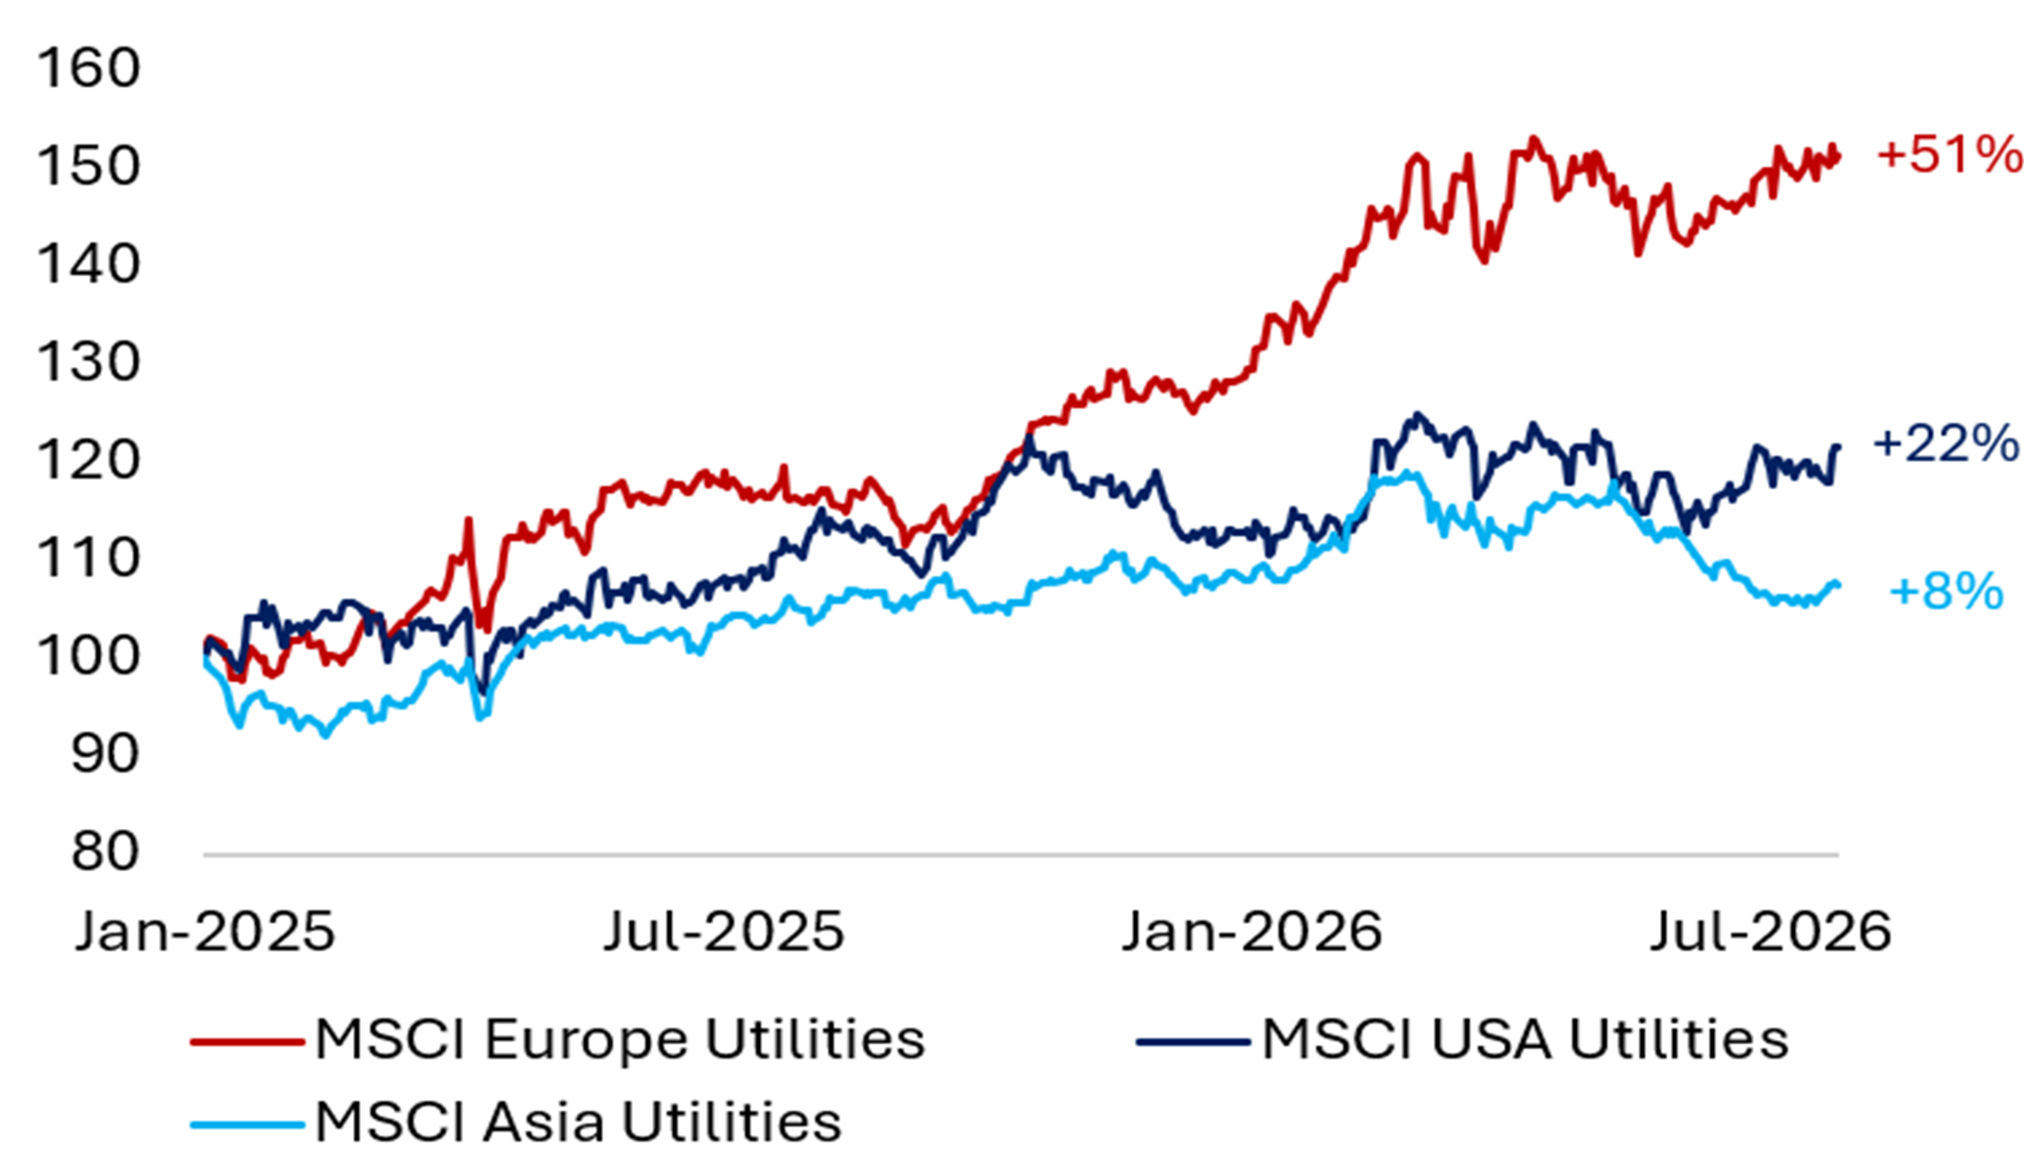
Exhibit 1 Short-Term PERFORMANCE Exhibit 2 Long-Term VALUATION
 (rebased since 2025) (1-yr Forward EV/EBITDA since 2017)

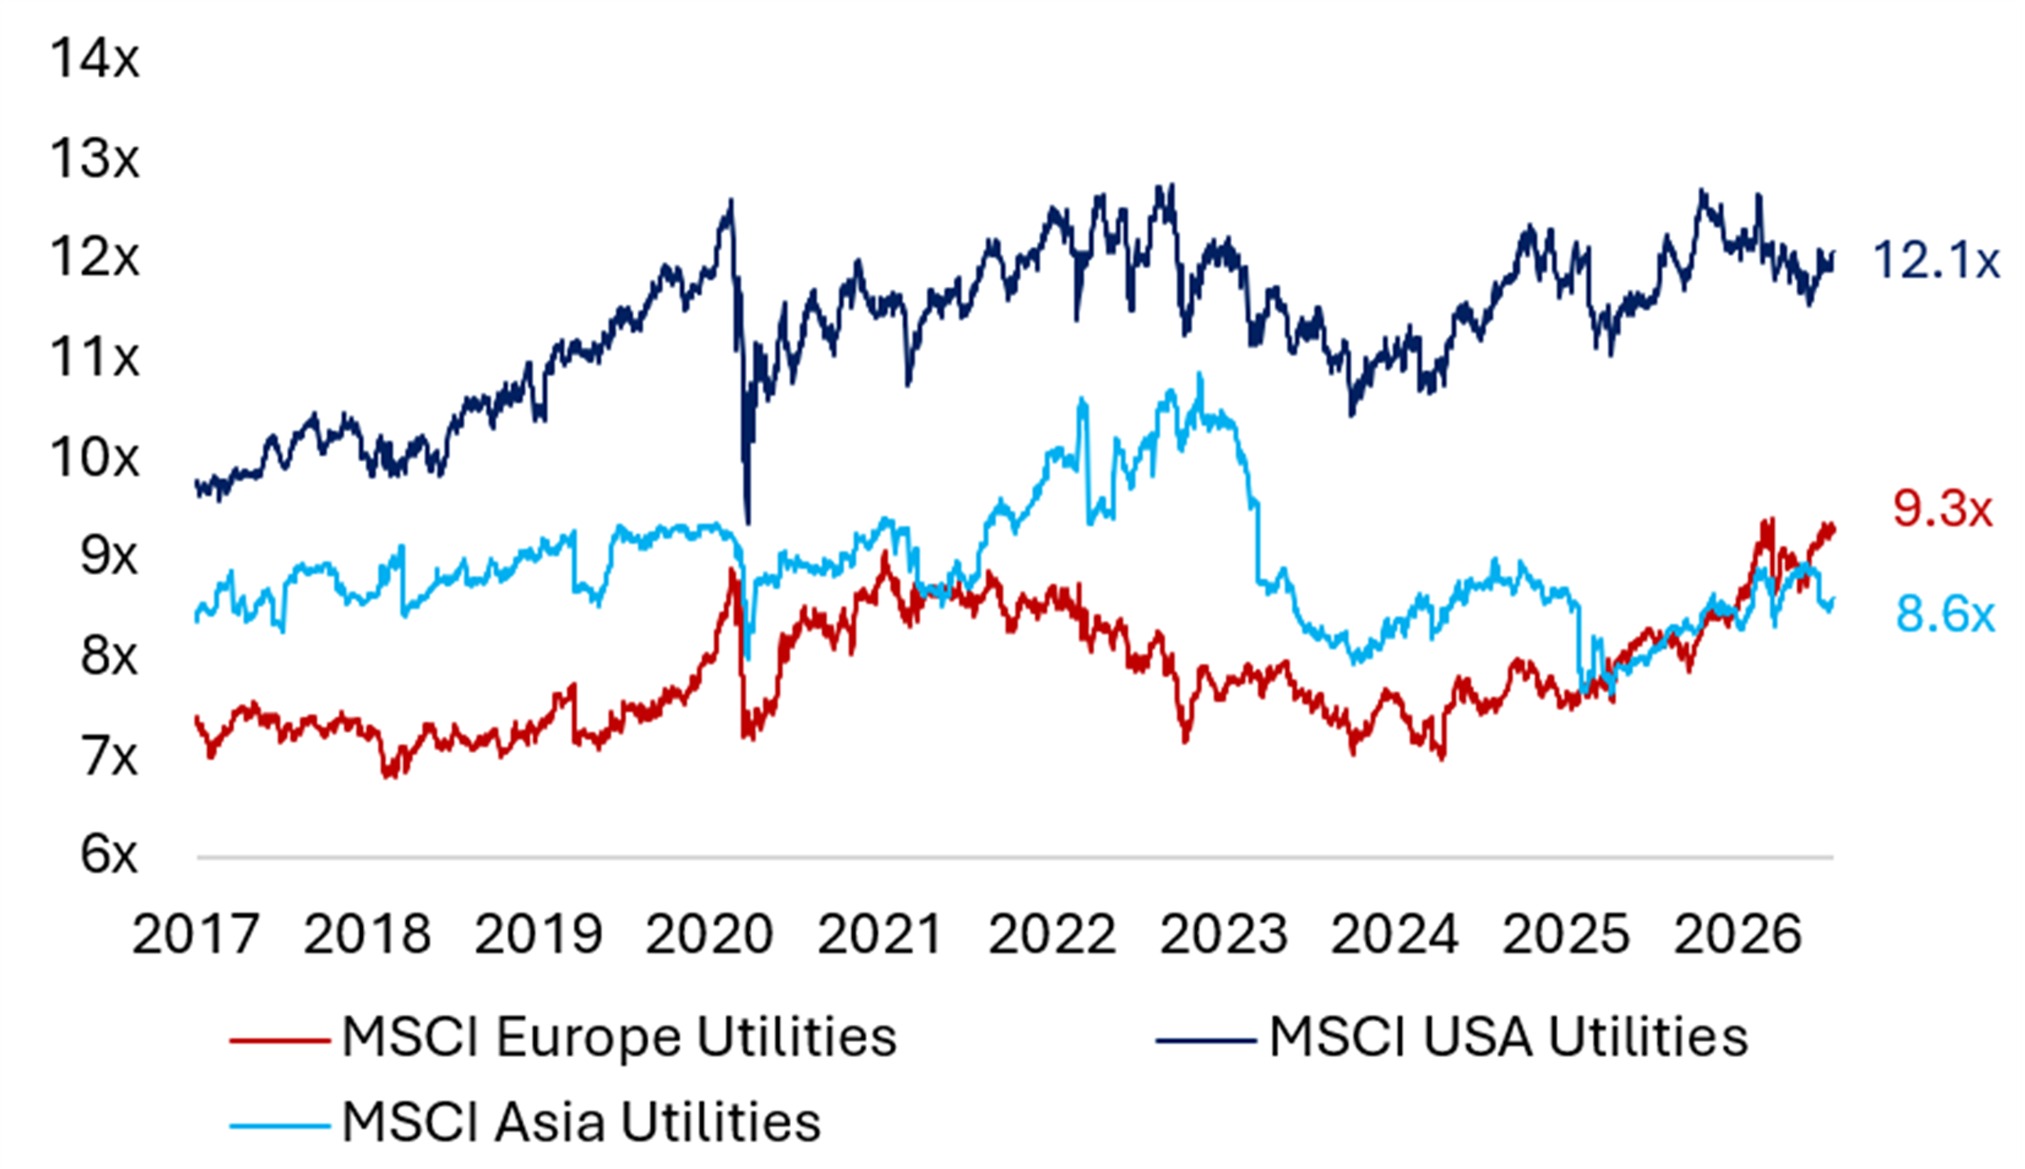

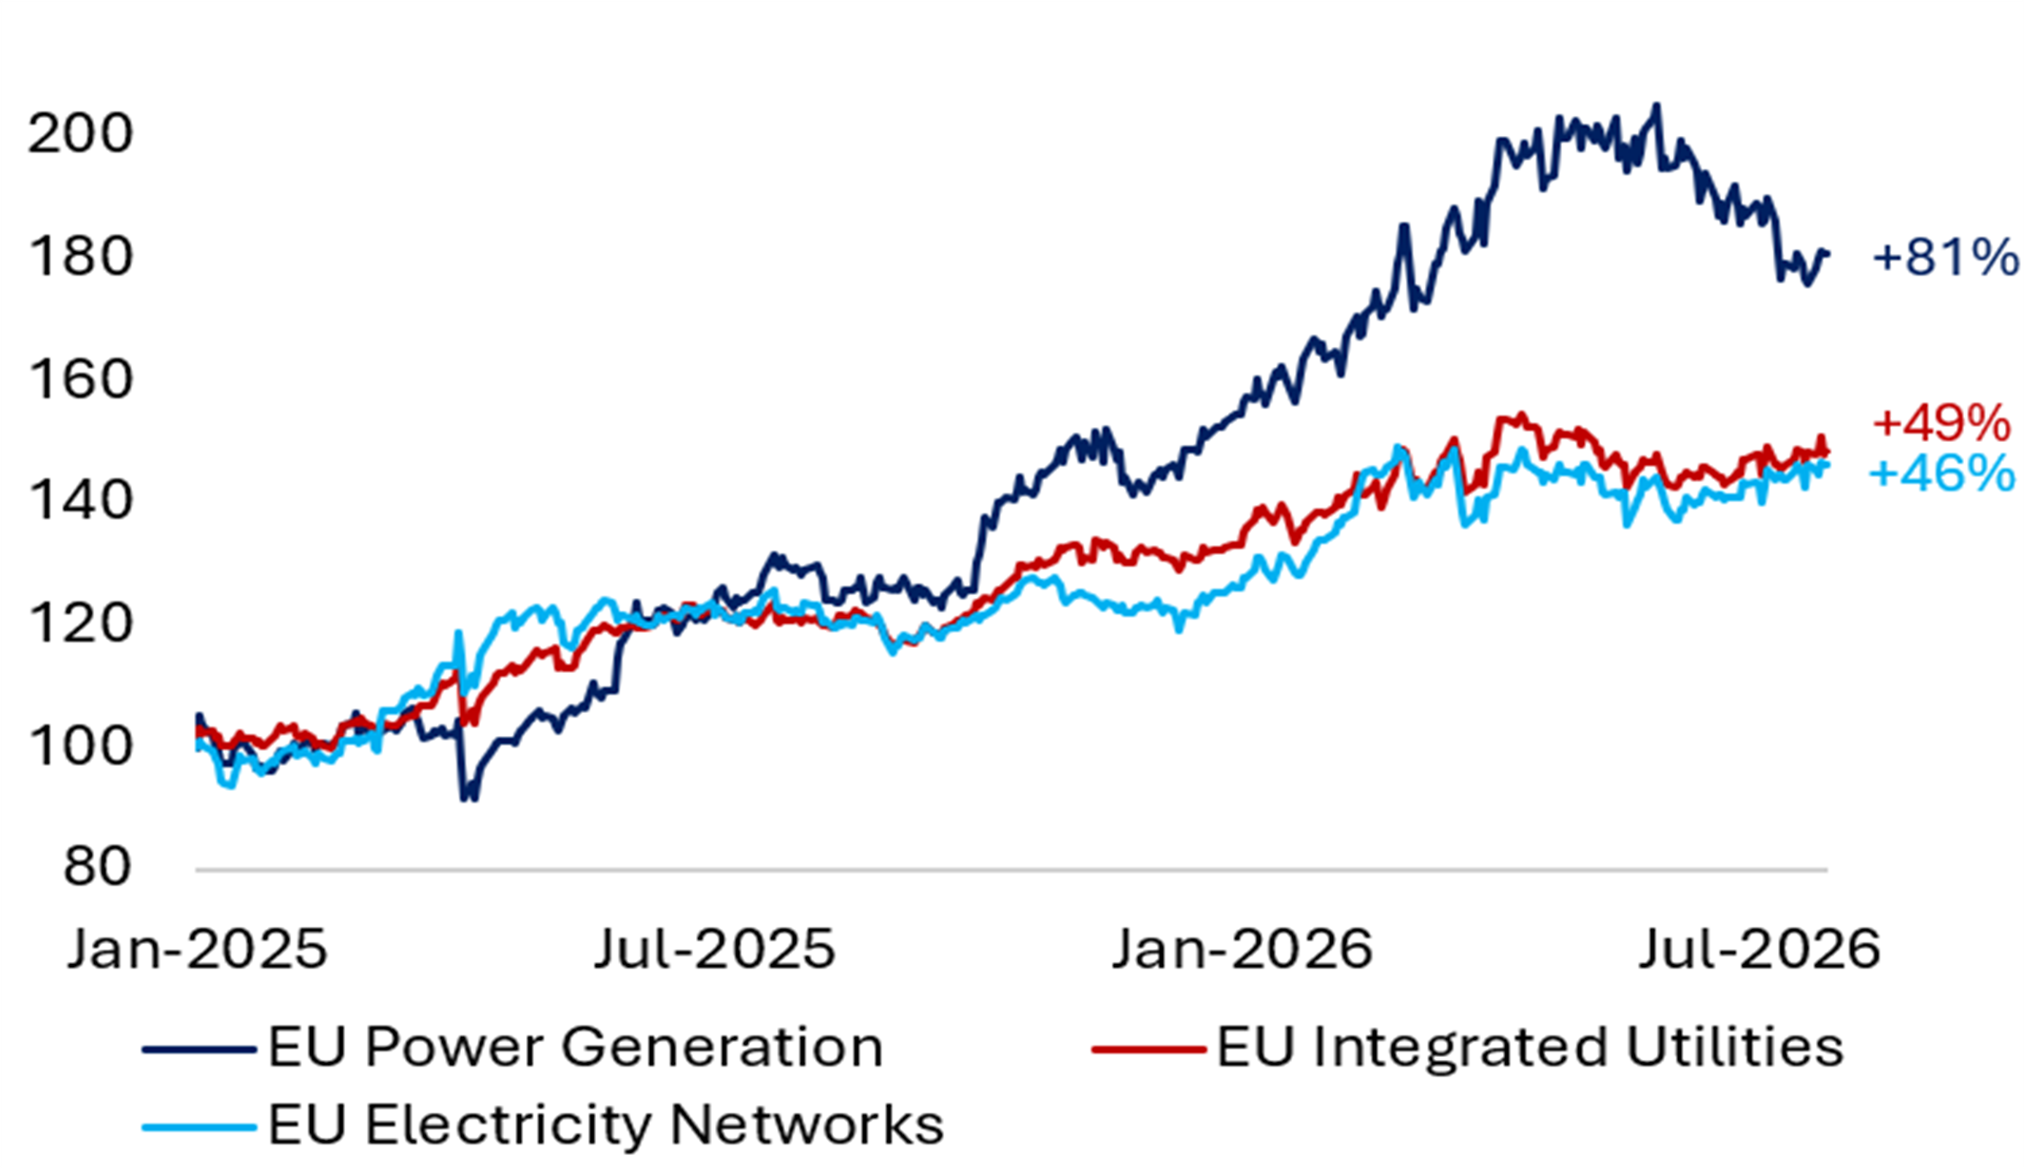
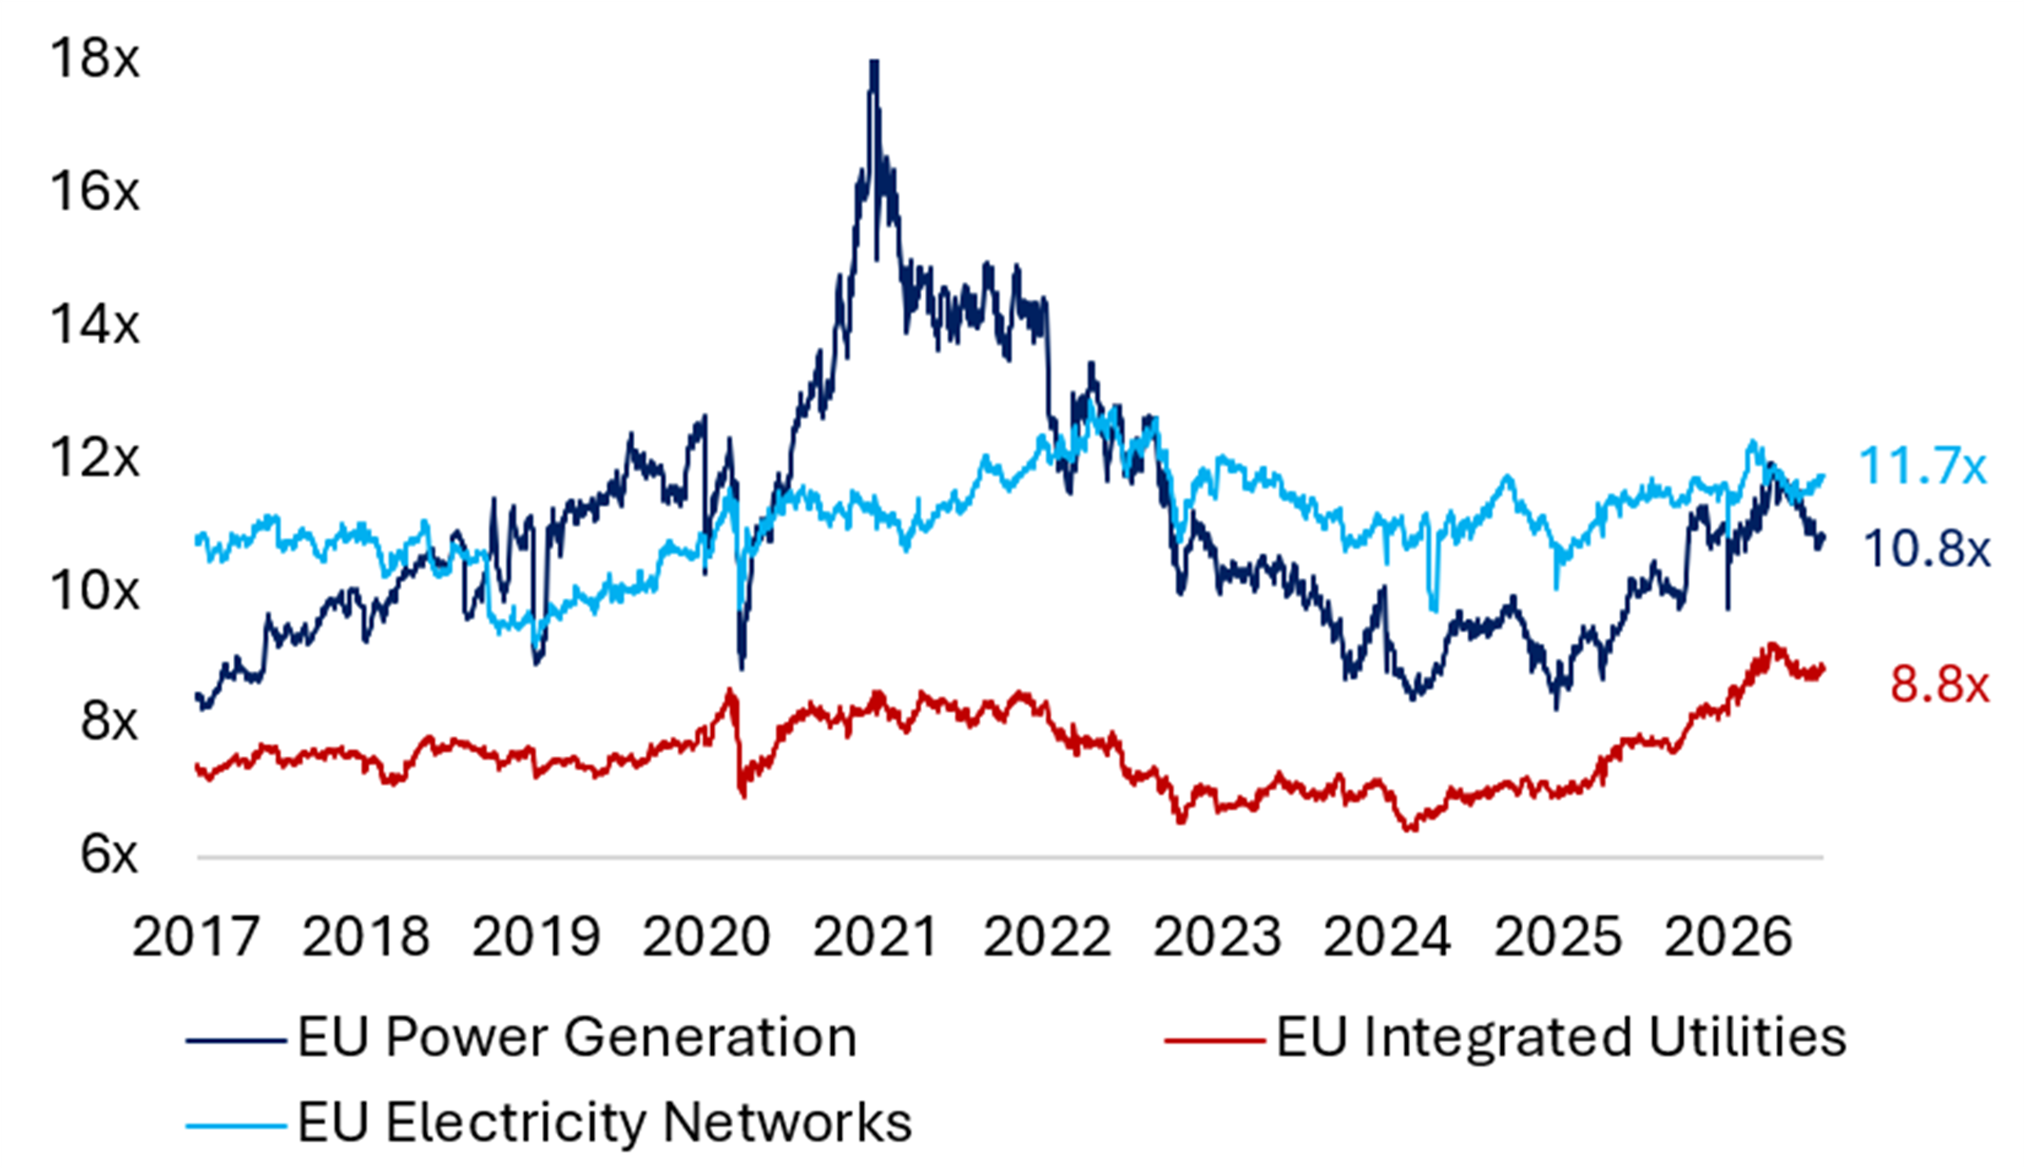
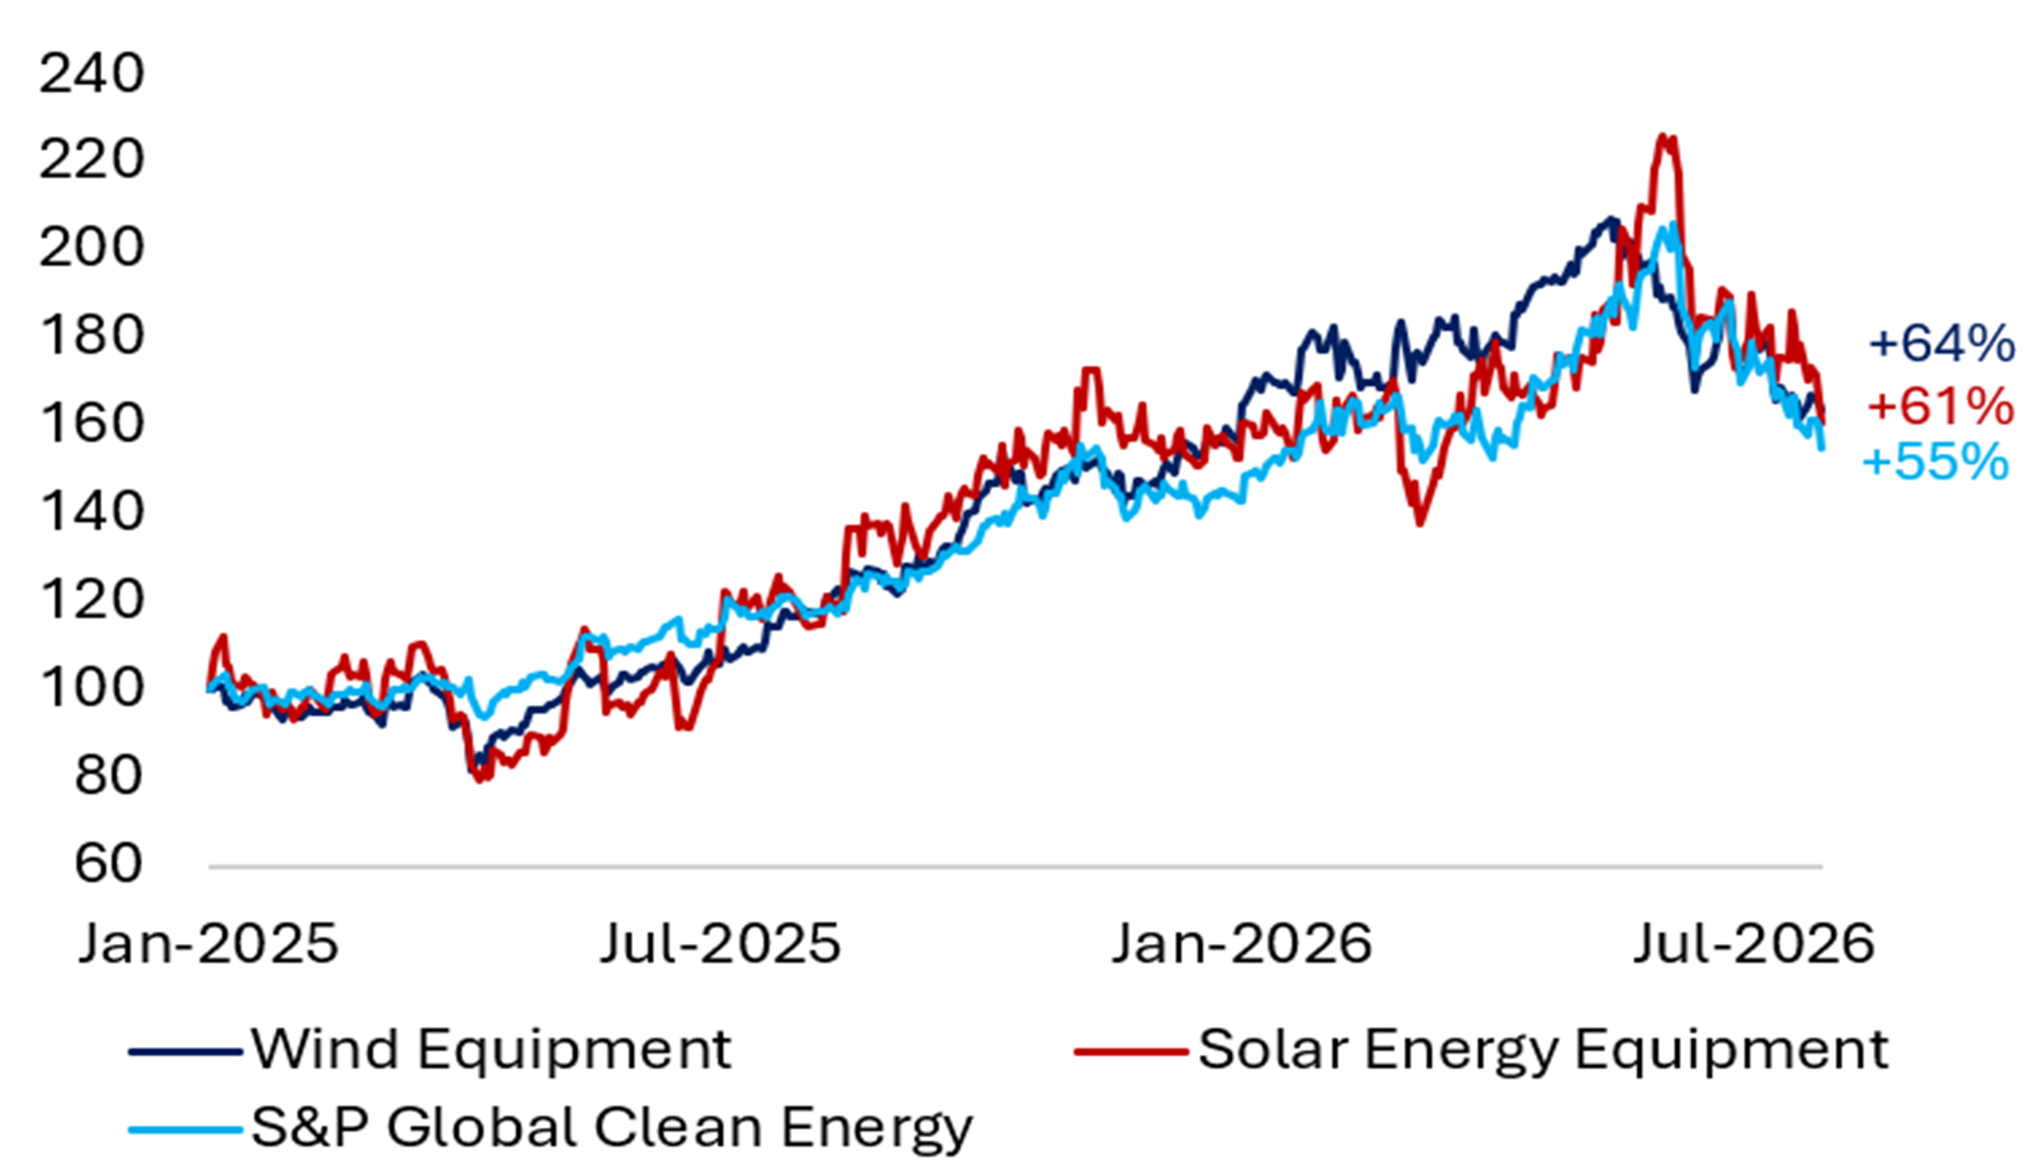
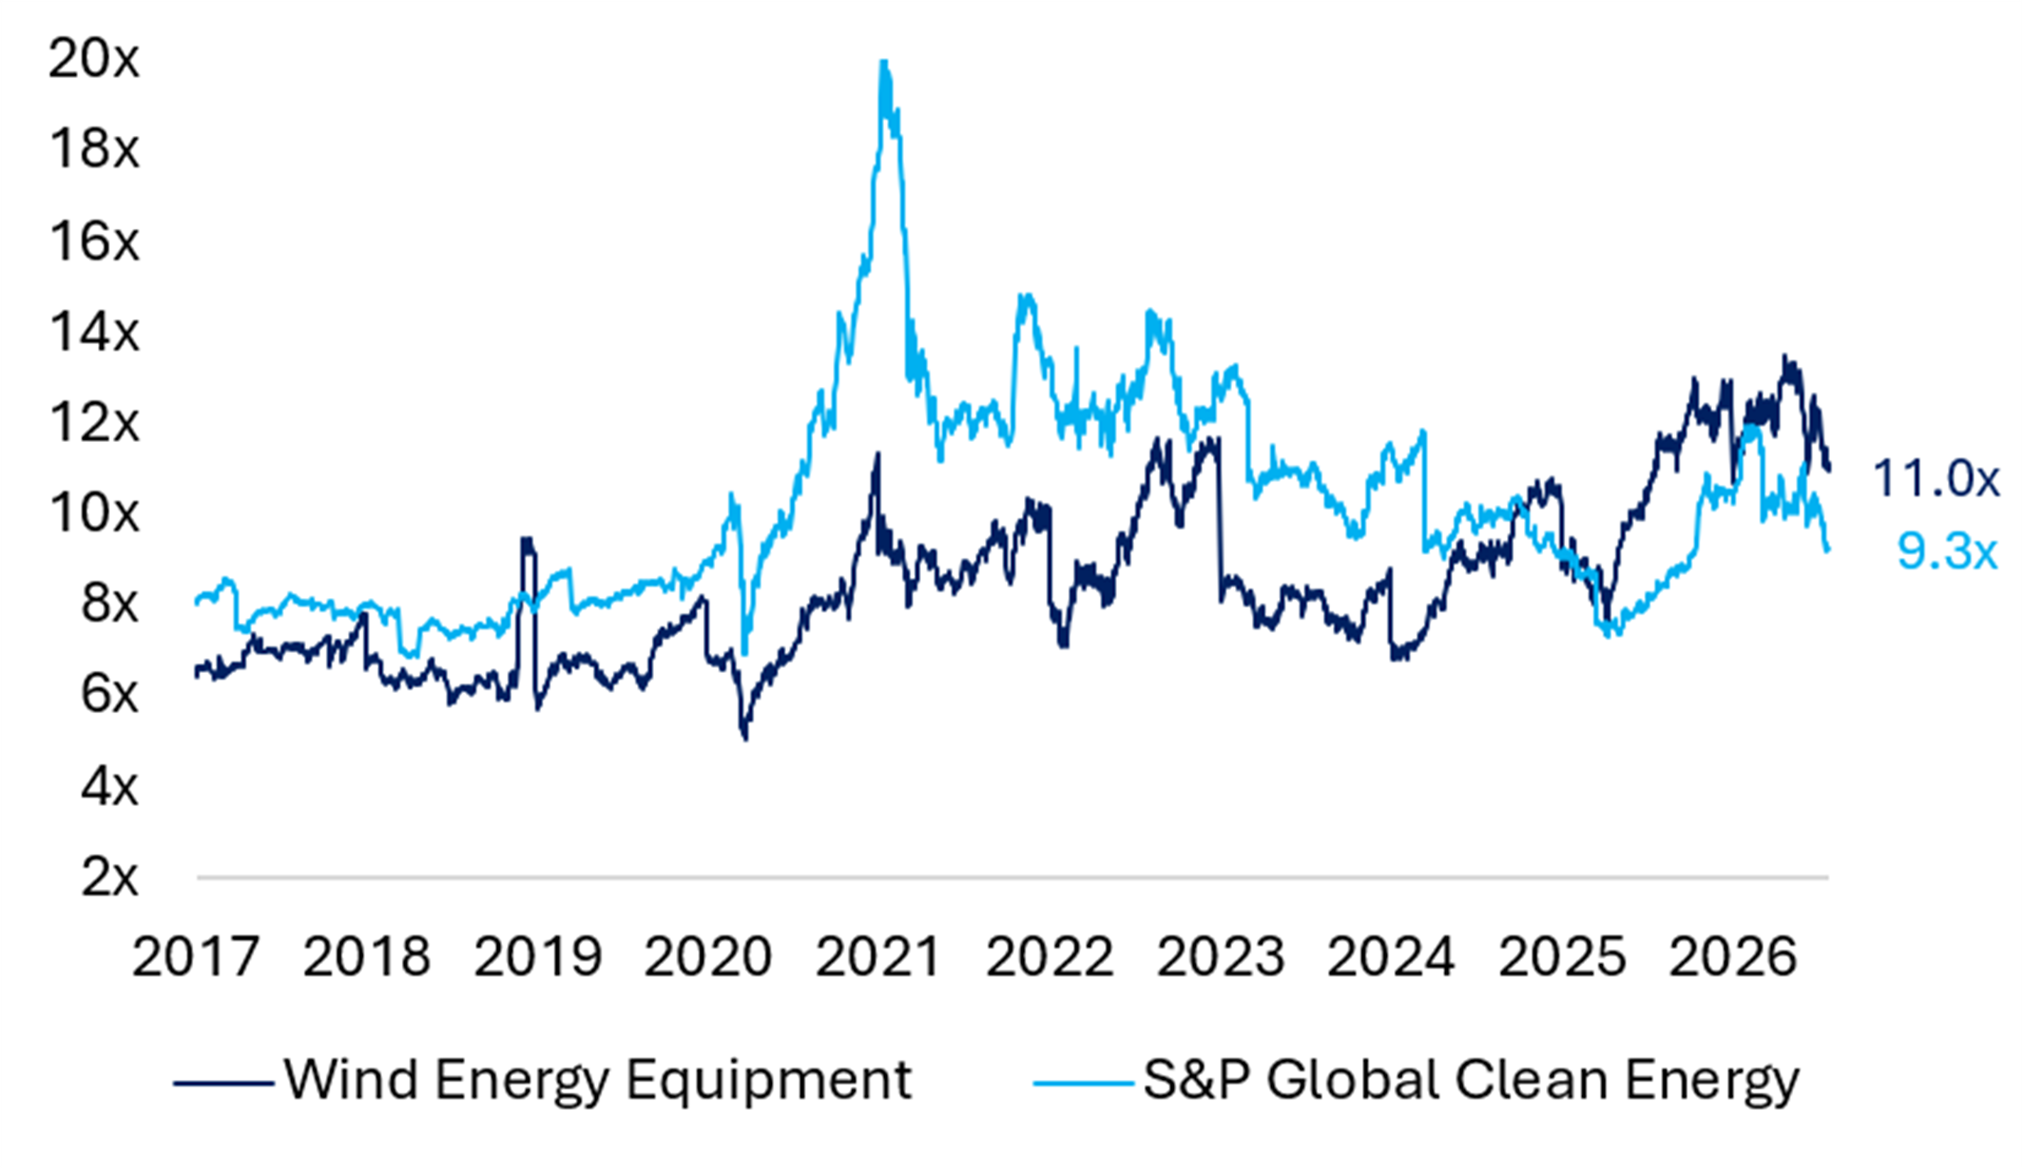
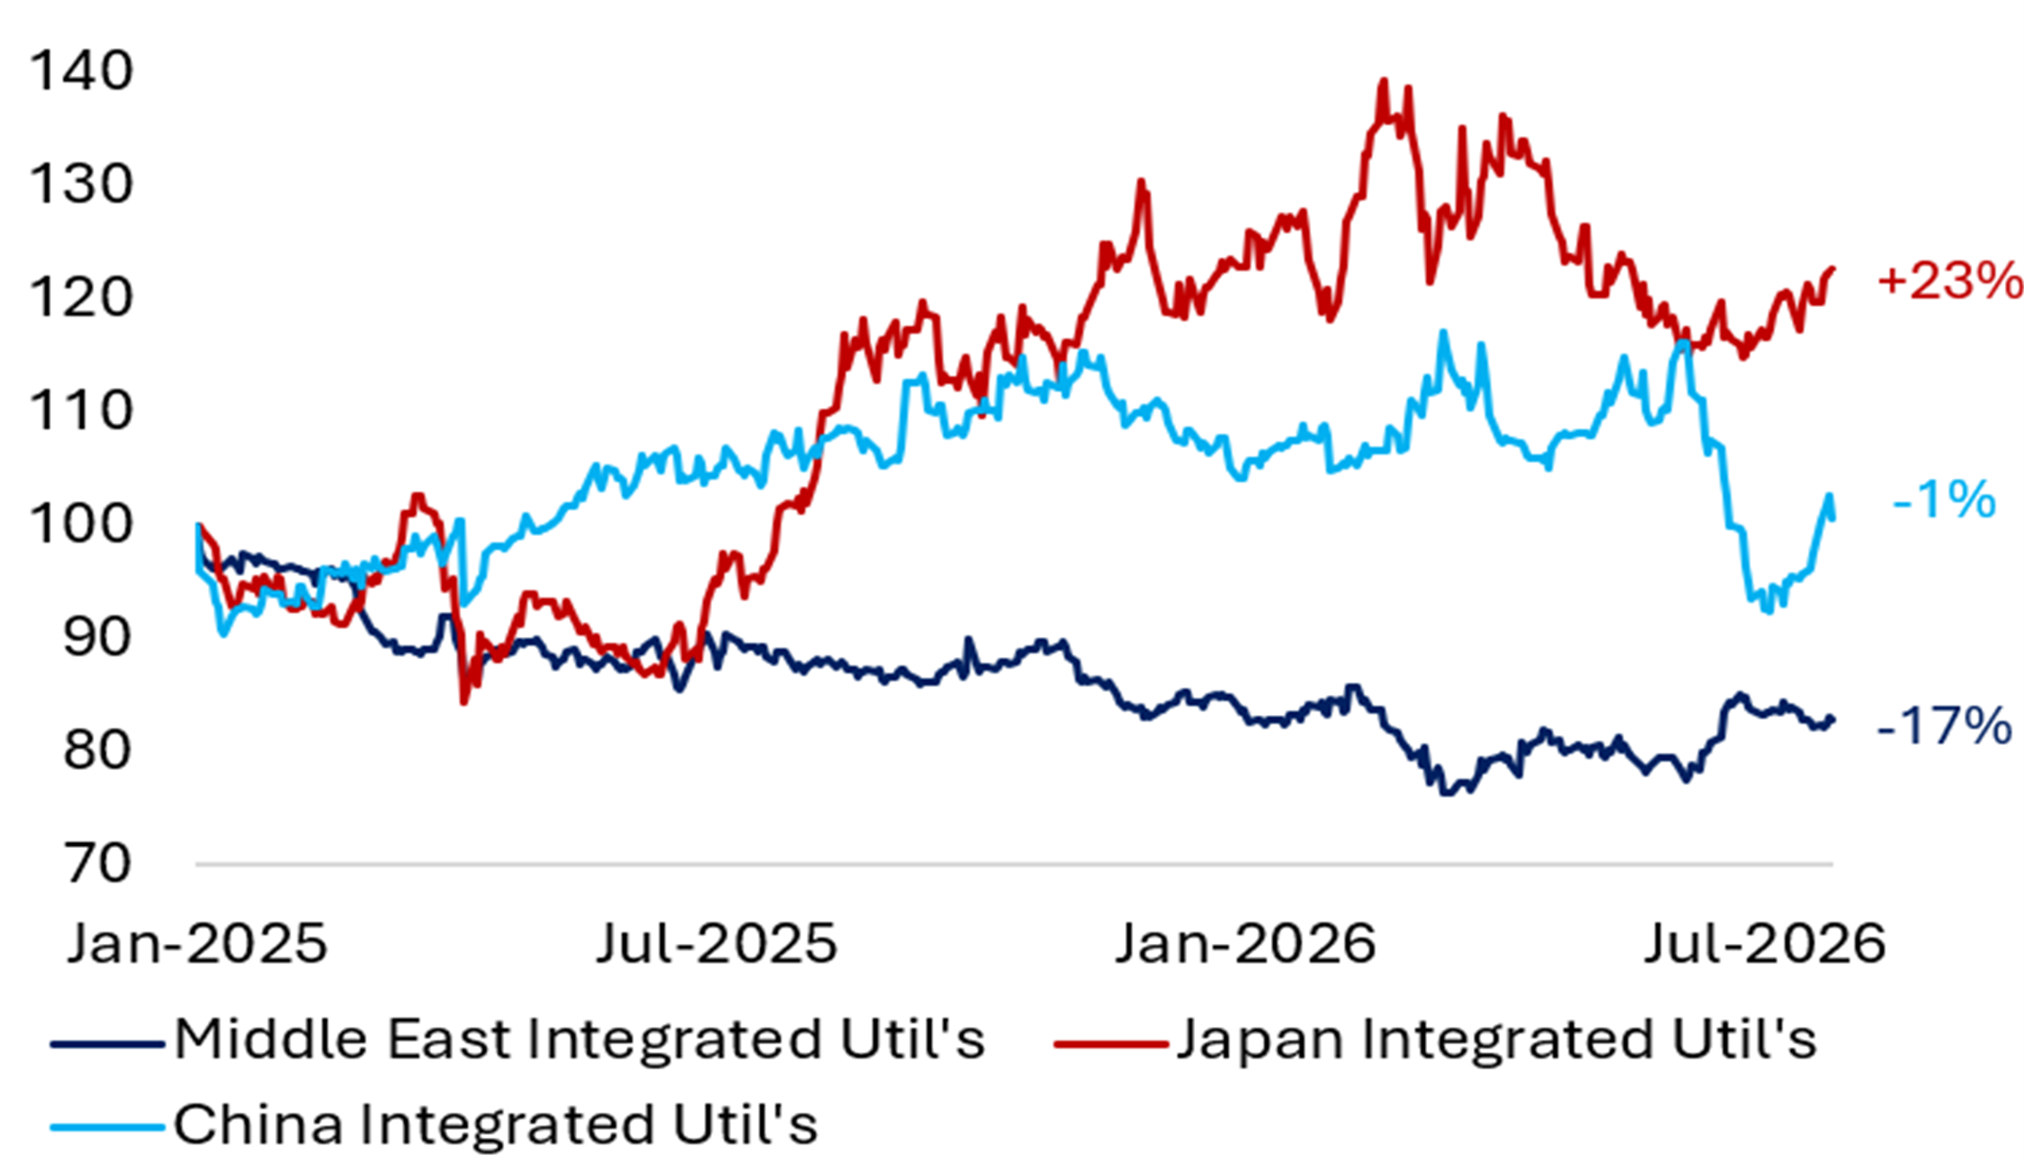
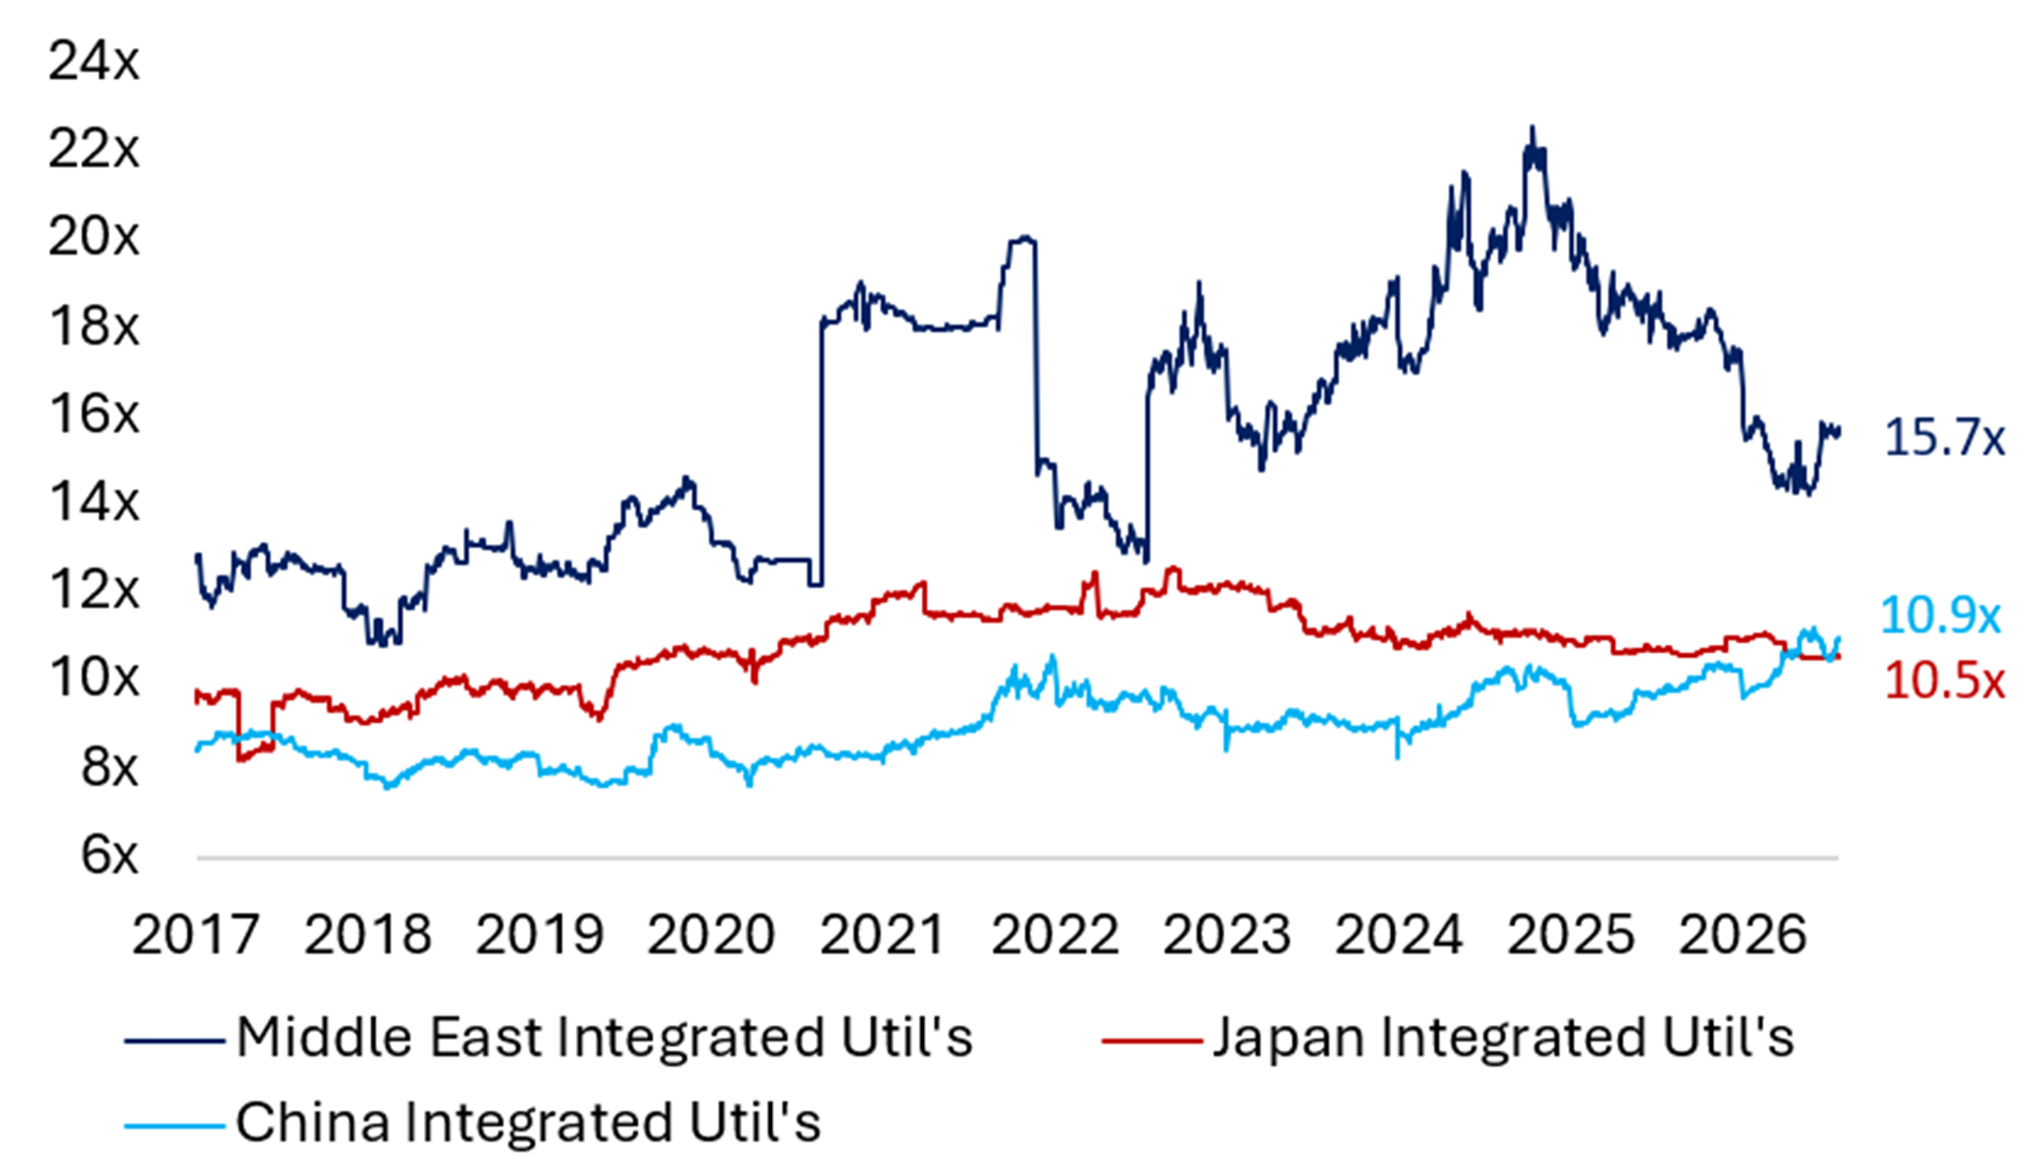

Source: Bloomberg (Prices as of 24 July 2026) Source: Bloomberg (Valuations as of 24 July 2026)
Monthly Focus: Rebound in power prices leaves more upside for European Utilities
European gas and power price rise again on renewed Strait of Hormuz closure
When the Strait of Hormuz closed for the first time following the outbreak of the Iran war in March, the loss of Middle Eastern LNG supply hit Asian buyers hardest. They turned aggressively to spot markets, pulling cargoes away from Europe and pushing LNG prices above $20/MMBtu – the highest level since 2023. European gas prices also jumped, reaching €60/MWh in response to rising LNG costs, while the price spread between Asian LNG (JKM) and European gas (TTF) widened rapidly to almost $4/MMBtu. That premium has since narrowed significantly, as a temporary ceasefire allowed the Strait to reopen and more Middle Eastern LNG cargoes reached Asia again.
Now, the renewed closure of the Strait of Hormuz has driven Asian buyers back into spot markets even more aggressively, pushing prices above $20/MMBtu once more – the highest since the war began and since 2023. European gas prices have similarly jumped back to €60/MWh (see Exhibit 3). To refill gas storage before winter, European buyers need to outbid their Asian counterparts for LNG cargoes. That would require European gas prices to rise even higher to eliminate the current ~$1.2/MMBtu discount to LNG. Yet this adjustment is not happening quickly enough: European gas storage remains at just 54%, very close to crisis-year 2021 levels and at the bottom of the five-year range (see Exhibit 9 on page 10). By comparison, in mid-July 2022, storage had already reached 66% as Europe aggressively purchased spot LNG to replace Russian pipeline gas. As a result, Europe will most likely enter the next heating season with historically depleted reserves, keeping upward pressure on gas prices.
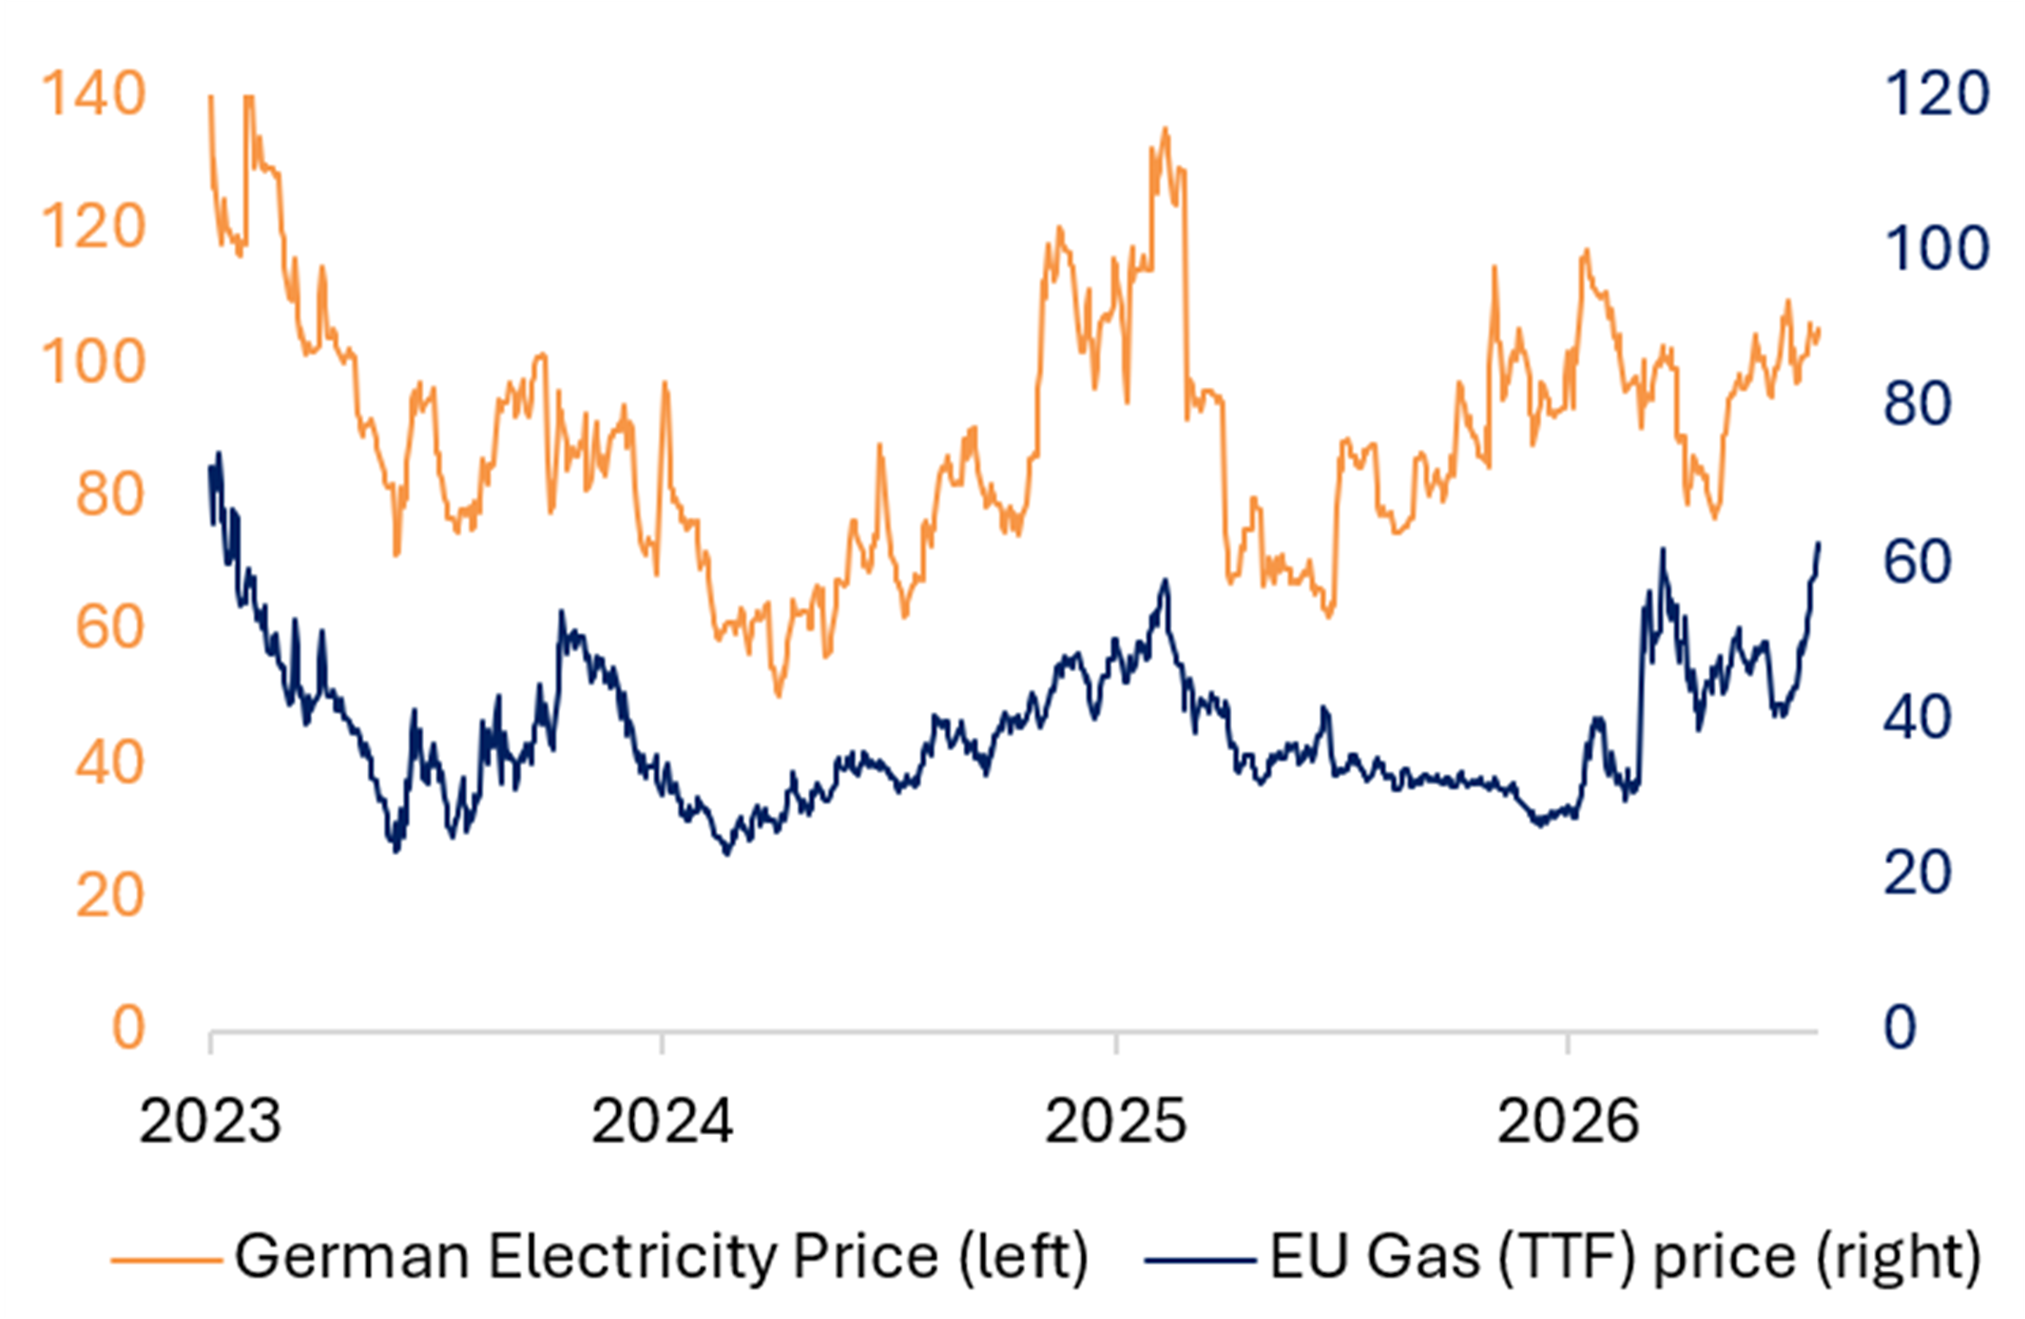
Meanwhile, electricity production across most of Europe remains highly dependent on gas-fired power generation, since gas plants with the highest variable generation costs serve as the marginal electricity supplier that sets the market-clearing price under the merit order principle. Accordingly, gas prices effectively determine wholesale electricity prices across much of Europe – especially in countries where gas still accounts for a large share of electricity supply, such as Germany (16%) and Italy (45%). As a result, German wholesale power prices have also risen in tandem with EU gas prices following the renewed closure of the Strait of Hormuz (see Exhibit 4).
Exhibit 3 Asian LNG vs. EU Gas prices Exhibit 4 EU Gas vs. German Electricity prices 

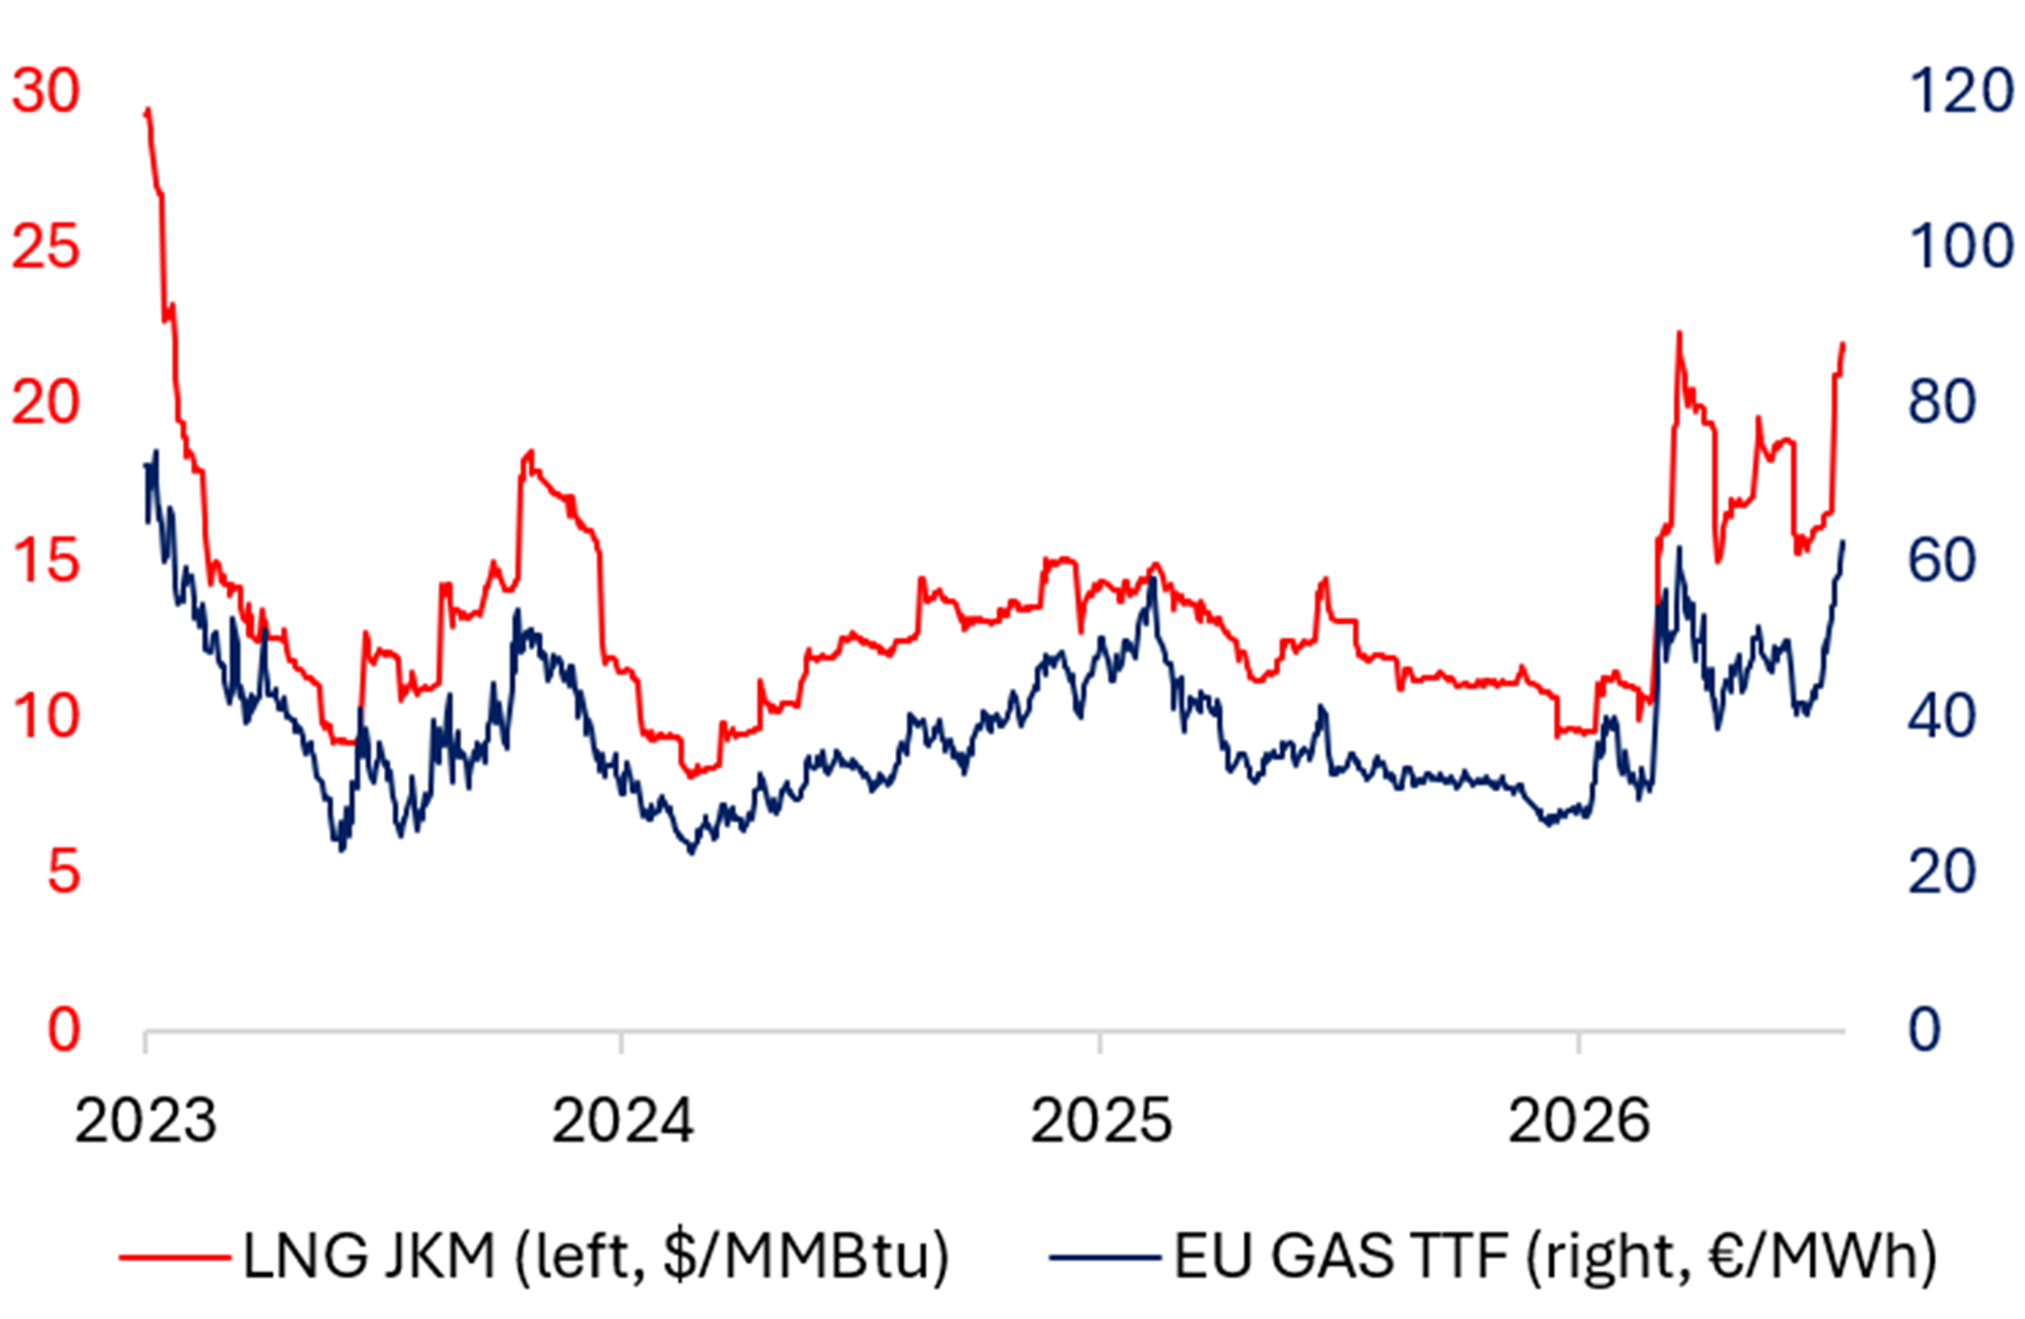
Source: Bloomberg Source: Bloomberg
After the collapse of ceasefire negotiations, uncertainty has grown sharply over whether – and when – a full reopening of the Strait of Hormuz may be achieved. It is now widely expected that, at best, a moderate ramp-up of Qatari LNG volumes will keep global LNG markets tight heading into winter. In addition, heatwaves driven by the “super” El Niño could increase Asian (and European) LNG demand just as Middle Eastern supply remains curtailed. The continued reliance of Asian buyers on spot LNG cargoes is therefore likely to keep LNG prices elevated, putting further upward pressure on European gas and power prices through the second half of the year. Recent increases in gas and power price volatility are also expected to persist. A colder-than-normal winter would only exacerbate the gas supply shortage, driving European gas and power prices still higher and amplifying volatility further.
While inflation “angst” drives interest rates (again) …
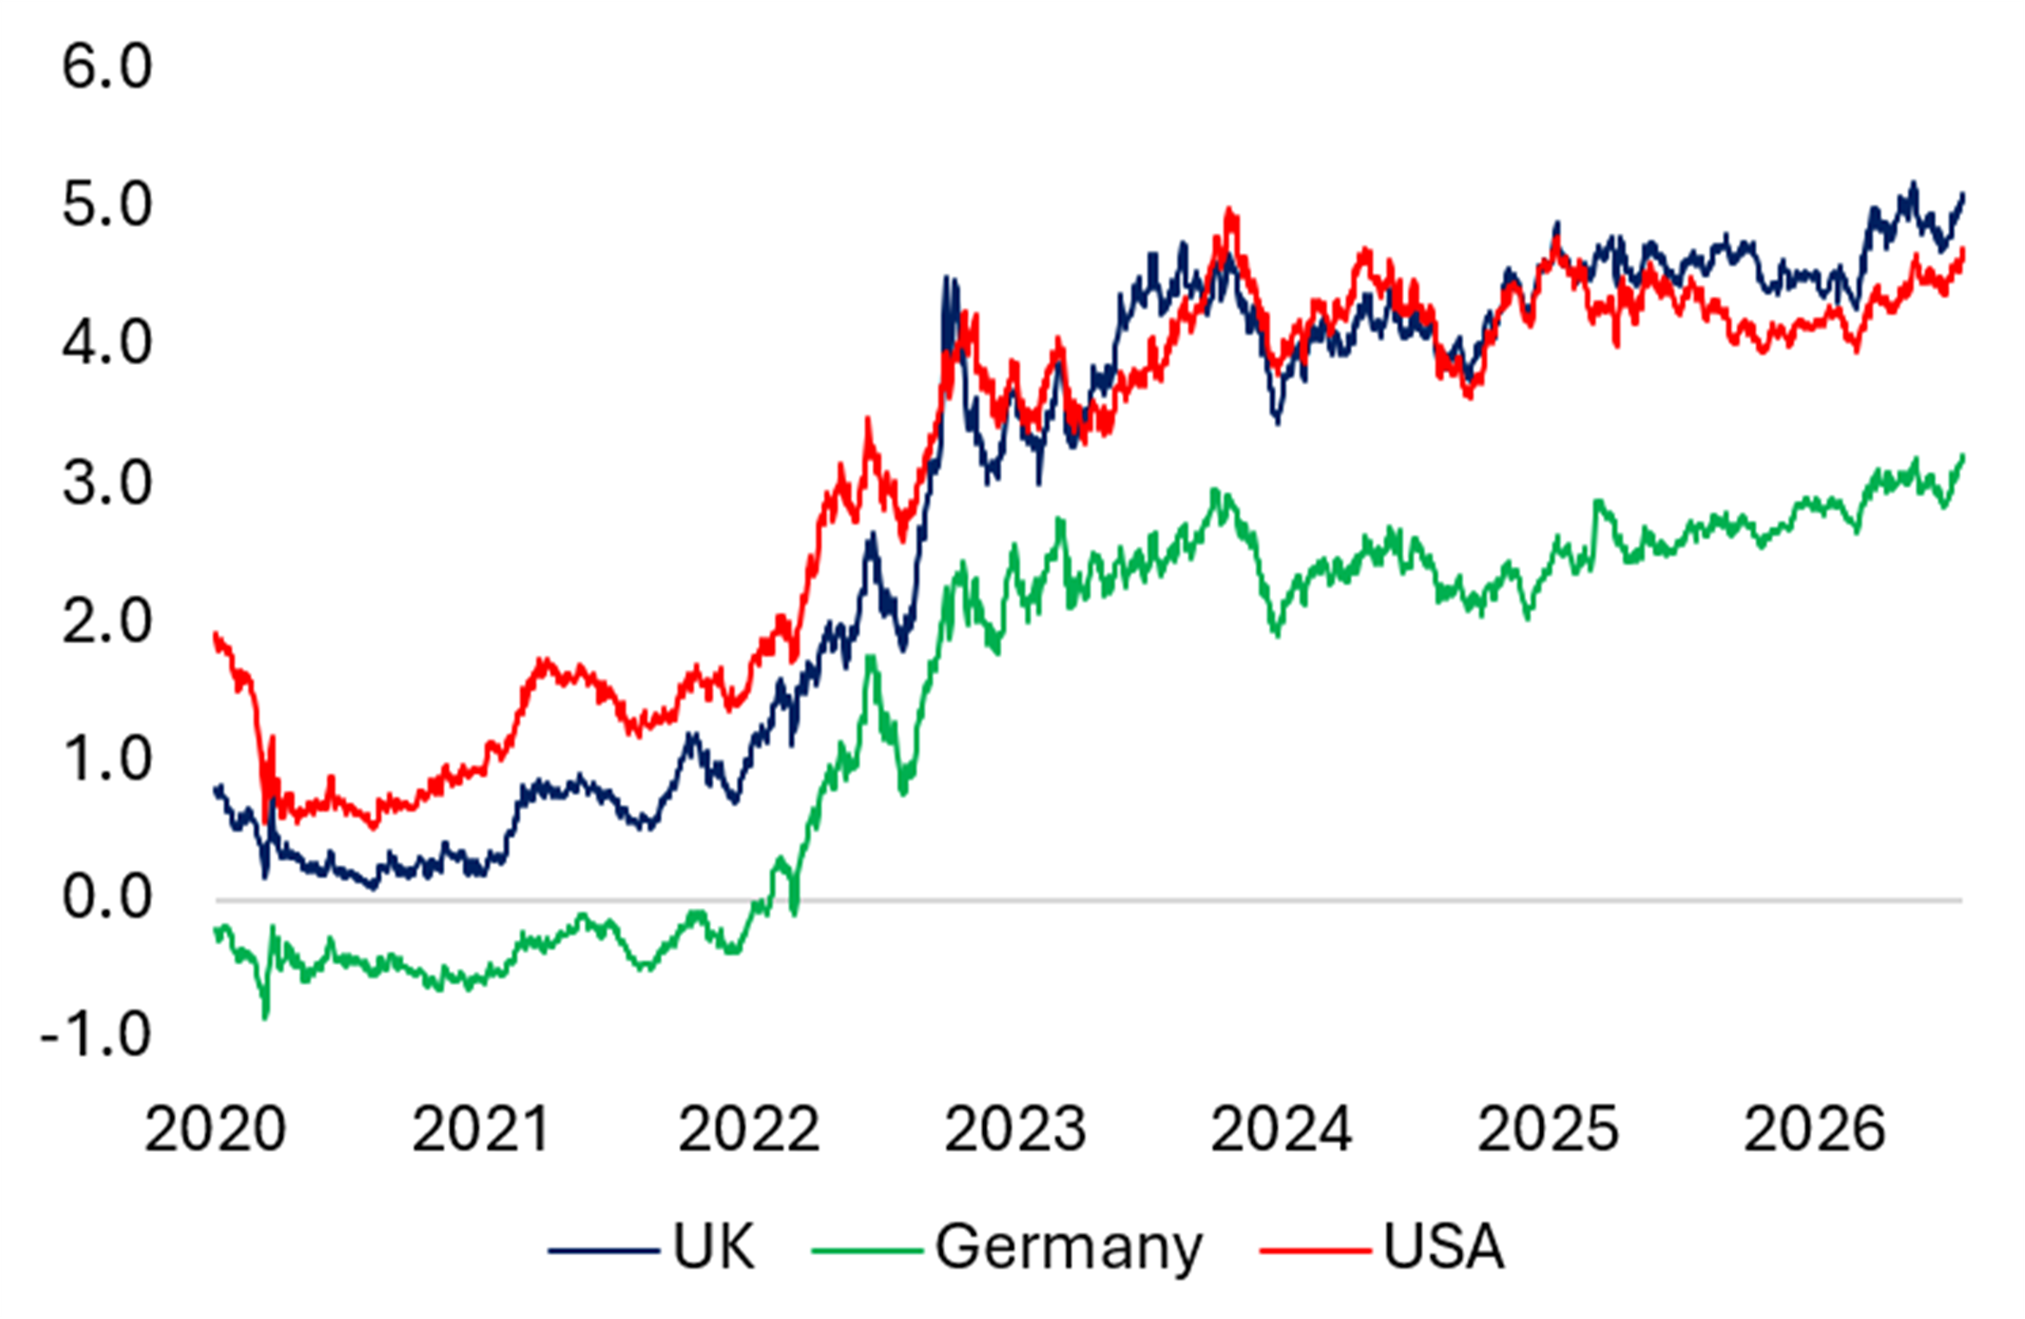
Inflation pressure from rising energy and power prices has lifted interest rate expectations once again, with nominal 10-year bond yields reaching 3% in Germany and 5% in the UK – the highest levels since the start of the Iran war. While these yields have now exceeded the peaks seen in 2022 and 2026, the increase since the war began has been relatively modest in Germany (only about 0.55%) and somewhat more pronounced in the UK, with a 0.76% rise.
By comparison, during the last energy crisis in 2022, nominal 10-year bond yields jumped by more than 2% in both Germany and the UK. Those rate increases not only occurred within a relatively short time frame but also came from very low absolute levels – near zero in the UK and negative in Germany (see Exhibit 5). This “interest rate shock” weighed heavily on European utilities stocks in 2022, when the MSCI Europe Utilities index dropped 24% from January to mid-October.
Rising bond yields are negative for highly leveraged utilities, as higher interest rates increase debt financing costs. European power network companies, for example, have ambitious capex plans to grow their regulated asset bases over the next three to five years, with most of this growth financed through new debt (in addition to the capital raises announced over the past two years). As a result, rising financing costs could weigh on investor sentiment toward otherwise defensive regulated network operators. Similarly, project financing for large renewable energy projects is also heavily dependent on debt. As financing costs increase, returns from renewable projects decline – a dynamic that has historically pressured share prices of renewable power generation companies during periods of rising rates.
… European utilities are now less affected by moderate rate increases
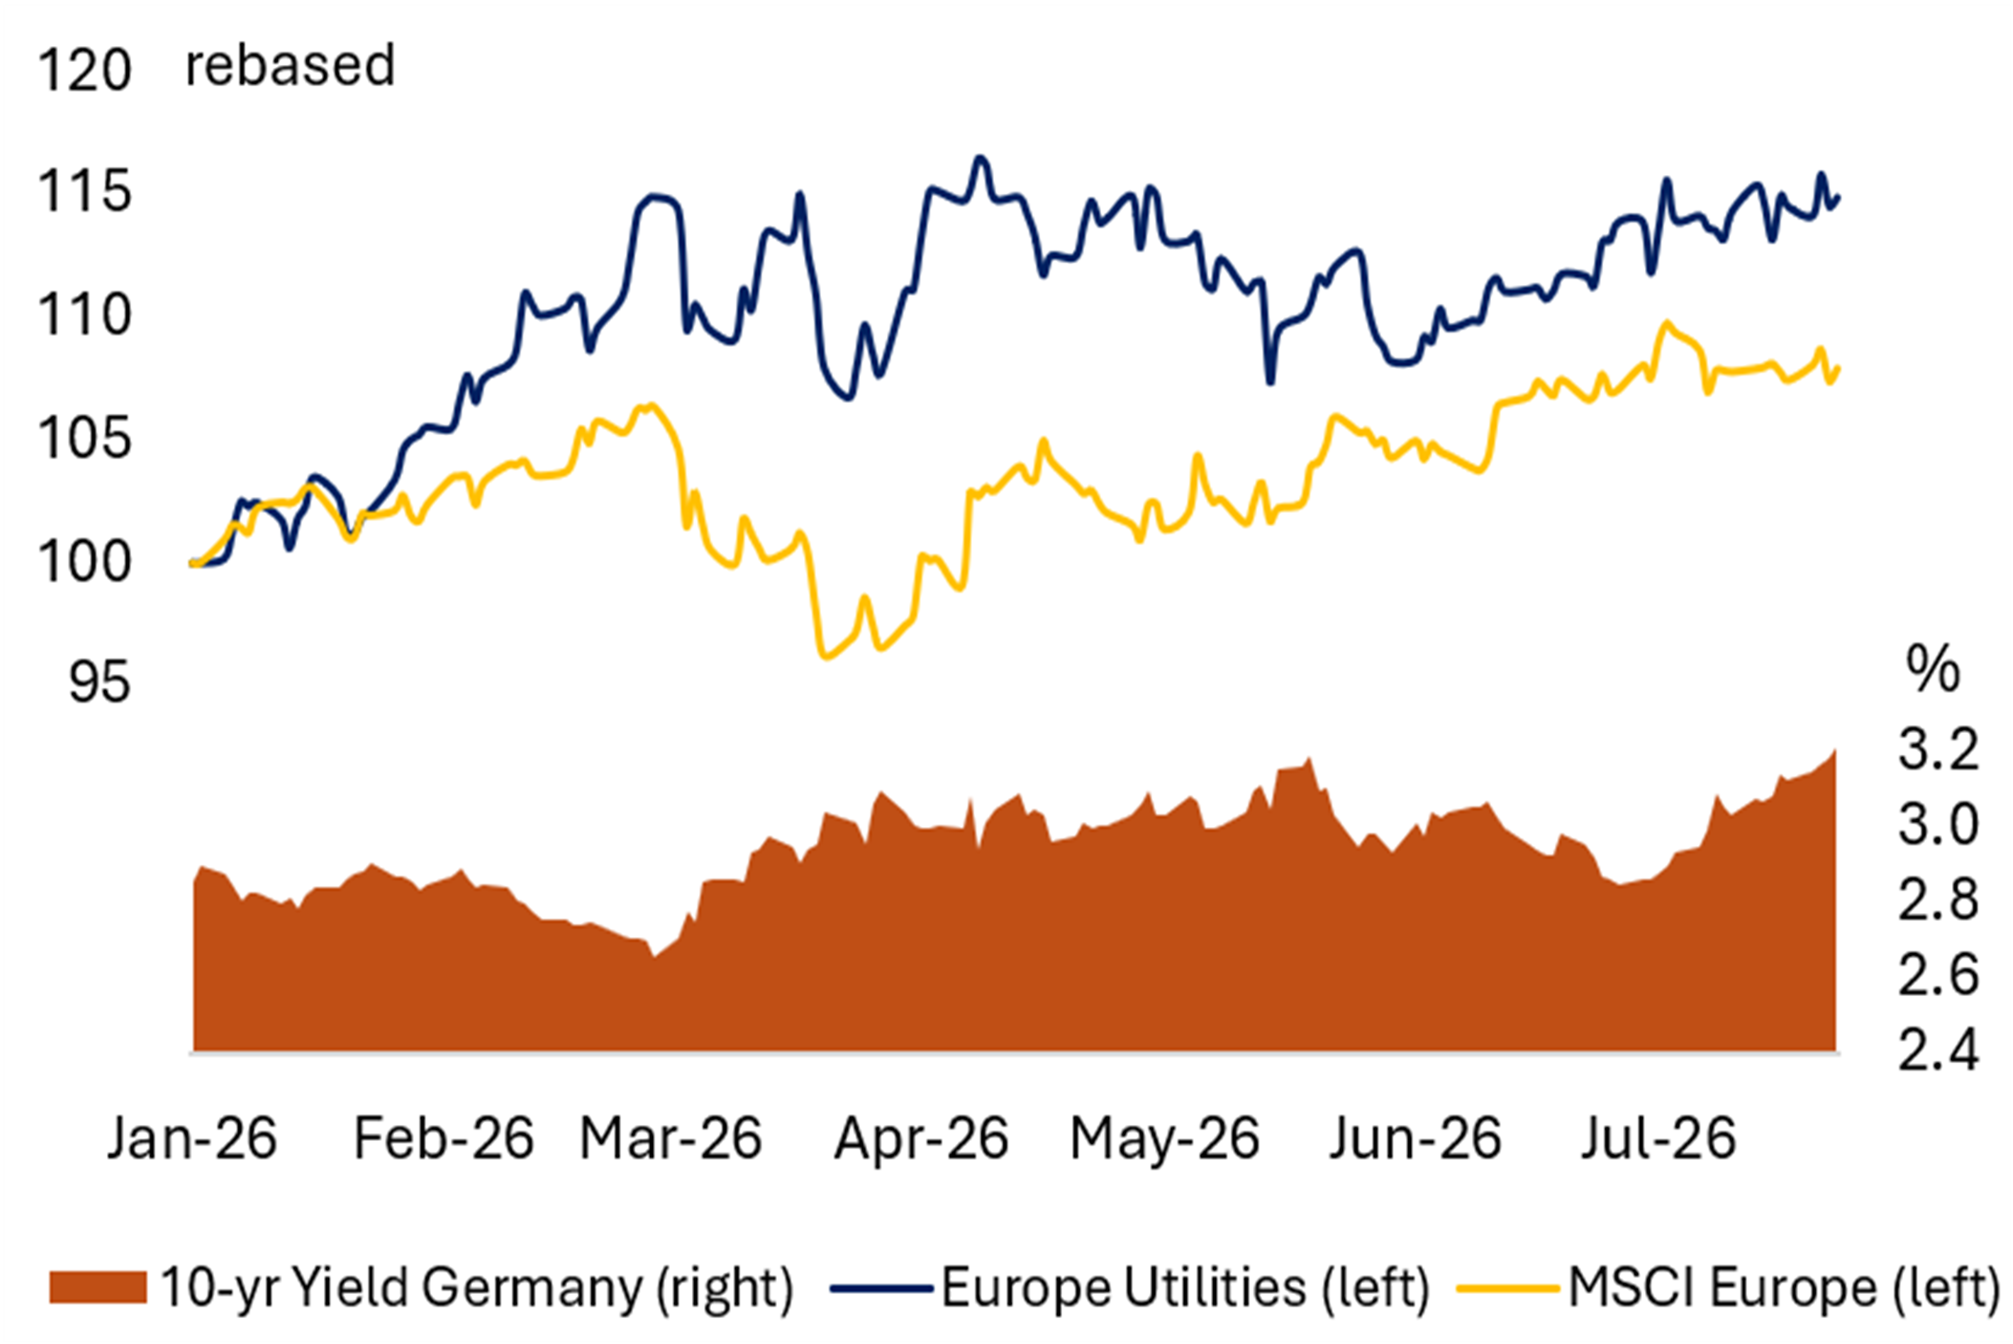
Despite the recent rebound in interest rates in July, following the failed ceasefire and resumption of military conflict, the MSCI Europe Utilities index has continued to recover from its May and June losses and is now approaching its previous highs from April. The index has gained almost 17% year-to-date and has outperformed the broader European market (MSCI Europe) by nearly 7% in 2026 (see Exhibit 6).
Apparently, investor sentiment has shifted, placing greater emphasis on the benefits of rising power prices than on the threat of moderate interest rate increases. European utilities with power generation capacity can either sell merchant power exposure at higher spot prices or lock-in future production at elevated prices in forward markets. Utilities can also raise prices on new long-term Power Purchase Agreements in an environment of rising forward electricity prices.
Accordingly, the power generation subsector should benefit if European gas prices remain elevated for an extended period, lifting forward power prices across European electricity markets. In addition, European electricity prices are likely to become more volatile as gas price fluctuations widen. Companies with large commodity trading operations are well positioned to benefit from this gas and power price volatility. Similarly, companies with electricity storage capacity — whether Battery Energy Storage Systems (BESS) or pumped hydro — stand to gain from wide intraday power price swings.
Exhibit 5 10-yr Government Bond Yields Exhibit 6 EU Equities vs. 10-yr German Yield 

Source: Bloomberg Source: Bloomberg
Private Market Value (PMV) Watch – Deals, Deals and more Power Sector Deals
ELECTRICITY RETAIL
Fortum buys Nordic electricity retailer (29 June 2026): Fortum has launched a cash tender offer of NOK 47 per share to acquire Elmera, a Nordic electricity retailer serving around 1 million customers across Norway, Sweden and Finland. The offer represents a 50% premium to the 60-day moving average and values the transaction at NOK 5.1 billion, implying EV/EBITDA multiples of 8.8x for 2026 and 8.1x for 2027 on a standalone basis. Our take: Given that electricity retail is typically a high-volume, low-margin business with significant customer churn, this multiple appears elevated – providing a positive read-through for the 3.5x EV/EBITDA we currently apply to E.ON’s Energy Retail, Engie’s Supply & Energy Management, and Iberdrola’s Electricity & Gas Supplies divisions.
WIND & SOLAR Assets
EDP announces asset rotation in Italy (1 July 2026): EDP’s subsidiary EDPR has agreed to sell its 68 MWac Italian wind and solar portfolio to PLT Energia for an estimated €150 million. The portfolio comprises four onshore wind projects (60 MW) with 20-year Contracts for Difference (CfDs) and an average remaining asset life of 11 years, plus one 8 MW solar project with less than a year of remaining 10-year Power Purchase Agreement (PPA) life. Our take: The deal implies an EV/MW multiple of €2.2 million and we estimate an EV/EBITDA of 17.4x based on EDPR’s 2025 European Wind & Solar segment EBITDA – both relatively high, reflecting the value of the long-term contracted revenue streams.
Acciona Energy sells wind portfolio in Spain (8 July 2026): Acciona has sold a portfolio of onshore wind assets to Nadara, a renewable energy platform controlled by JPMorgan Asset Management. The project, known as Project Sirocco, comprises operating wind farms in Spain with a total capacity of 361 MW. Nadara paid an EV of €430 million in this private market transaction, which implies a EV/MW deal multiple of €1.2 million for a portfolio of relatively older wind assets, which sells the generated electricity into the wholesale market. Our take: Acciona captured a lower deal multiple for an older asset portfolio without fixed long-term revenues when compared to the EV/MW deal multiples that EDP (€2.2 million, see above) and Enel (€1.6 million) had recently received for its onshore wind assets in Italy and in Germany, which benefited from long-term revenue streams (based on CfDs and feed-in-tariffs).
Shell sells wind and solar business in India (13 July 2026): Shell is selling Sprng Energy, its Indian wind and solar business, to Aditya Birla Renewables for $1.8 billion as part of its ongoing retreat from renewables. Sprng owns 3.3 GW of operating capacity and 1.7 GW under development. The deal implies an EV/MW multiple of $0.55 million or €0.48 million. Our take: While the deal multiple is higher than Enel’s €0.34 million sale in March 2026, it is still reflective of the lower valuations Indian renewables typically command due to sub-optimal project returns. Shell, a motivated seller, sought to exceed its 2022 purchase price of $1.55 billion; competing bidders (KKR, Actis, Temasek) declined to go higher, reinforcing the pattern of compressed multiples for Indian wind and solar assets.
ELECTRICITY NETWORKS
Iberdrola buys stake in Finnish power grid (21 July 2026): Iberdrola acquired an 80% indirect stake in Caruna, Finland’s main electricity Distribution Network Operator (DNO) for an equity consideration of €2 billion, which implies an EV of €5.0 billion including net debt of €2.47 billion for the whole company. Based on Caruna’s EBITDA of €344 million for 2025 and €369 million projected for 2027 along with a projected 2027 Regulated Asset Base (RAB) of €2.54 billion (forecast to increase to €3 billion by 2031), this private market transaction implies EV/EBITDA multiples of 14.5x for 2025 and 13.5x for 2027 as well as a 2027 EV/RAB multiple of 1.97x. Our take: The valuation looks demanding for a DNO, which usually carries lower deal multiples of around 10-12x EV/EBITDA. The valuation premium can be explained with Finland being considered as one of the most attractive data centre markets in Europe with the highest data centre-led power demand growth (2025-30 CAGR of 5-10%, well above European average of about 2%). Furthermore, the WACC in Finland appears to be lower and the achieved ROE tends to be higher reaching double-digit territory.
Power Points
EUROPE
EU to ban Russian gas imports from 2027
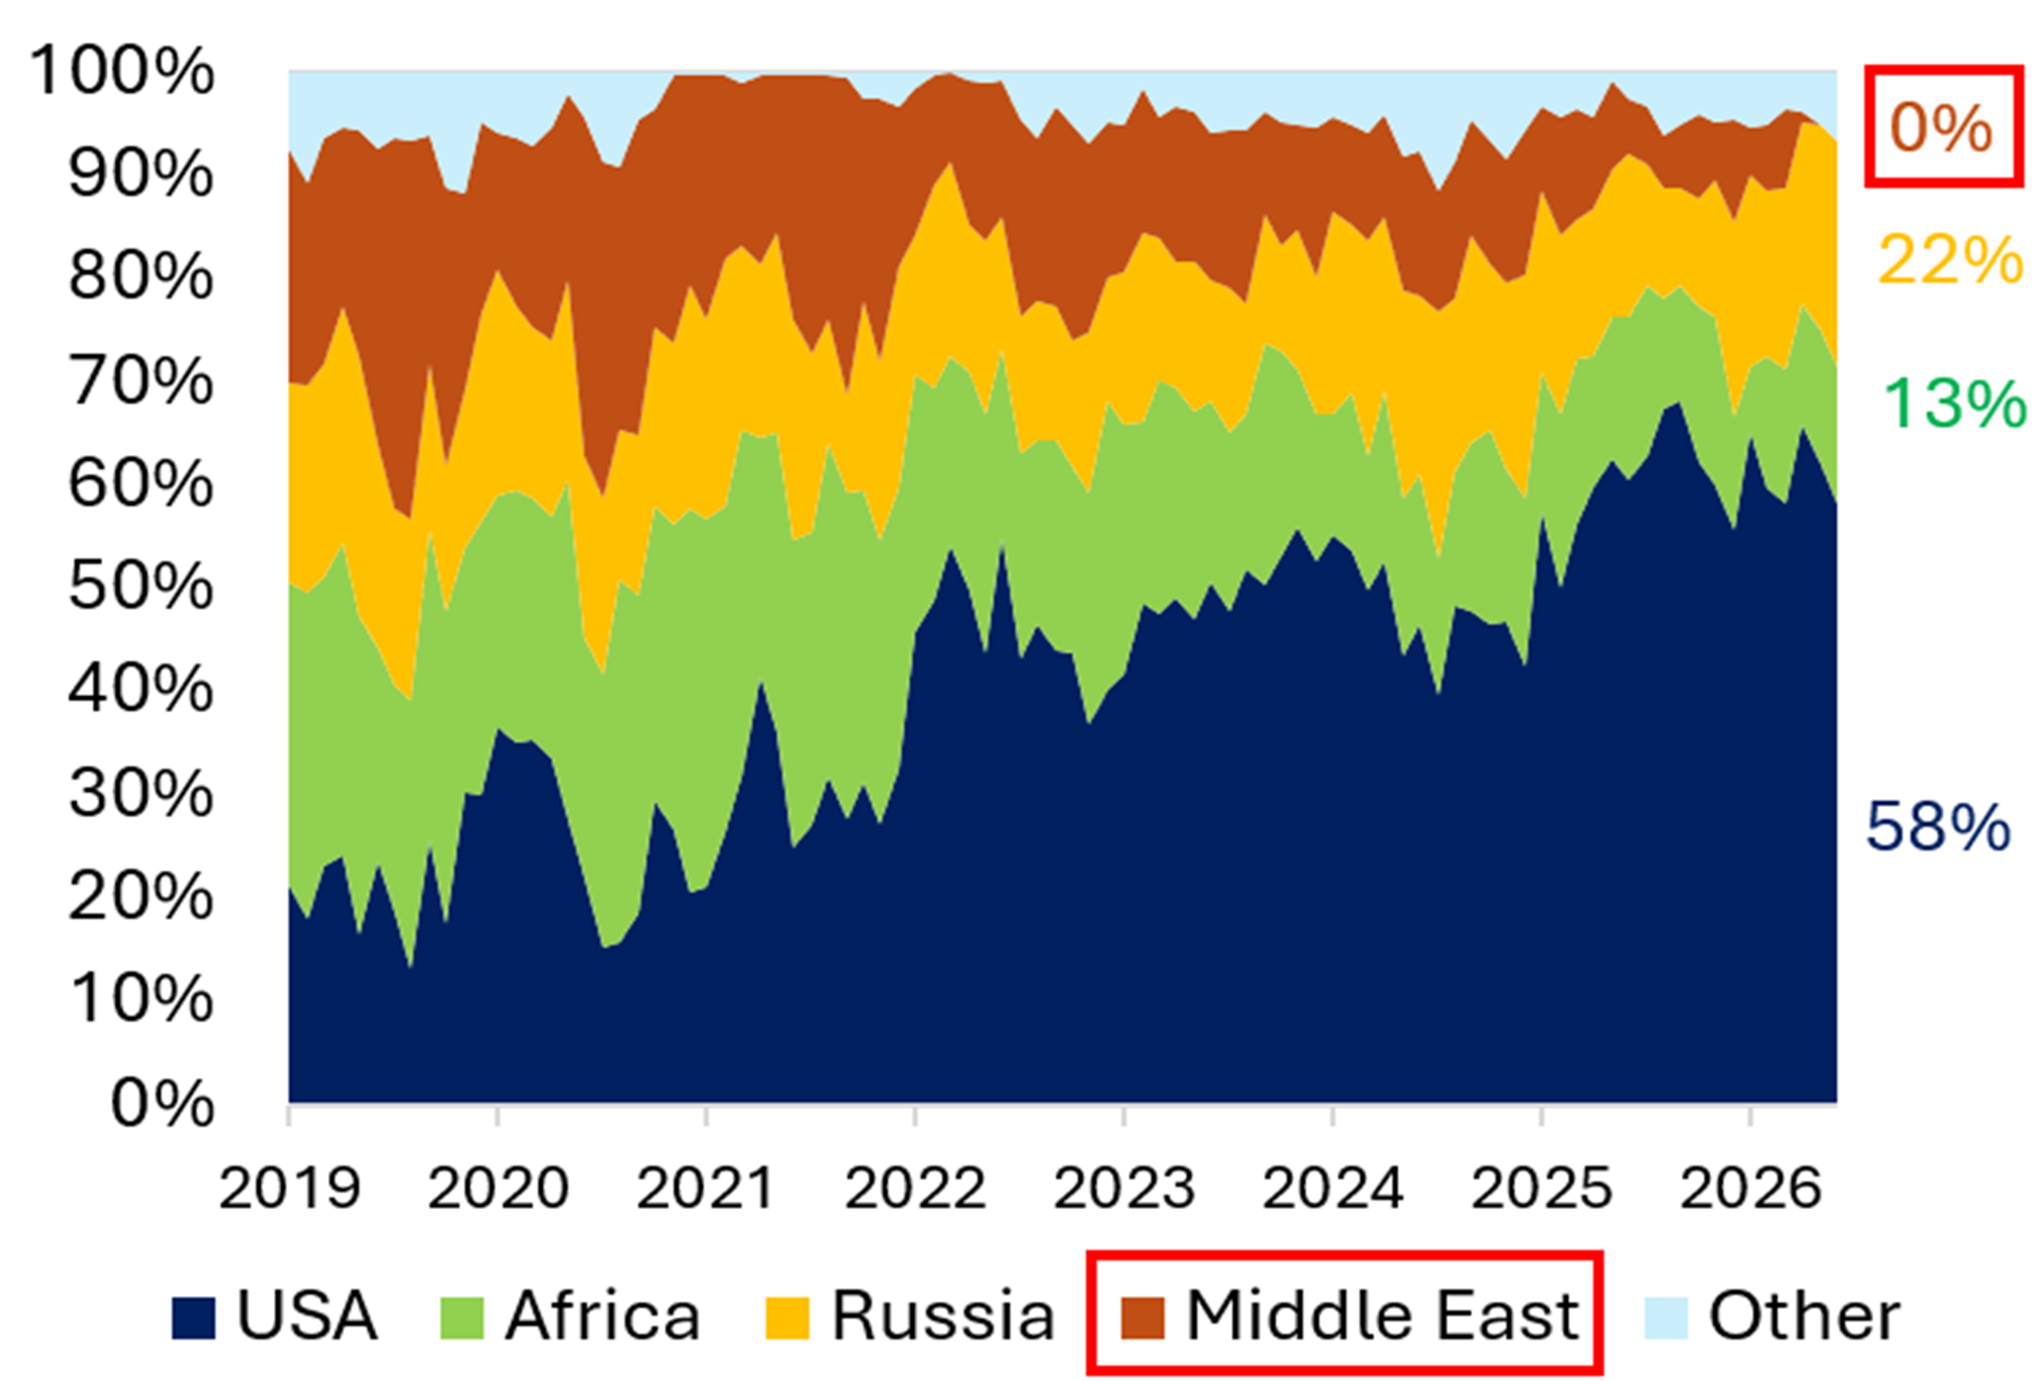
The European Commission is set to ban European operators from purchasing Russian gas effective 1 January 2027. Under the new rules, EU companies will be prohibited from circumventing these restrictions by diverting cargoes outside the bloc – leaving contract termination as the most likely outcome. Naturgy has reported €10.945 billion in outstanding Russian gas purchase commitments. The sanctions will also block the re-export of Russian gas to third countries, forcing operators to invoke force majeure on their contracts. The Commission has acknowledged this could lead to international arbitration. LNG contracts are due to expire on 31 December 2026, while pipeline gas agreements run until 30 September 2027, with a possible extension to 1 November 2027. Spain is a major entry point for authorized Russian LNG, with long-term contracts totaling 5,000–8,000 mcm annually. As of 2Q 2026, Russian gas still accounted for approximately 22% of total EU gas imports (see Exhibit 12 on page 10).
Strong data center surge in Iberia
Spain and Portugal are seeing explosive growth in data centre development, with 10.5GW of announced projects – roughly 18 times the current capacity – representing a potential €100 billion investment across the Iberian Peninsula. Against just 567 MW installed today (led by Madrid at 310 MW and Zaragoza at 90 MW), only 4.5GW is under construction or in planning, while the rest remains stalled by grid capacity constraints and connection delays, leaving 57% of projects with uncertain timelines. Spain’s appeal rests on cheap renewable energy, solid macroeconomic fundamentals, submarine cable connectivity, and strong foreign investment interest, drawing hyperscalers such as AWS, Microsoft, Google, and Meta alongside local players such as Merlin Properties, which plans €7.84 billion in investment through 2032. Grid access regulation remains the key bottleneck, though a recent government decree may improve capacity allocation to viable projects.
Life extensions of Spain’s nuclear fleet look more likely
Spain’s nuclear safety council has ruled that the Almaraz plant in Extremadura is safe to run until 2030, a non-binding but influential finding that strengthens operator Iberdrola’s push – alongside partners Endesa and Naturgy to keep the facility open beyond its currently scheduled closure in the next two years. The report now goes to the environment ministry for a final decision, expected within weeks, which is widely anticipated to confirm the extension. The outcome carries weight beyond Almaraz alone: it could reshape Spain’s broader plan to shut all seven reactors (about 20% of Spain’s power generation) by 2035, as rising demand and energy-security concerns fuel opposition to the phaseout. This comes as Spain’s approach diverges from a wider nuclear resurgence in Europe, with France and the UK expanding their programs and Italy weighing a return to the technology.
EU emission trading revenues to finance industrial decarbonization
The European Commission is proposing to require EU member states to spend a larger share of their roughly €24 billion in annual carbon emissions trading revenues on helping polluting industries decarbonize, rather than letting it flow into general budgets or unrelated projects. Currently less than 5% of these funds go toward emissions-cutting investments for emitting industries, even though the scheme was meant since 2023 to support climate action; instead, countries like Austria have used the money for infrastructure like rail tunnels, France for housing efficiency and general spending, and others like Germany and the Netherlands do not disclose the usage at all. The reform aims to align the emission trading scheme with the EU’s 2040 emissions target and address industry complaints about competitiveness costs, but diplomats warn it could anger finance ministries that rely on this revenue for other budget priorities and would resist reallocating funds they have grown accustomed to.
National Grid: Investment in US power generation
National Grid Ventures (NGV) is investing $1.75 billion for a 35% stake in Joulent, a platform developing contracted power generation and high-voltage infrastructure for large US energy consumers. The investment will fund Joulent’s flagship Project Kilby, a 50/50 partnership with Chevron, with a multi-GW pipeline offering additional growth potential. This move gives National Grid exposure to rising US power demand driven by data centers and AI, particularly in Texas. Joulent’s flexibility to deliver both behind-the-meter and front-of-the-meter solutions positions the company well to serve major data center operators. Returns are expected to exceed the 9–10% ROE of regulated networks, reflecting modestly higher risk, while Project Kilby’s Power Purchase Agreement-based revenue structure and gas cost pass-through should limit its exposure to merchant power and gas price volatility.
Engie: Adds onshore wind capacity in France
Engie secured 259 MW of onshore wind capacity in the French government’s latest tender, with 209 MW coming from repowering of existing projects. The government awarded a total of 808 MW of onshore wind in its PPE2 round 11 tender, results for which were announced this month, at an average price of €77.08/MWh – down from €86.62/MWh in the previous round. Repowering projects accounted for 66% of the capacity awarded, up sharply from 22% in the prior tender. The regulator has recommended tightening rules for repowering projects in future rounds to limit costs to the government.
Fortum: 1H 2026 results below expectations
Fortum reported 1H 2026 results, which missed consensus expectations due to lower power prices. Fortum reported a comparable EBITDA of €785 million (HY25: €729 million) versus company consensus of €800.5 million and comparable operating profit of €627 million (HY25: €577 million) versus consensus of €643 million. At the bottom line, comparable EPS stood at €0.53 (HY25: €0.51), versus consensus at €0.56. ND/EBITDA reported at 1.4x at the end of Q2. The earnings miss versus consensus was partially driven by an achieved power price of €44.9/MWh in 2Q 2026 below consensus expectations of €48.2/MWh.
Iberdrola: 1H 2026 – Beat without a raise
1H 2026 results beat expectations: Adjusted EBITDA of €8.05 billion was up 7% YoY and 2% above consensus (€7.92 billion), driven by a 13% EBITDA jump in the “Networks” segment due to RAB (regulated asset base) growth in all countries, while the “Power & Customers” business reported only a marginal 1% EBITDA increase. Adjusted net profit of €3.57 billion was up 8% YoY and beat the consensus (€3.34 billion) by 7%. The full year guidance for FY 2026 adjusted net profit was updated to “comfortably >8% growth” from “at least 8% growth” in April (with 1Q results), while the original guidance was “around 6% growth” in Feb 2026, when FY 2025 results were reported.
GE Vernova: 2Q EBITDA slightly below expectations
2Q 2026 results were mixed, with sales growing 22% YoY to $11.1 billion (vs. consensus of $10.7 billion) and EBITDA jumping 62% YoY to $1.25 billion (vs. consensus of $1.28 billion), which reflected an EBITDA margin increase from 8.5% in 2Q 2025 to 11.3% in 2Q 2026 (but missed consensus of 11.9%). The order intake remained very strong in 2Q in the “Power” segment (+135% YoY to $16.7 billion) and the “Electrification” segment (+93% YoY to $6.3 billion). The guidance range for group revenues was raised by $1 billion to $45.5-46.5 billion, due to tronger sales growth in the Power segment, while the FY 2026 EBITDA margin guidance of 12-14% was confirmed.
UK WATER
Andy Burnham became the UK’s seventh Prime Minister since 2016 after being elected Labour Party leader, taking office on 20 July 2026. A central theme of his policy agenda is greater public control, and there is widespread speculation that placing Thames Water under a Special Administration Regime (SAR) could be among his first moves in the water sector. However, we do not believe this signals imminent nationalisation – Burnham himself has acknowledged the process would be complicated and “probably expensive” for the government. Any intervention is therefore more likely to target financially weaker companies. Notably, the listed UK water utilities remain well-capitalised, which mitigates this risk.
The warm weather in the UK has prompted several companies to introduce hosepipe bans for customers as they seek to conserve water. Thames Water introduced the ban on 23 July following several companies, which had already introduced the ban earlier: South East Water (Kent, Sussex, Surrey, Hampshire and Berkshire), Affinity Water (South East England including parts of London), Anglian Water (East of England and Hartlepool), Cambridge Water (Cambridge), Southern Water (Kent, Sussex, Hampshire and Isle of Wight) and South West Water.
On 9 July, Severn Trent reported an in-line 1Q trading update, reiterating guidance of at least £50 million in ODIs this year, the capex outlook of £2.2-2.5 billion for the year of which the company has already spent £440 million YTD. The company also announced that Ofwat accepted its wastewater undertaking related to the 2021 investigation without financial penalties.
MIDDLE EAST
Adnoc Gas: Ramping up gas production to meet growing demand
Abu Dhabi National Oil Company will invest in a $6.2 billion gas development as part of its push to massively expand its domestic production to meet rising local and global gas demand. Adnoc Gas develops a natural gas layer above its Umm Shaif offshore field, partnering with TotalEnergies, Eni, and CNPC. The project, set to begin operations in 2030, will produce over 600 million cubic feet of gas daily. The move addresses growing global LNG demand while helping the UAE achieve gas self-sufficiency before its Qatar Dolphin pipeline import agreement expires in 2032 (around a third of its gas demand is currently met by pipeline imports from Qatar). Adnoc is also nearly tripling its LNG export capacity with a new Ruwais plant by 2028 and is considering an additional facility in Fujairah, located outside the Strait of Hormuz.
CHINA
China released its 15th Five-Year Plan (2026–2030) Carbon Peaking Action Plan on July 9, largely reaffirming existing policy while balancing decarbonization with energy security and economic growth. Key targets include cutting carbon intensity 17% versus 2025 and raising non-fossil energy to 25% of consumption, keeping China on track to peak carbon before 2030. The plan continues to prioritize solar, wind, nuclear and hydropower expansion, along with ultra-high-voltage transmission, energy storage and smart grids for renewable integration. It also pushes energy efficiency, low-carbon production, retirement of outdated capacity, and circular-economy measures in heavy industries like steel, cement, petrochemicals and non-ferrous metals – alongside carbon market expansion, EV adoption, low-carbon buildings, and green manufacturing and finance. While there are no major surprises, the plan remains broadly supportive for renewables-exposed utilities such as China Longyuan, CLP Holdings, China Resources Power, and its clean-energy spin-off China Resources New Energy, which recently raised $3.6 billion in a Shenzhen IPO.
JAPAN
Electricity demand in Japan declined by 2.9% YoY during the April–June 2026 quarter, according to OCCTO. Monthly trends were -1.9% in April, +1.1% in May, and -7.3% in June, reflecting cooler weather conditions versus last year. Temperatures in July have returned to more normal seasonal levels, although they remain below the unusually high levels seen in July 2025, which may continue to limit weather-driven demand growth on a YoY basis.
Industrial electricity demand remains supported by structural drivers, including investment in AI and cloud data centres, semiconductor facilities, and other advanced manufacturing projects. OCCTO continues to expect medium term industrial demand growth of around +1.7% CAGR, although regional trends may remain uneven due to seasonal factors.
Japanese utilities will begin reporting earnings from late July through early August. Key sector themes include nuclear utilization rates, geopolitical developments affecting fuel procurement, and ongoing inflationary pressures across fuel, logistics, insurance, and labor. Investors are also monitoring discussions regarding potential revisions to transmission and distribution tariff frameworks.
Corporate governance remains an area of focus in the equity market. Shareholder return policies continue to attract attention, highlighted by Elliott Investment Management’s recently reported 2.99% stake in Kansai Electric Power (9503). Many Japanese utilities retain capacity to enhance shareholder returns over time, supported by improving profitability, stronger balance sheets, and gradual progress in ROE and ROA metrics.
European Power Prices and Global Electricity Demand Growth
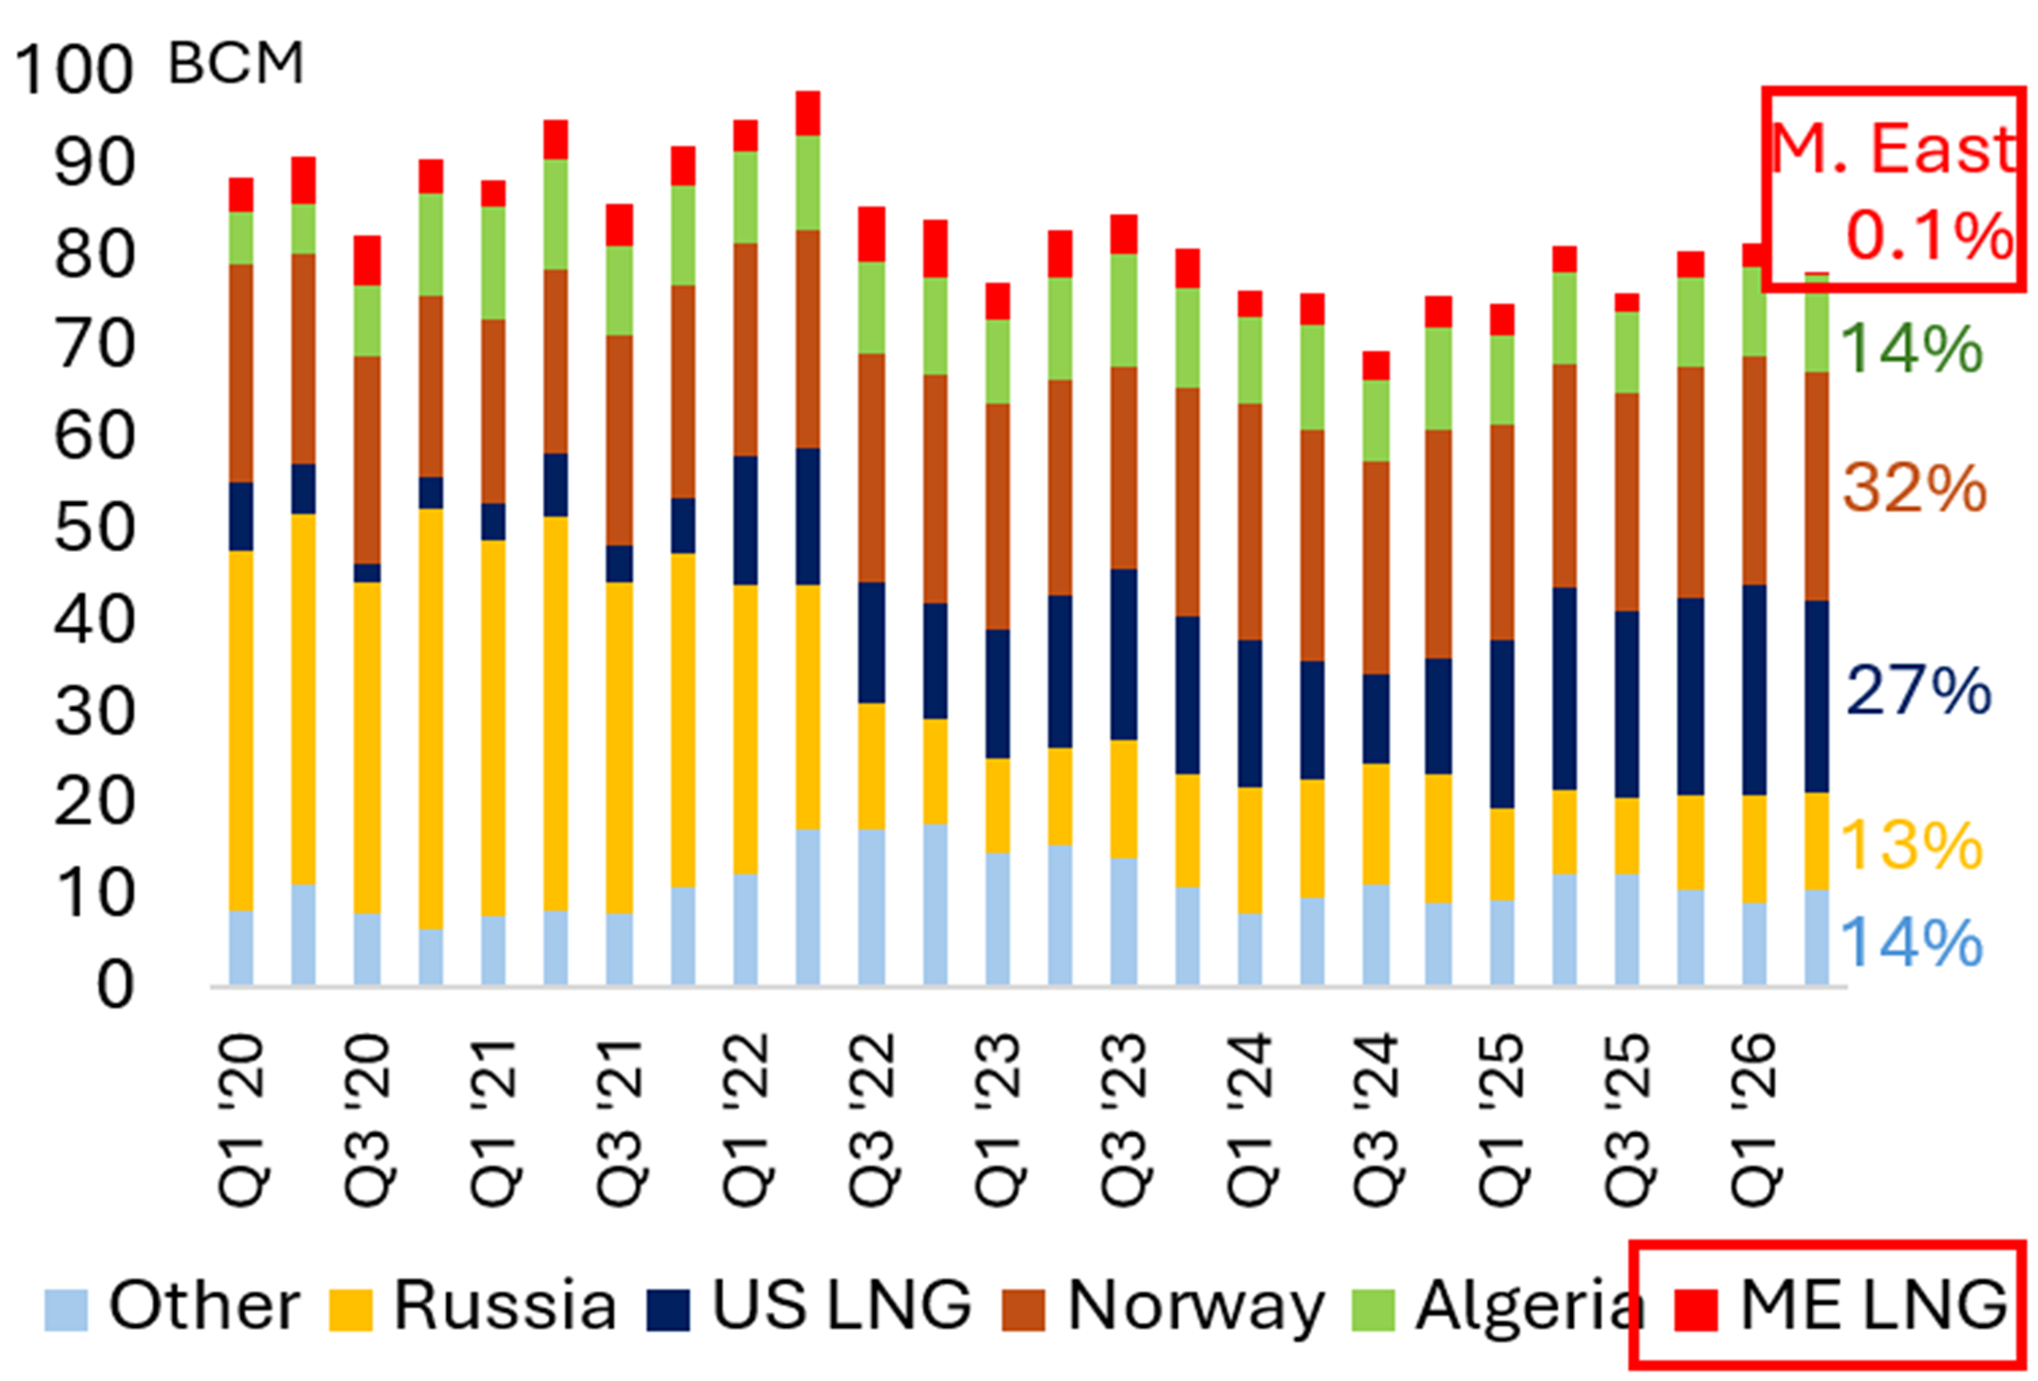
The Iran conflict has pushed Europe into its second energy crisis in four years and has put the focus back on European gas and power prices. Unlike the 2022 crisis, when Russia cut pipeline gas supplies, Europe faces limited volume risk this time: only around 0.1% of total gas imports in the second quarter of 2026 came from the Middle East (see Exhibit 11), with the last LNG cargoes delivered in April before monthly LNG imports from the Middle East stopped entirely in May 2026 (see Exhibit 12). However, Europe will need to replenish depleted gas storage through LNG purchases from the US this summer. EU gas storage was just 55% full in mid-July, the lowest level for that time of year since 2021, just before the 2022 energy crisis started (see Exhibit 9). As European buyers compete with Asian buyers in the spot market to refill storage ahead of next winter, LNG prices – and, by extension, European gas prices – are likely to remain elevated throughout 2026. With average LNG prices already running 29% above last year’s level on a year-to-date basis, European gas prices have moved higher as well. Average EU gas prices are up 21% versus 2025, while average UK gas prices are 13% higher year-to-date than in 2025 (see Table 2).
Table 2 Megawatts & Molecules: Average Annual Electricity, Carbon, Coal and Gas Prices

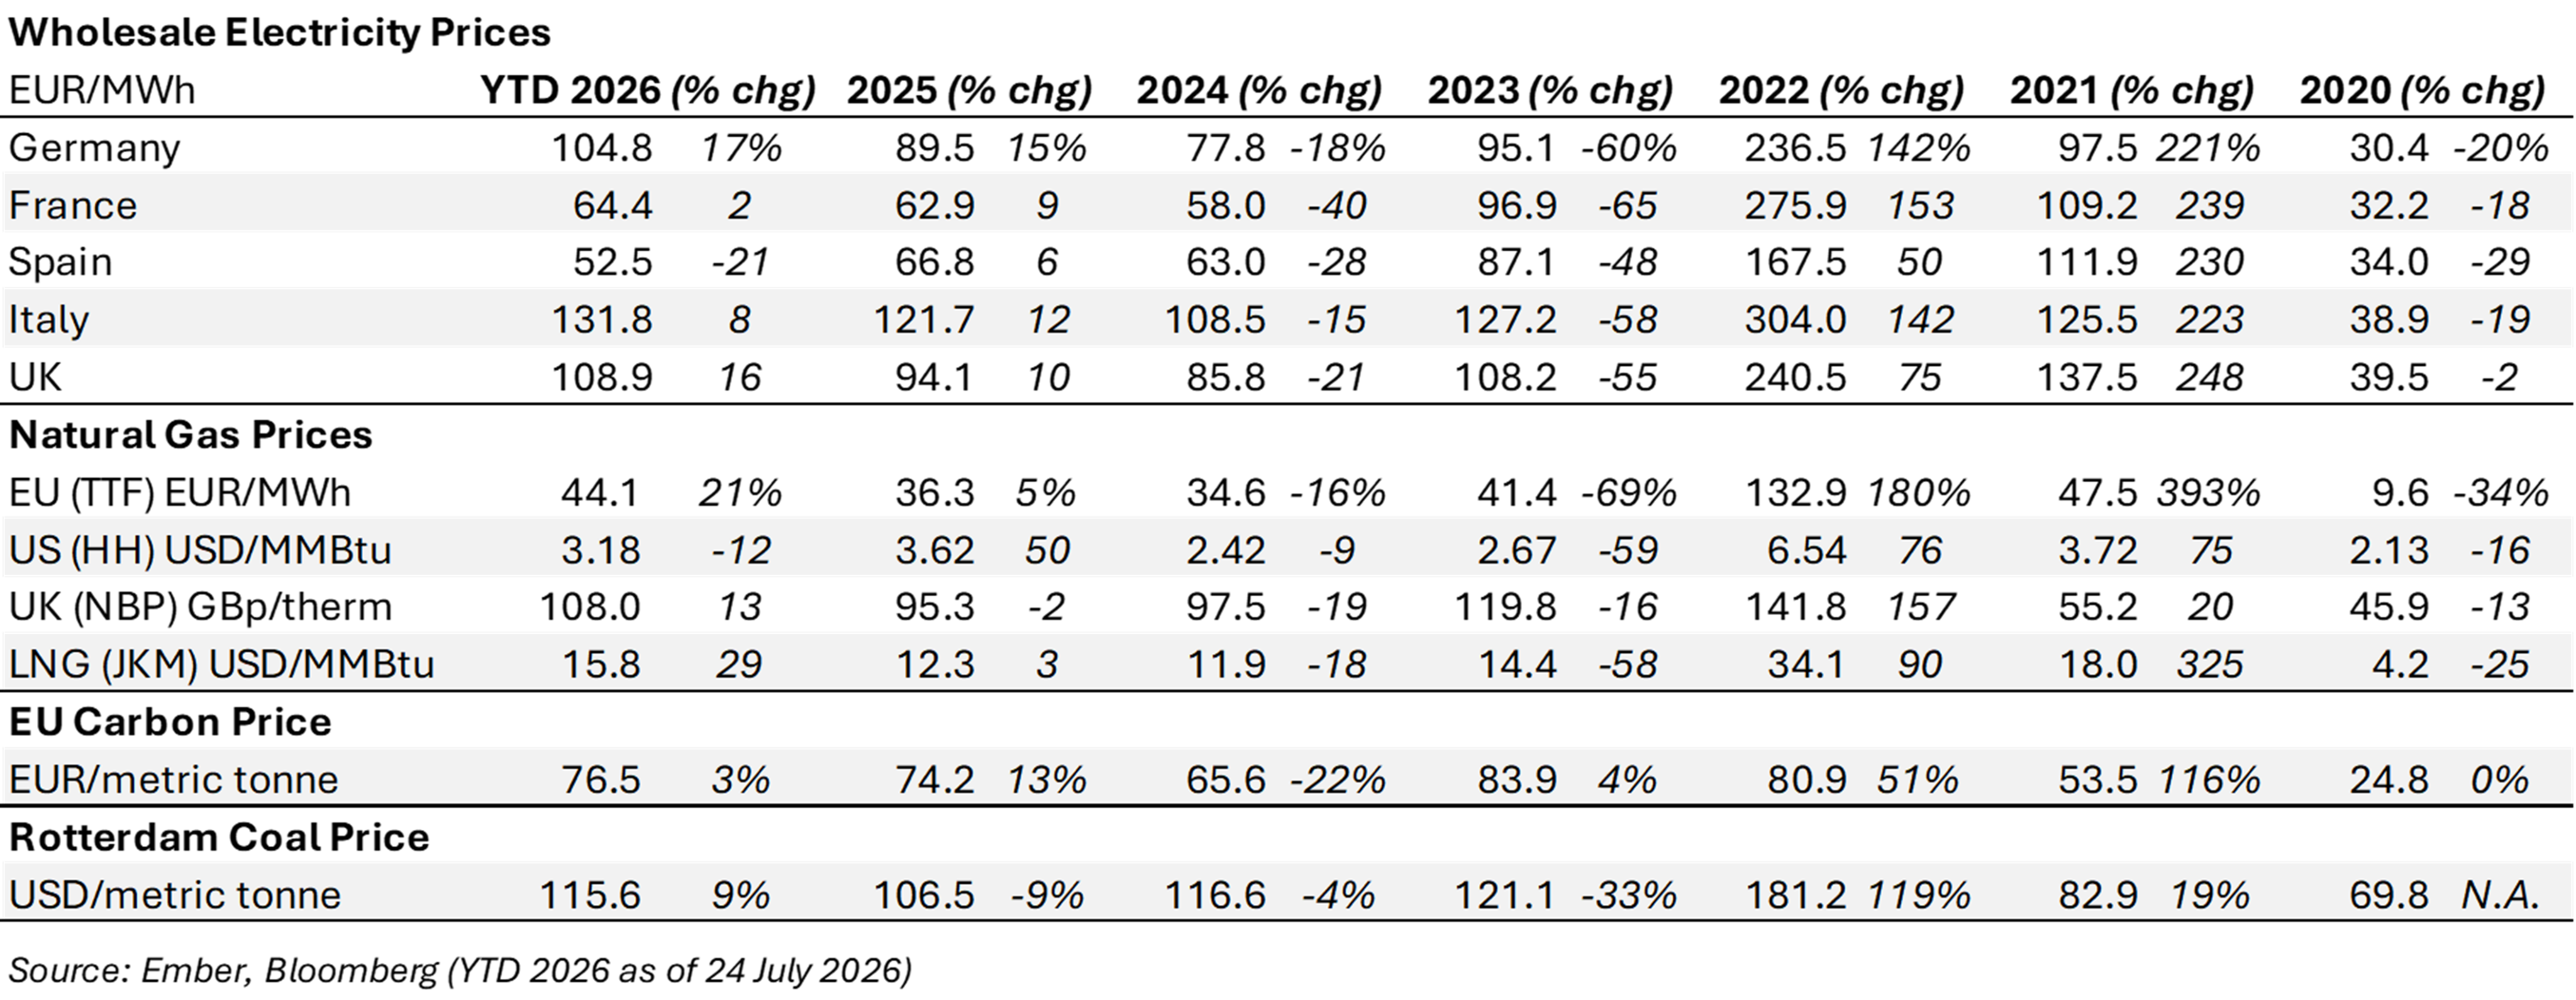
Rising gas prices have also pushed up power prices in countries that rely heavily on gas-fired generation, as gas-fired plants are typically the marginal producers under Europe’s merit-order system and therefore set wholesale electricity prices. Accordingly, average wholesale power prices in Germany, Italy, and the UK have already exceeded their 2025 averages by 17%, 8%, and 16%, respectively, on a year-to-date basis in 2026. In contrast, average power prices in Spain have even declined by 21% YTD in 2026 as the country is much less dependent on gas for power generation (see Table 2). Despite elevated power prices across Europe, electricity demand in the “EU plus UK” has continued to grow by 1.6% in 1Q 2026 and growth has even picked up to 2.5% in 2Q 2026. Similarly, power demand growth in the USA and in China has also accelerated in the 2Q, while electricity demand in Japan declined by 2.9%, reflecting relatively cooler weather conditions compared to the prior year (see Table 3).
Table 3 Annual Electricity Demand (TWh)


Gas Storage and LNG Flows
Exhibit 7 US Gas Storage Exhibit 8 US LNG Exports 

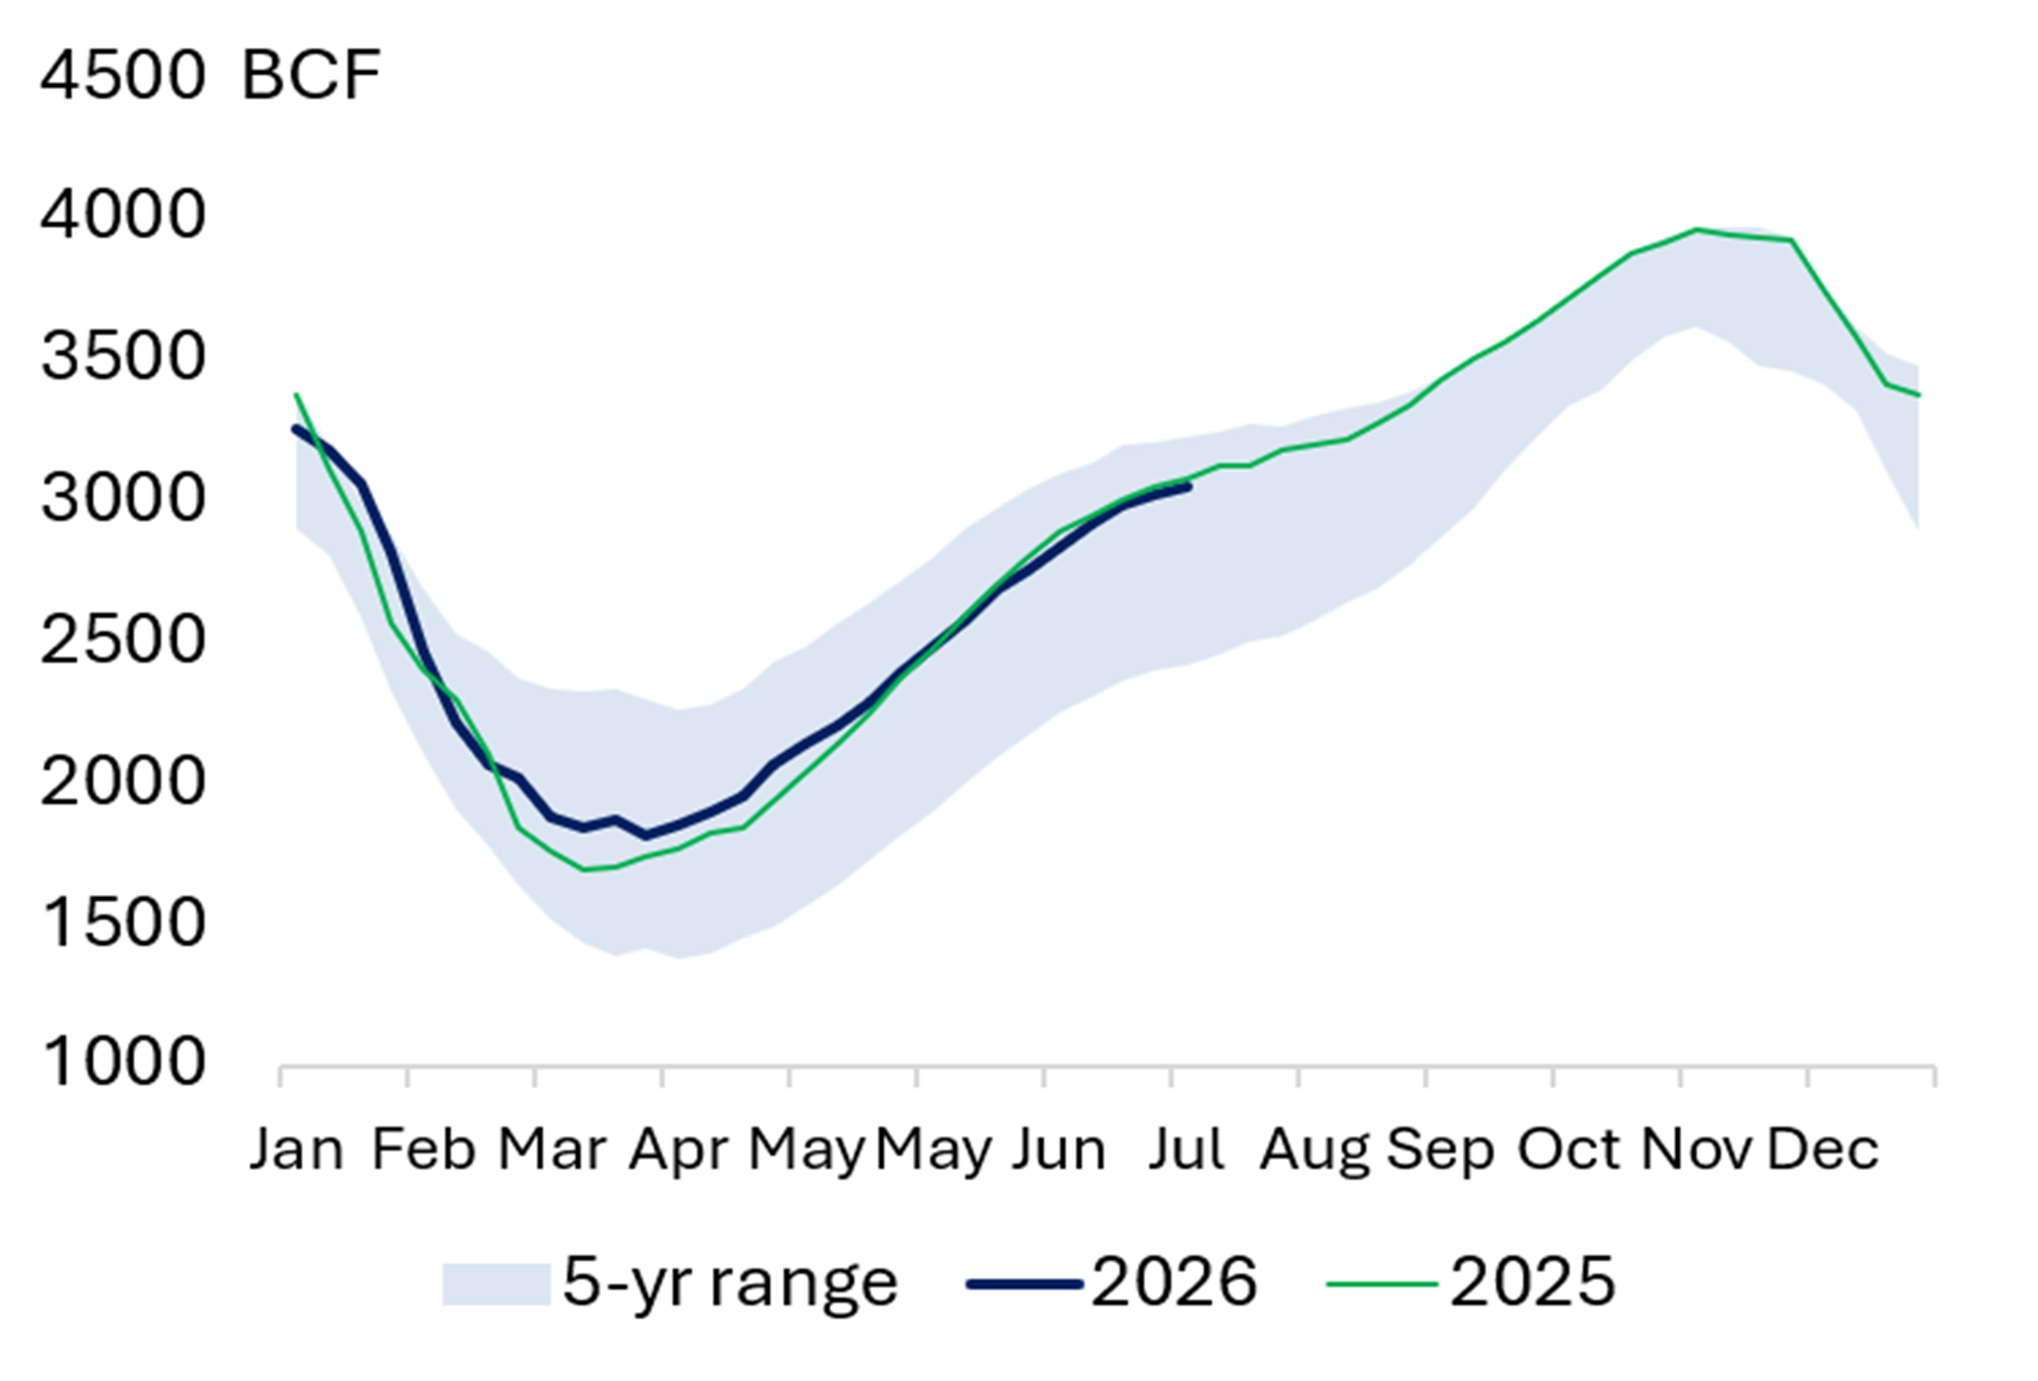
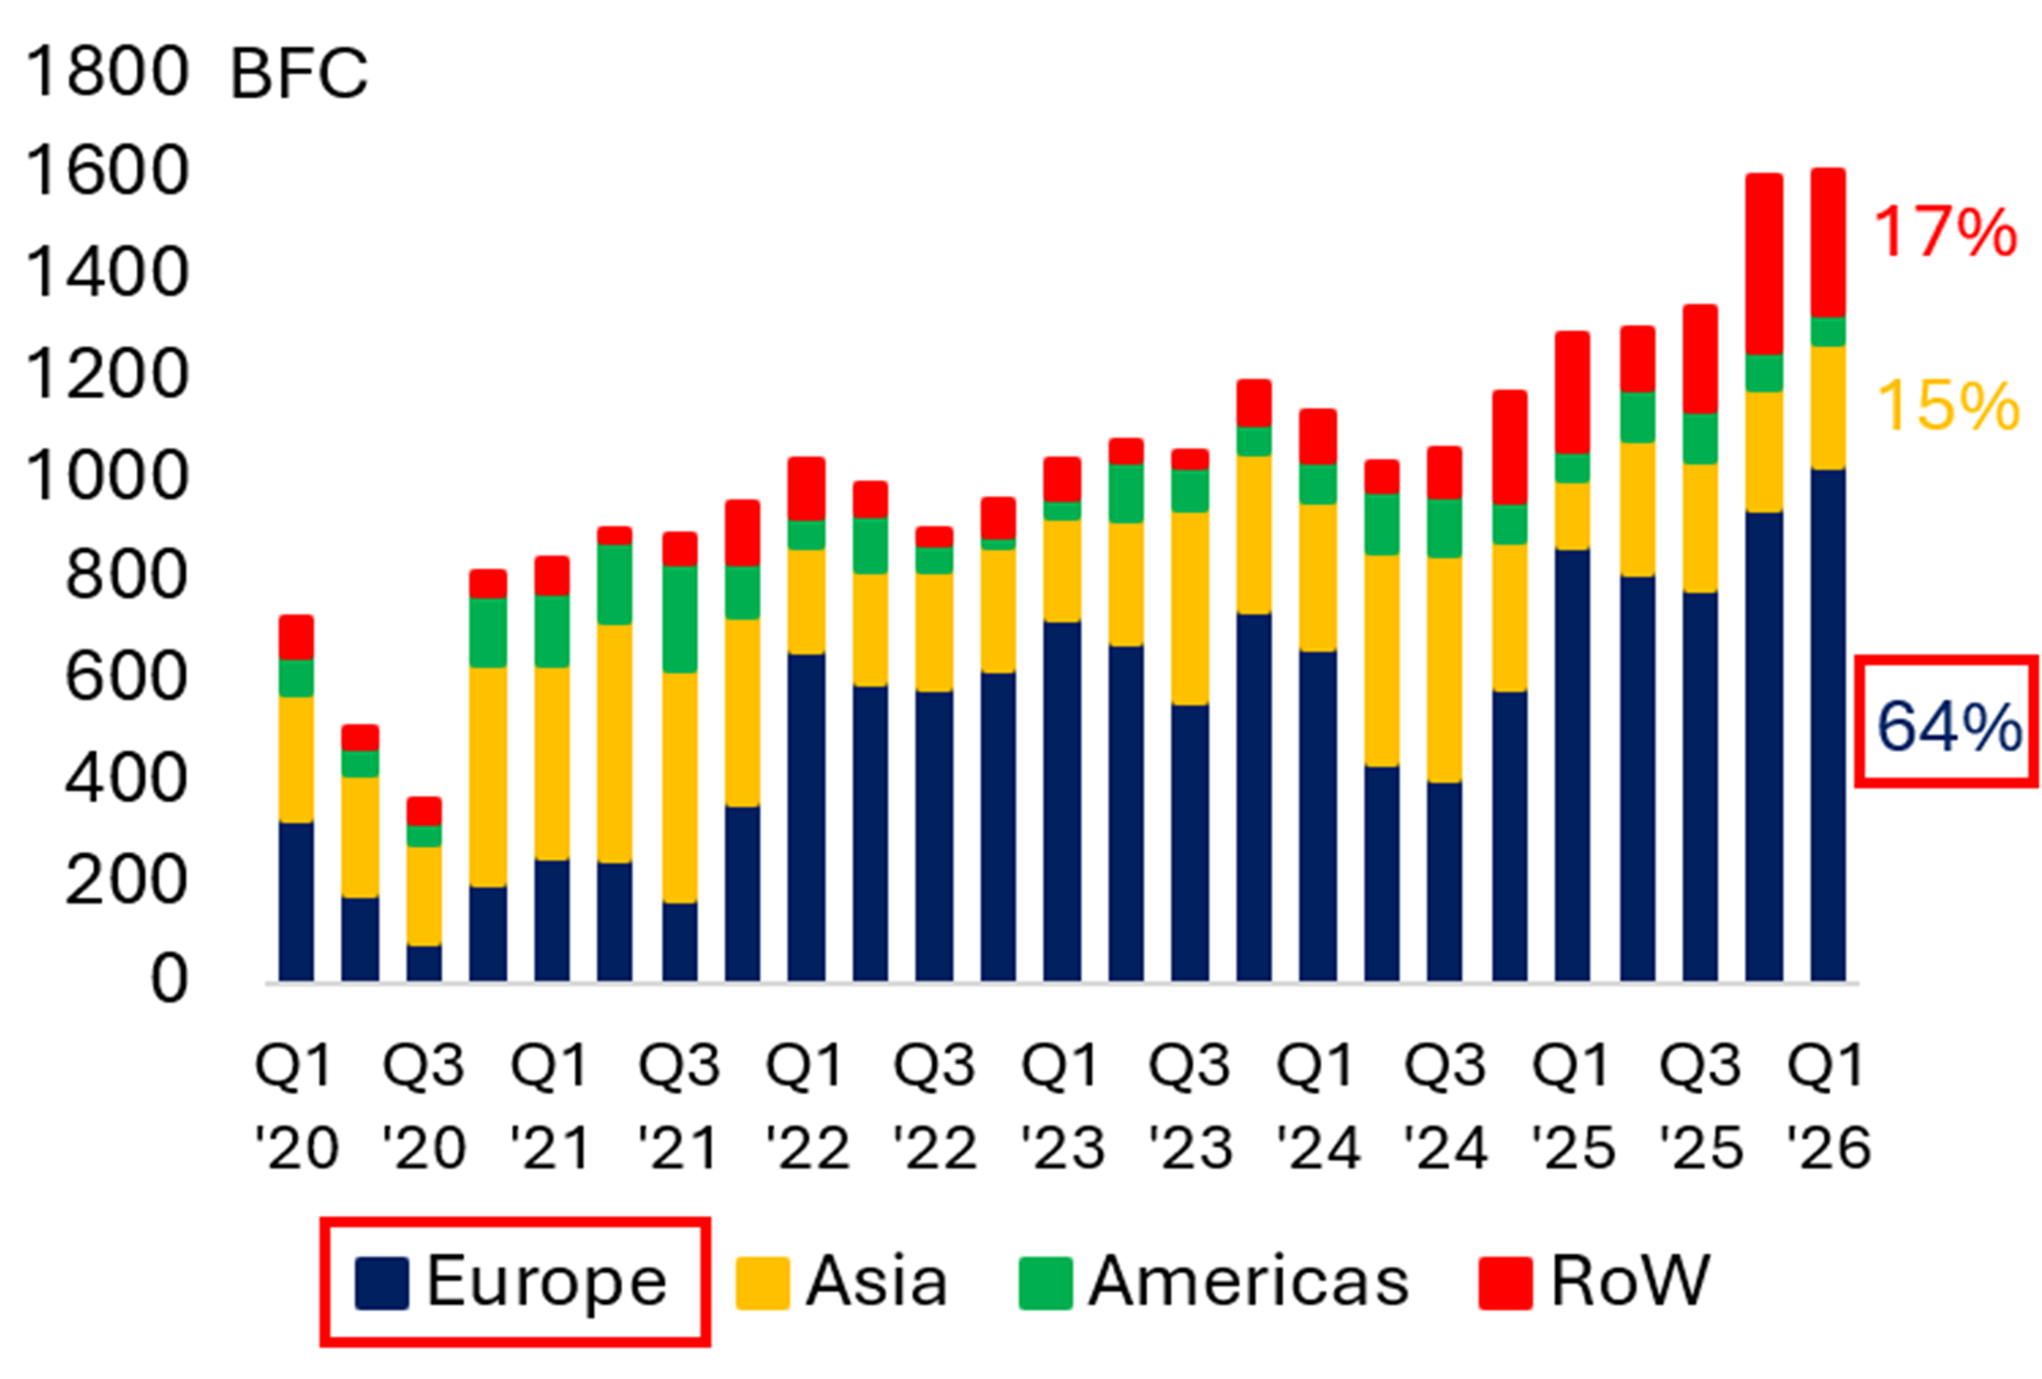
Source: US Energy Information Administration Source: US Energy Information Administration
Exhibit 9 EU Gas Storage (% full) Exhibit 10 EU Gas Demand 

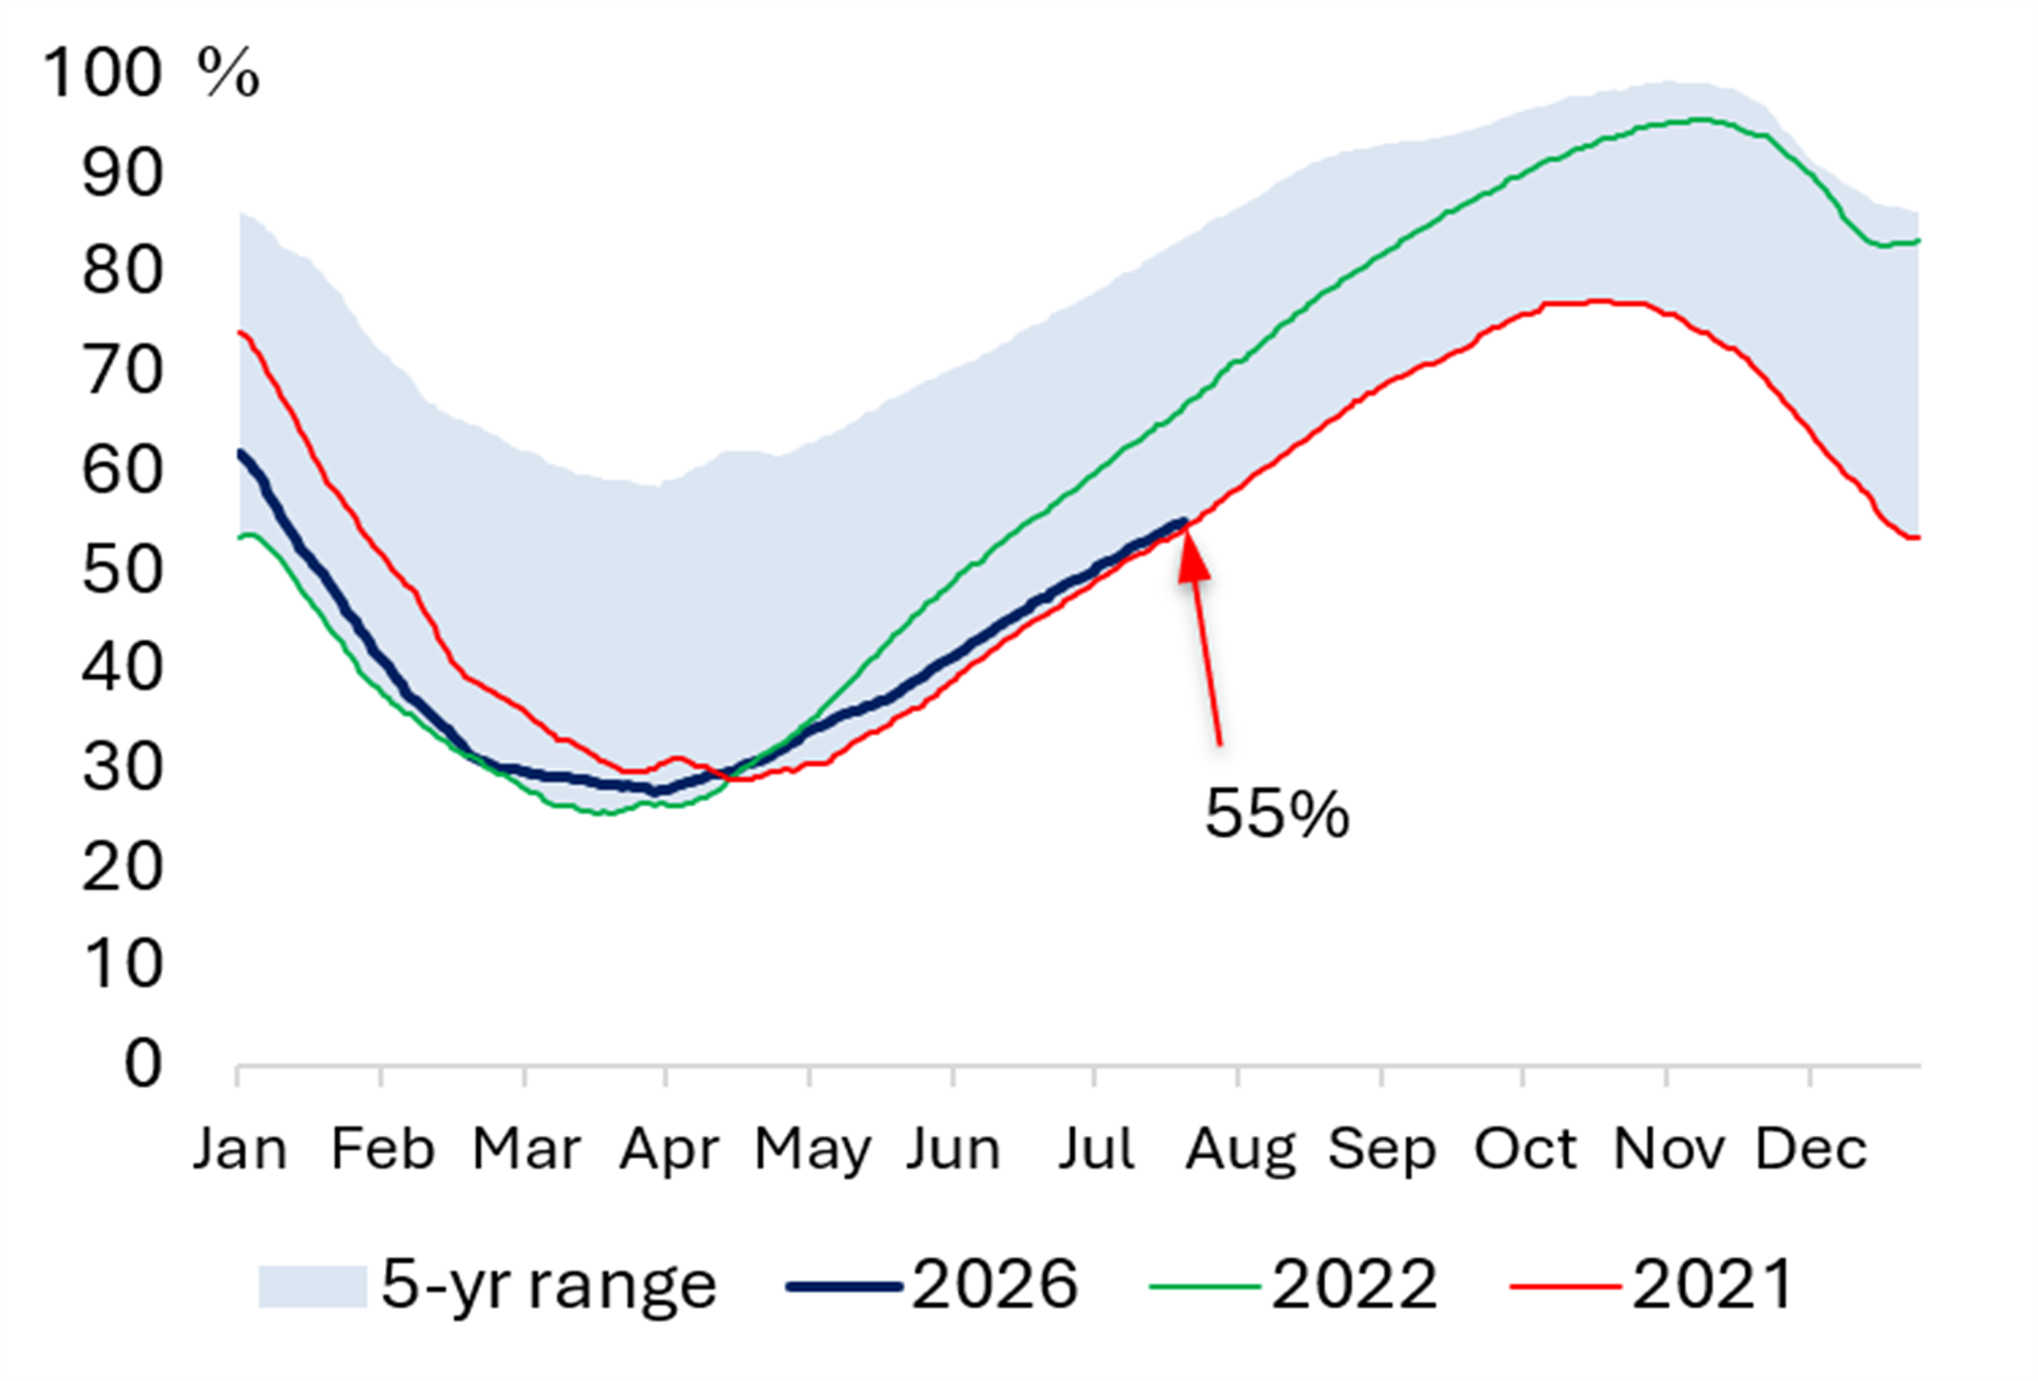
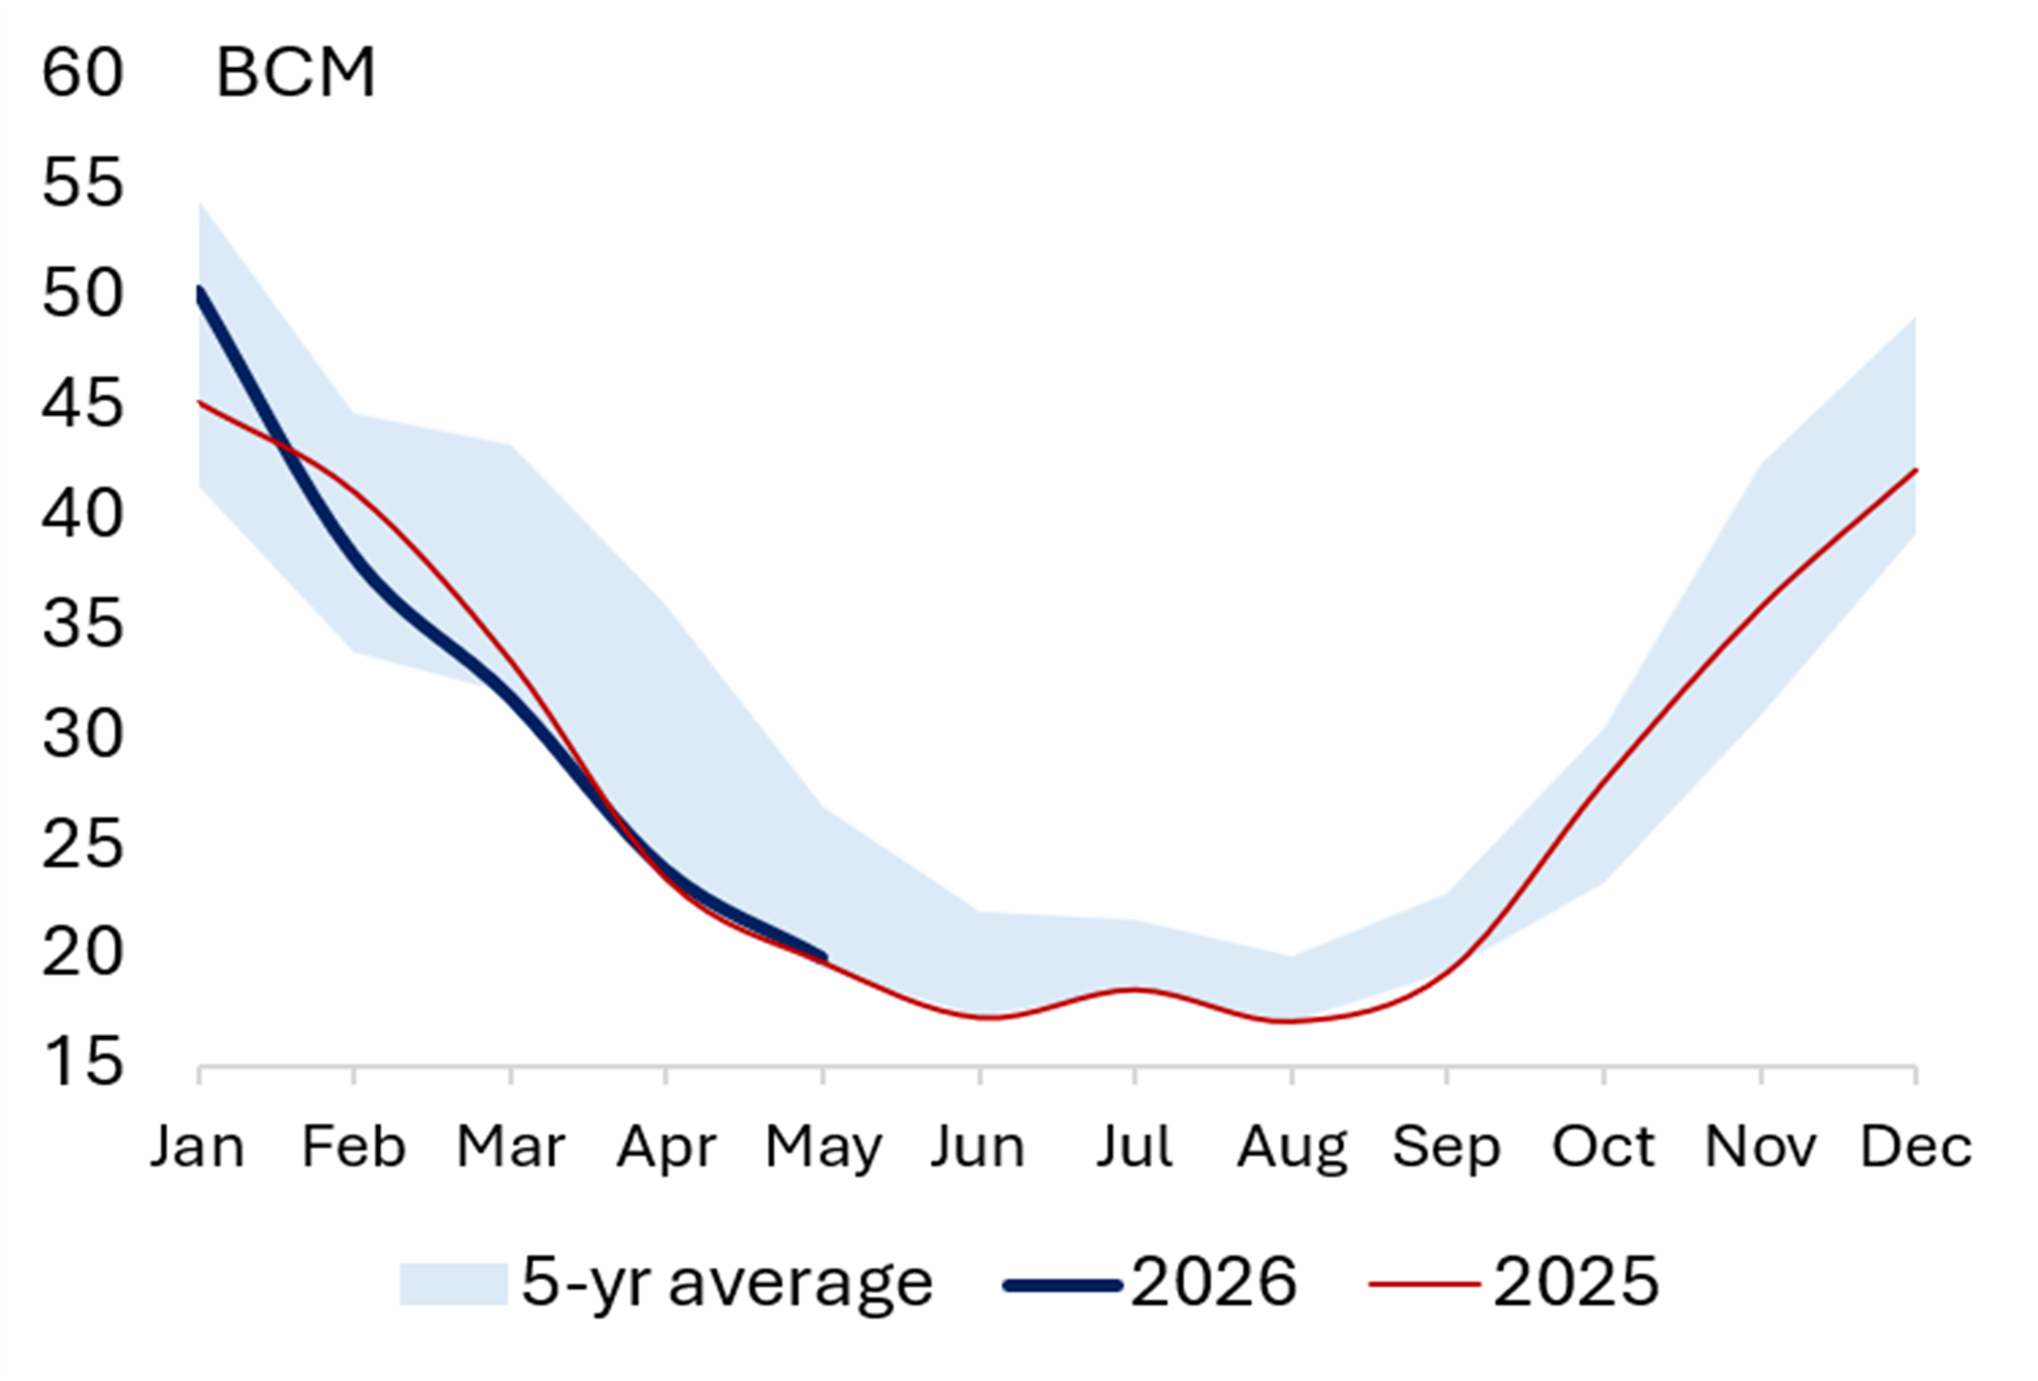
Source: Gas Infrastructure Europe Source: Eurostat
Exhibit 11 EU Quarterly Gas Imports by Source Exhibit 12 EU Monthly LNG Imports 

Source: Bruegel Source: Bruegel
Global Electrification Trends (Power Demand in TWh)
Exhibit 13 Europe Electricity Demand Exhibit 14 USA Electricity Demand 

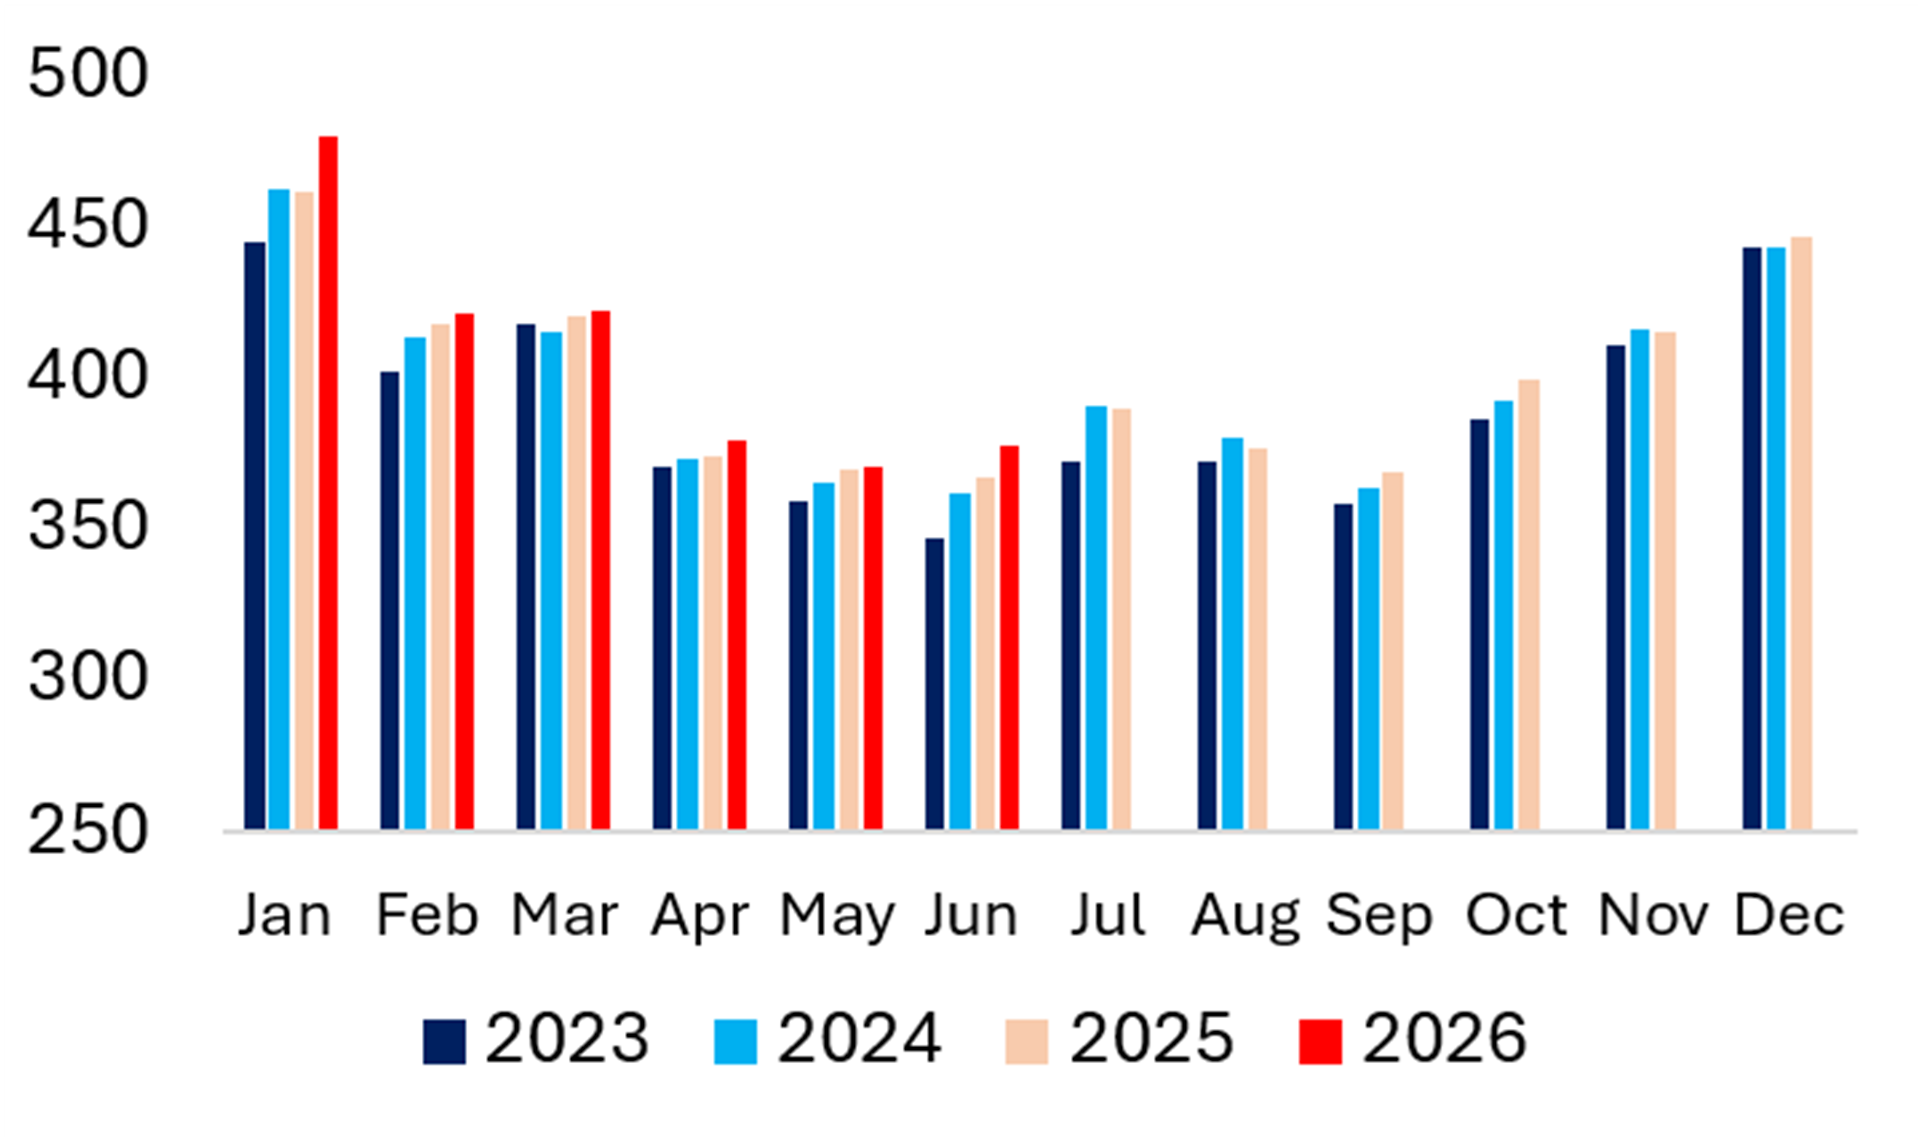
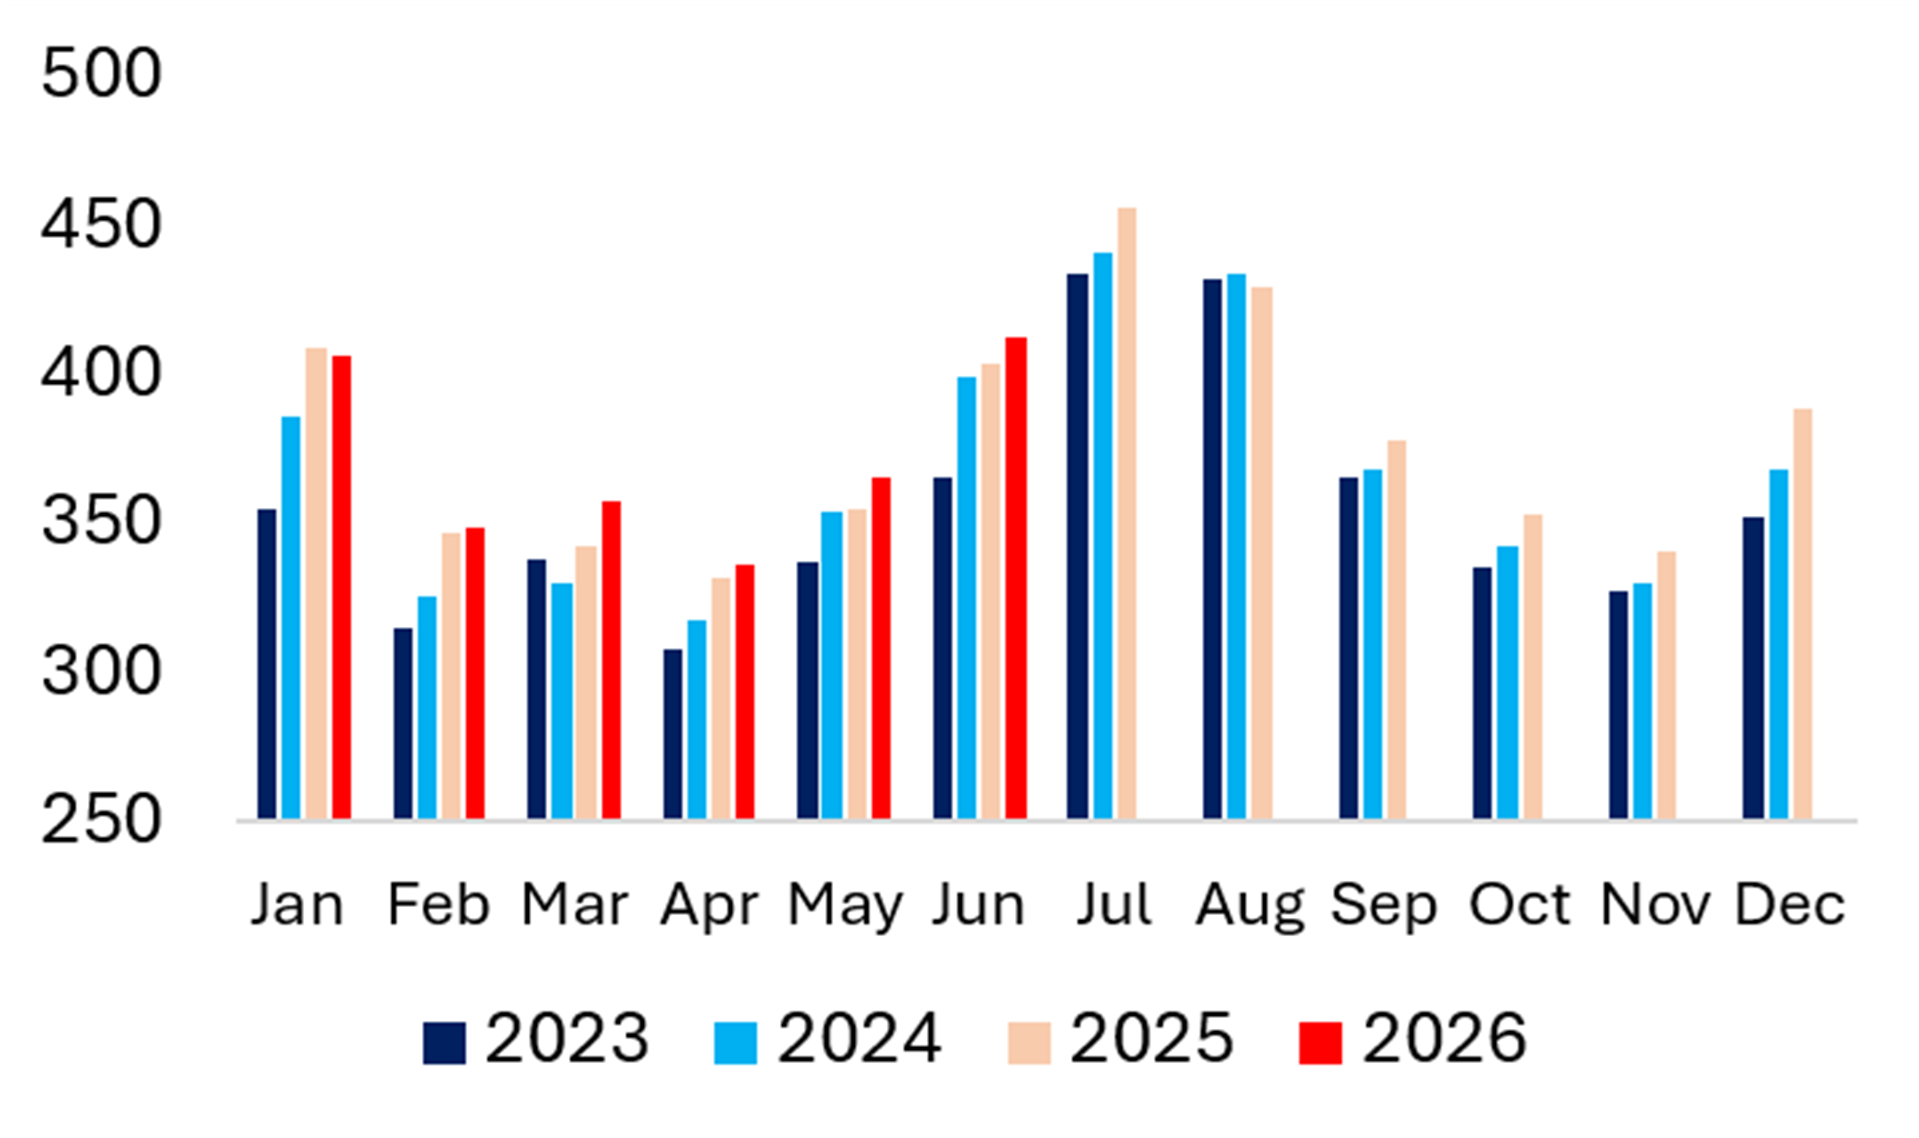
Exhibit 15 Türkiye Electricity Demand Exhibit 16 LatAm Electricity Demand 

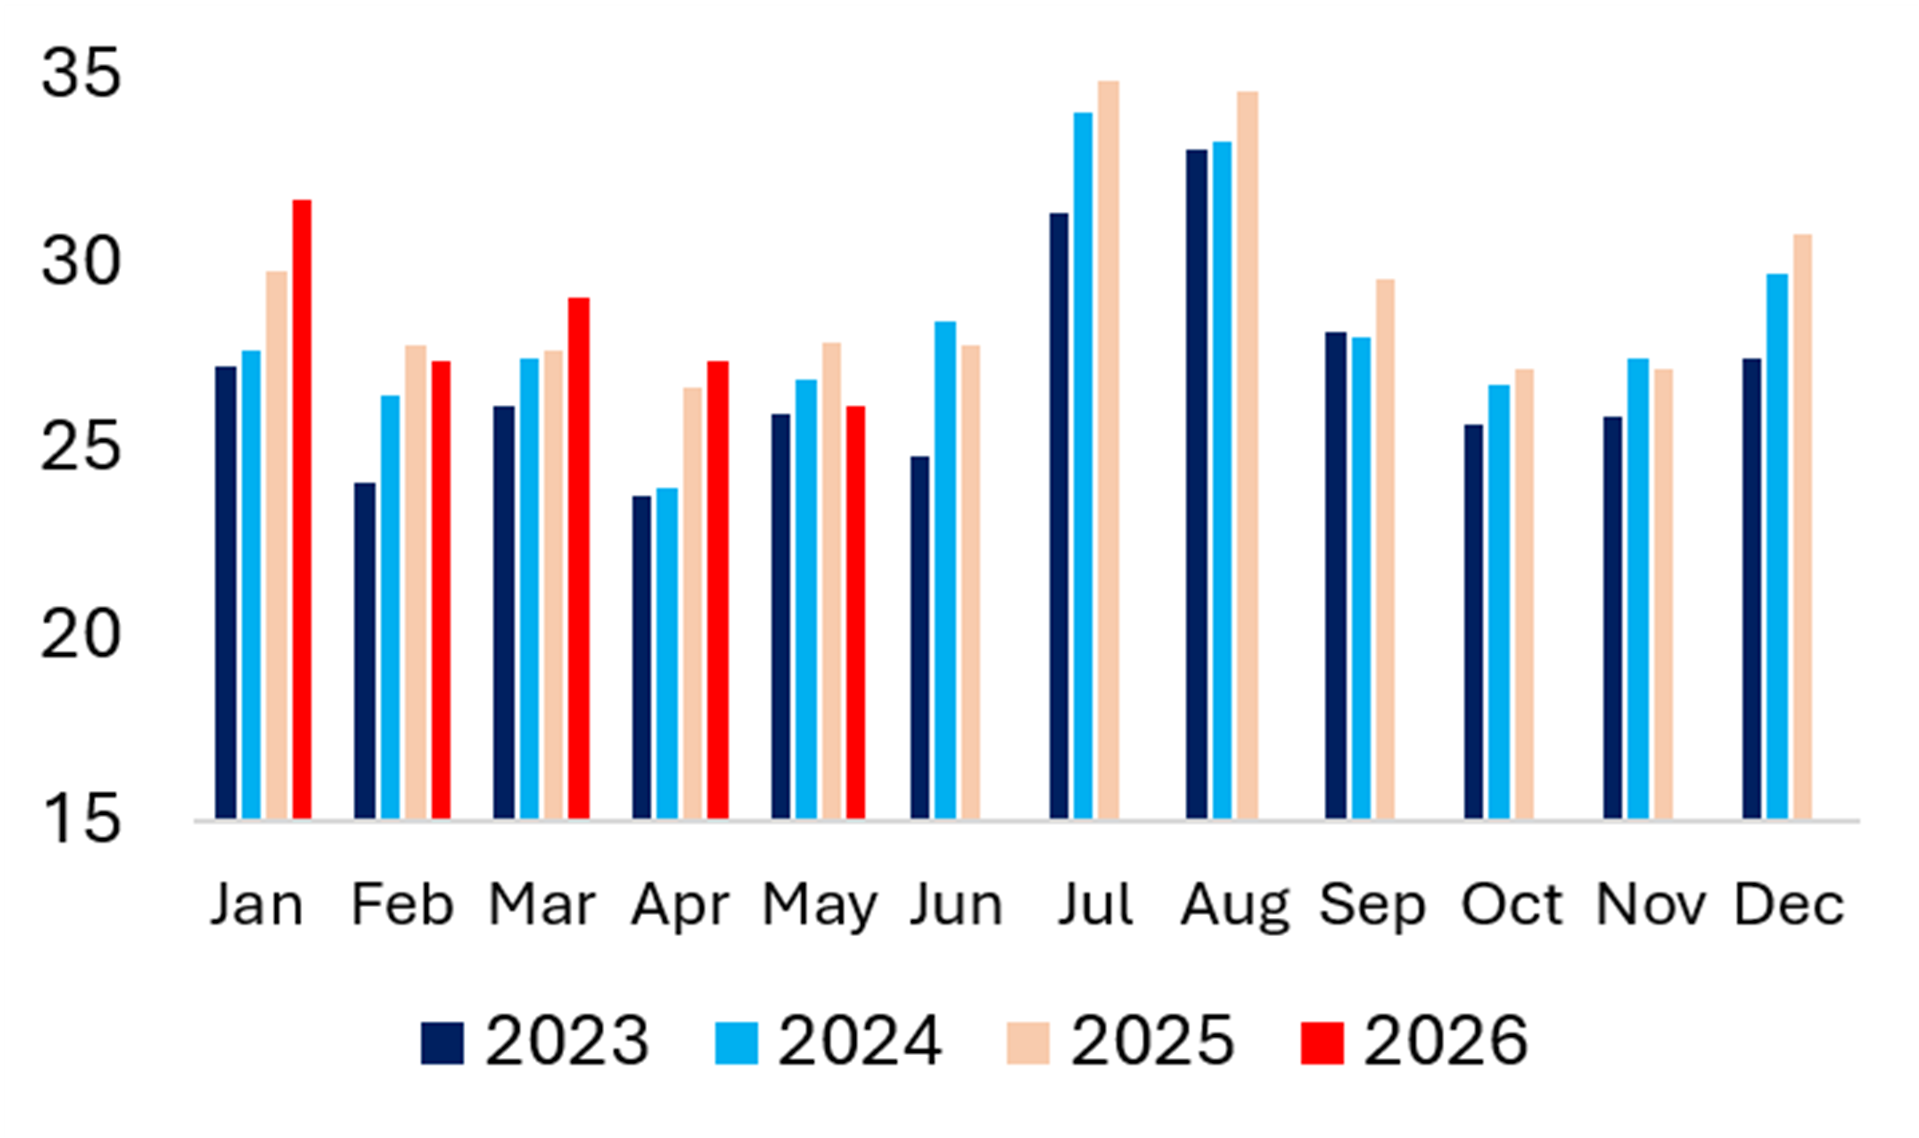
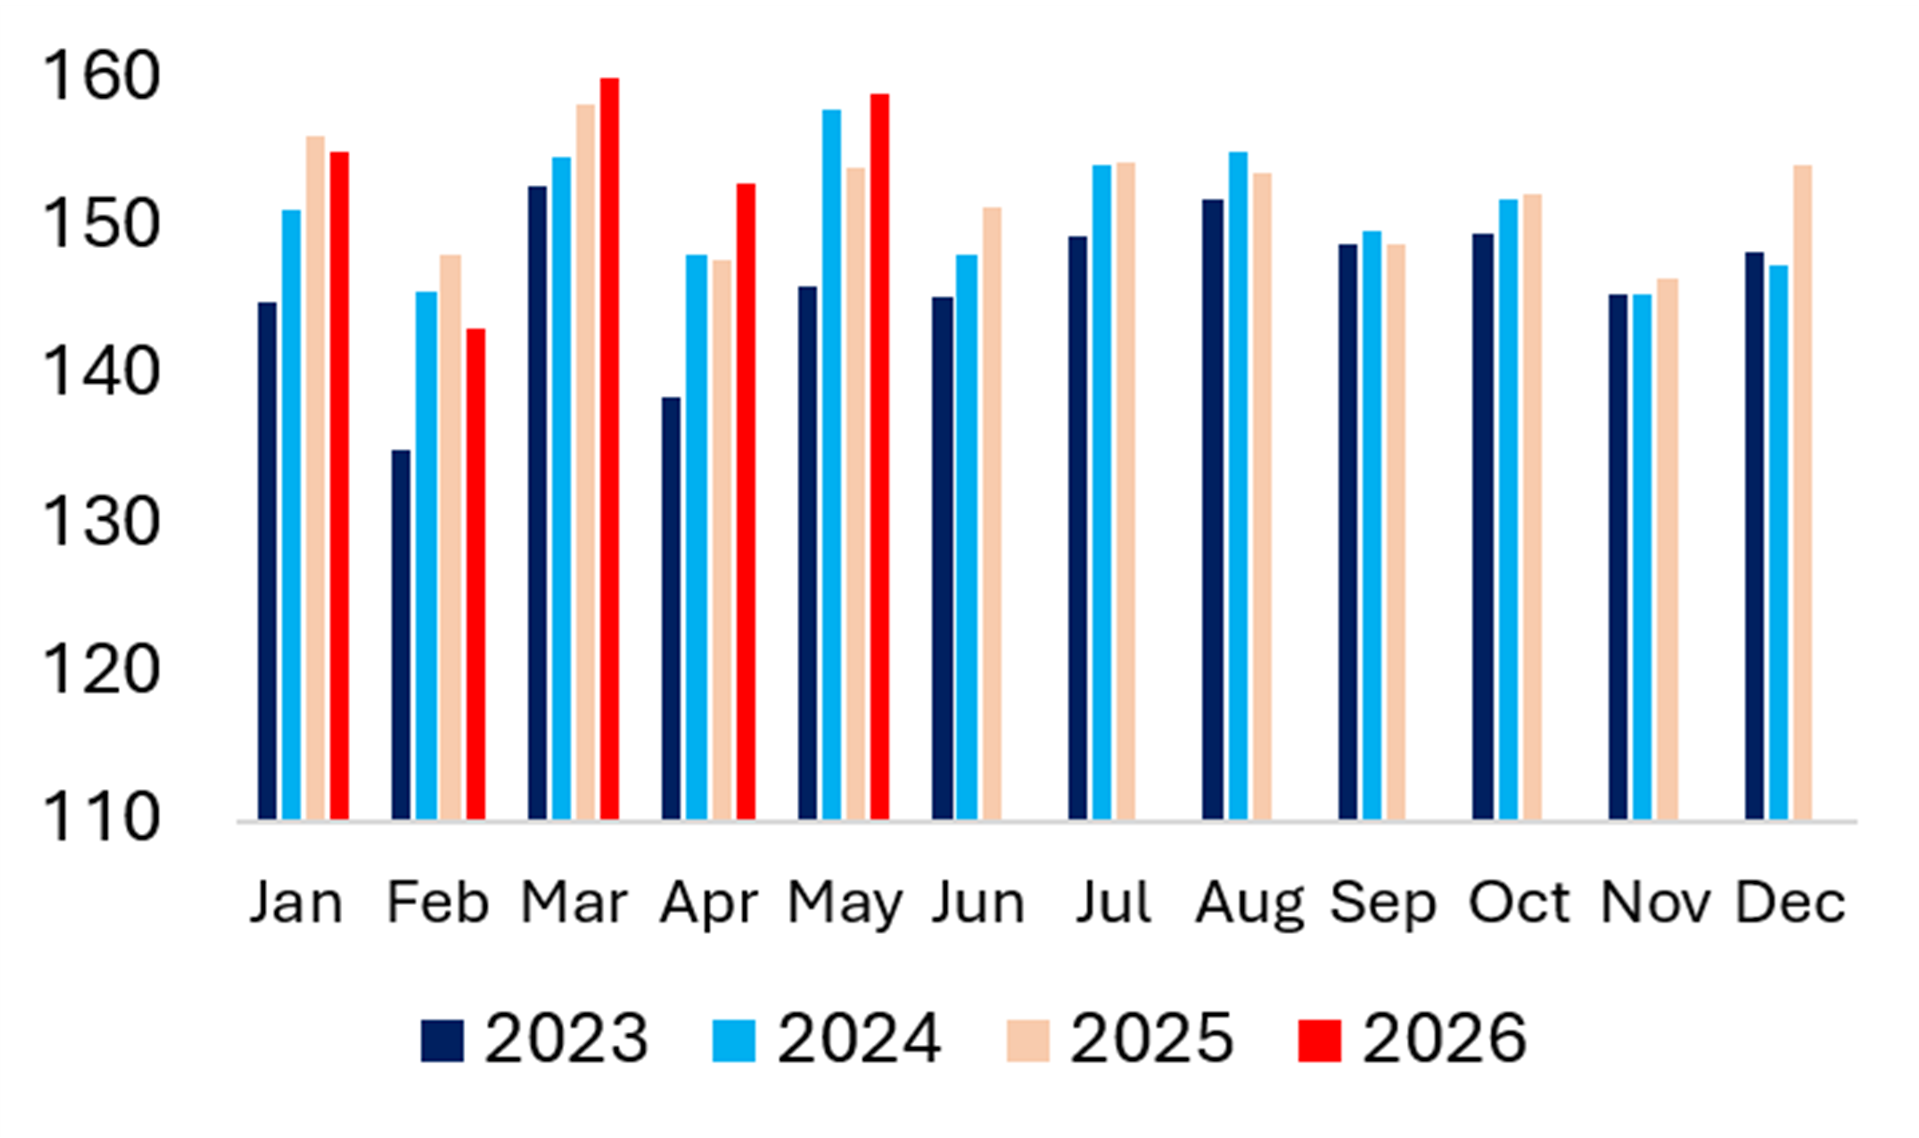
Exhibit 17 China Electricity Demand Exhibit 18 Japan Electricity Demand 

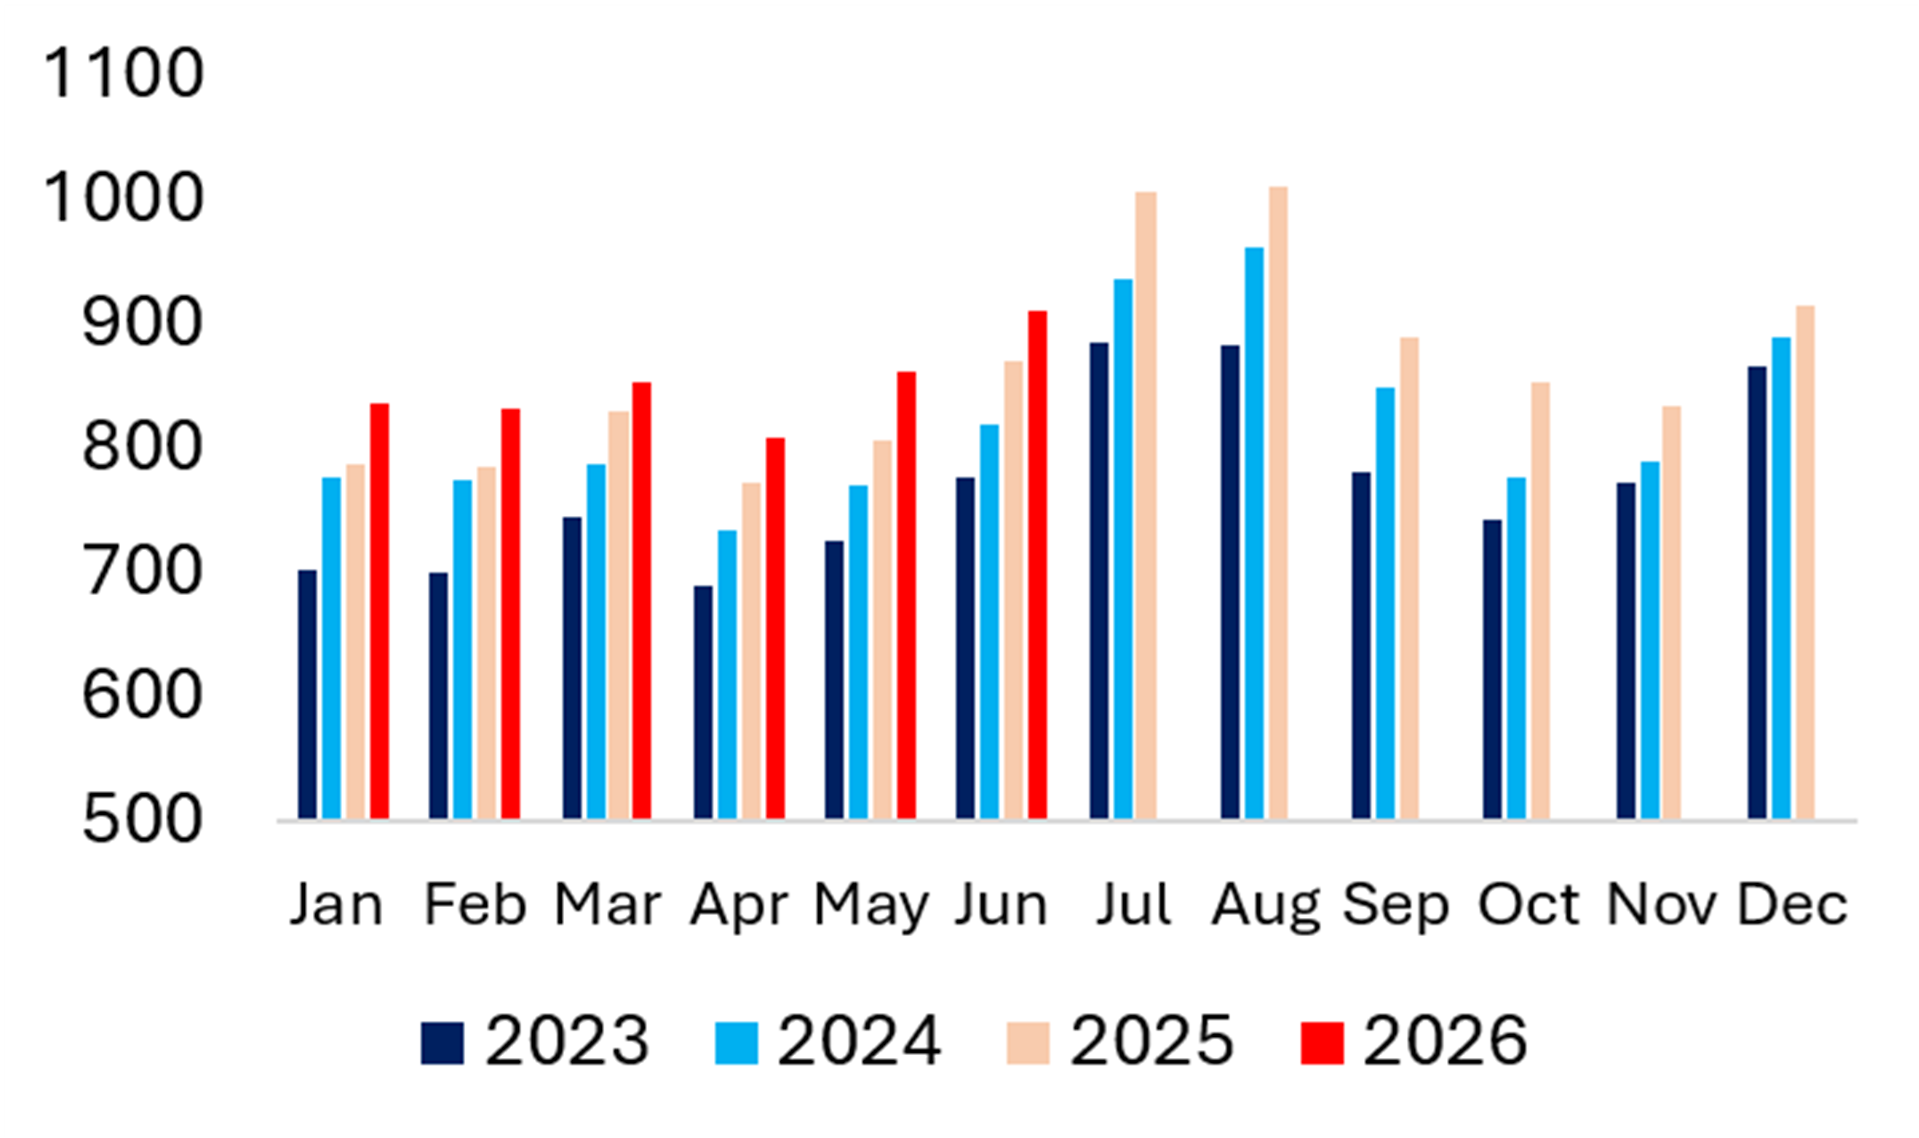
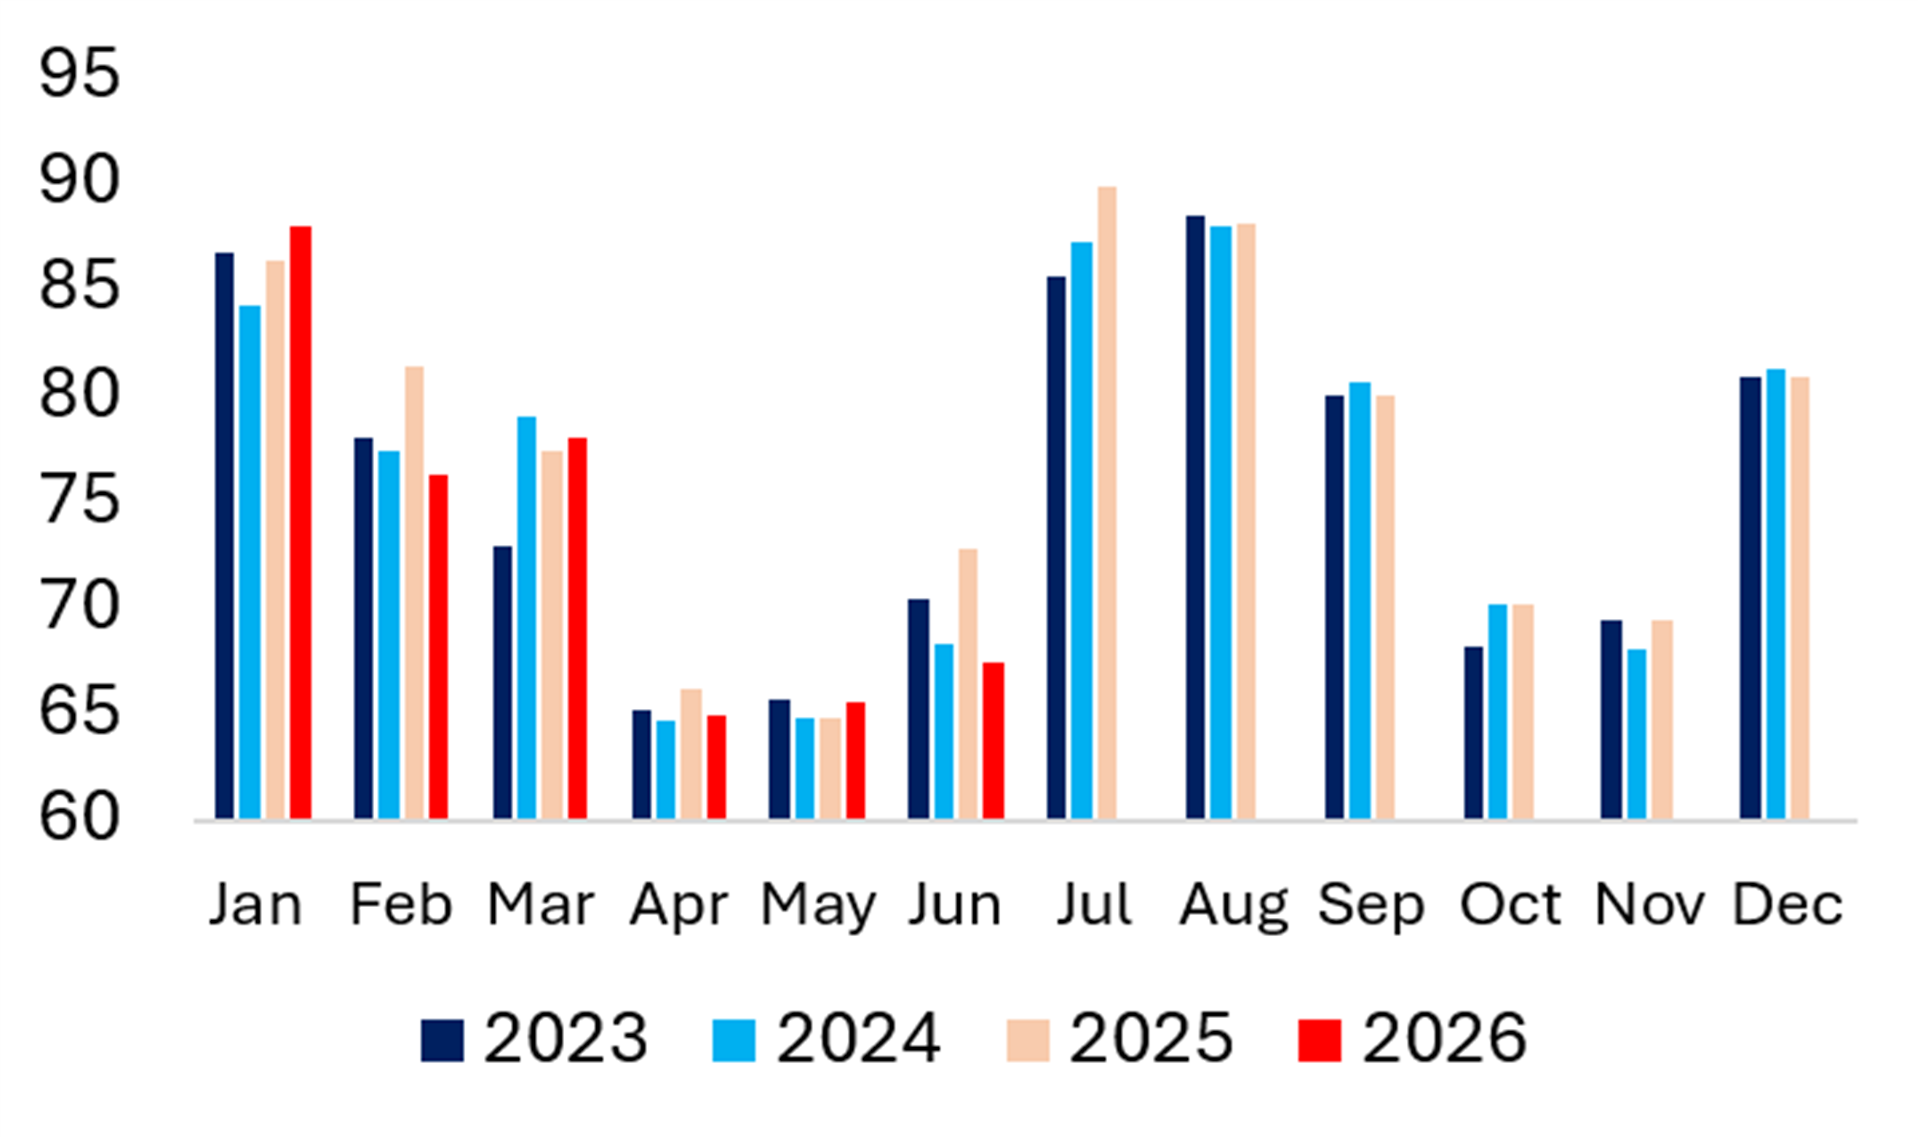
Exhibit 19 India Electricity Demand Exhibit 20 World Electricity Demand

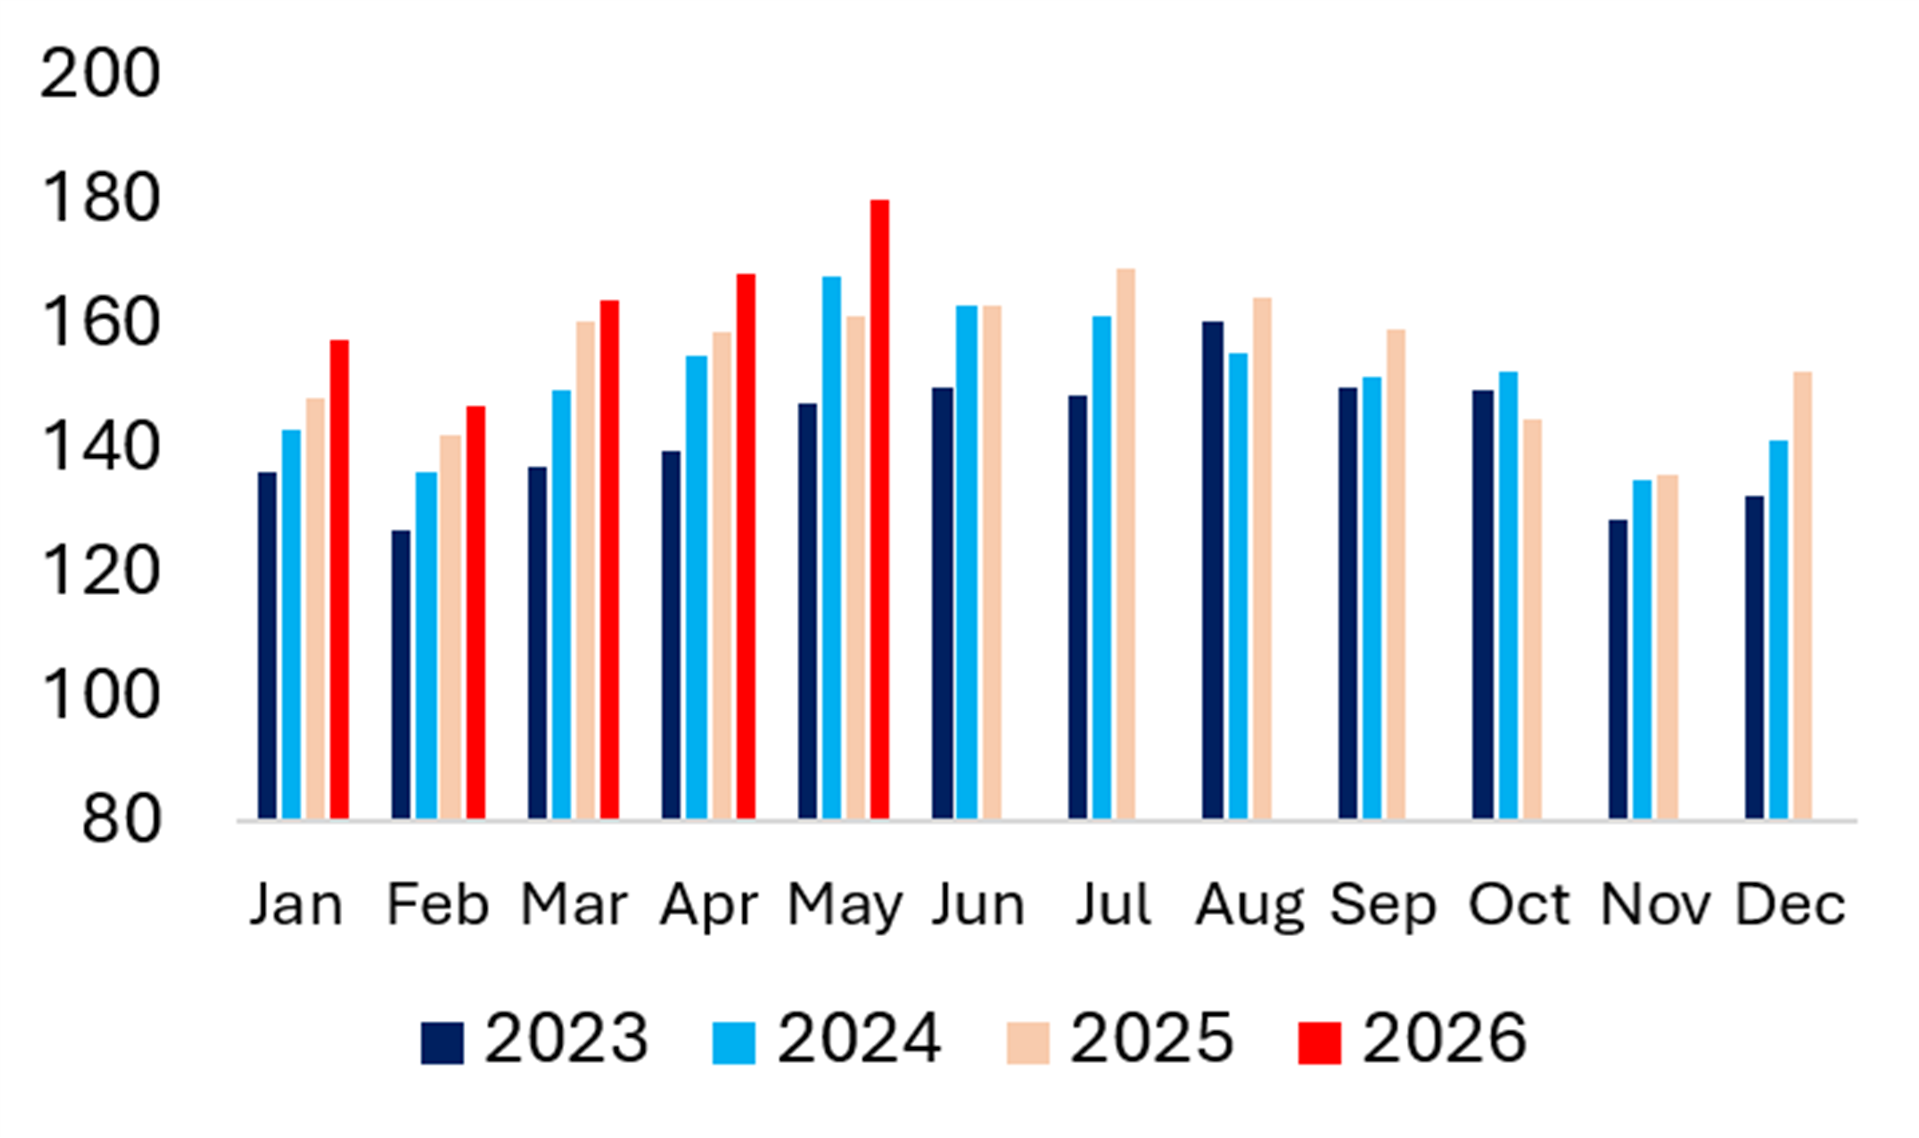
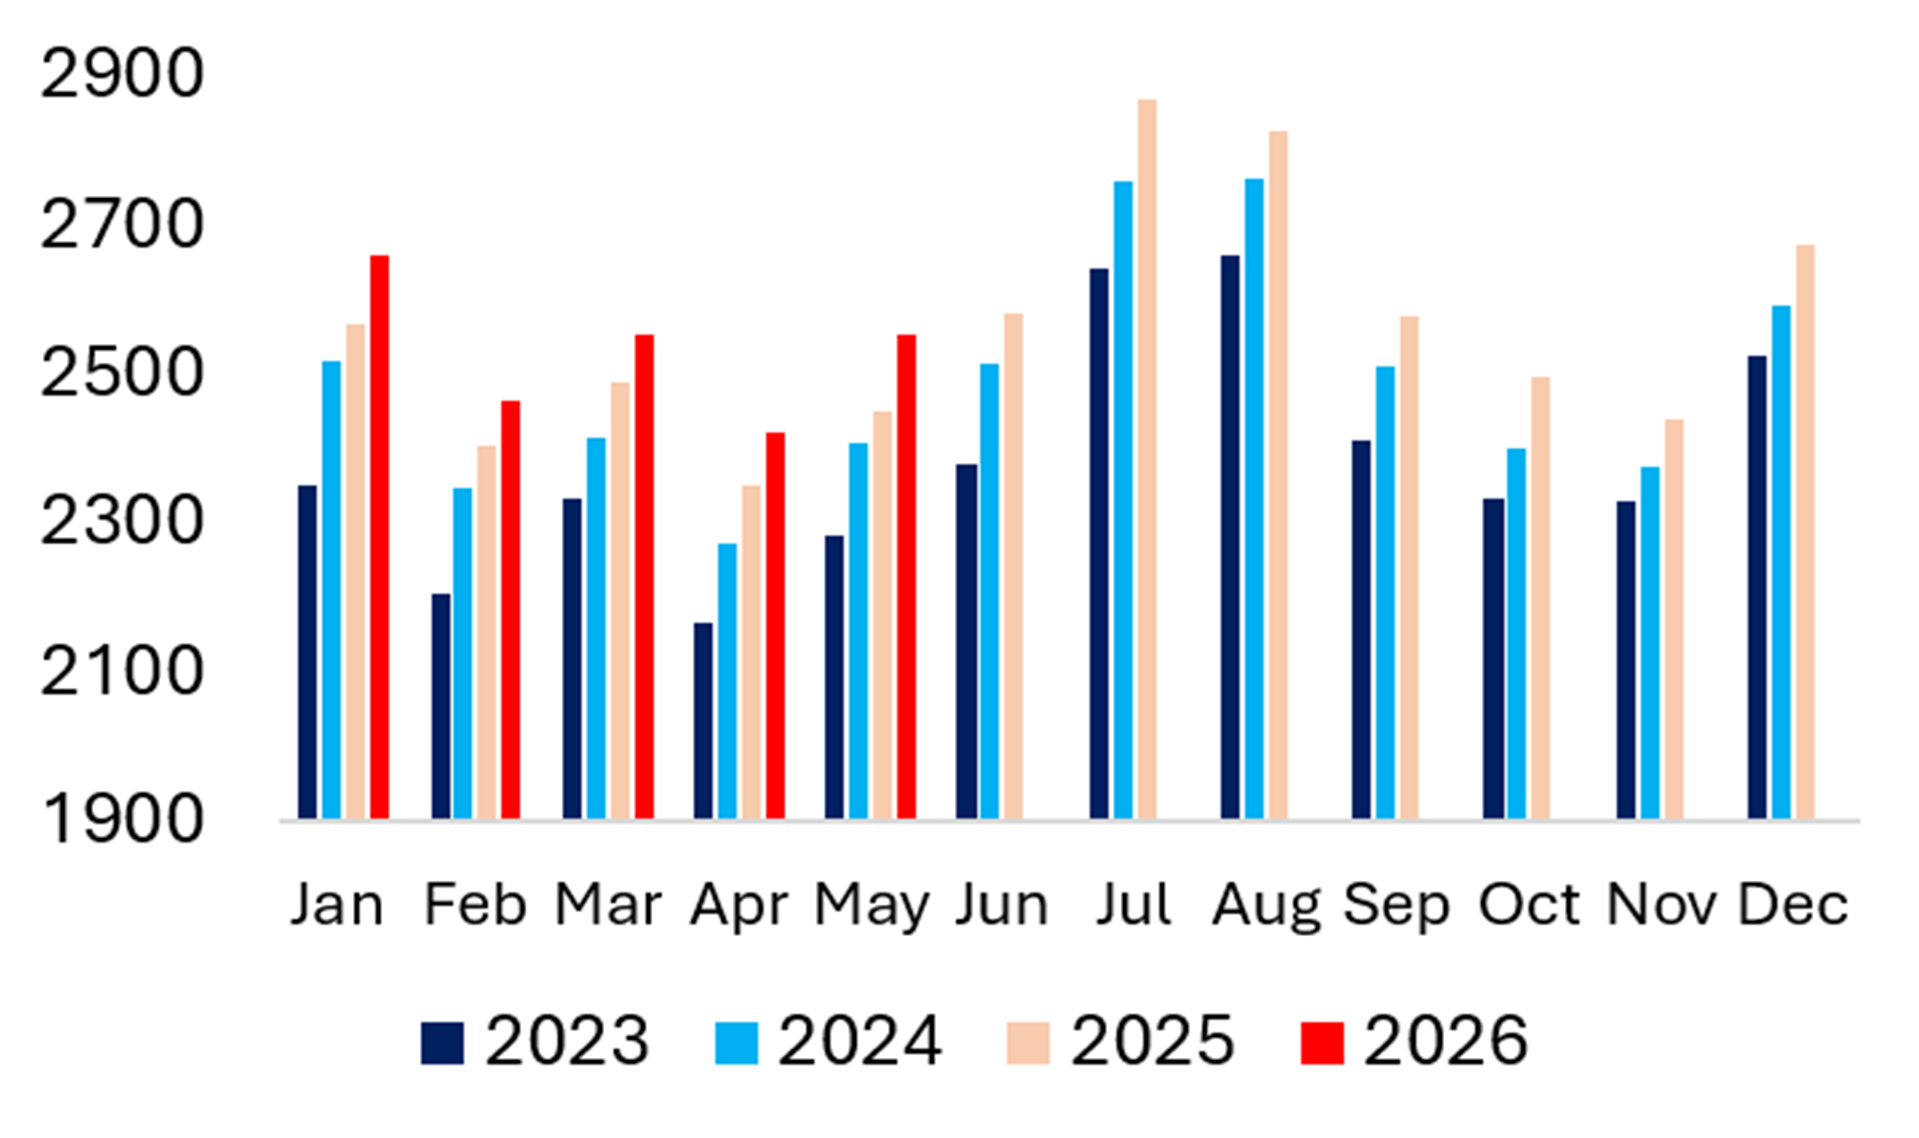

Source: EMBER
Power Tracker: Changing Fuel Mix and 3 Biggest Sources of Power Generation
EUROPE
Exhibit 21 Europe: Biggest Source of Electricity in Each Country
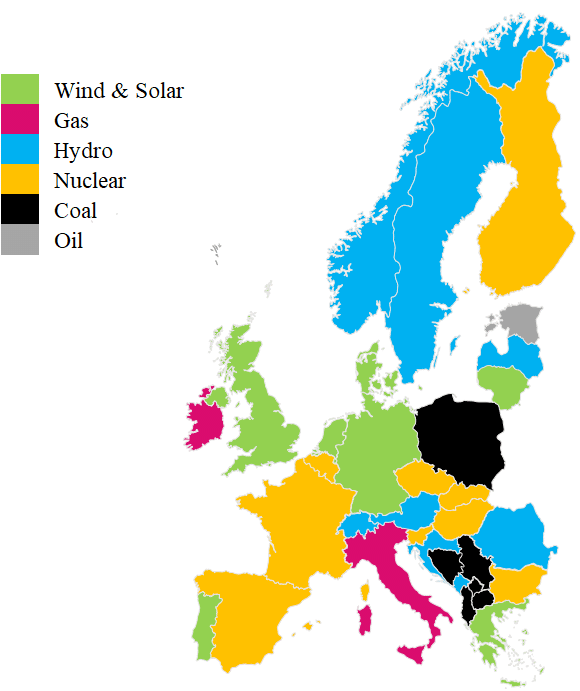
Exhibit 22 Power Generation Exhibit 23 Share of Wind & Solar (%) 
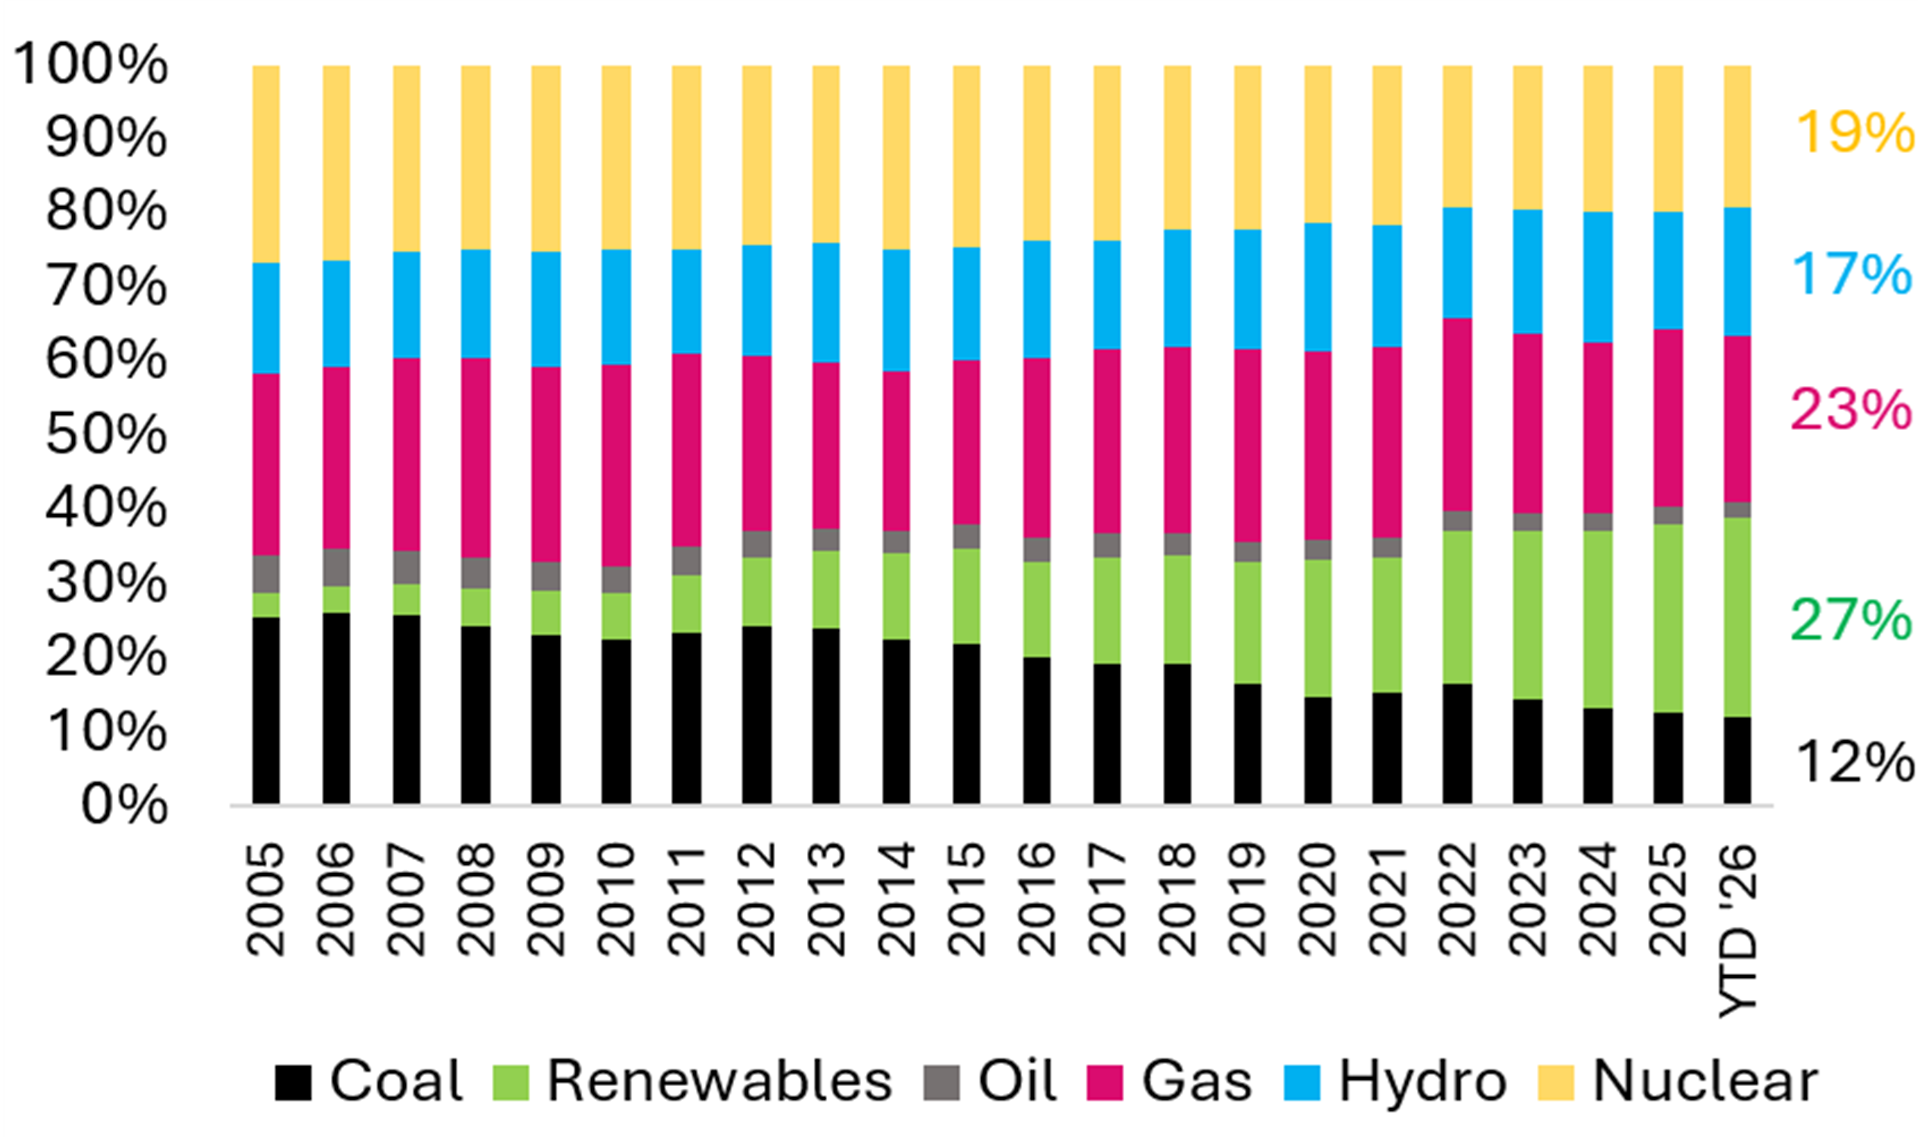
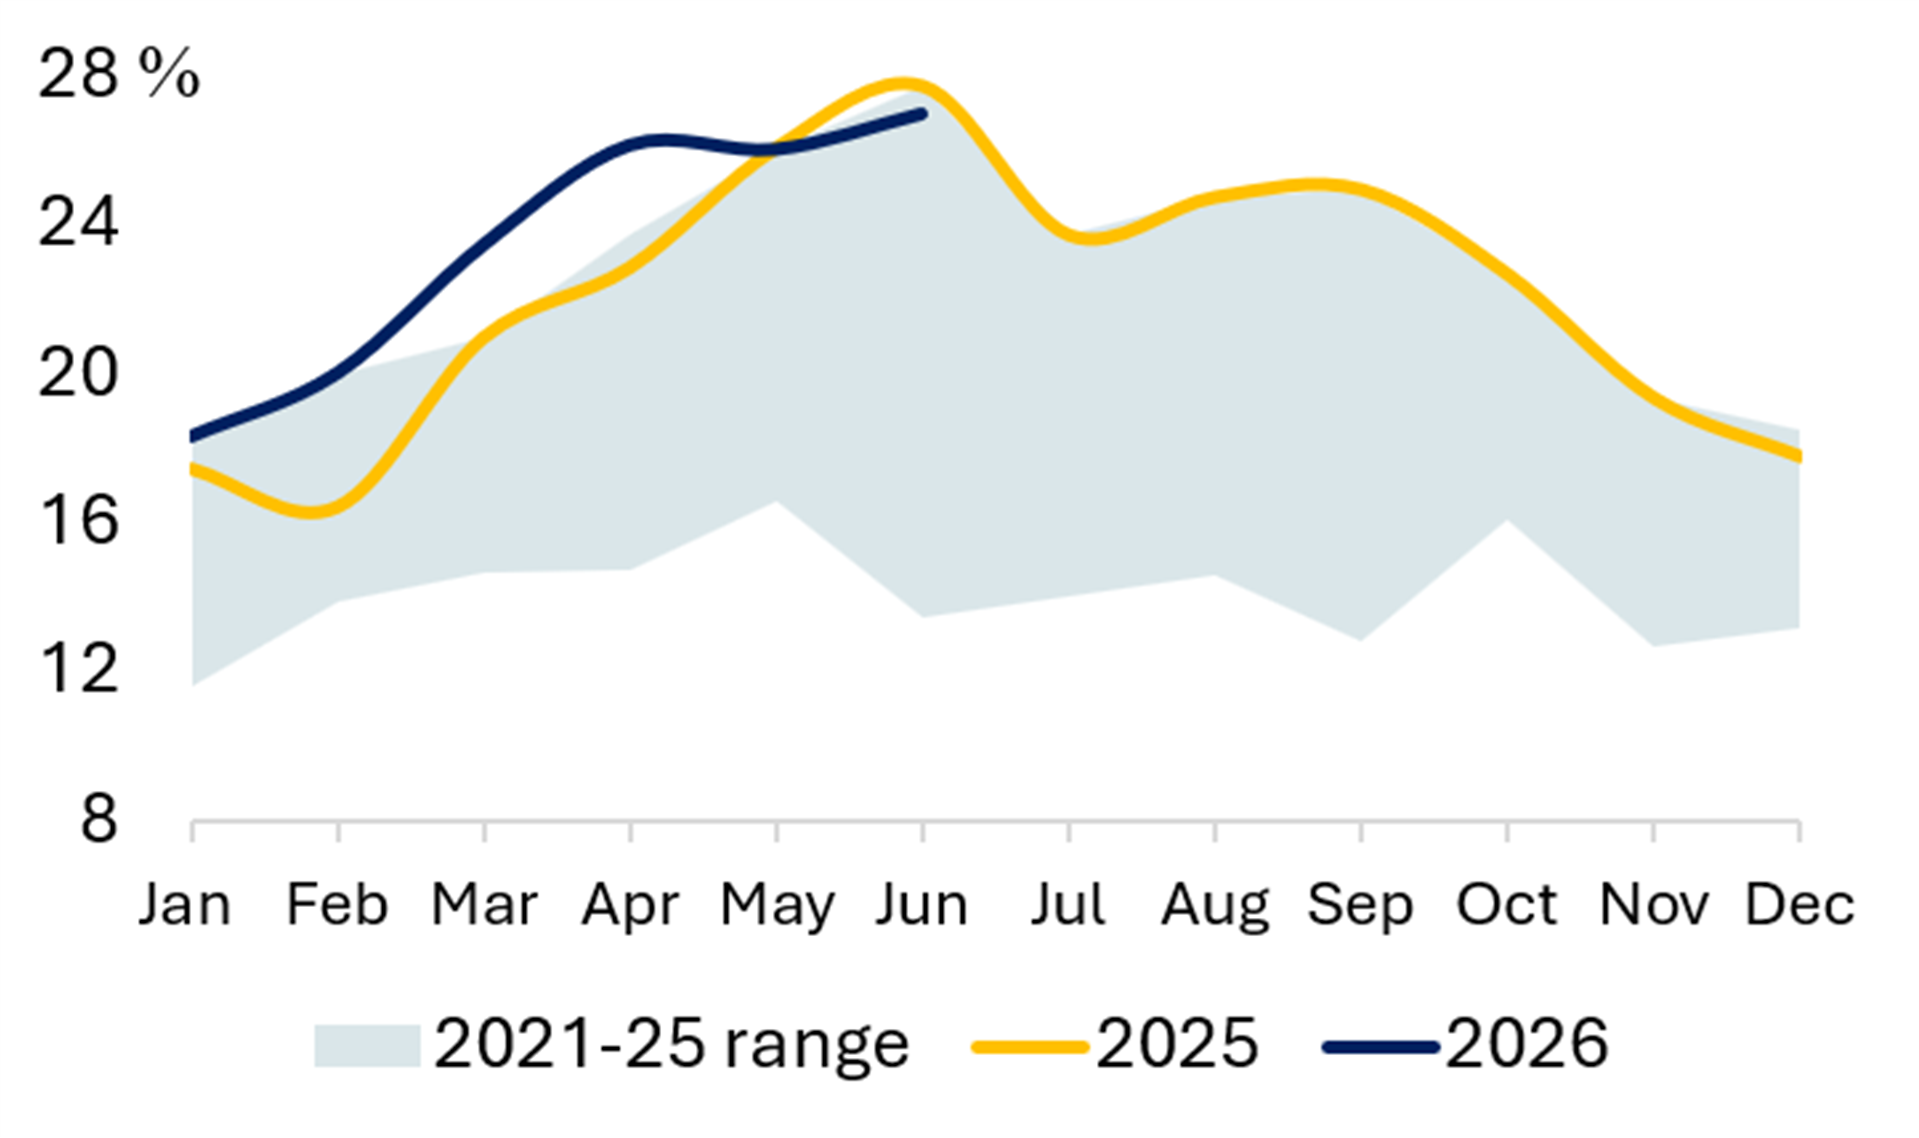

Exhibit 24 Share of Gas (%) Exhibit 25 Share of Nuclear (%)
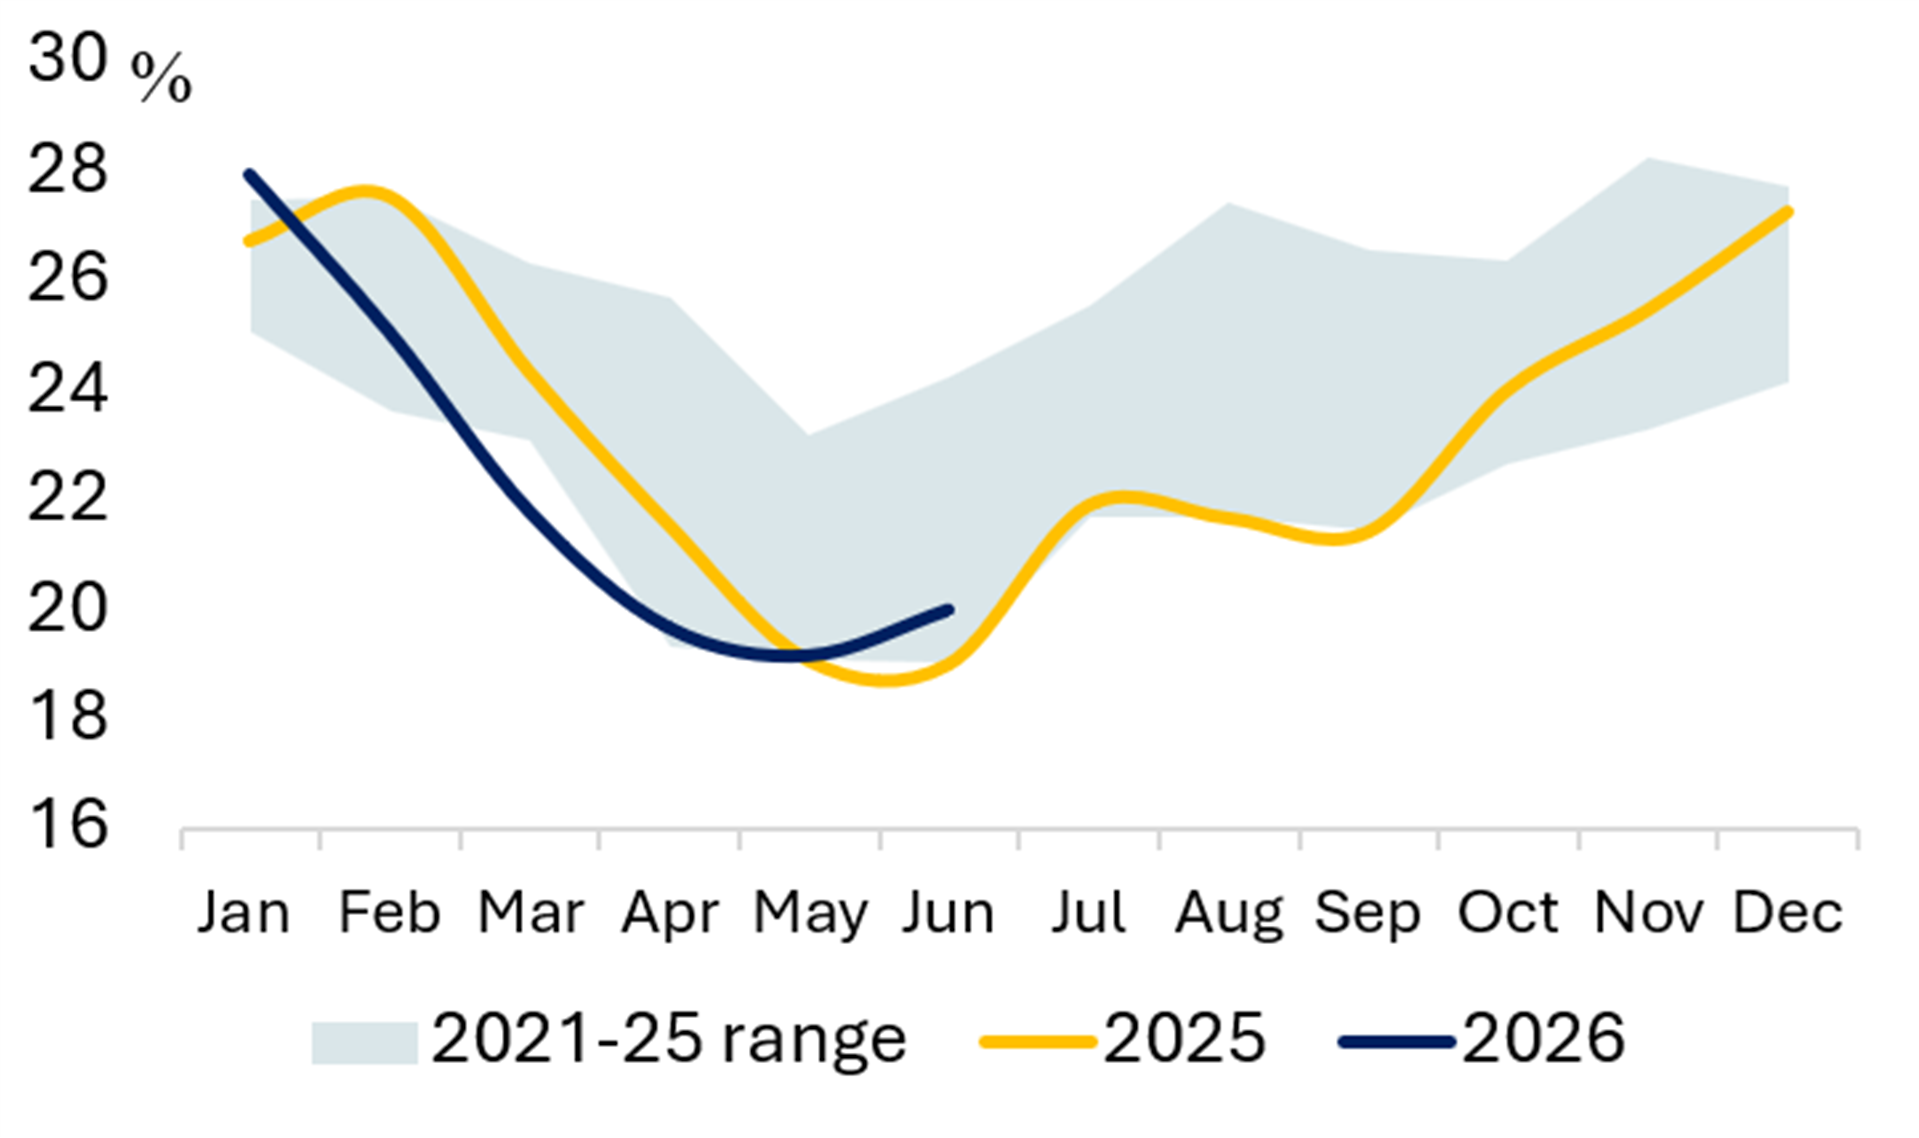
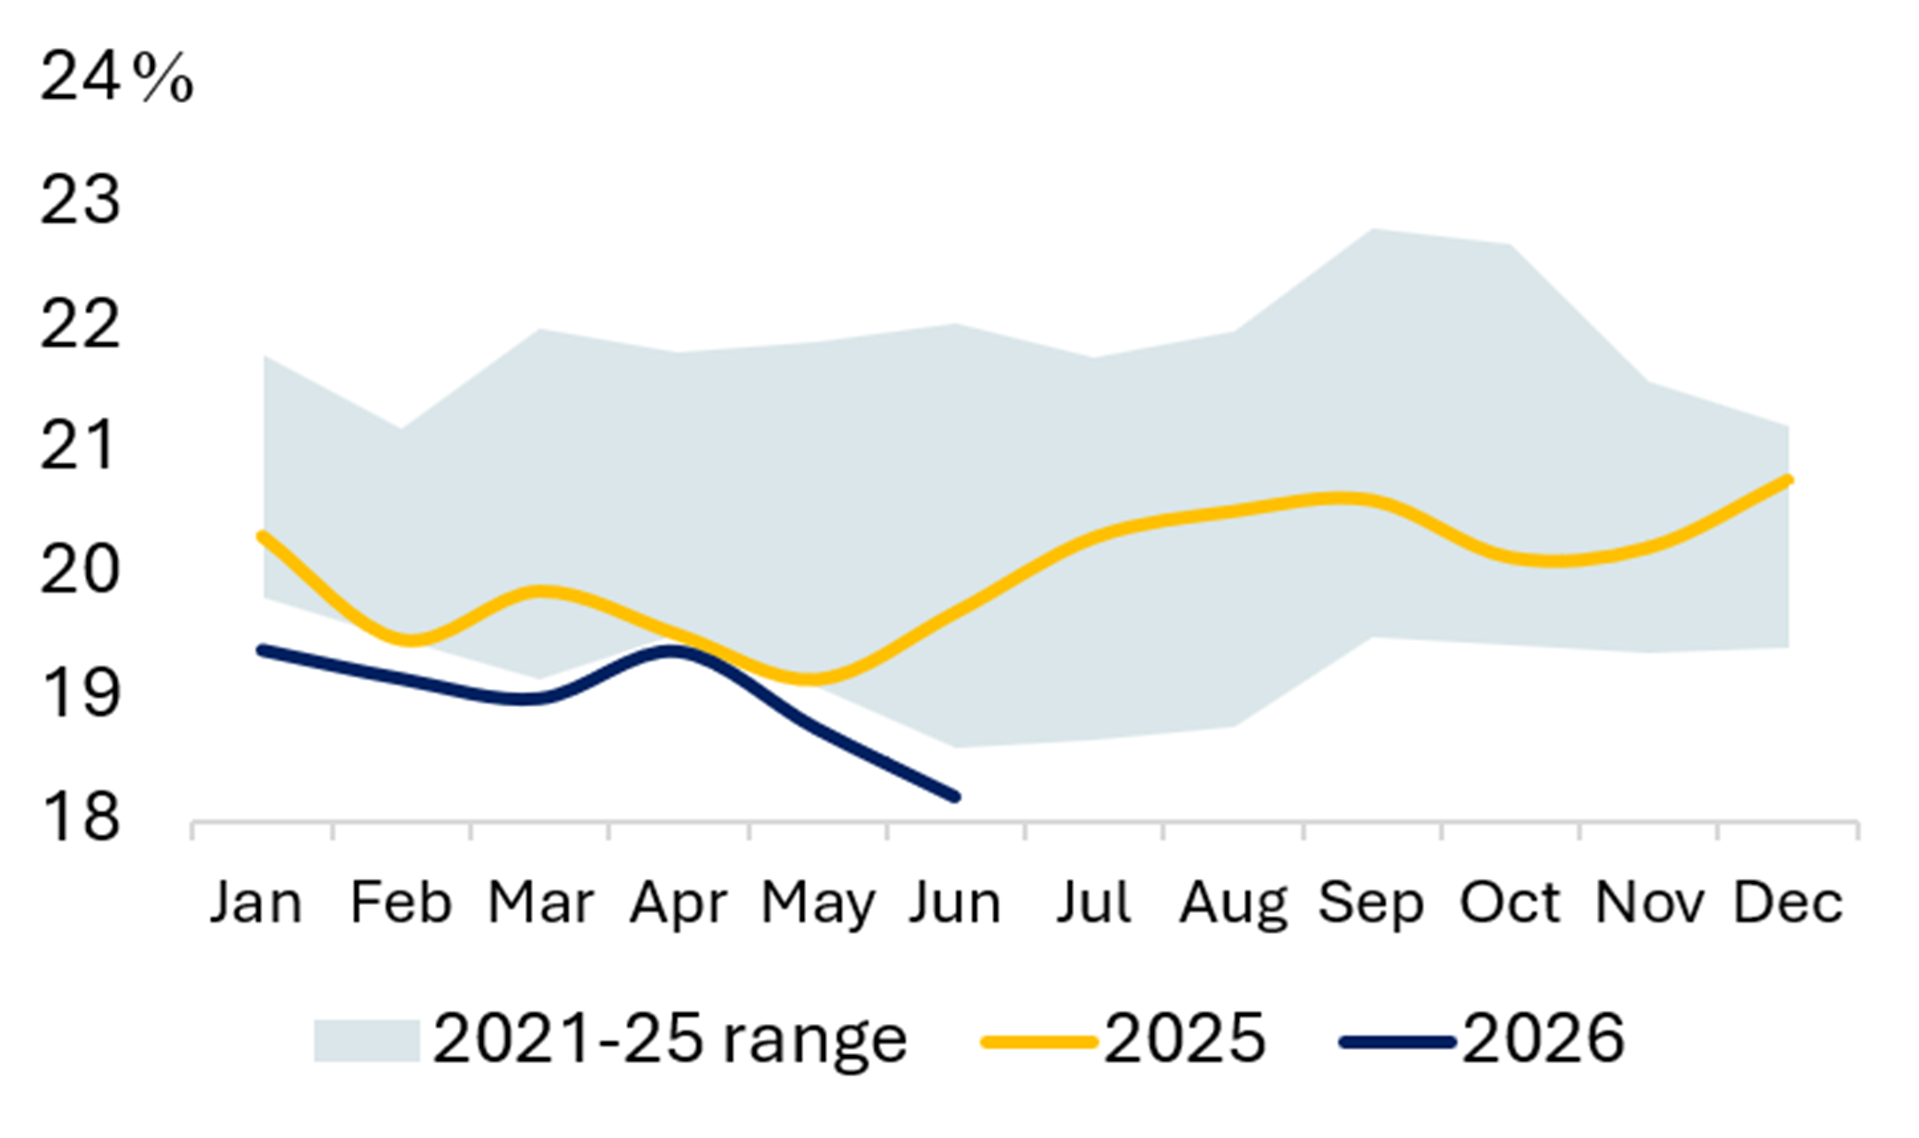

Source: EMBER
USA
Exhibit 26 USA: Biggest Source of Electricity in each State
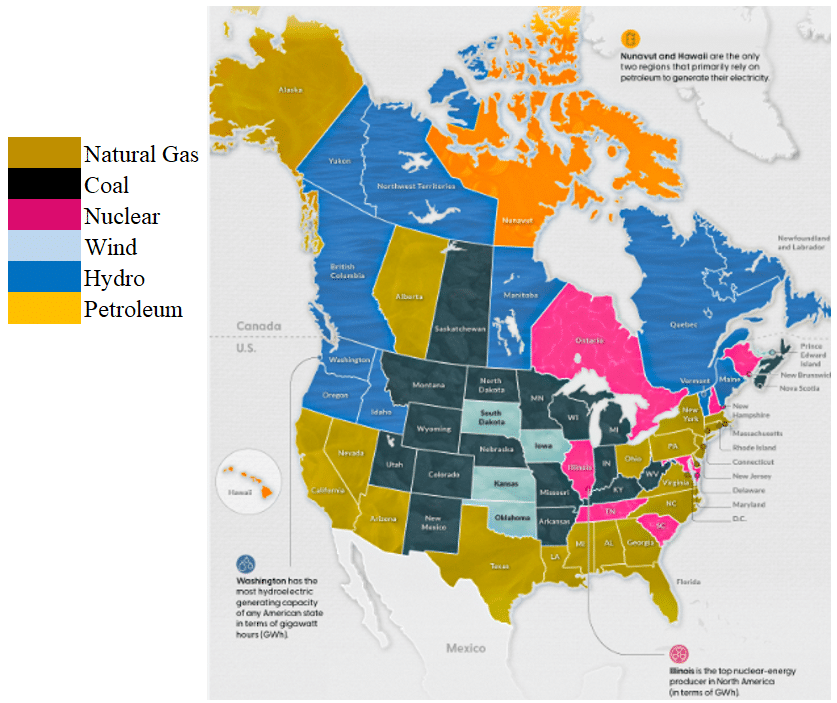
Exhibit 27 Power Generation Exhibit 28 Share of Gas (%) 
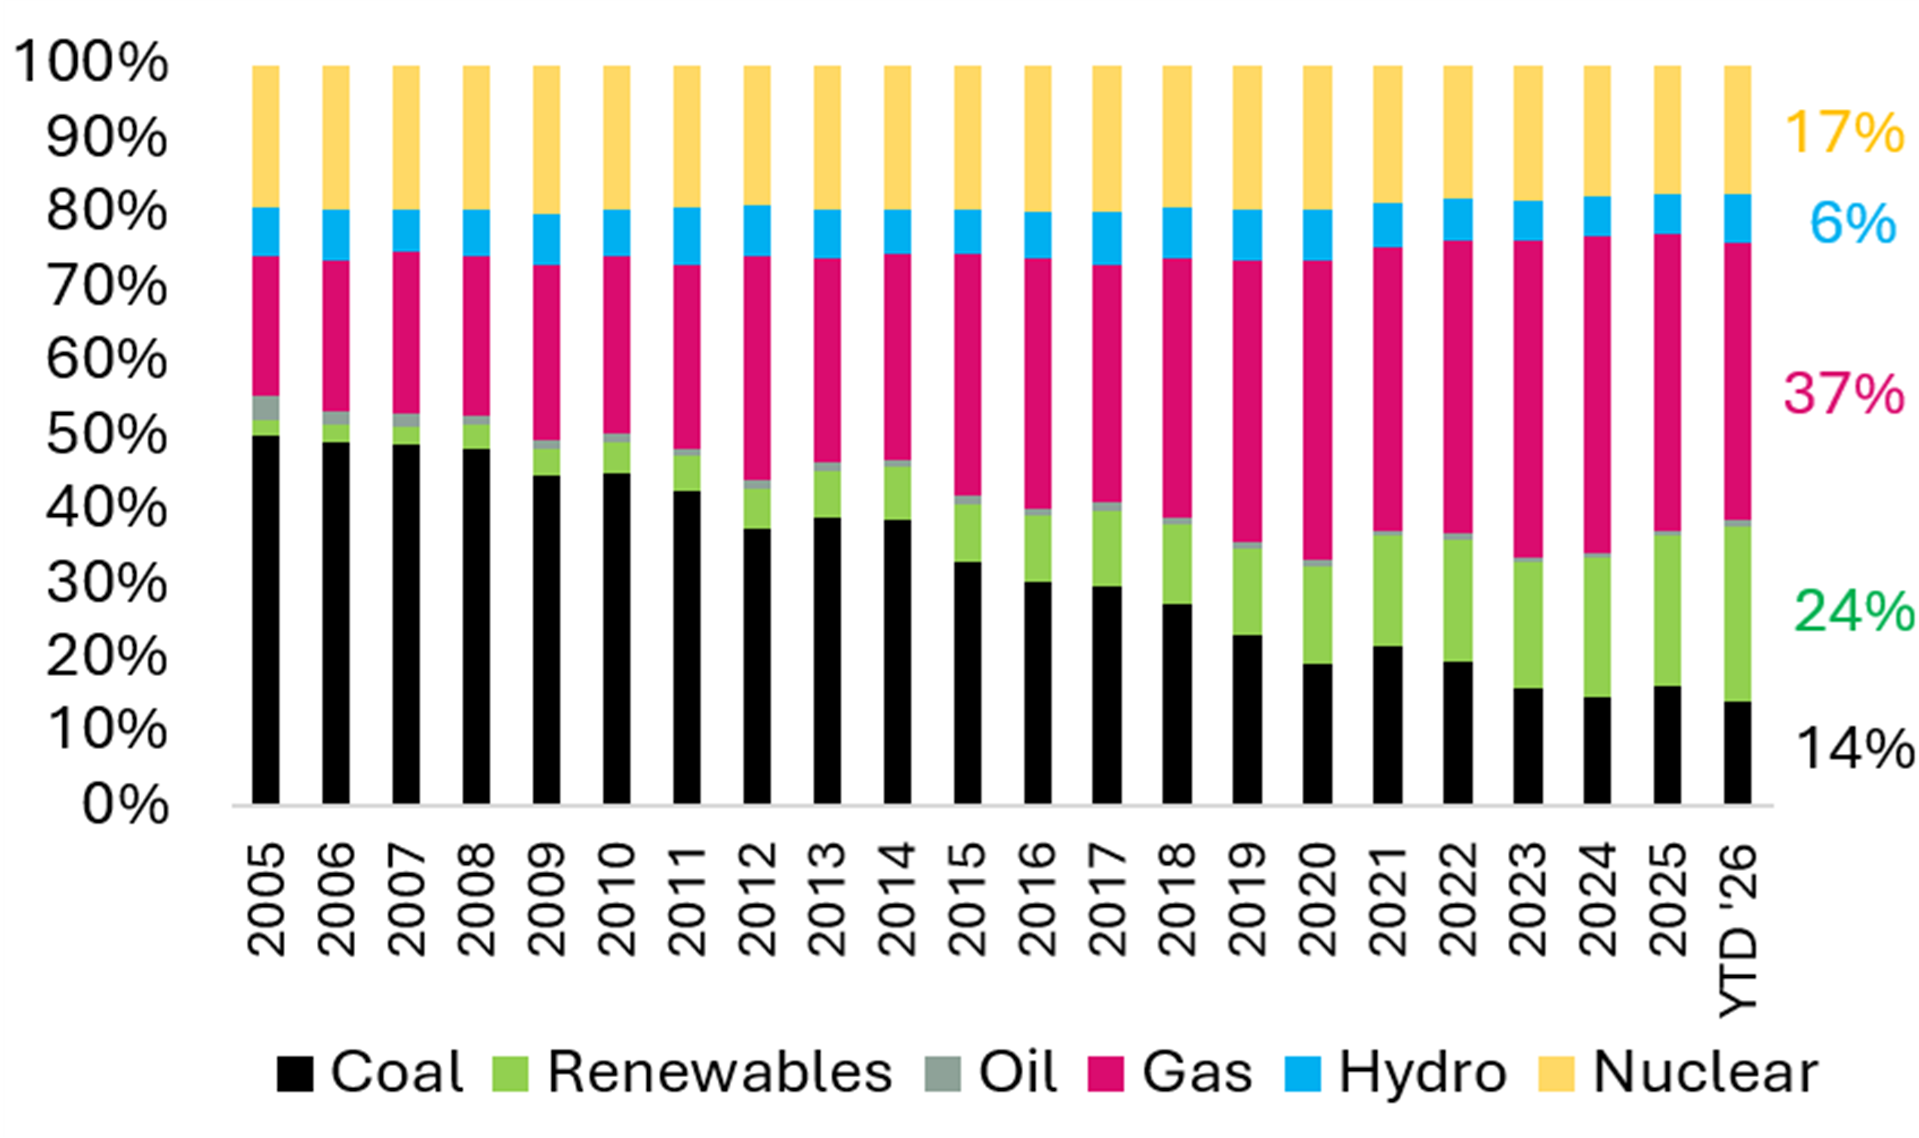
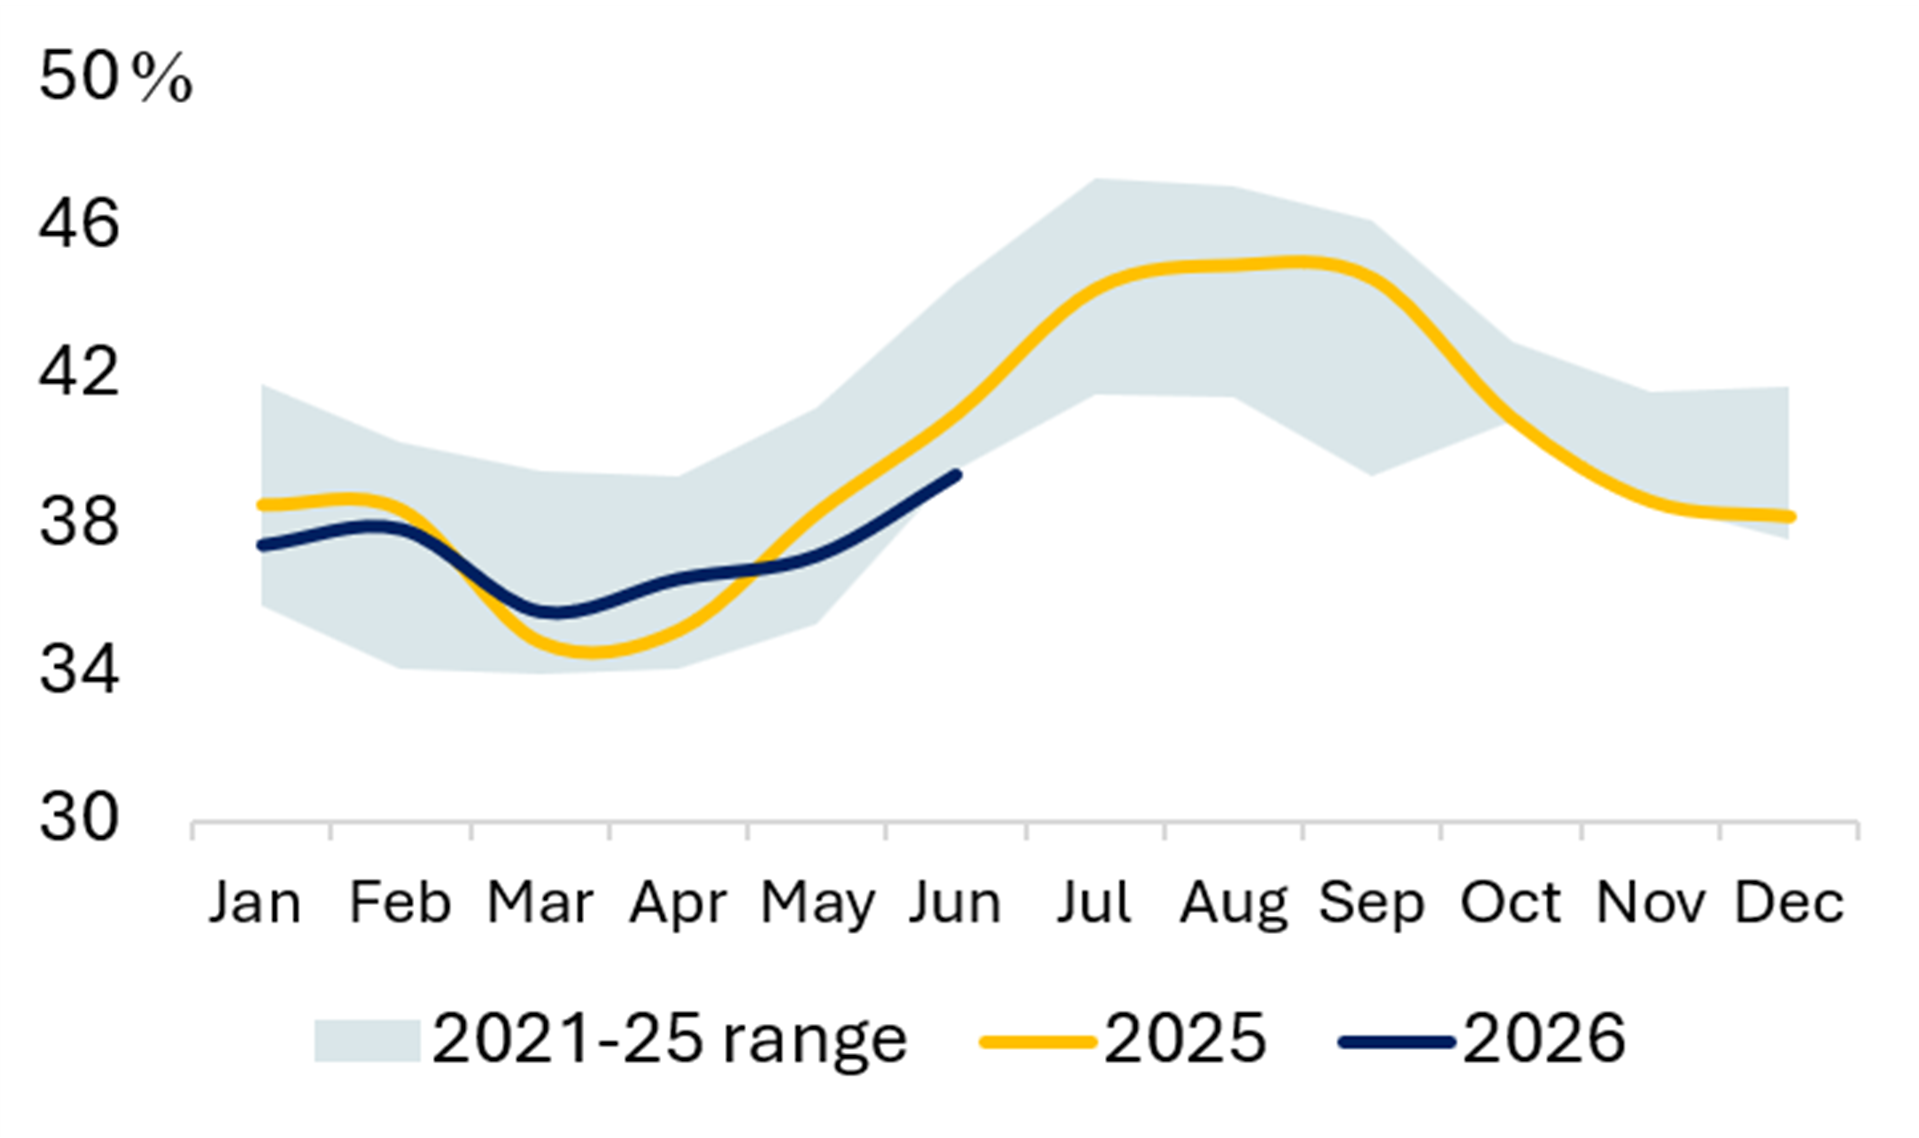

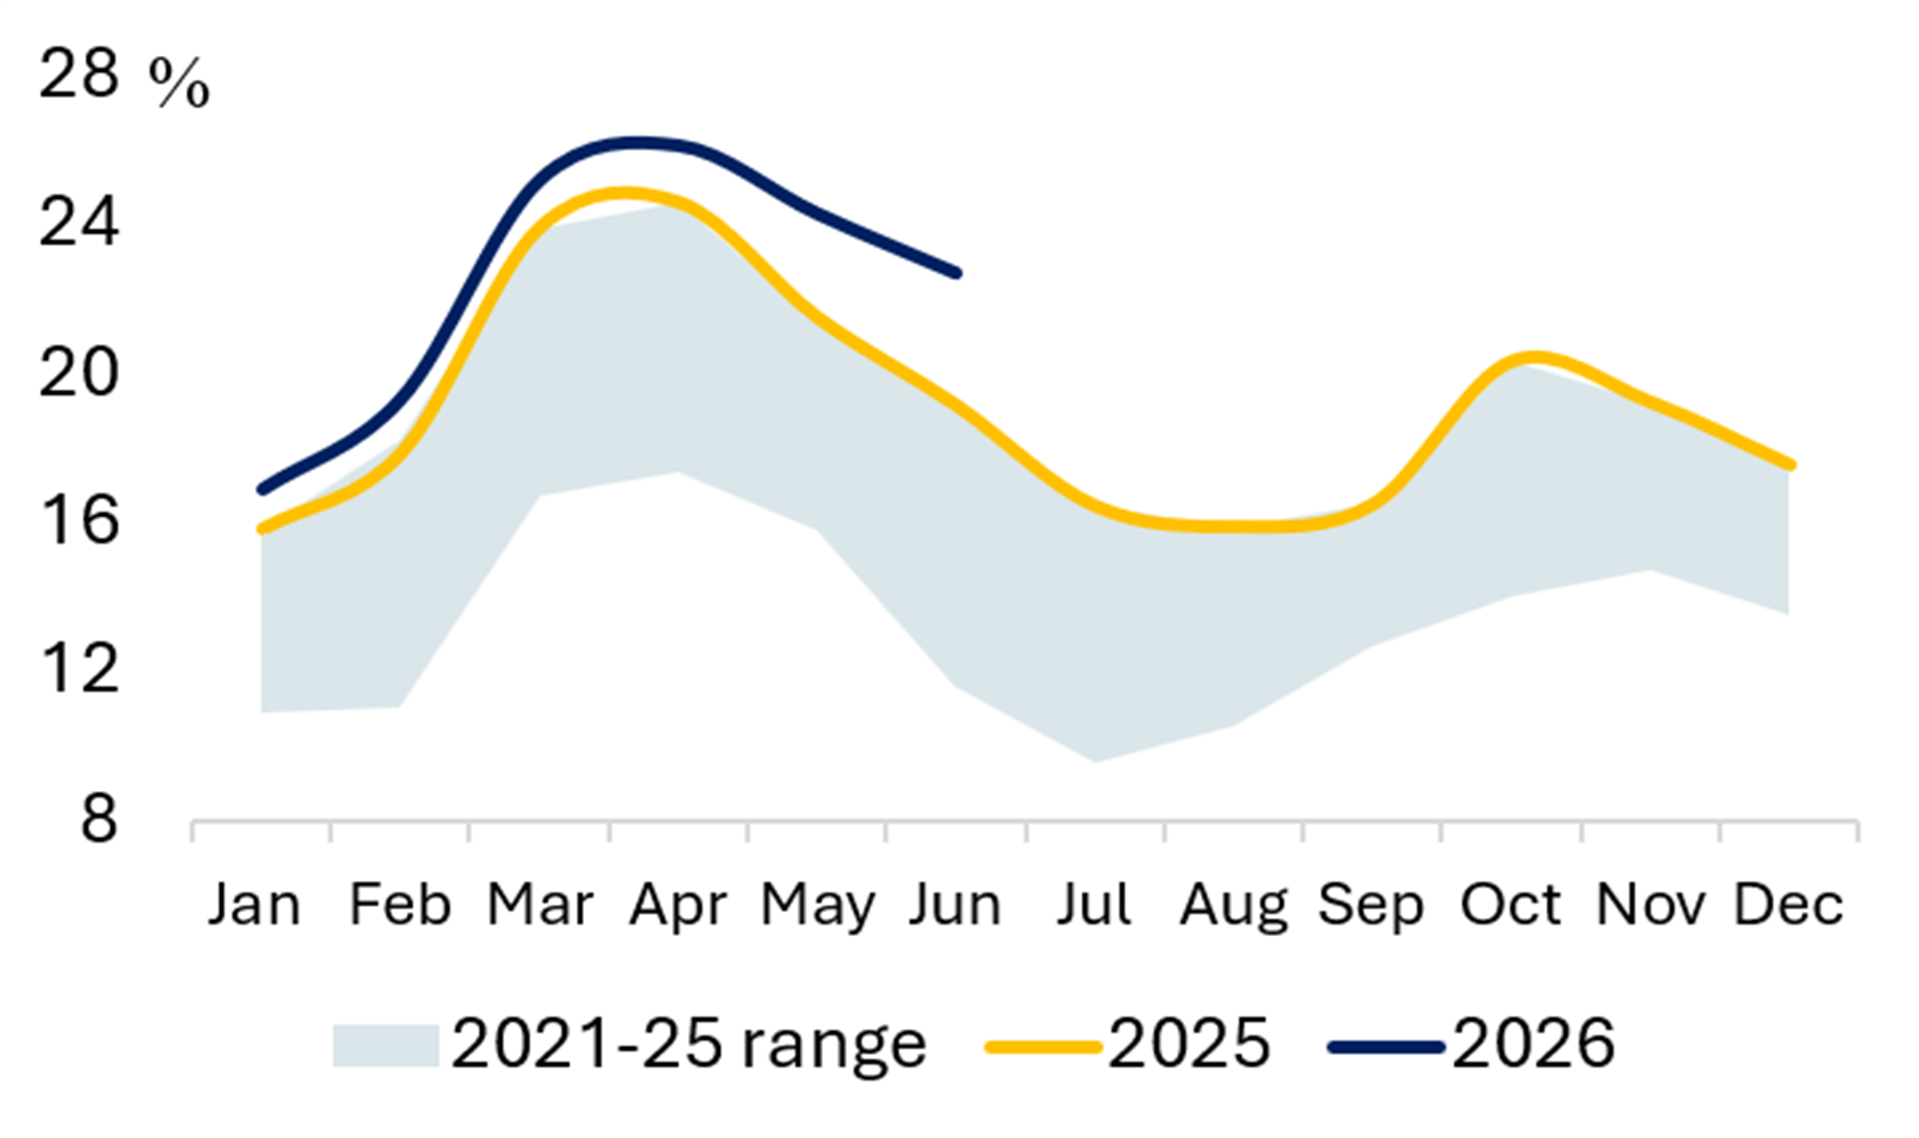
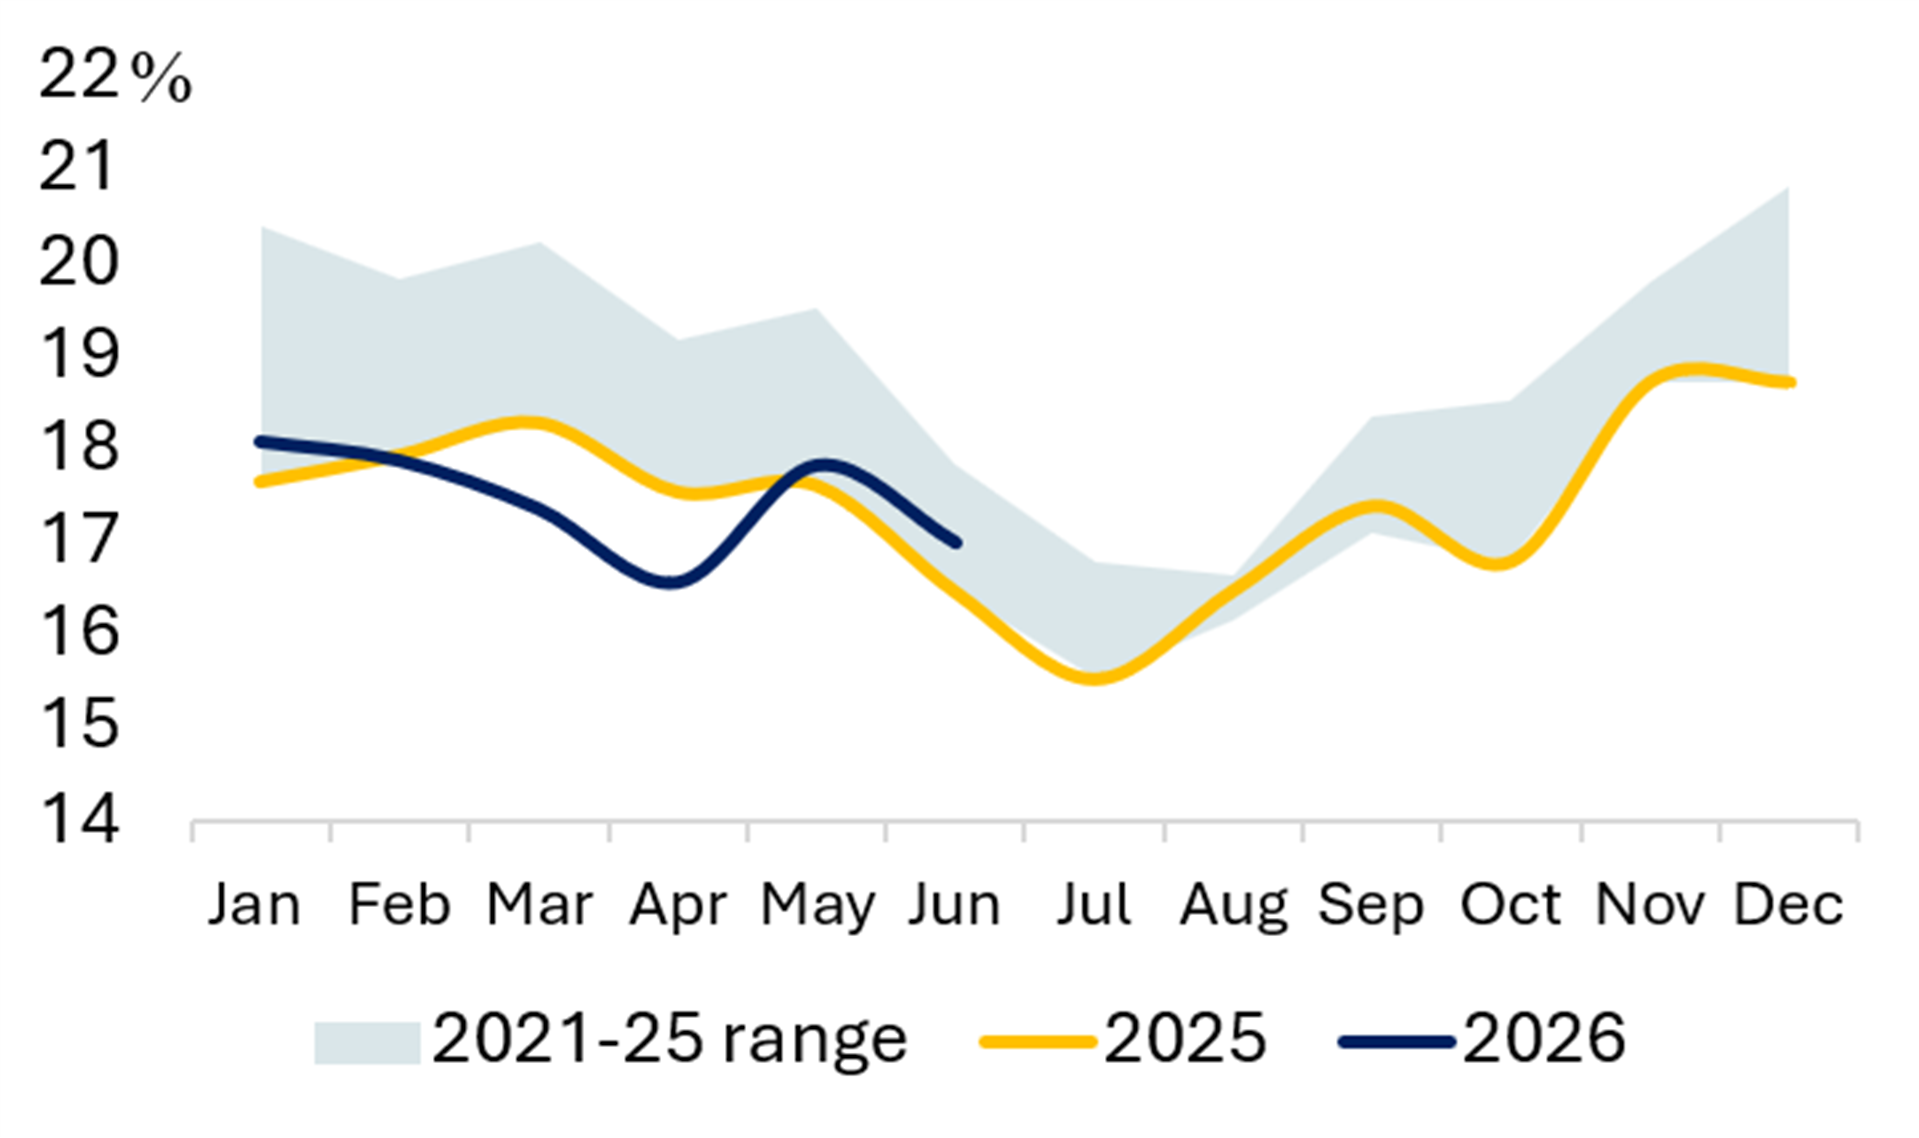
Exhibit 29 Share of Wind & Solar (%) Exhibit 30 Share of Nuclear (%) 

Source: EMBER
TÜRKIYE
Exhibit 31 Power Generation Exhibit 32 Share of Coal (%) 
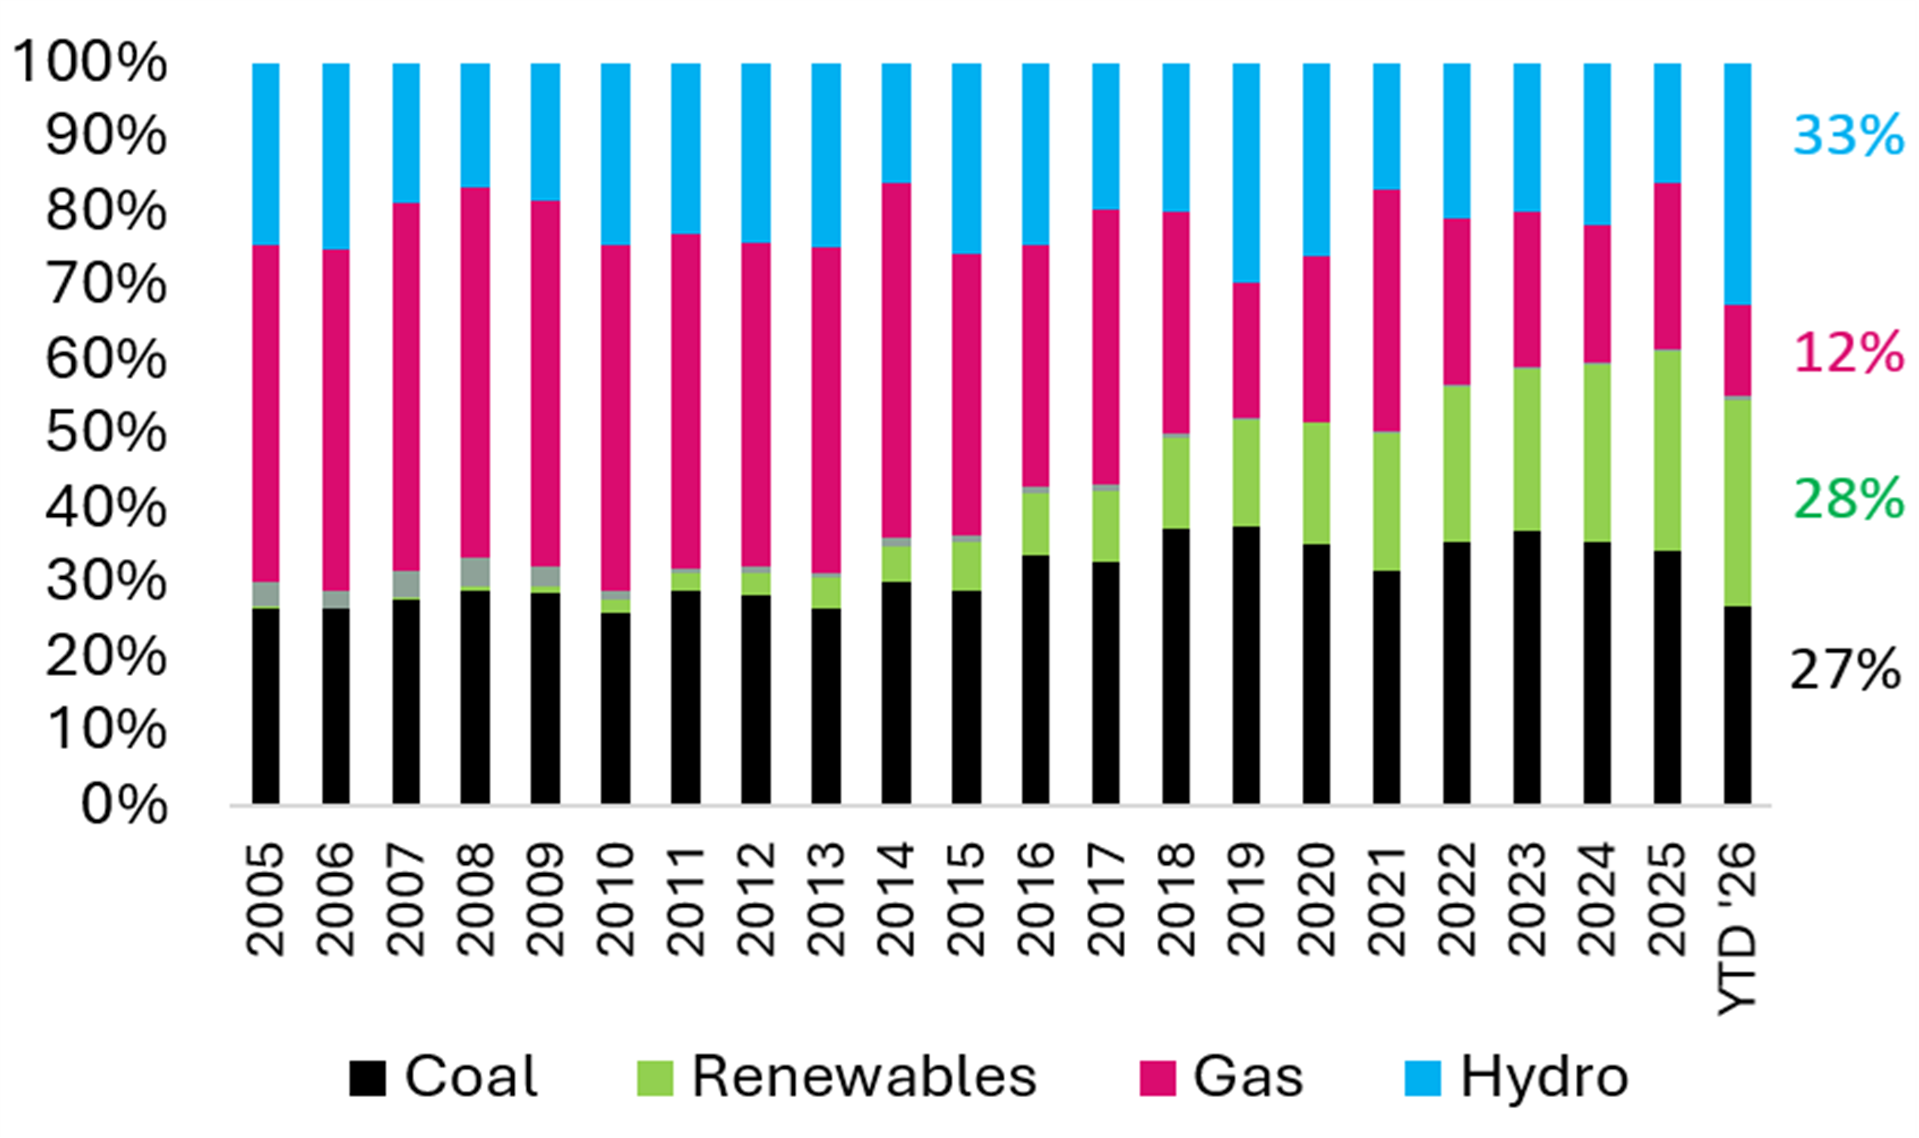
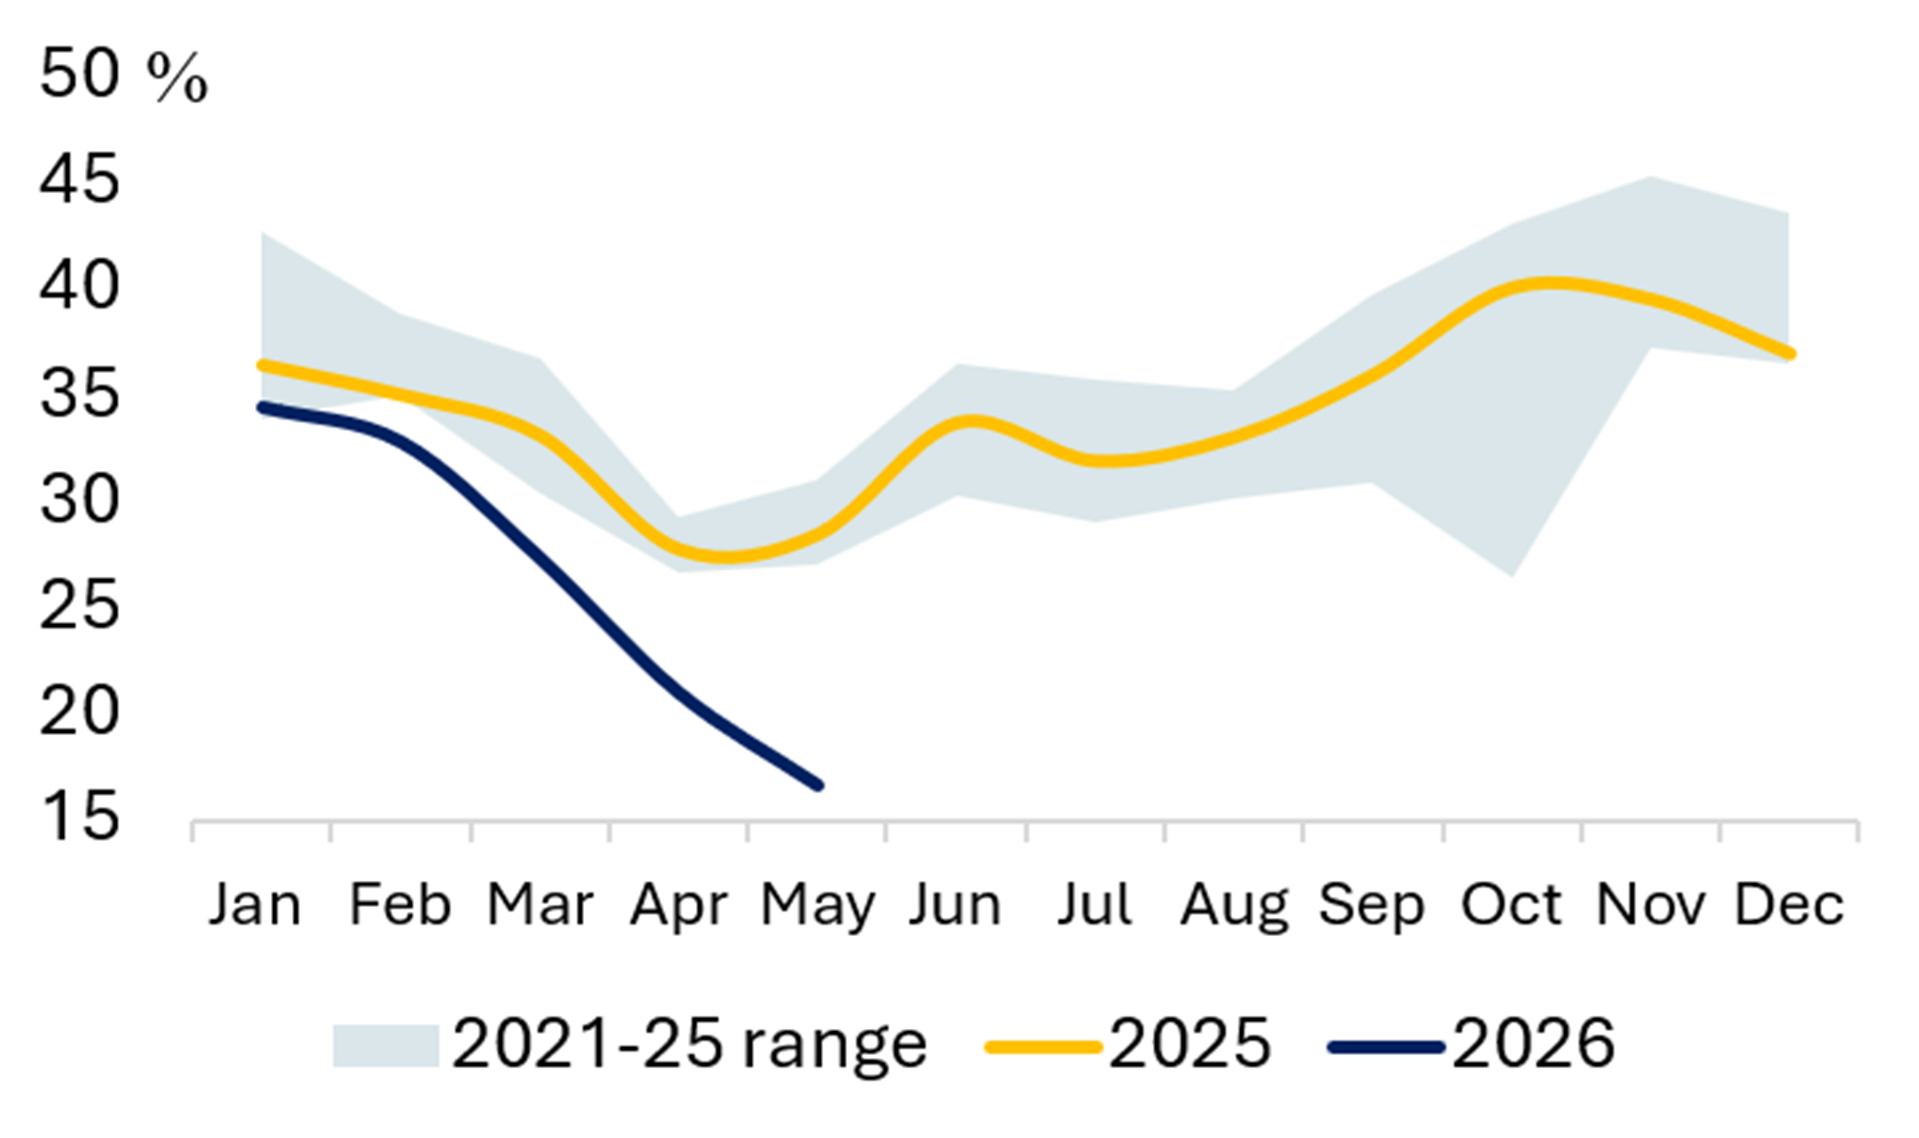

Exhibit 33 Share of Wind & Solar (%) Exhibit 34 Share of Hydro (%) 
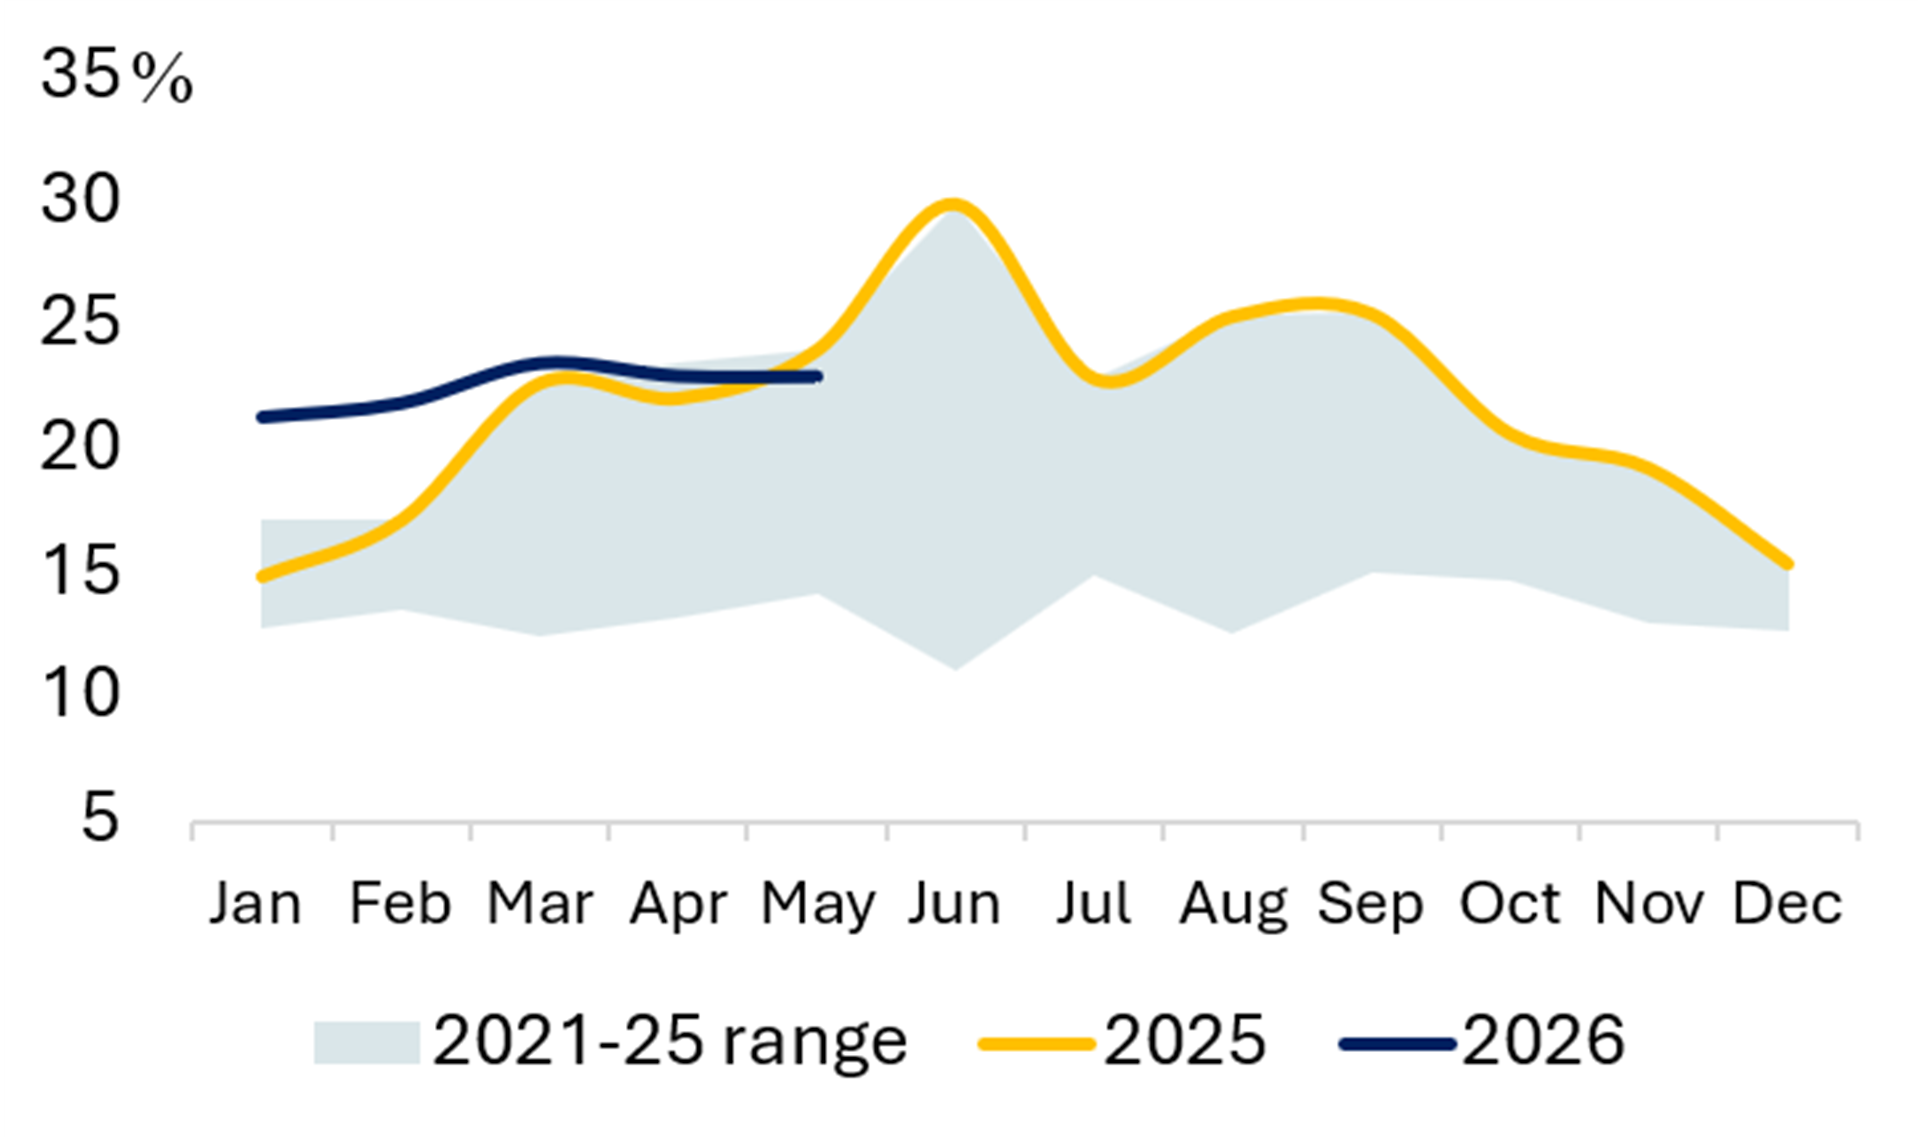
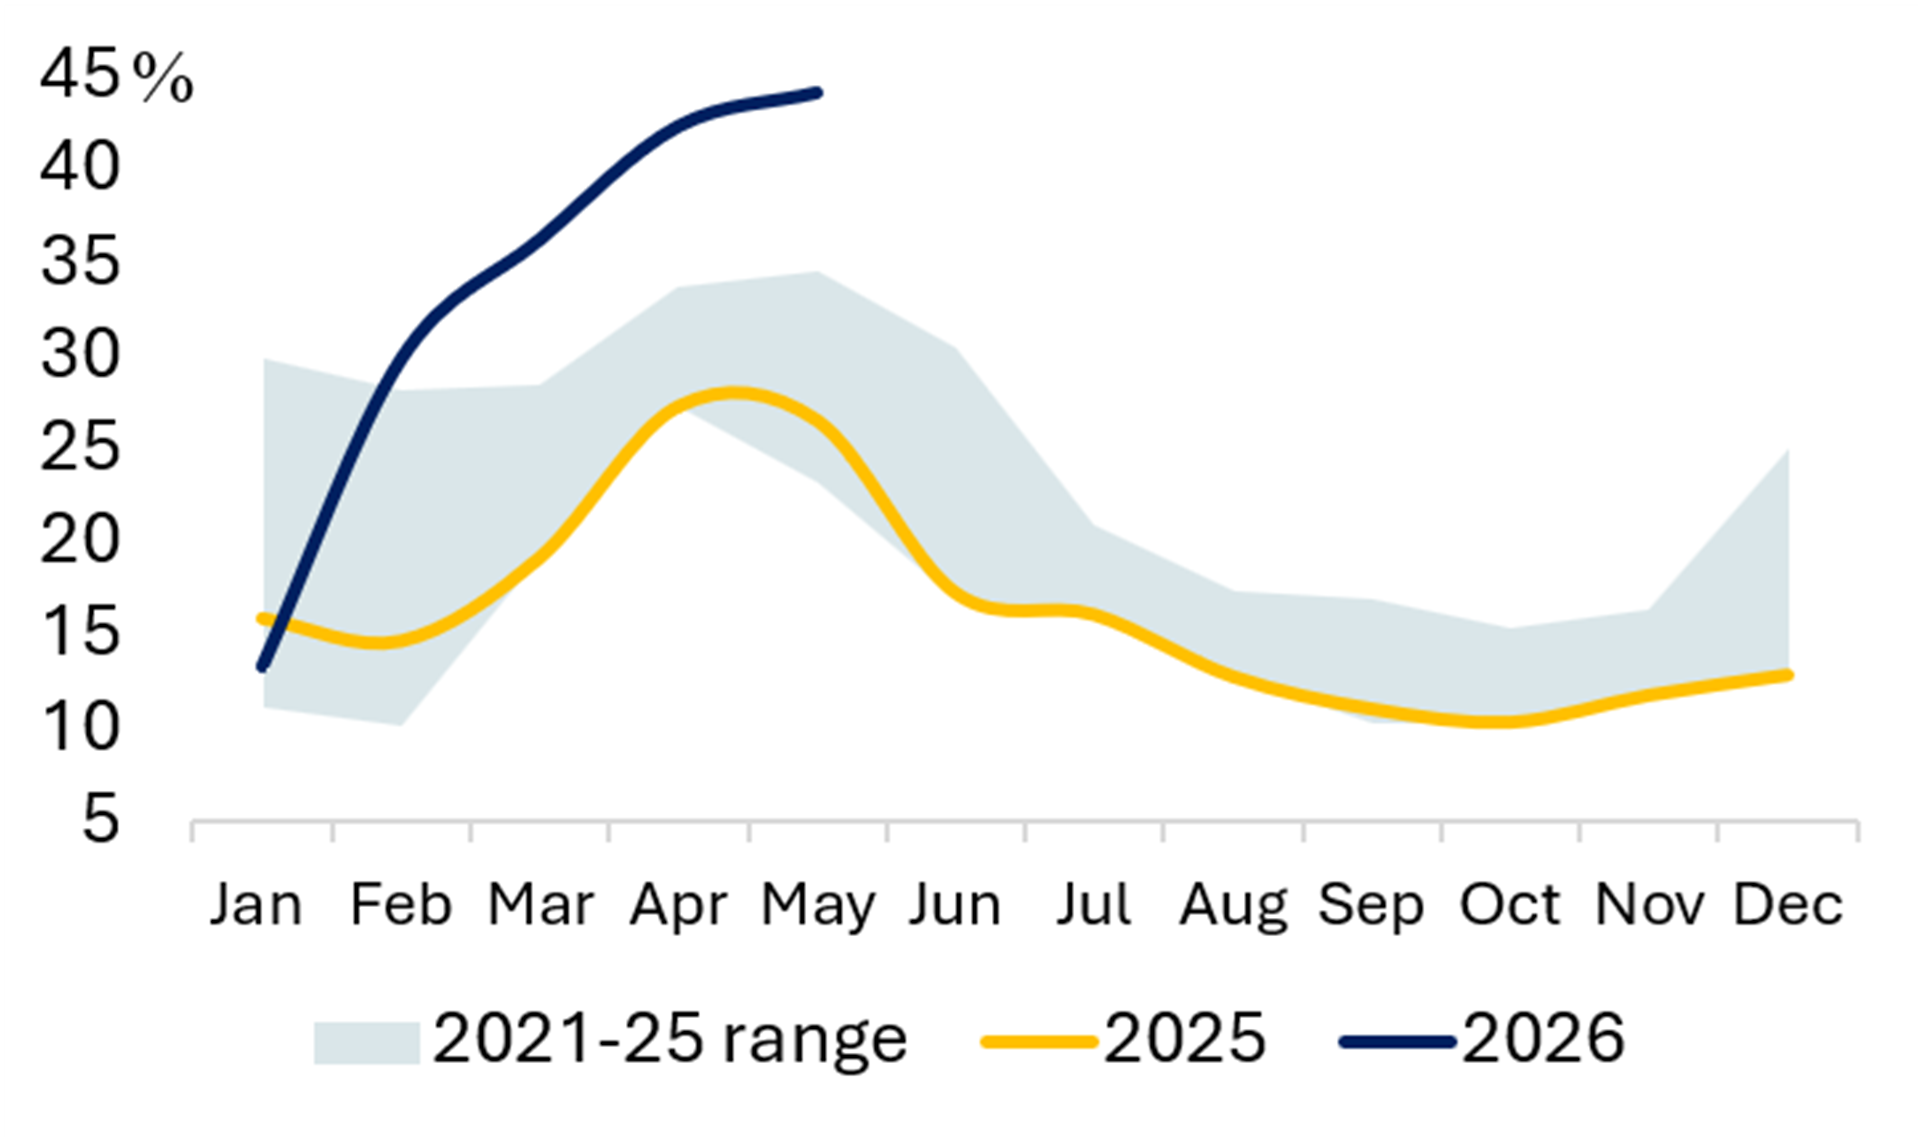

INDIA
Exhibit 35 Power Generation Exhibit 36 Share of Coal (%) 

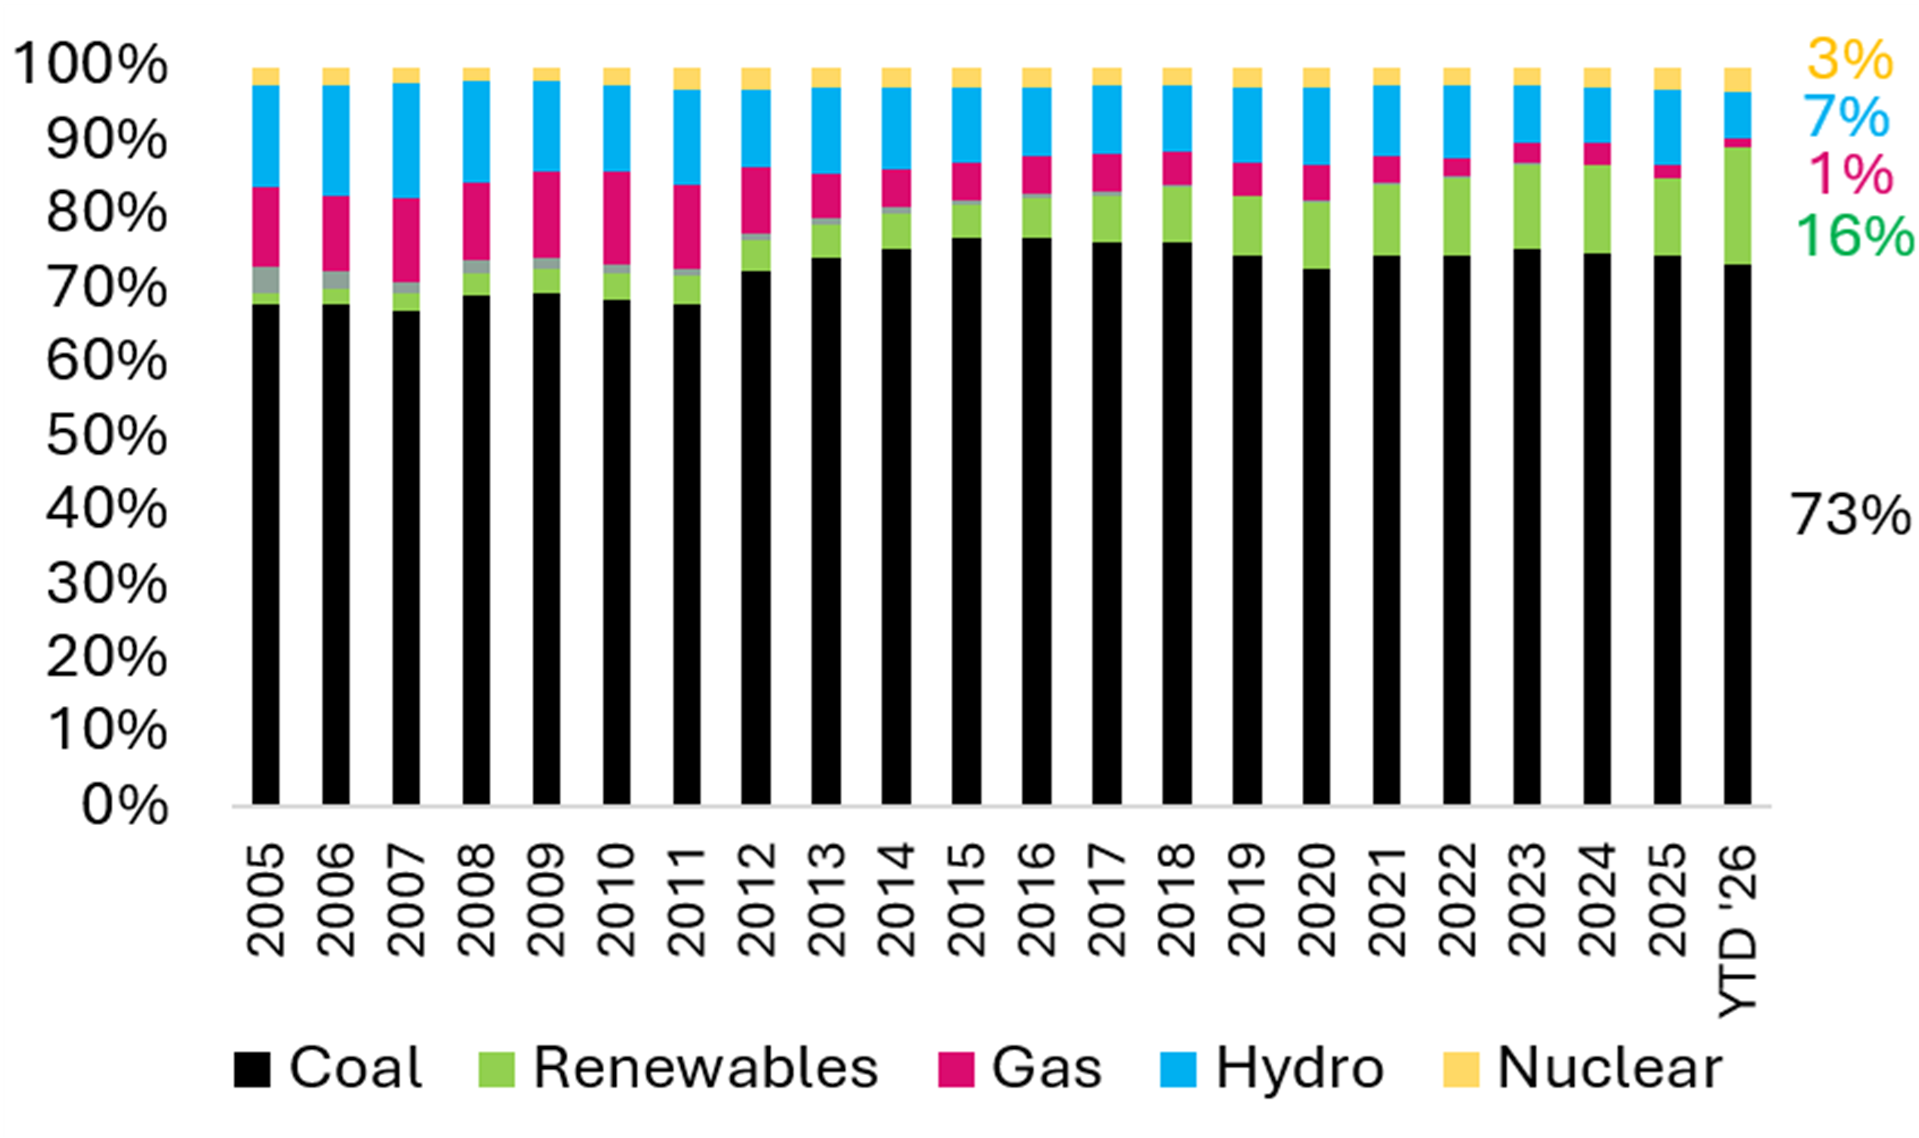
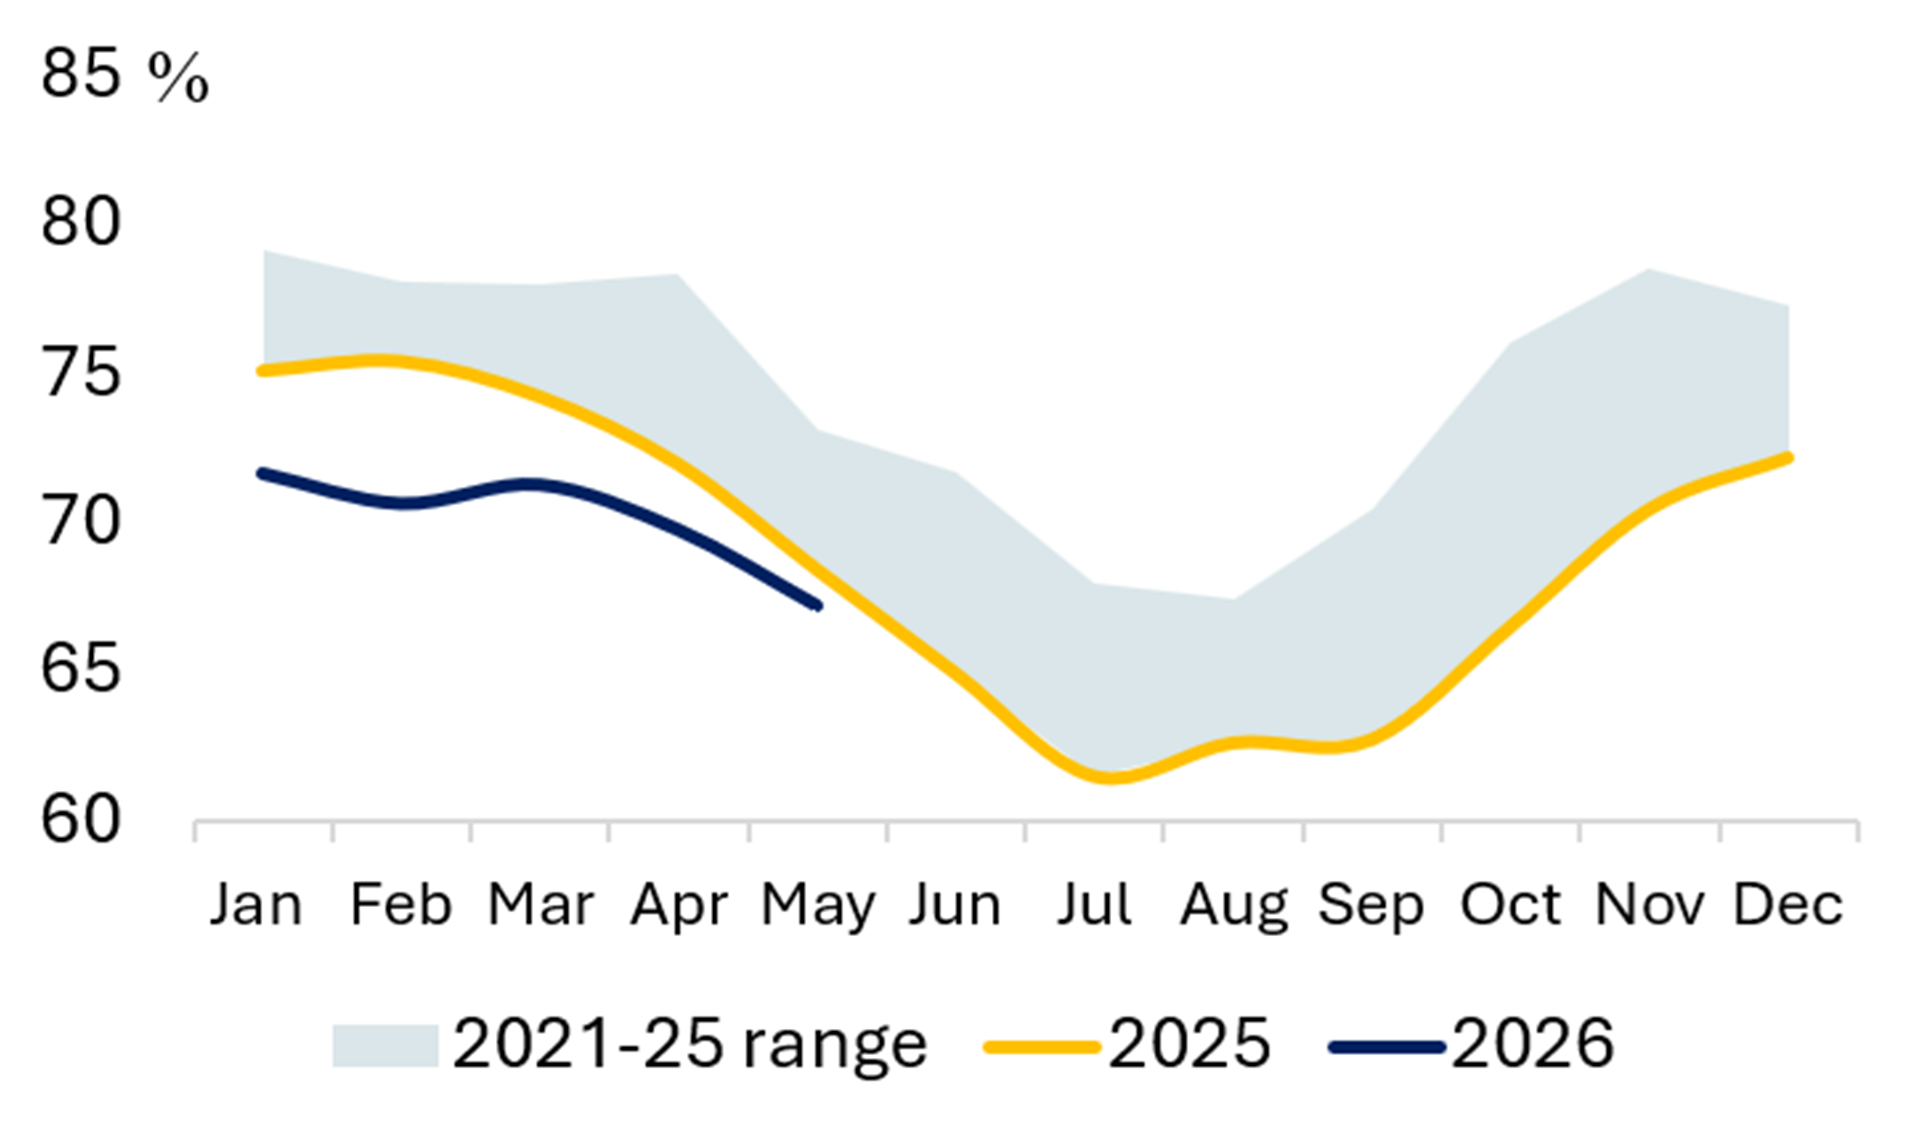
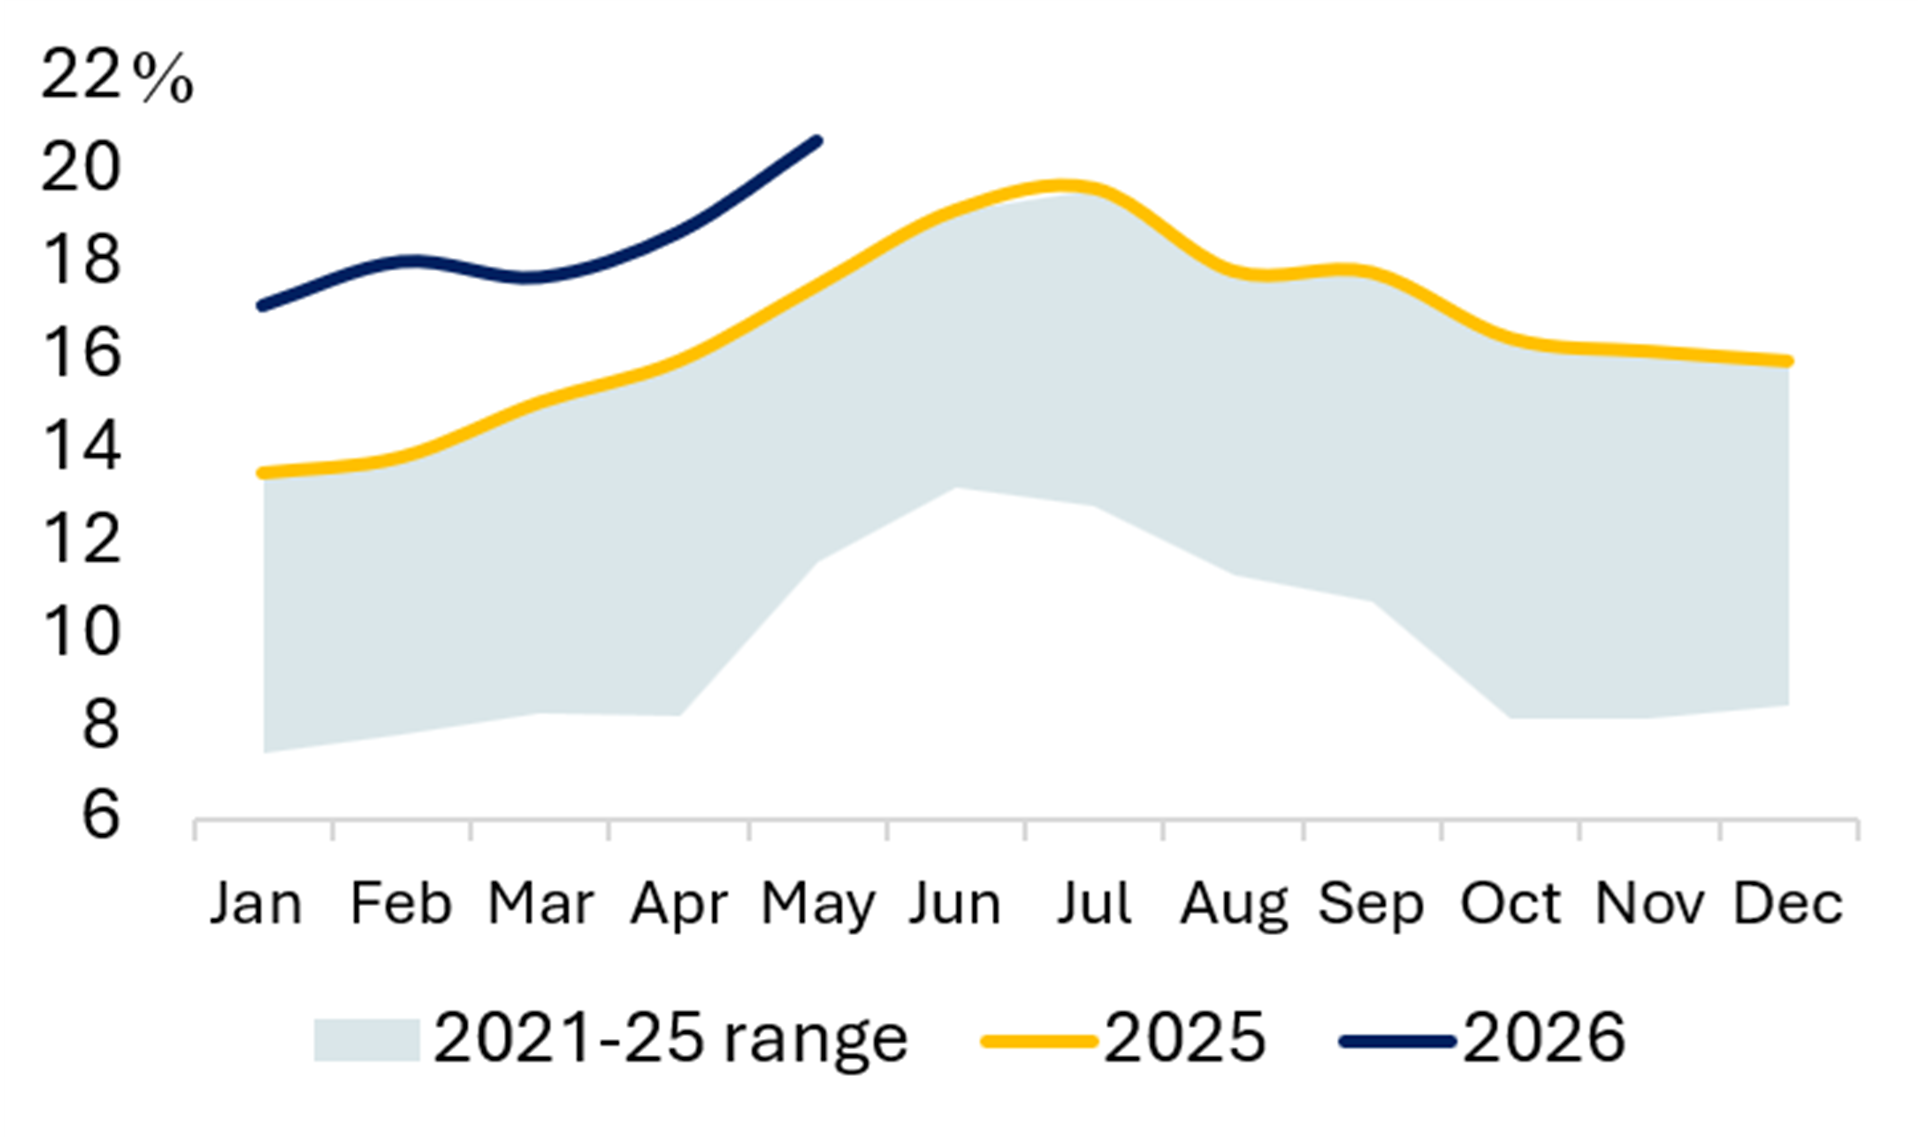
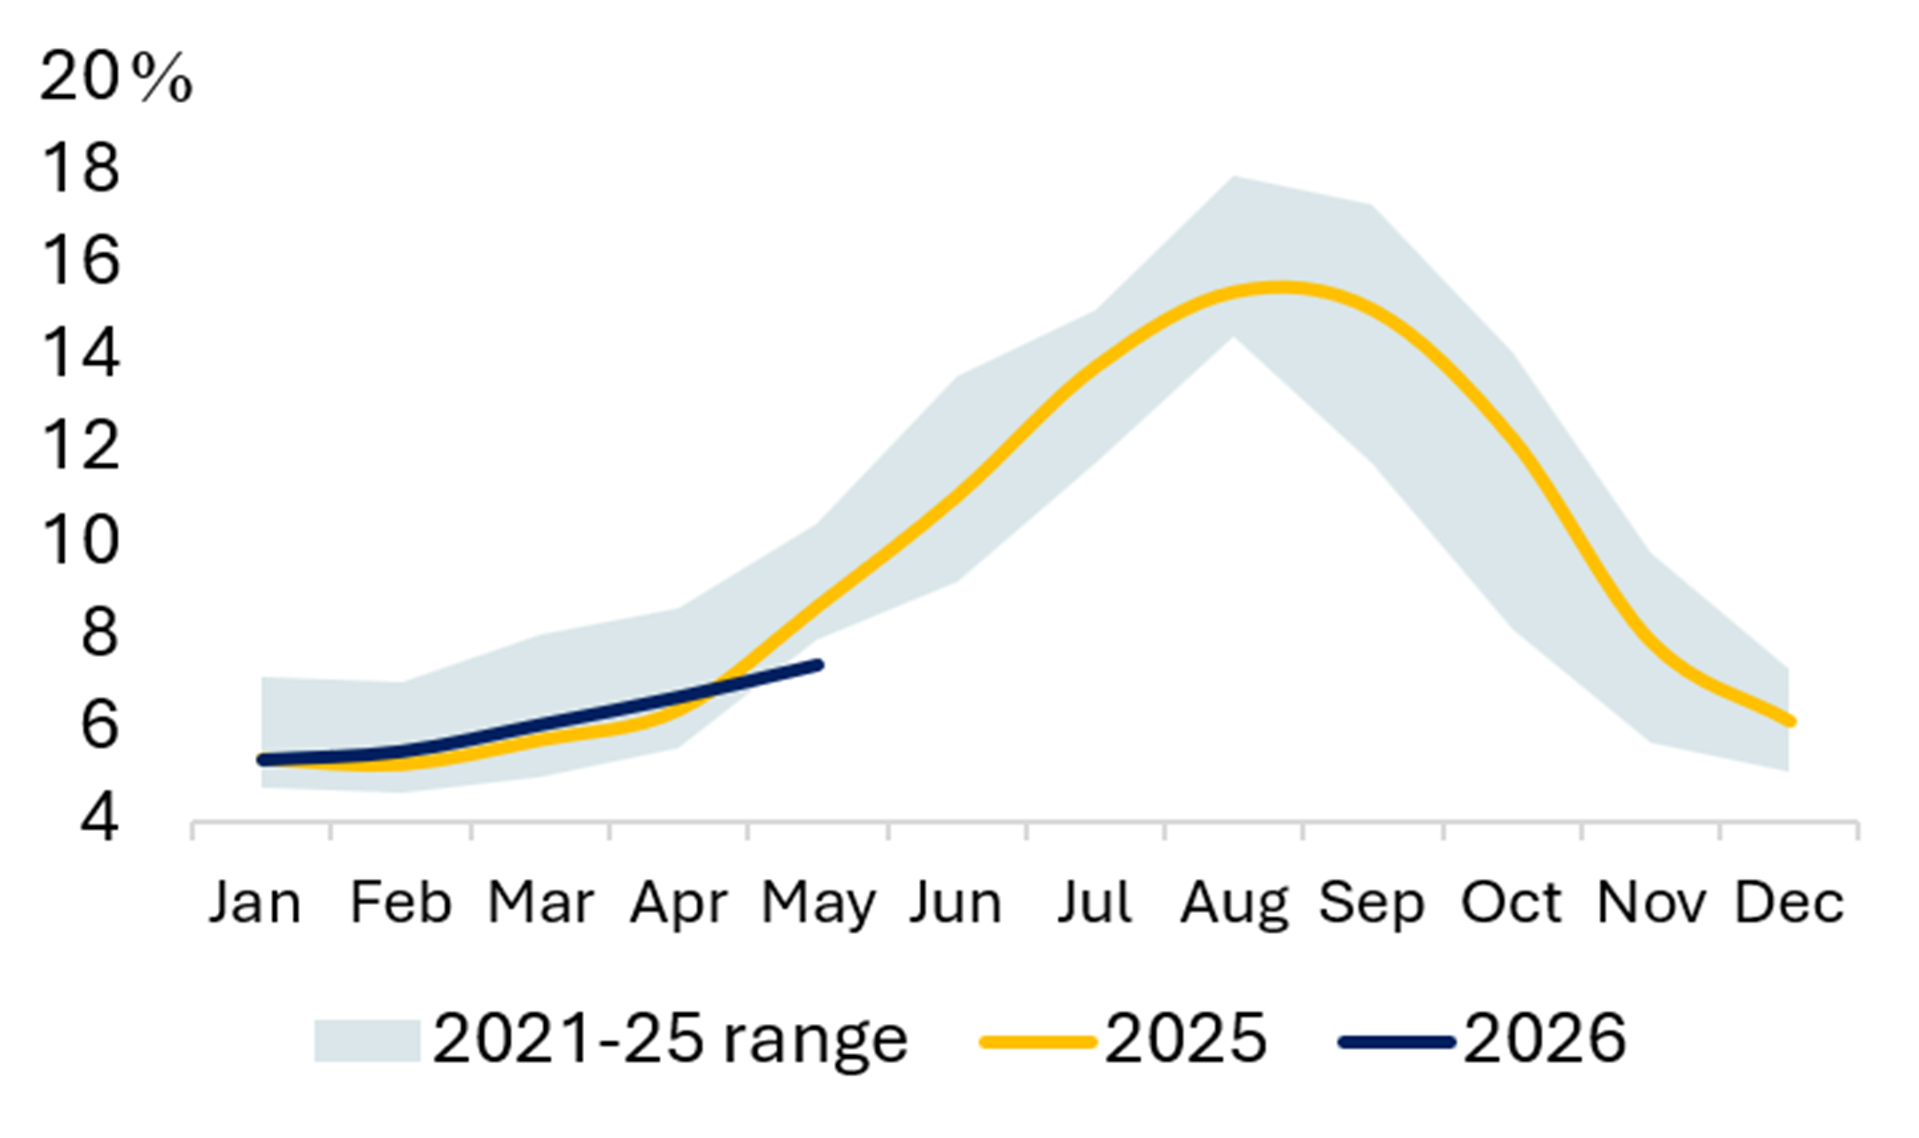
Exhibit 37 Share of Wind & Solar (%) Exhibit 38 Share of Hydro (%) 

Source: EMBER
CHINA
Exhibit 39 Power Generation Exhibit 40 Share of Coal (%) 

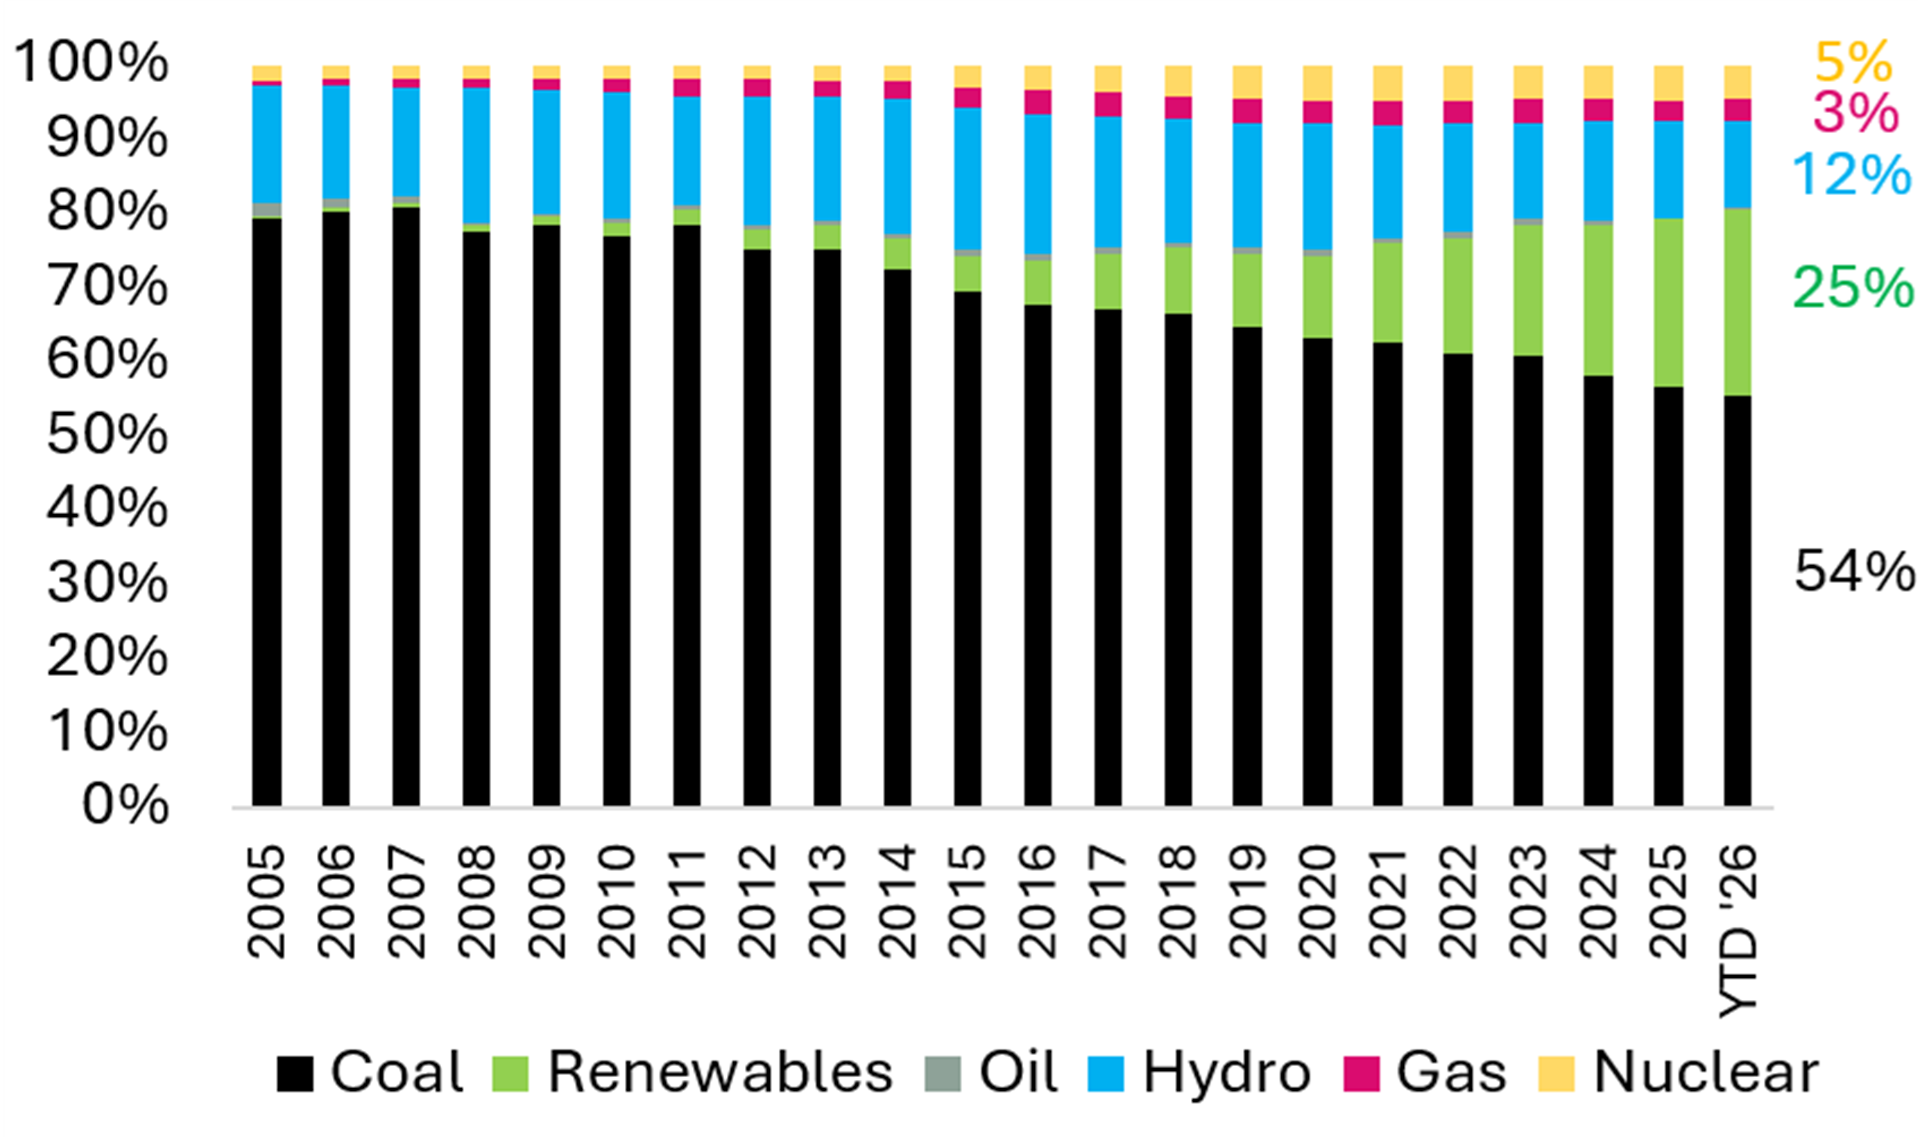
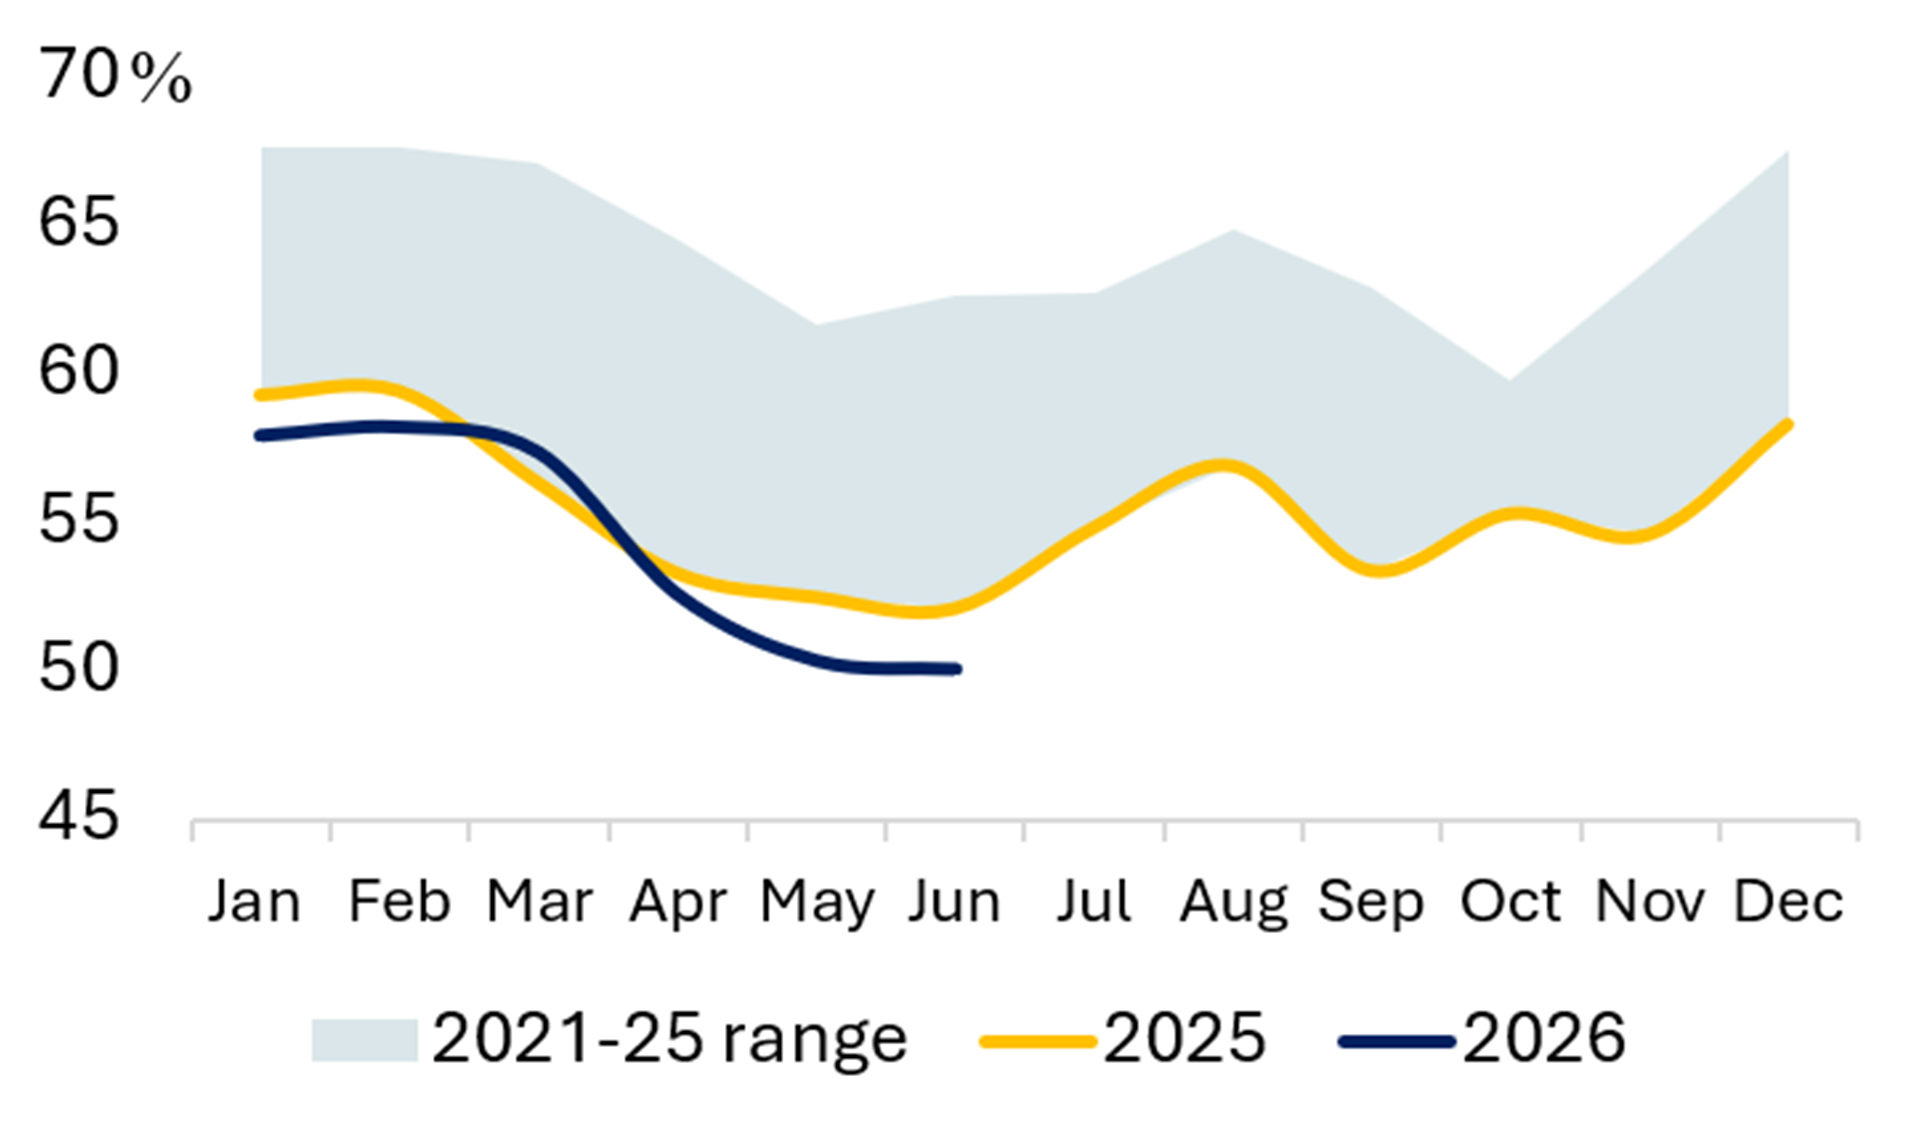
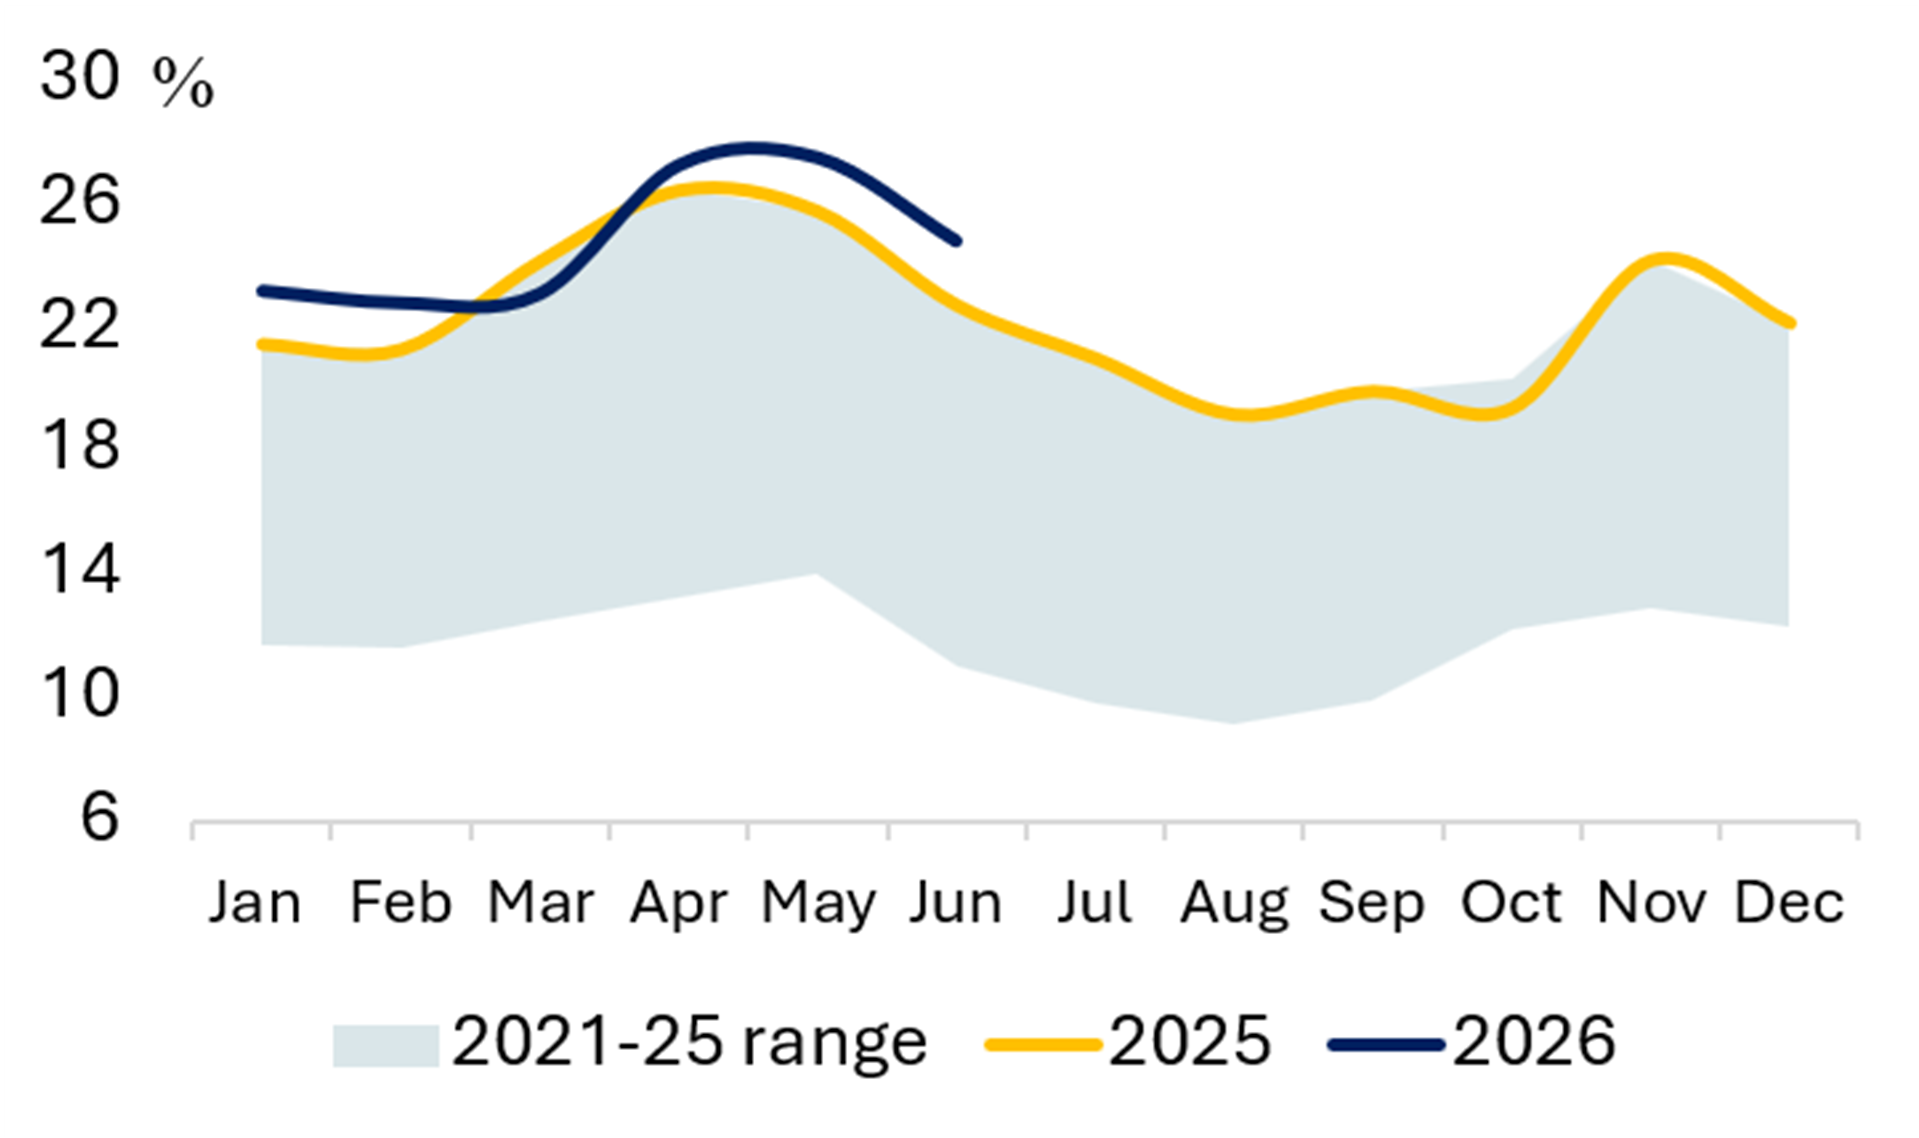
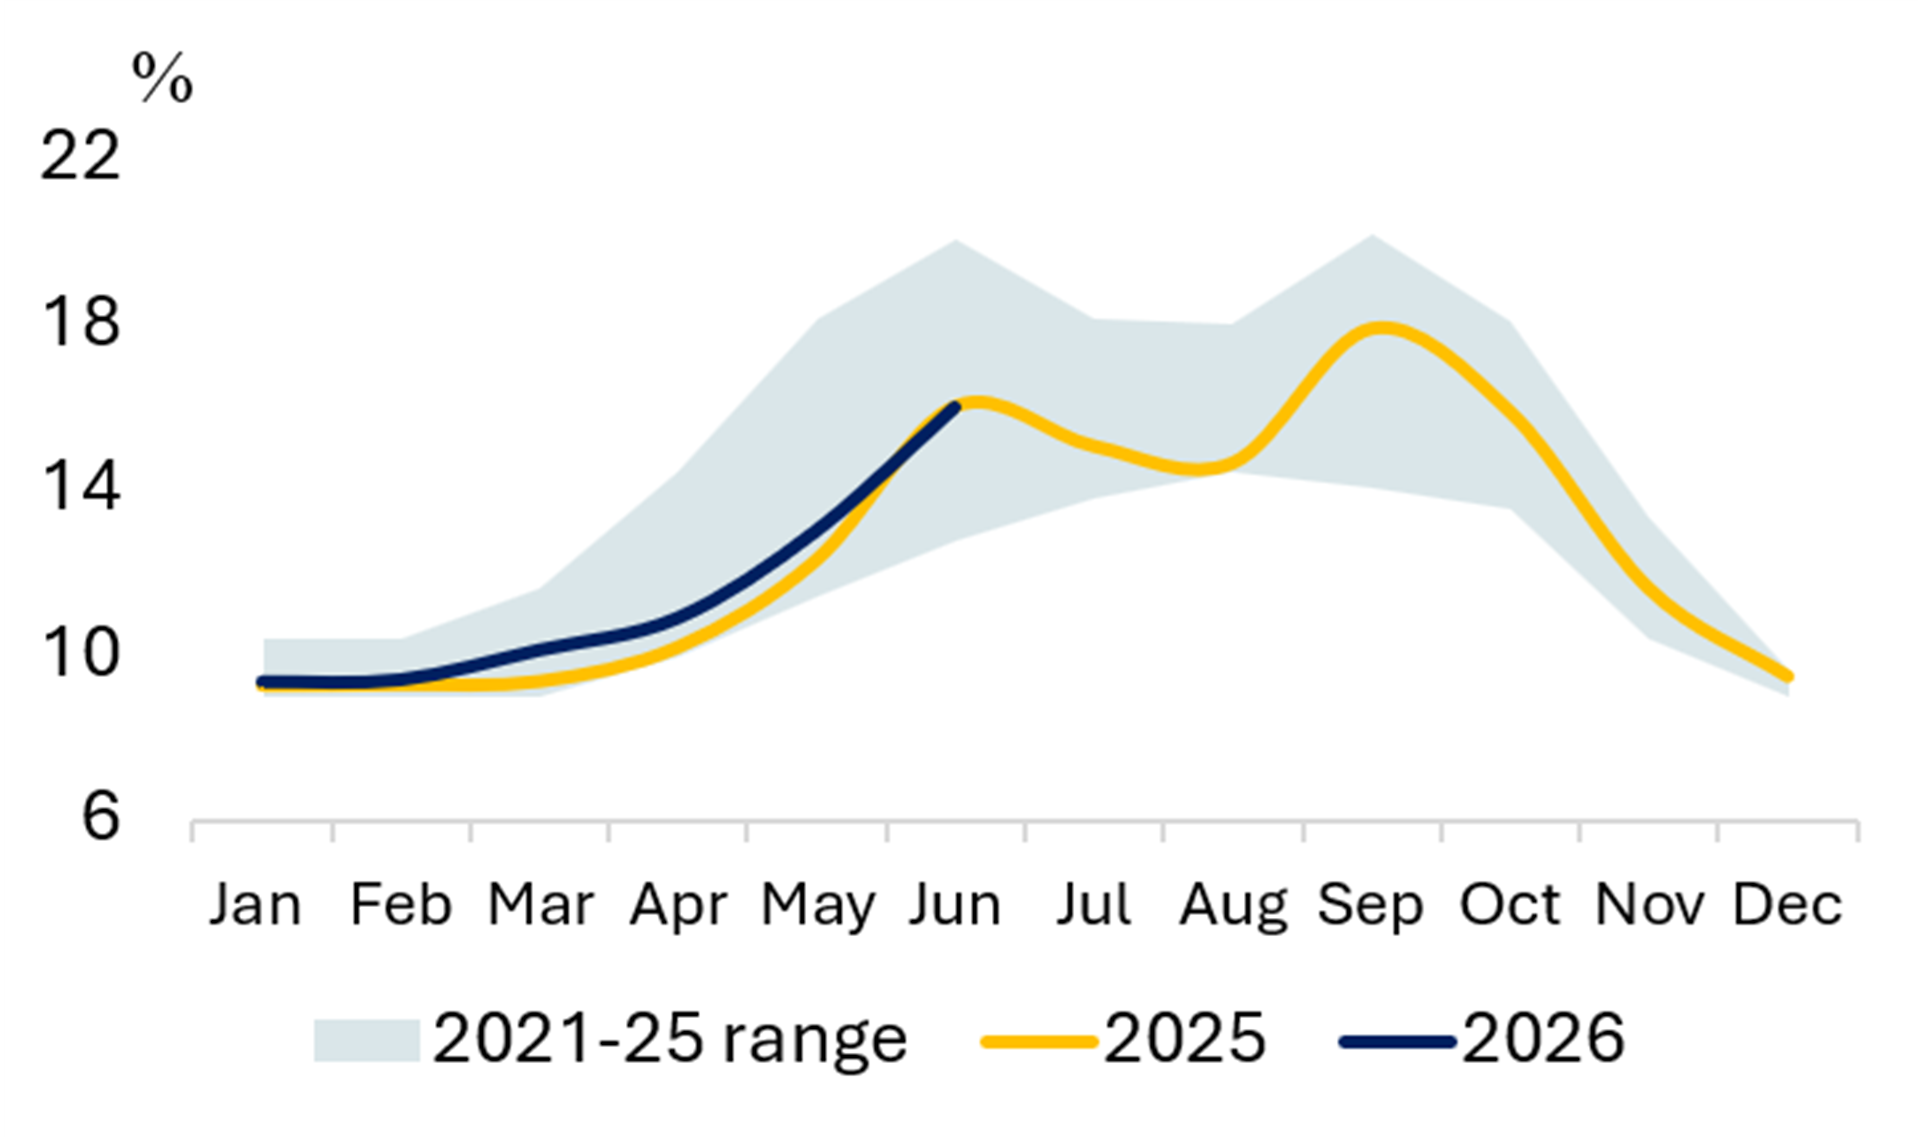
Exhibit 41 Share of Wind & Solar (%) Exhibit 42 Share of Hydro (%) 

JAPAN
Exhibit 43 Power Generation Exhibit 44 Share of Gas (%) 

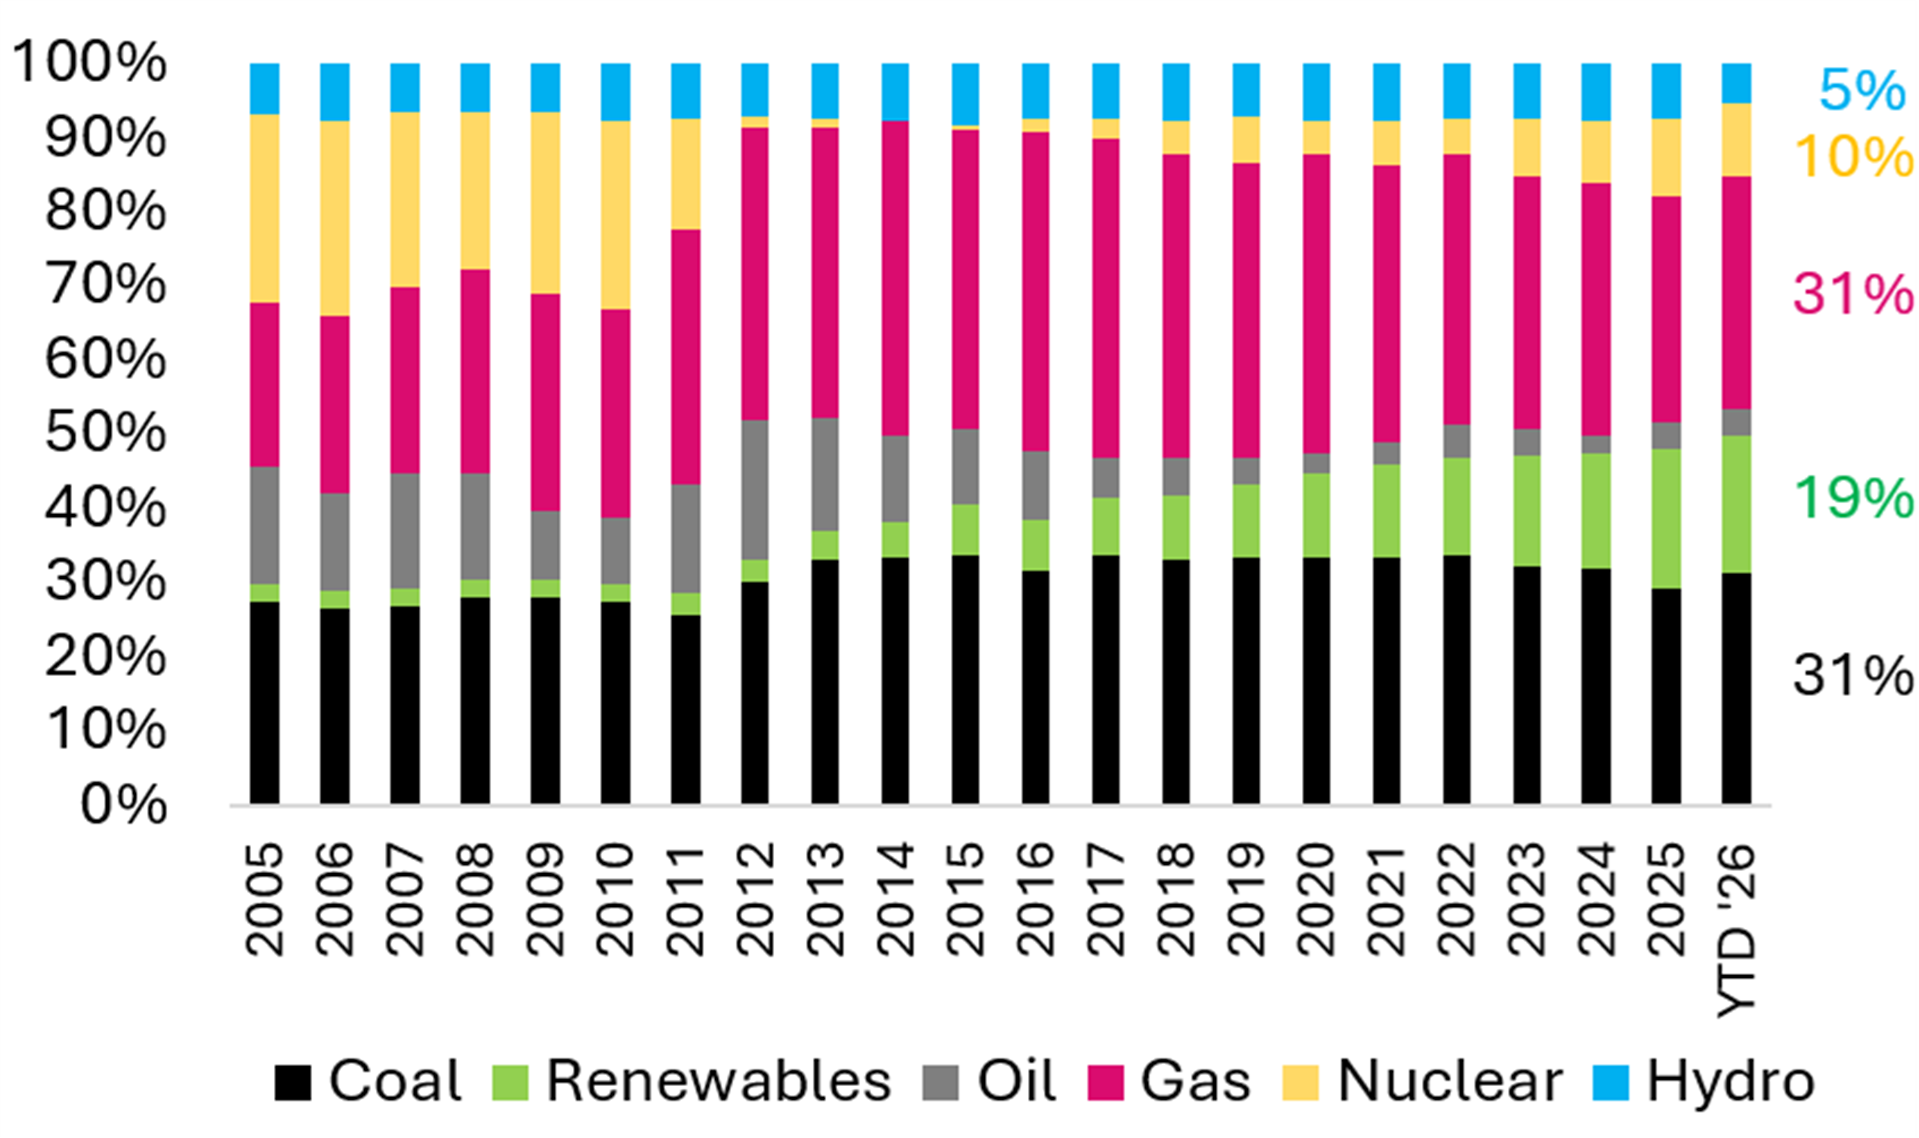
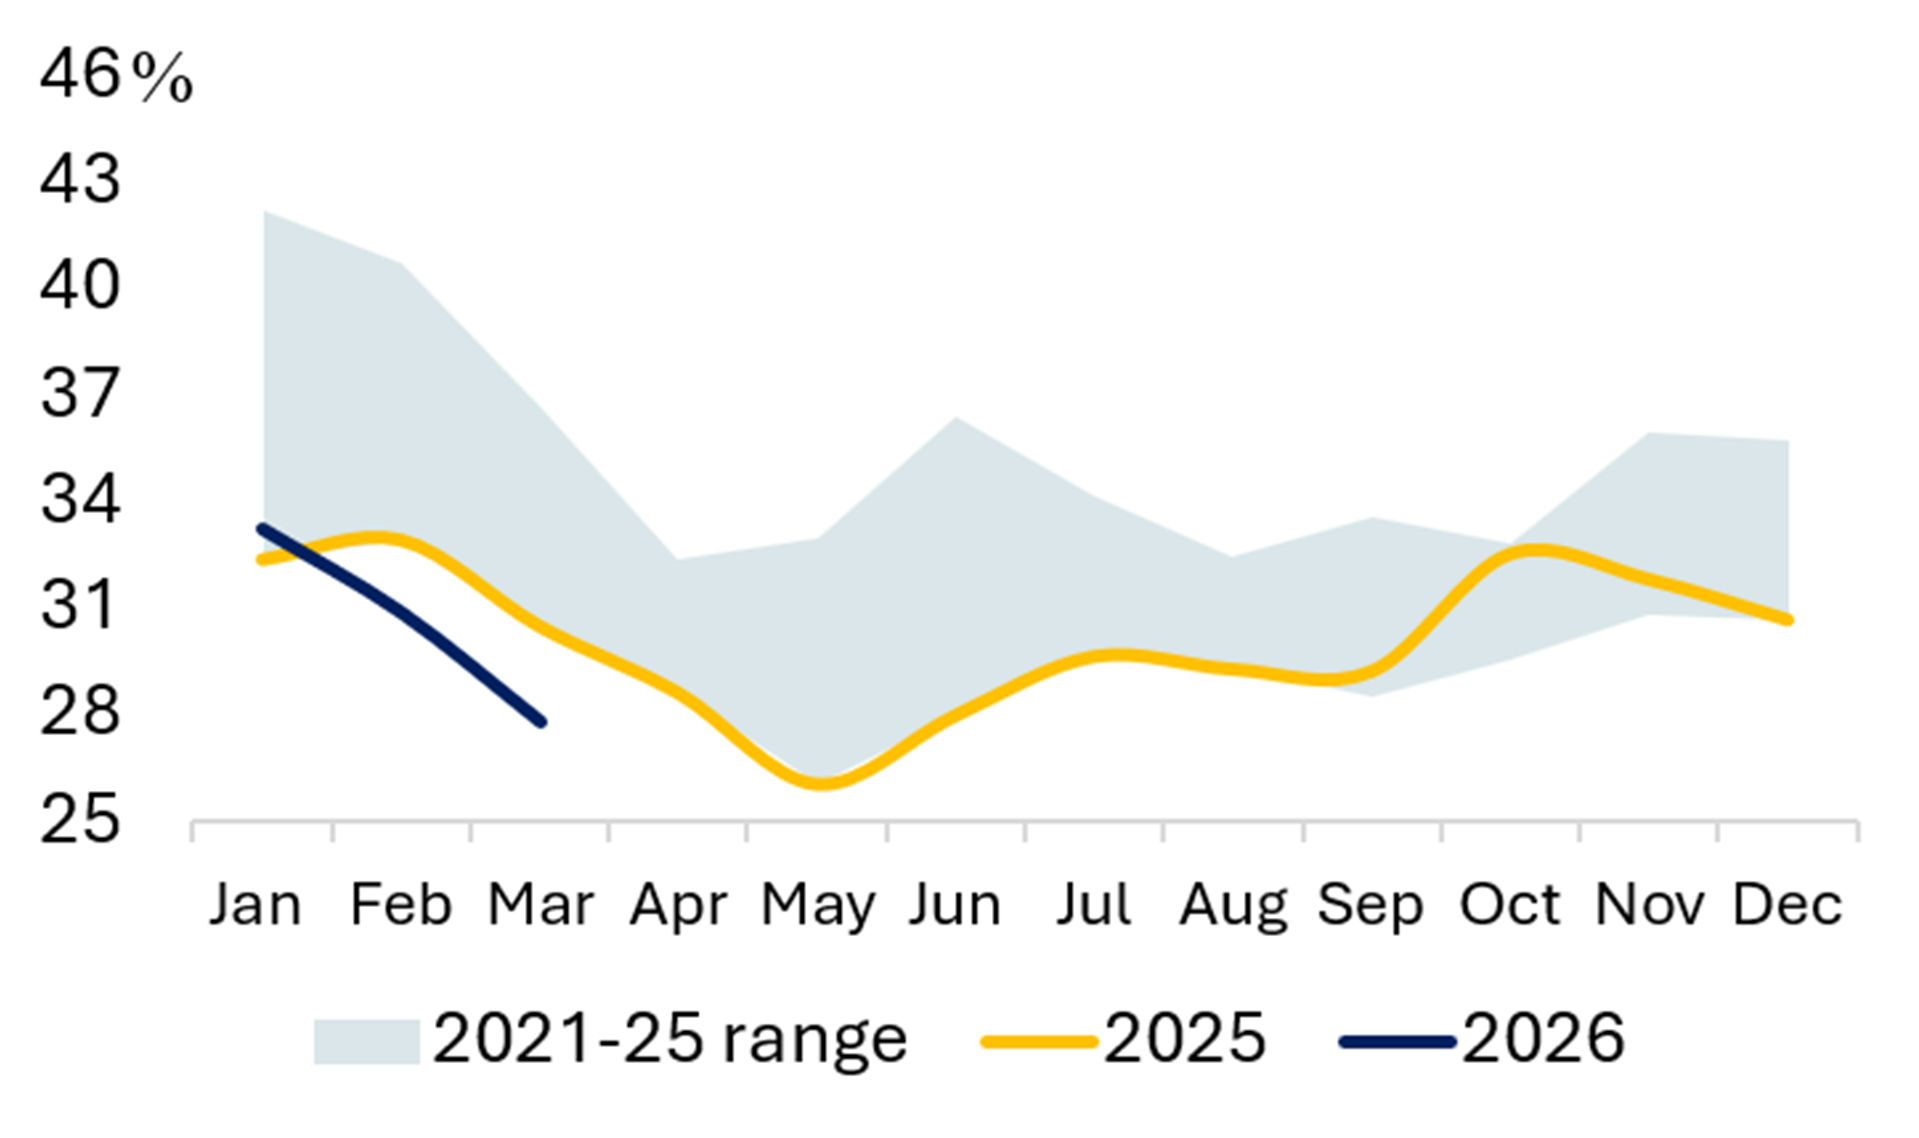
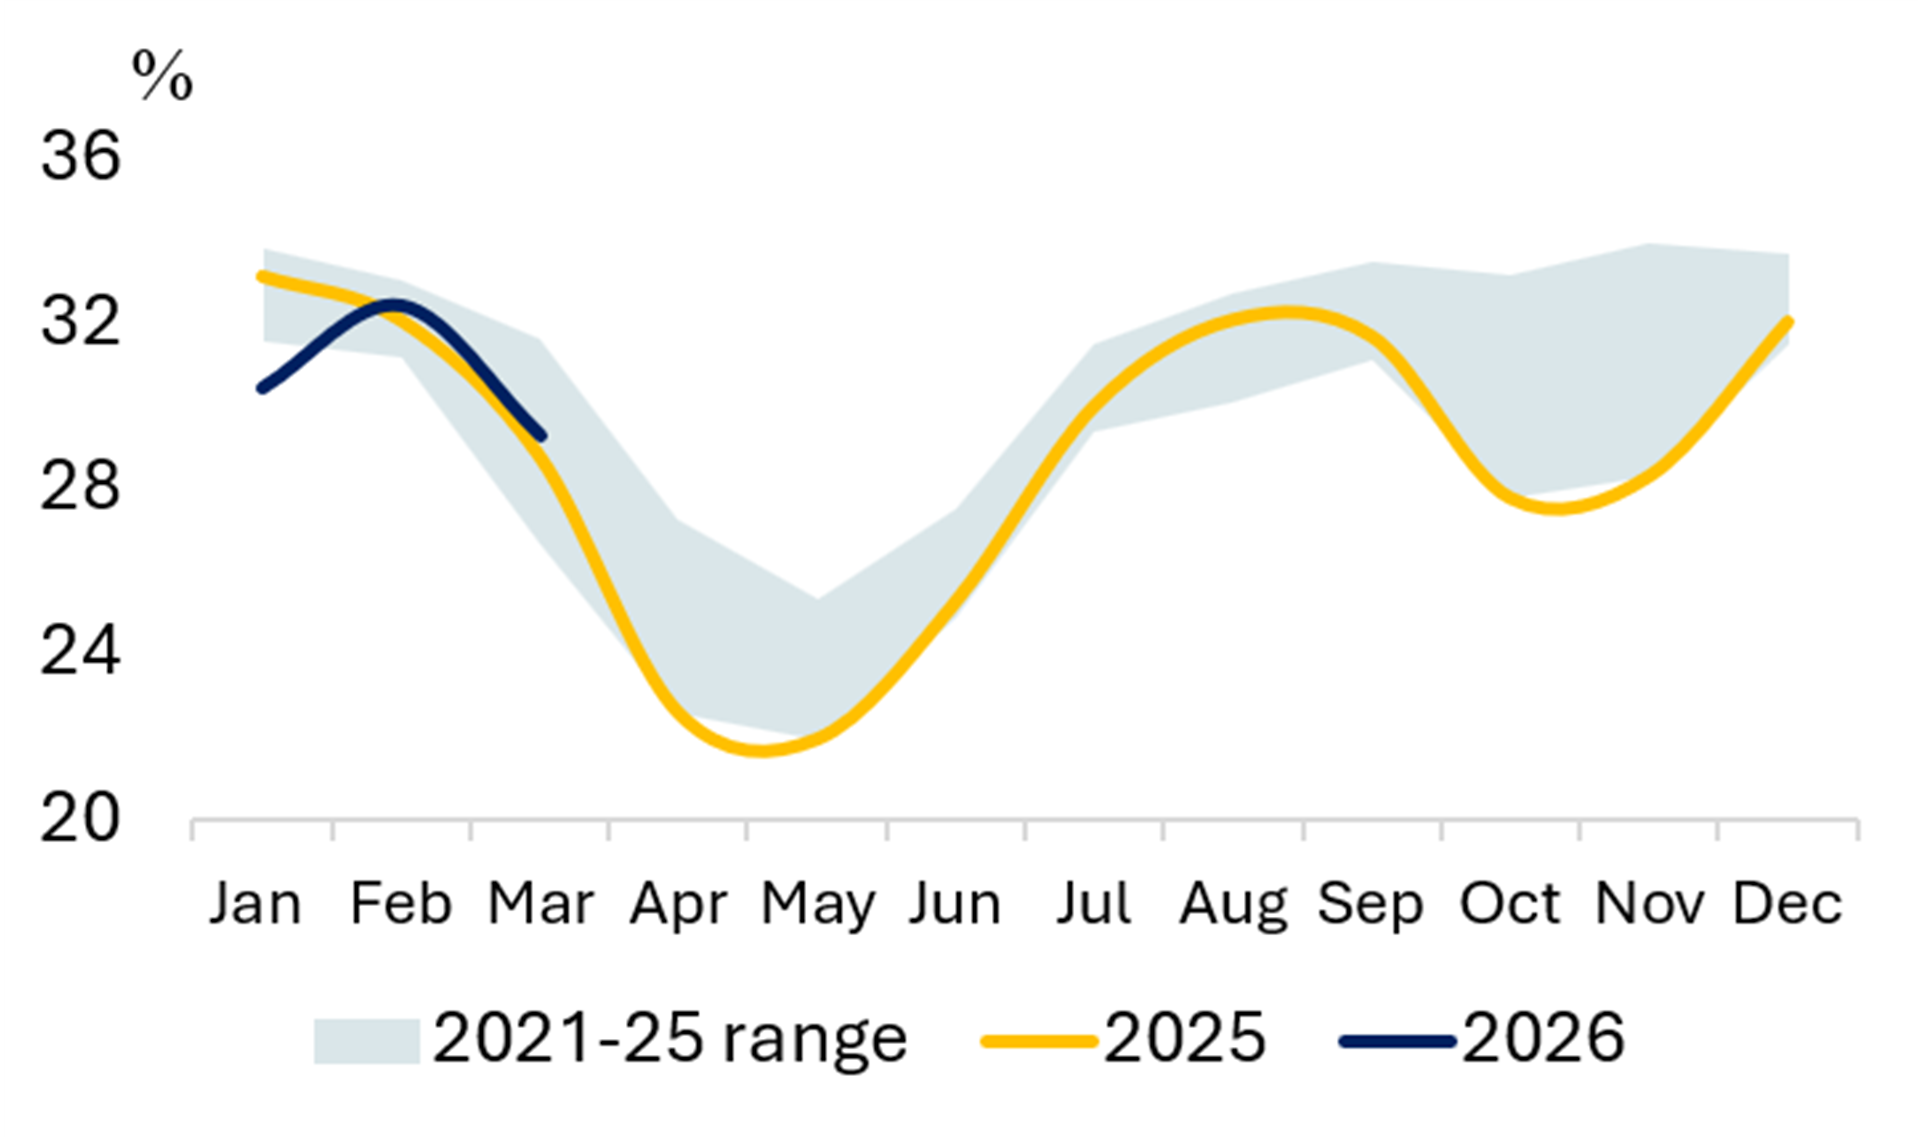
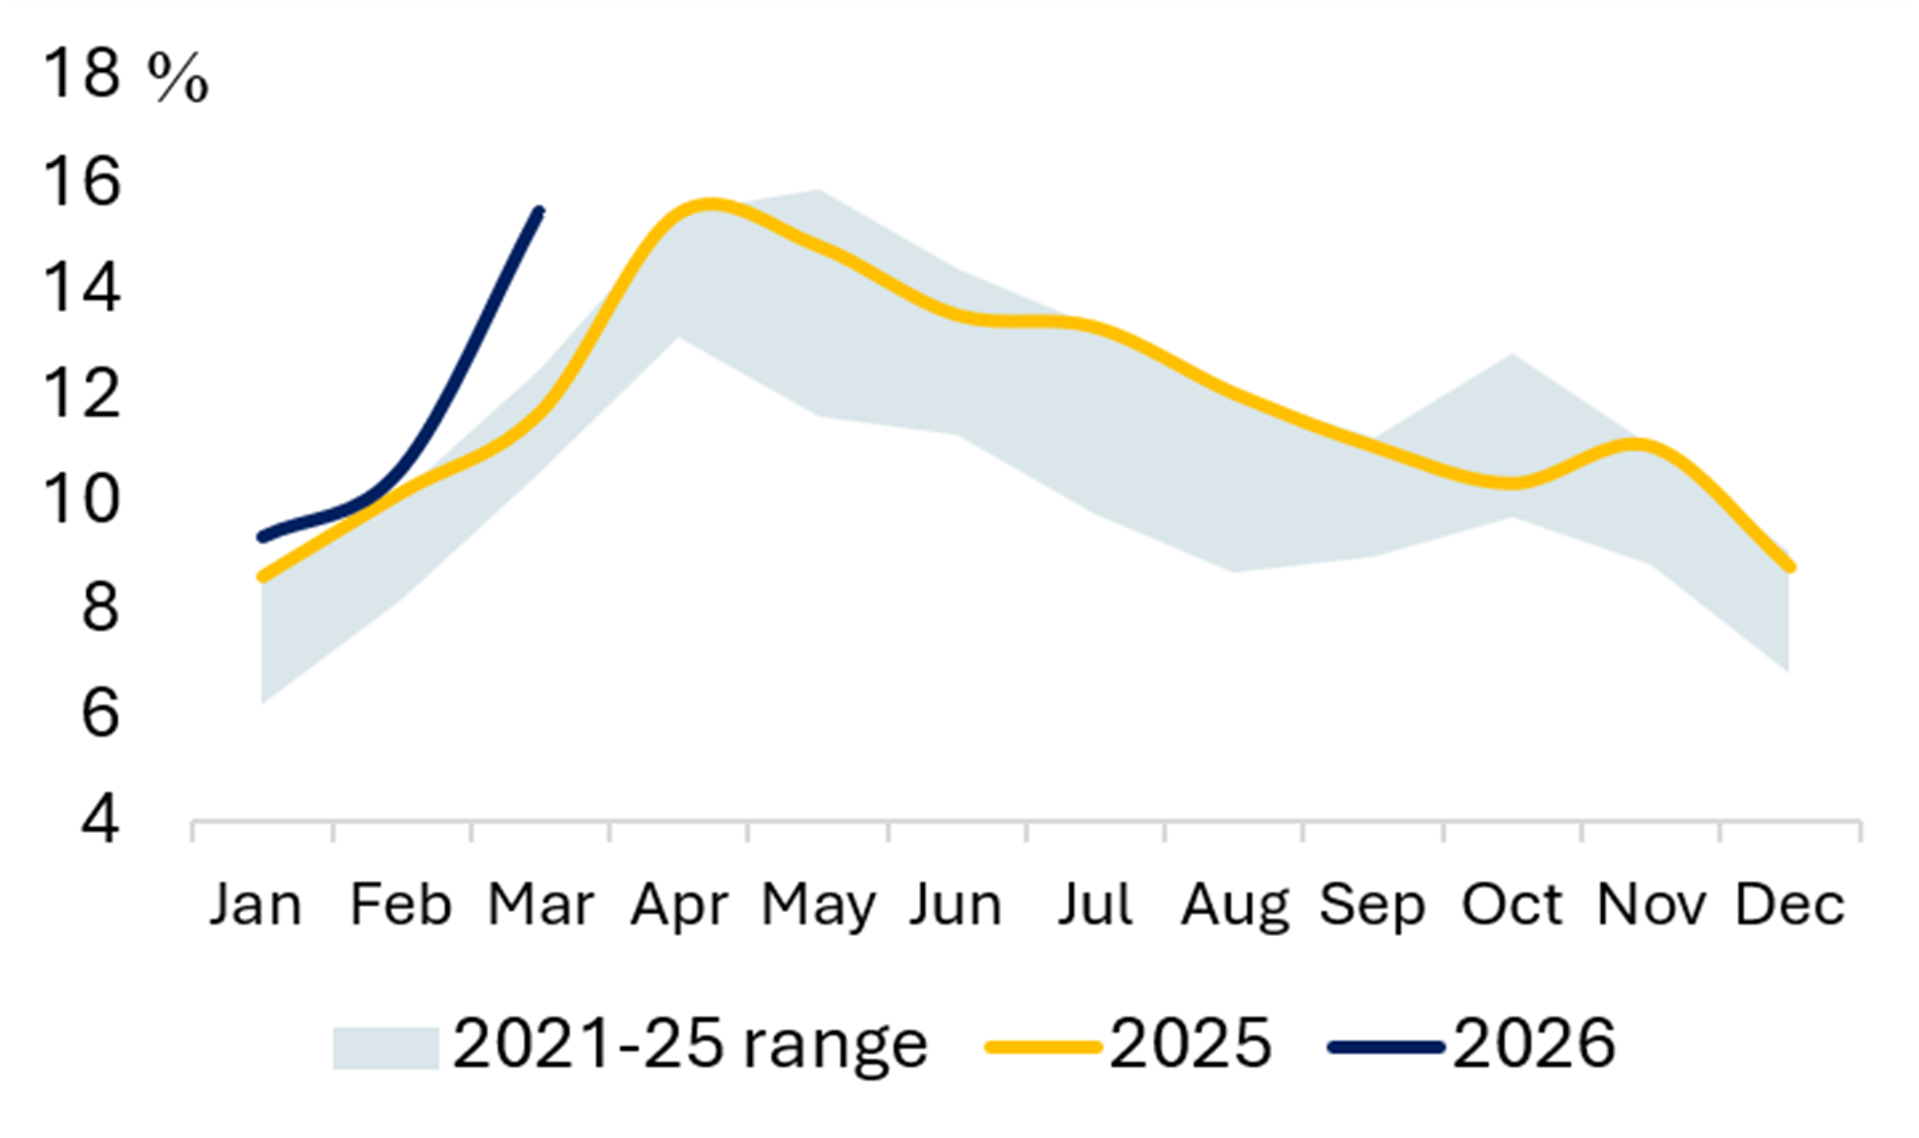
Exhibit 45 Share of Coal (%) Exhibit 46 Share of Wind & Solar (%)


Source: EMBER
MIDDLE EAST – Energy Mix in Six Gulf Cooperation Council (GCC) Countries
Exhibit 47 Power Demand per Capita
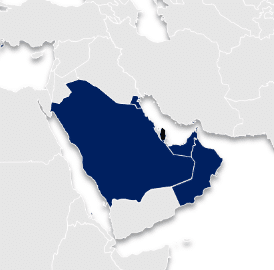
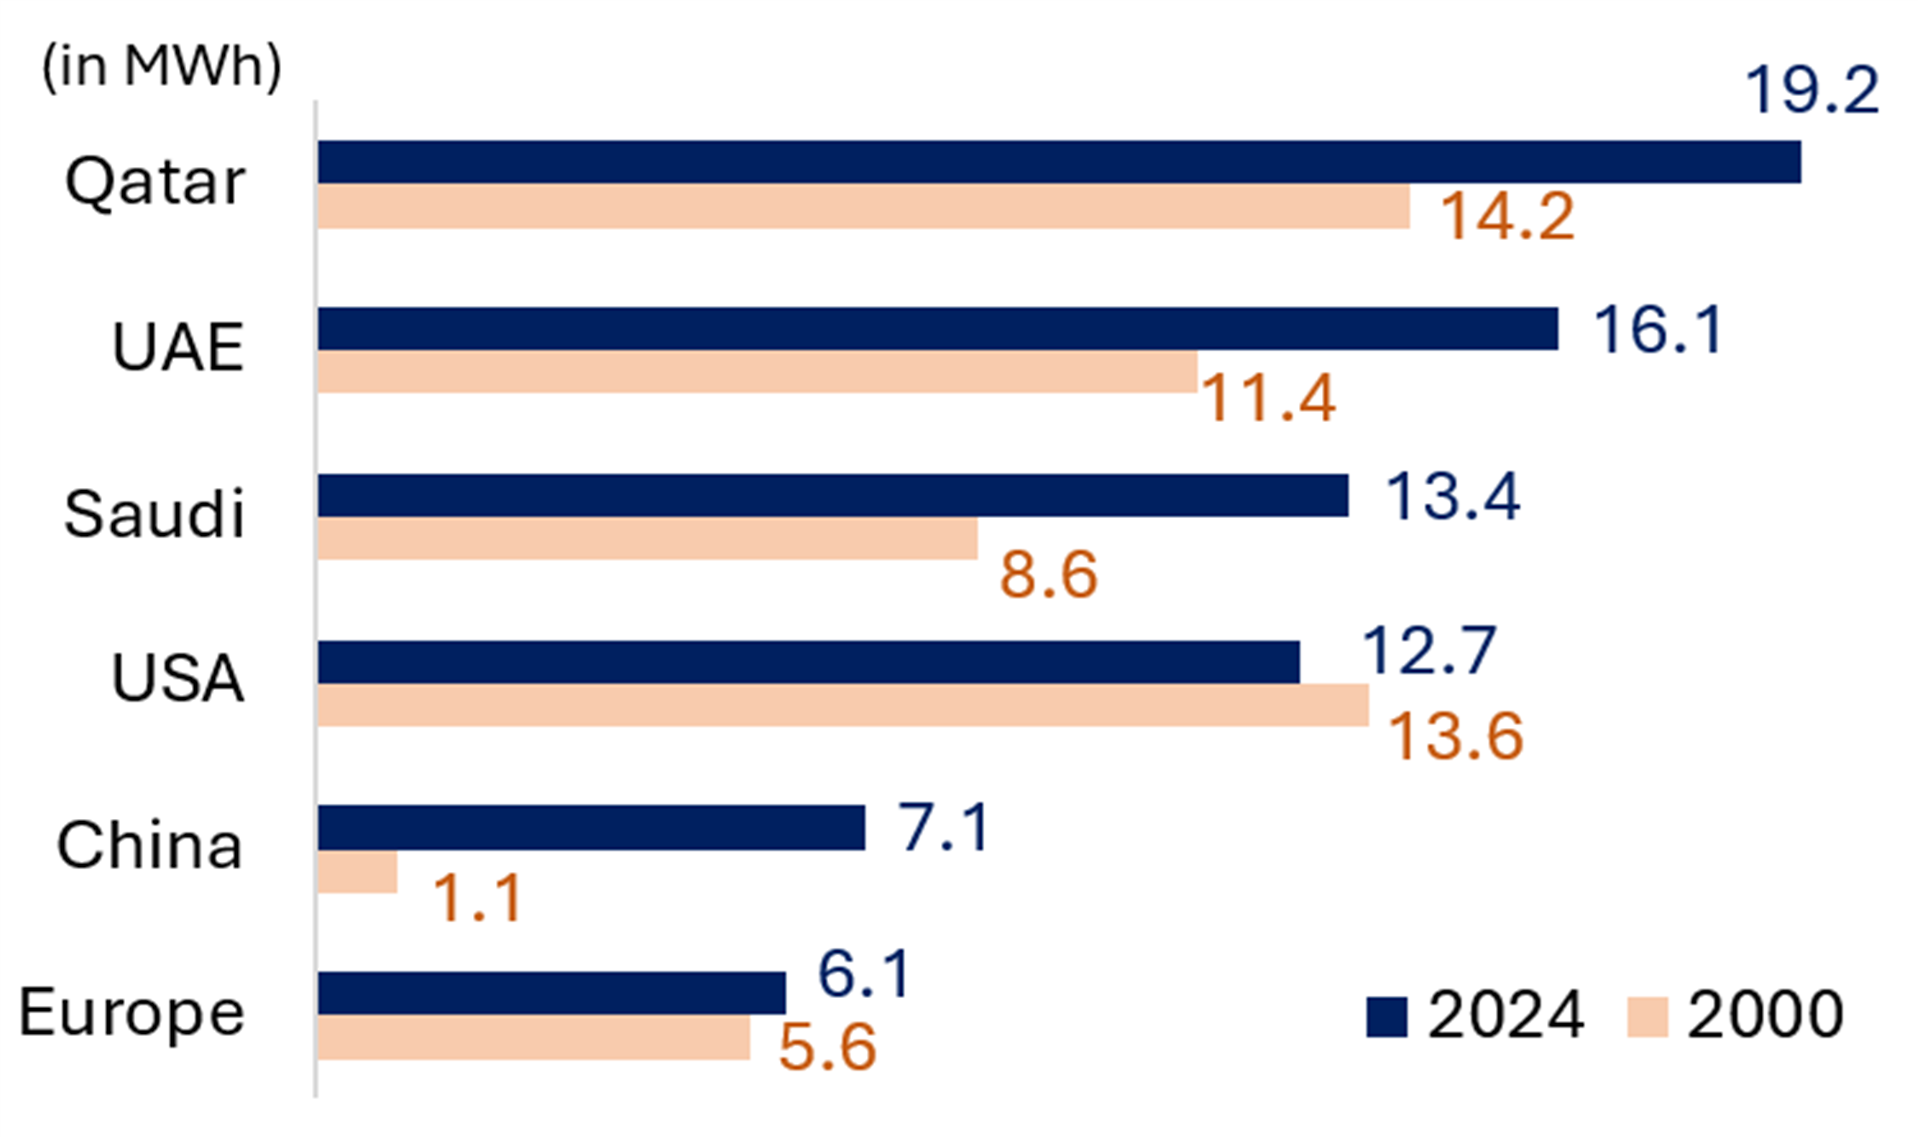

Exhibit 48 Saudi Arabia Power Gen (TWh) Exhibit 49 UAE Power Gen (TWh) 

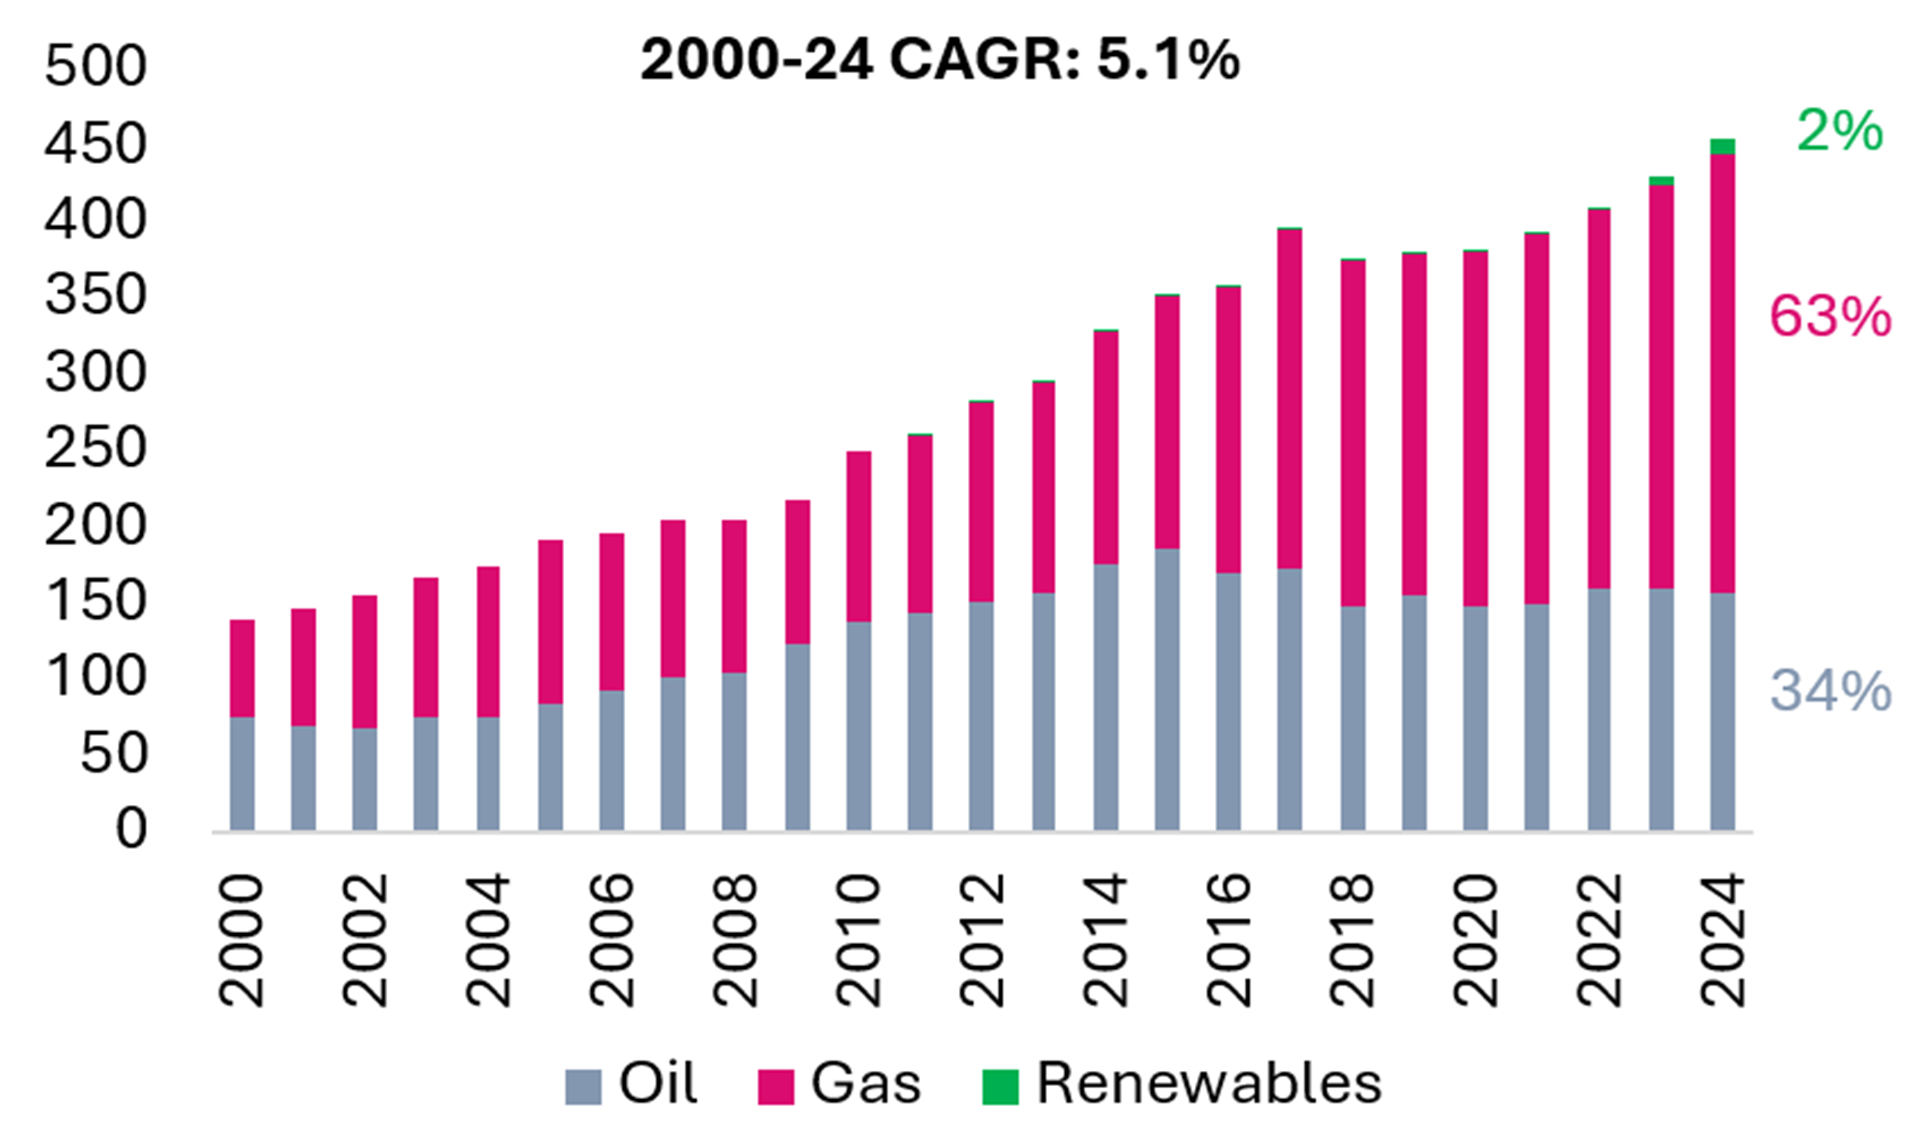
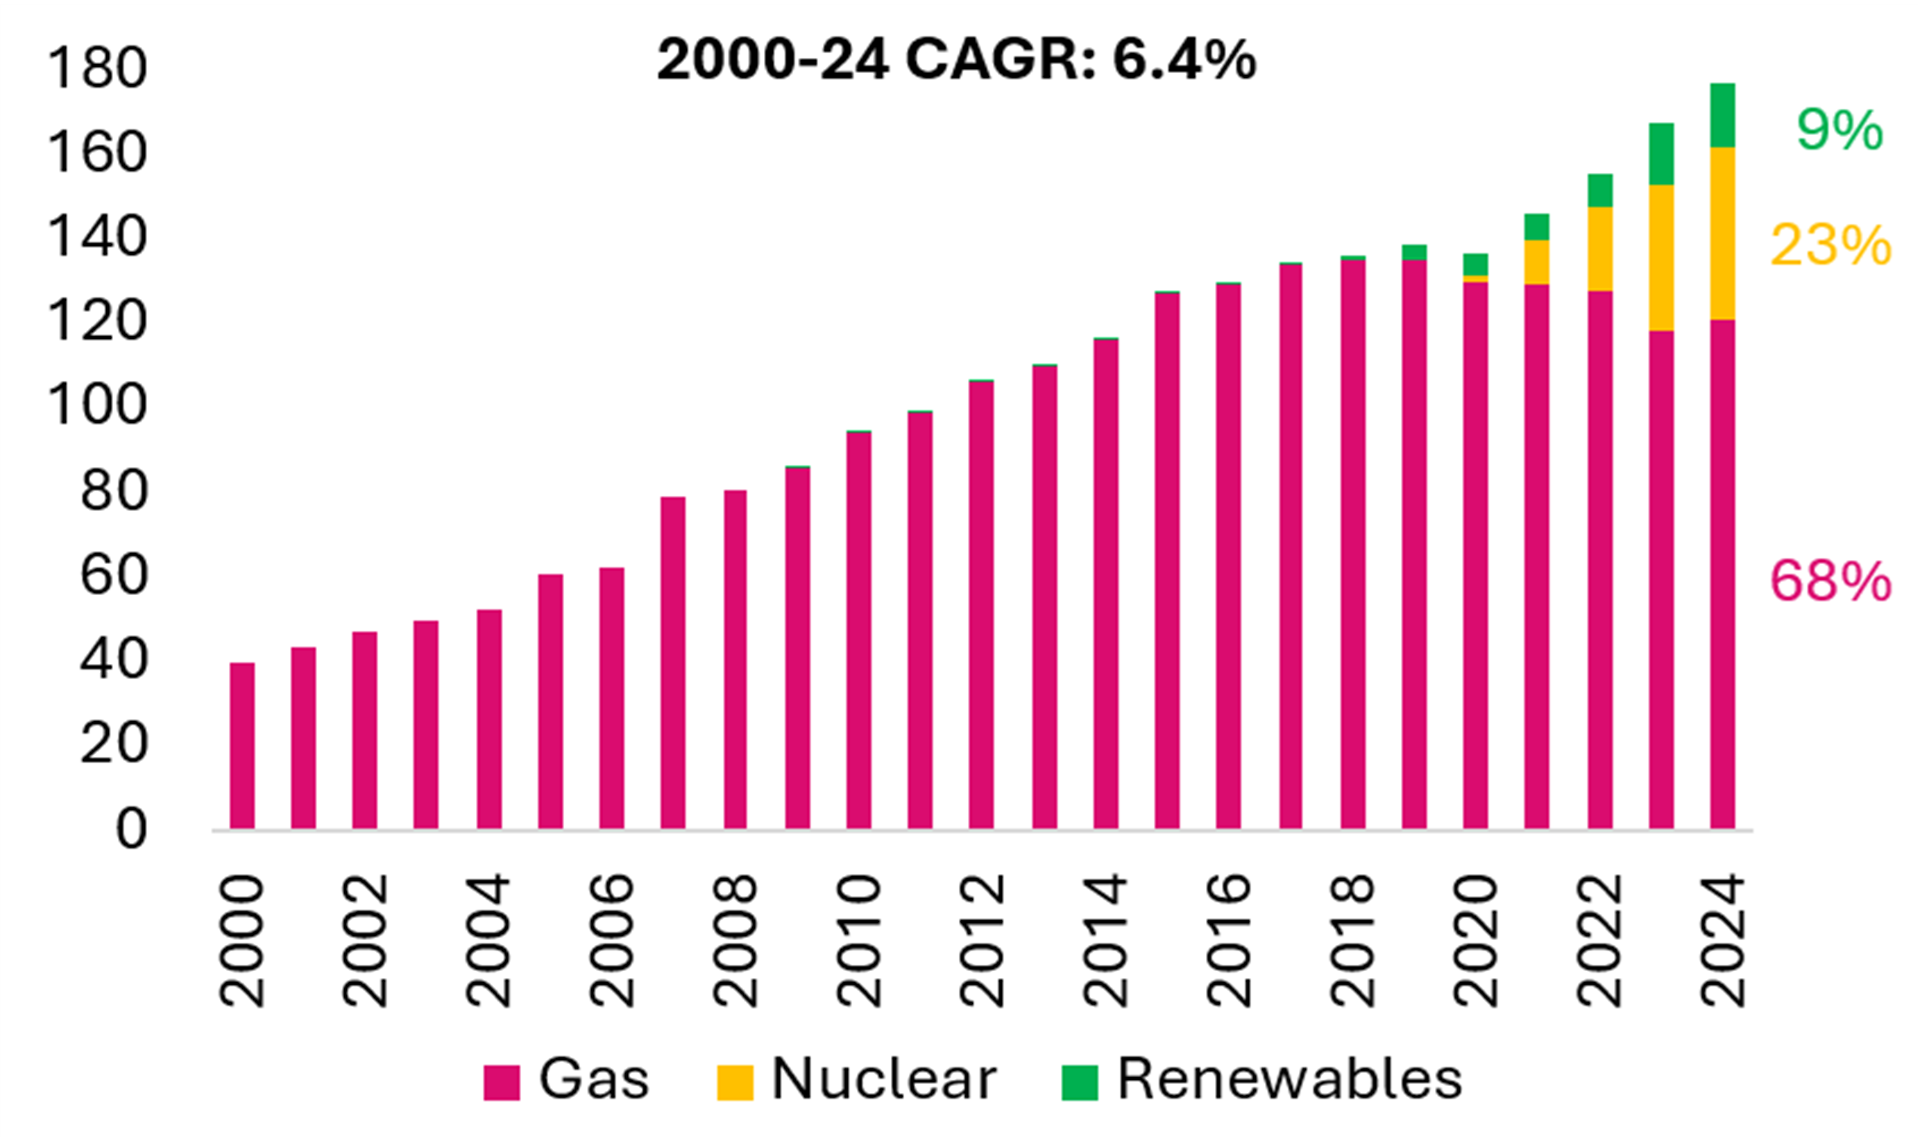
Exhibit 50 Qatar Power Gen (TWh) Exhibit 51 Kuwait Power Gen (TWh) 

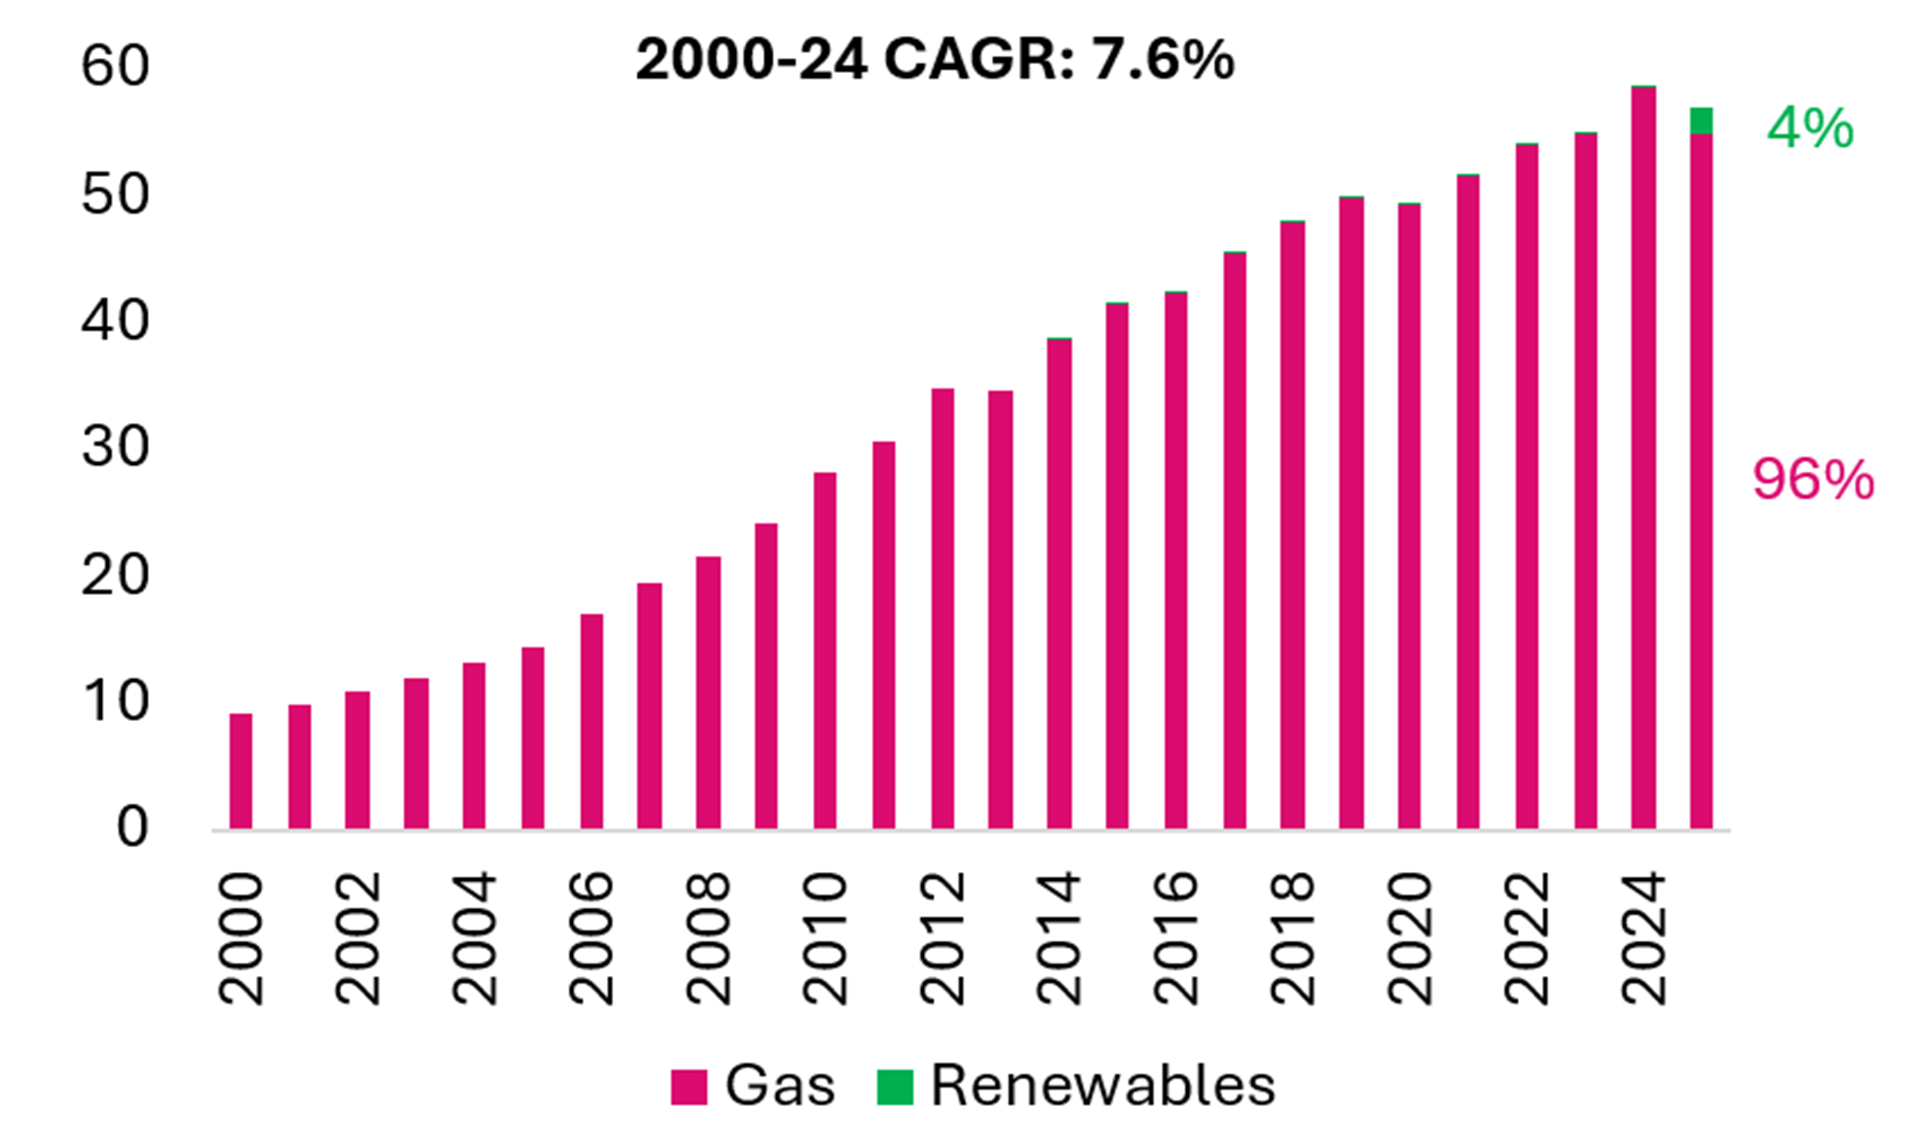
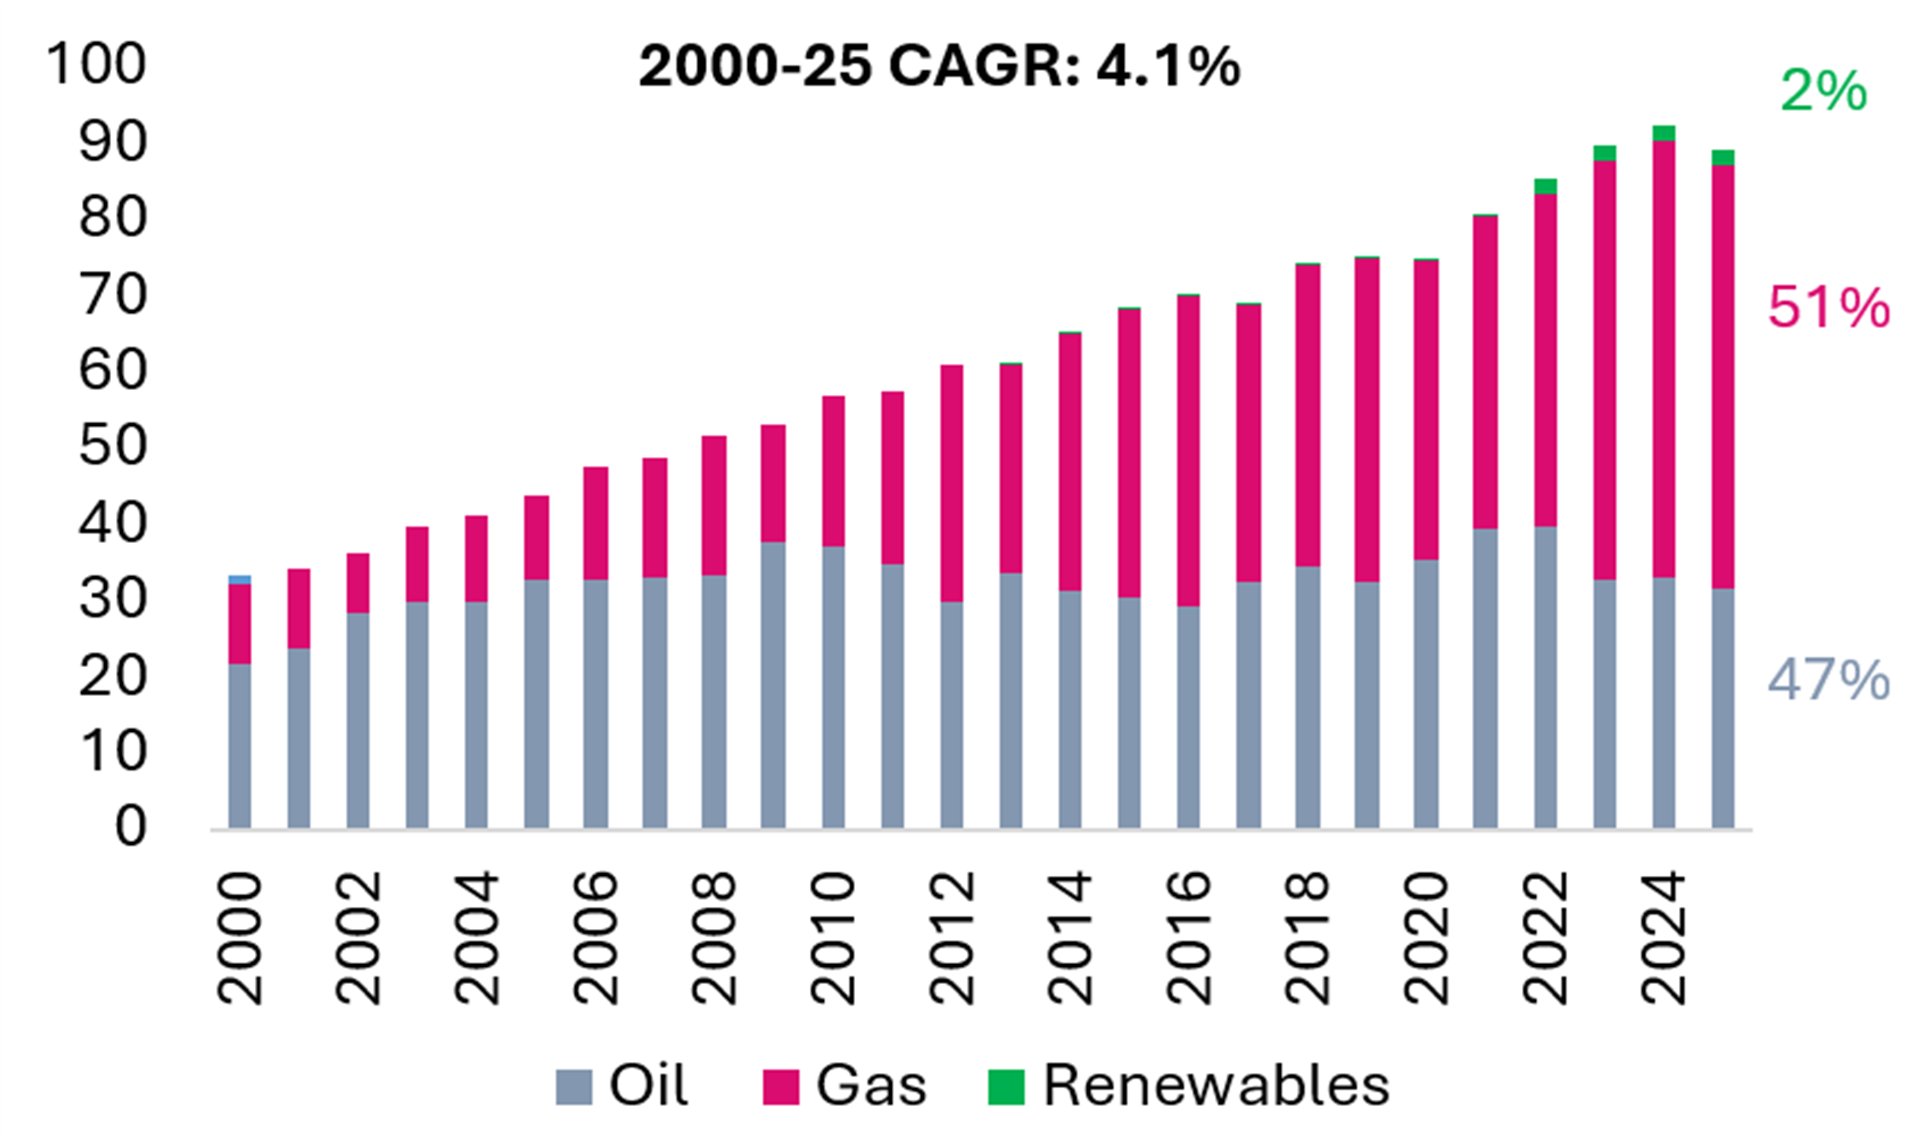
Exhibit 52 Oman Power Gen (TWh) Exhibit 53 Bahrain Power Gen (TWh) 

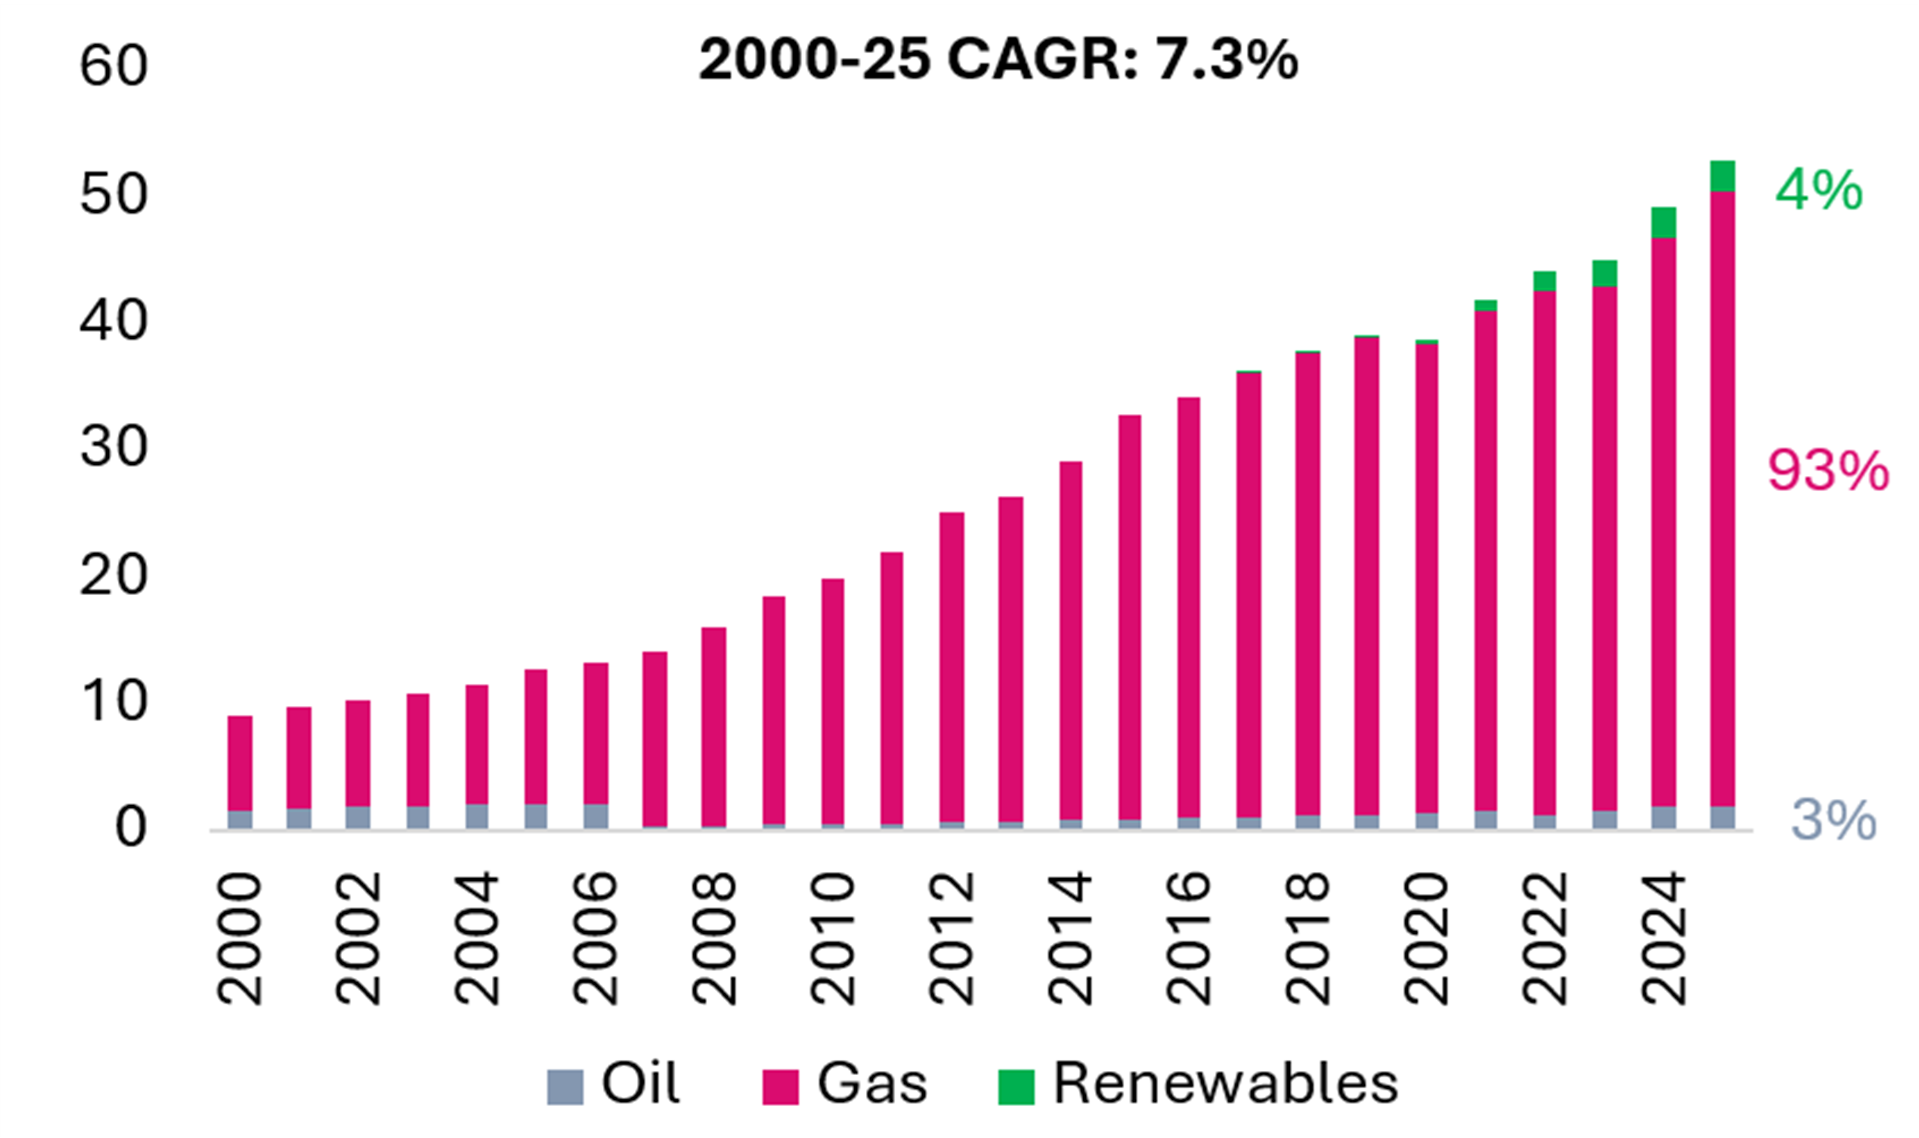
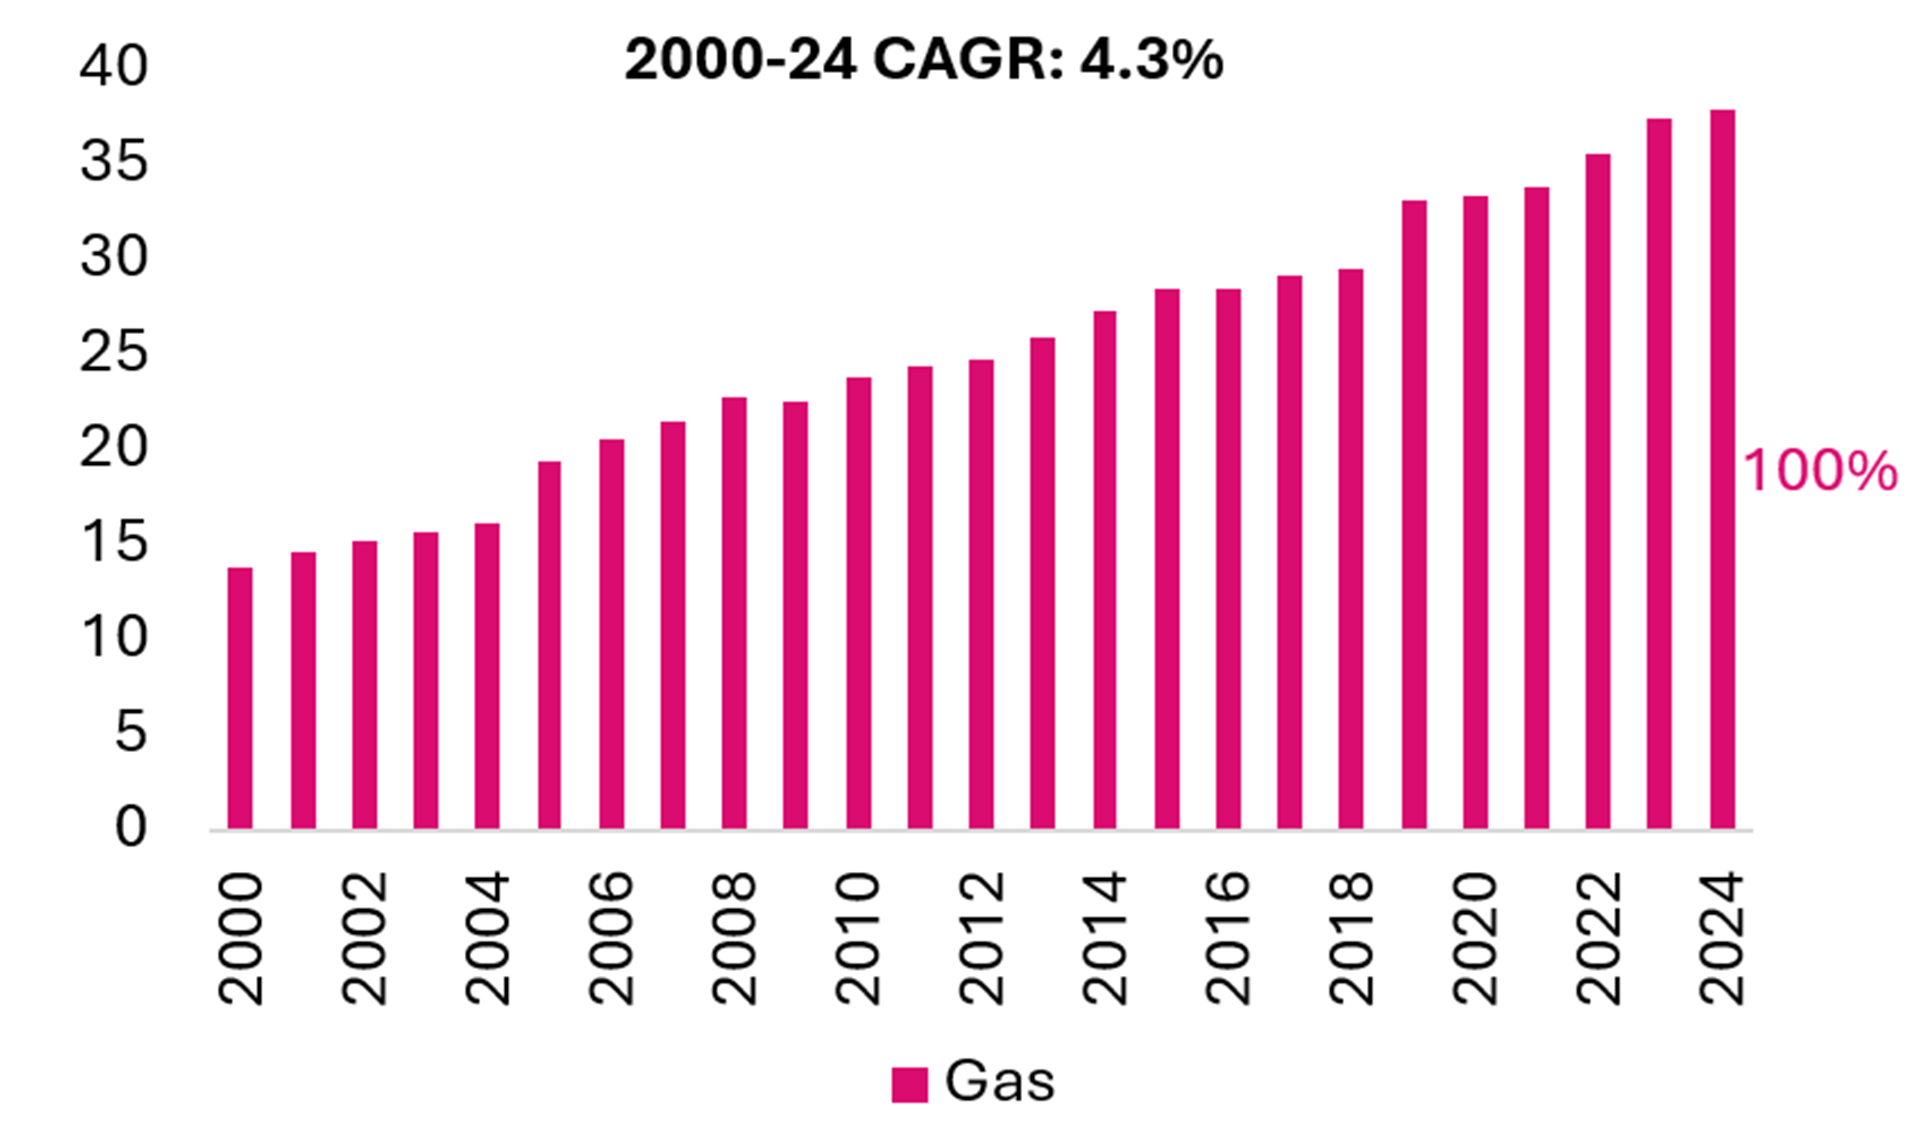
Source: EMBER
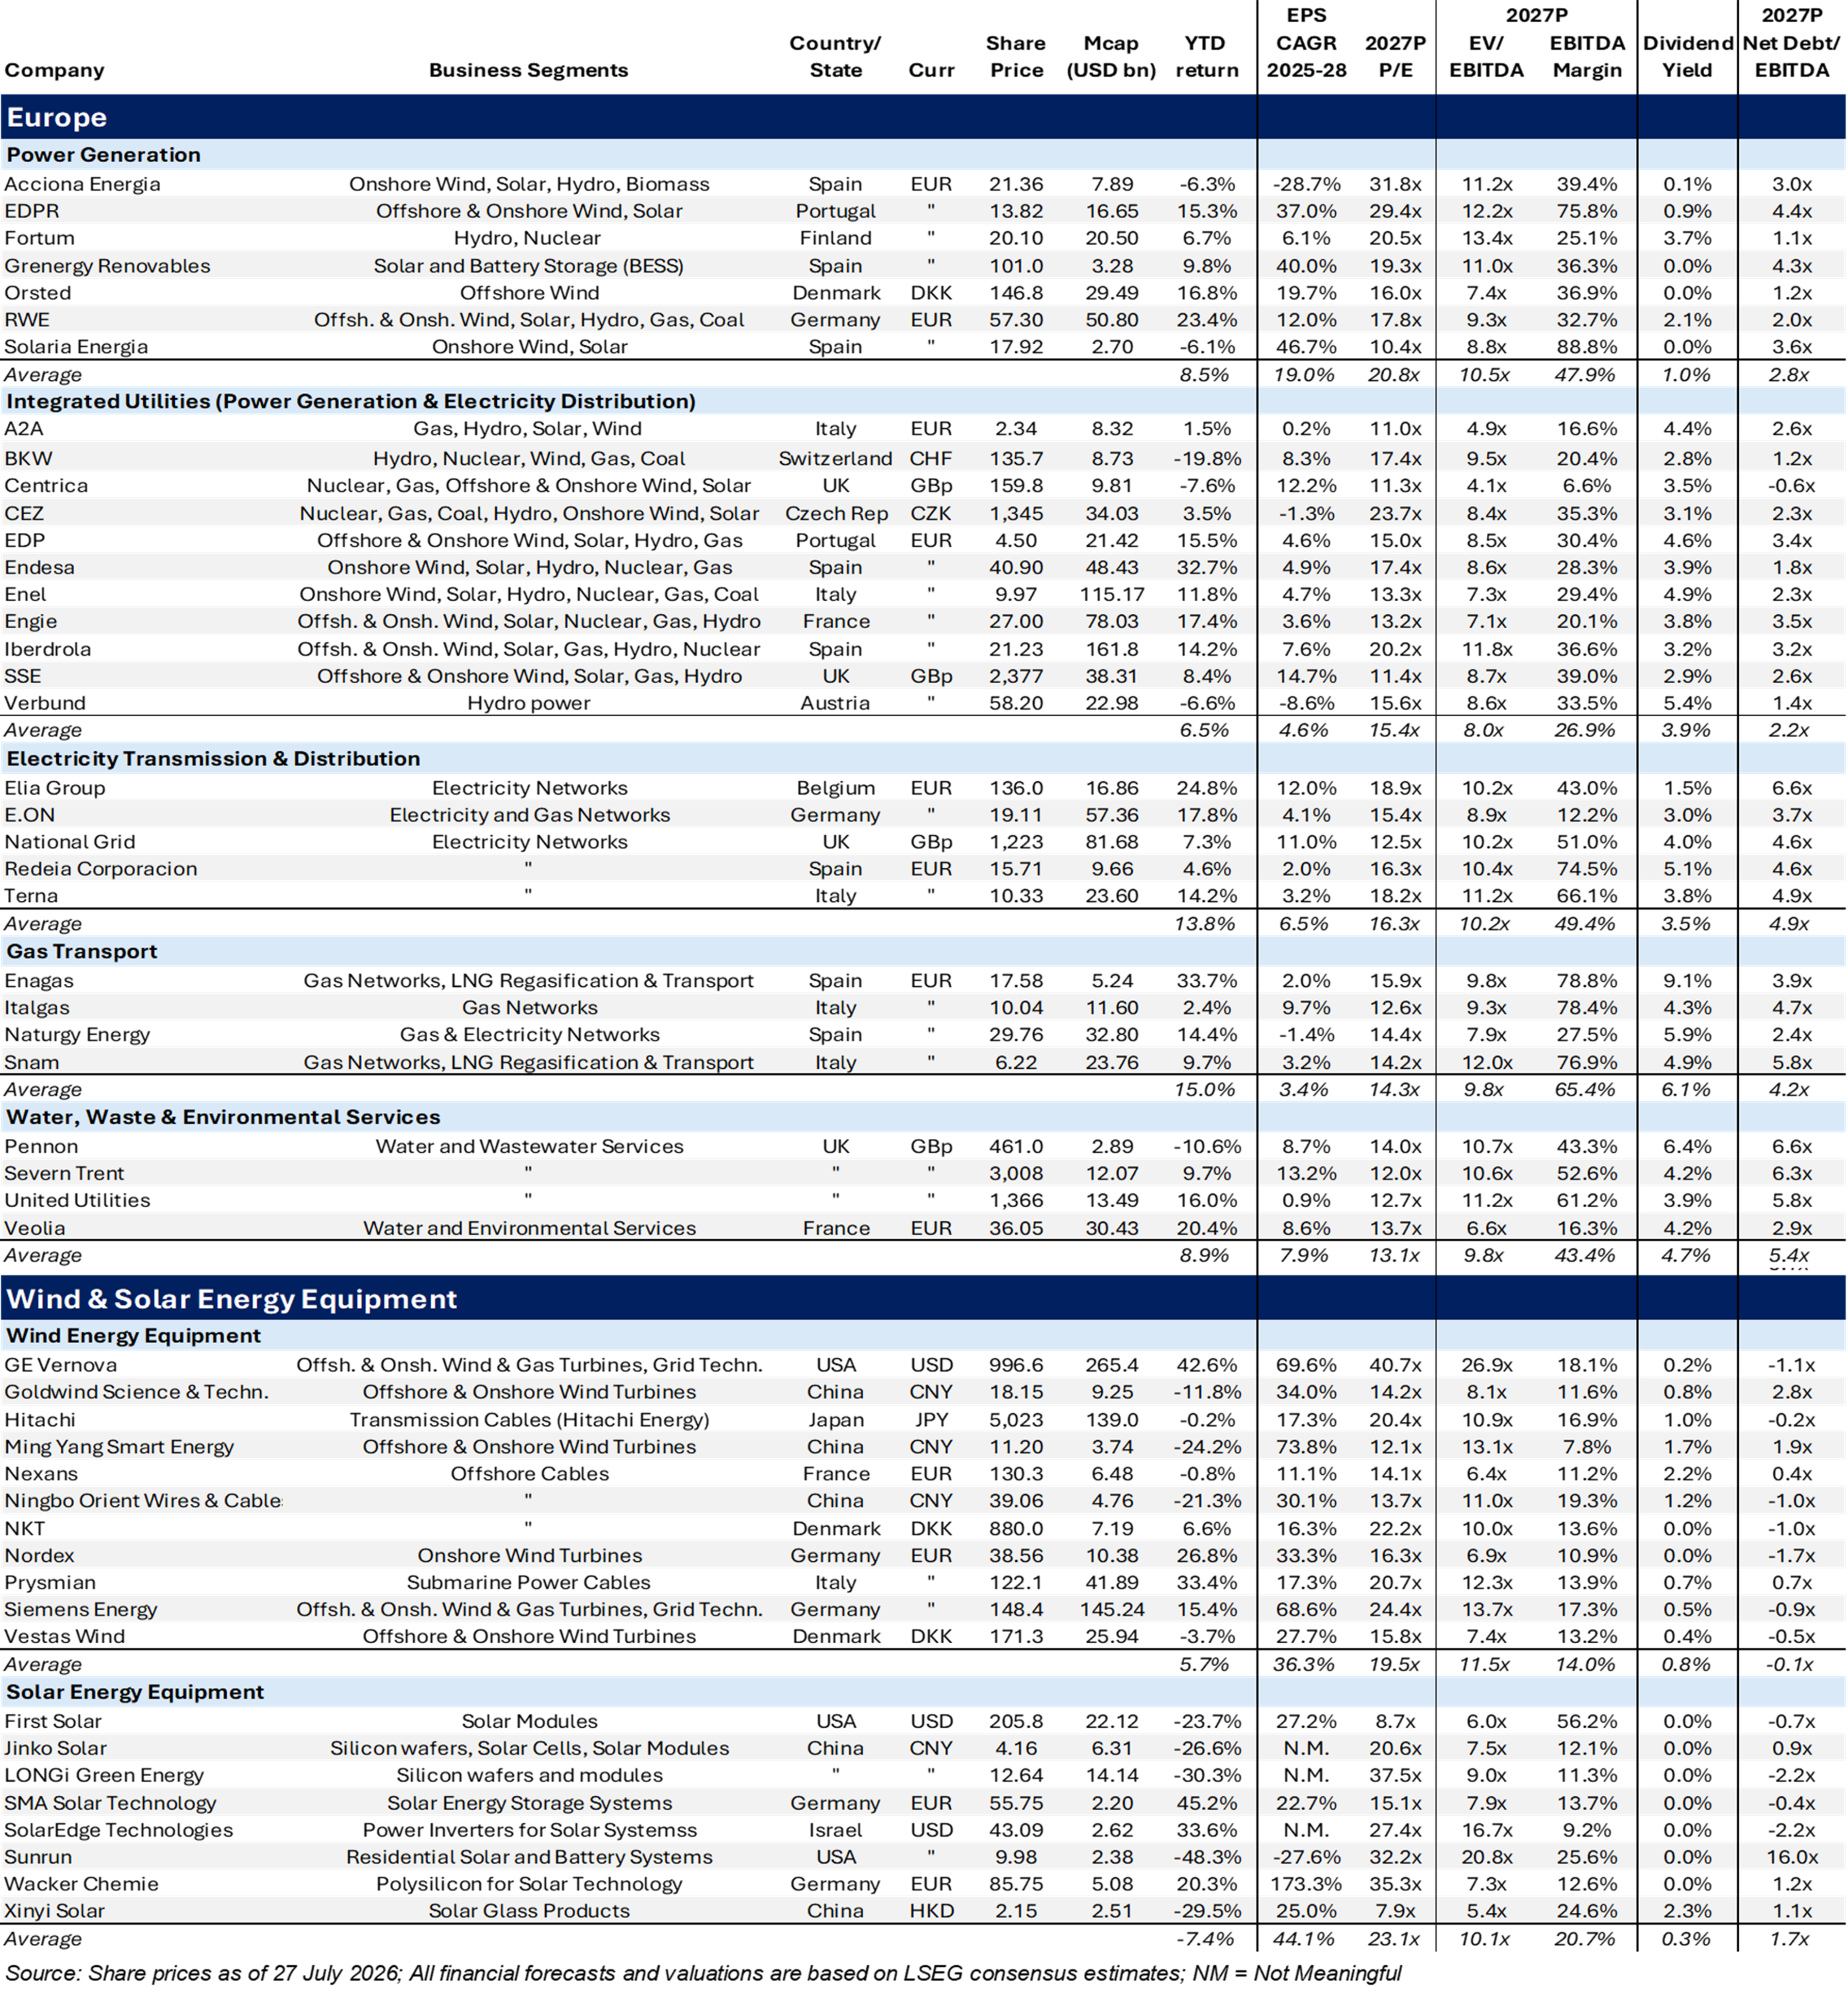
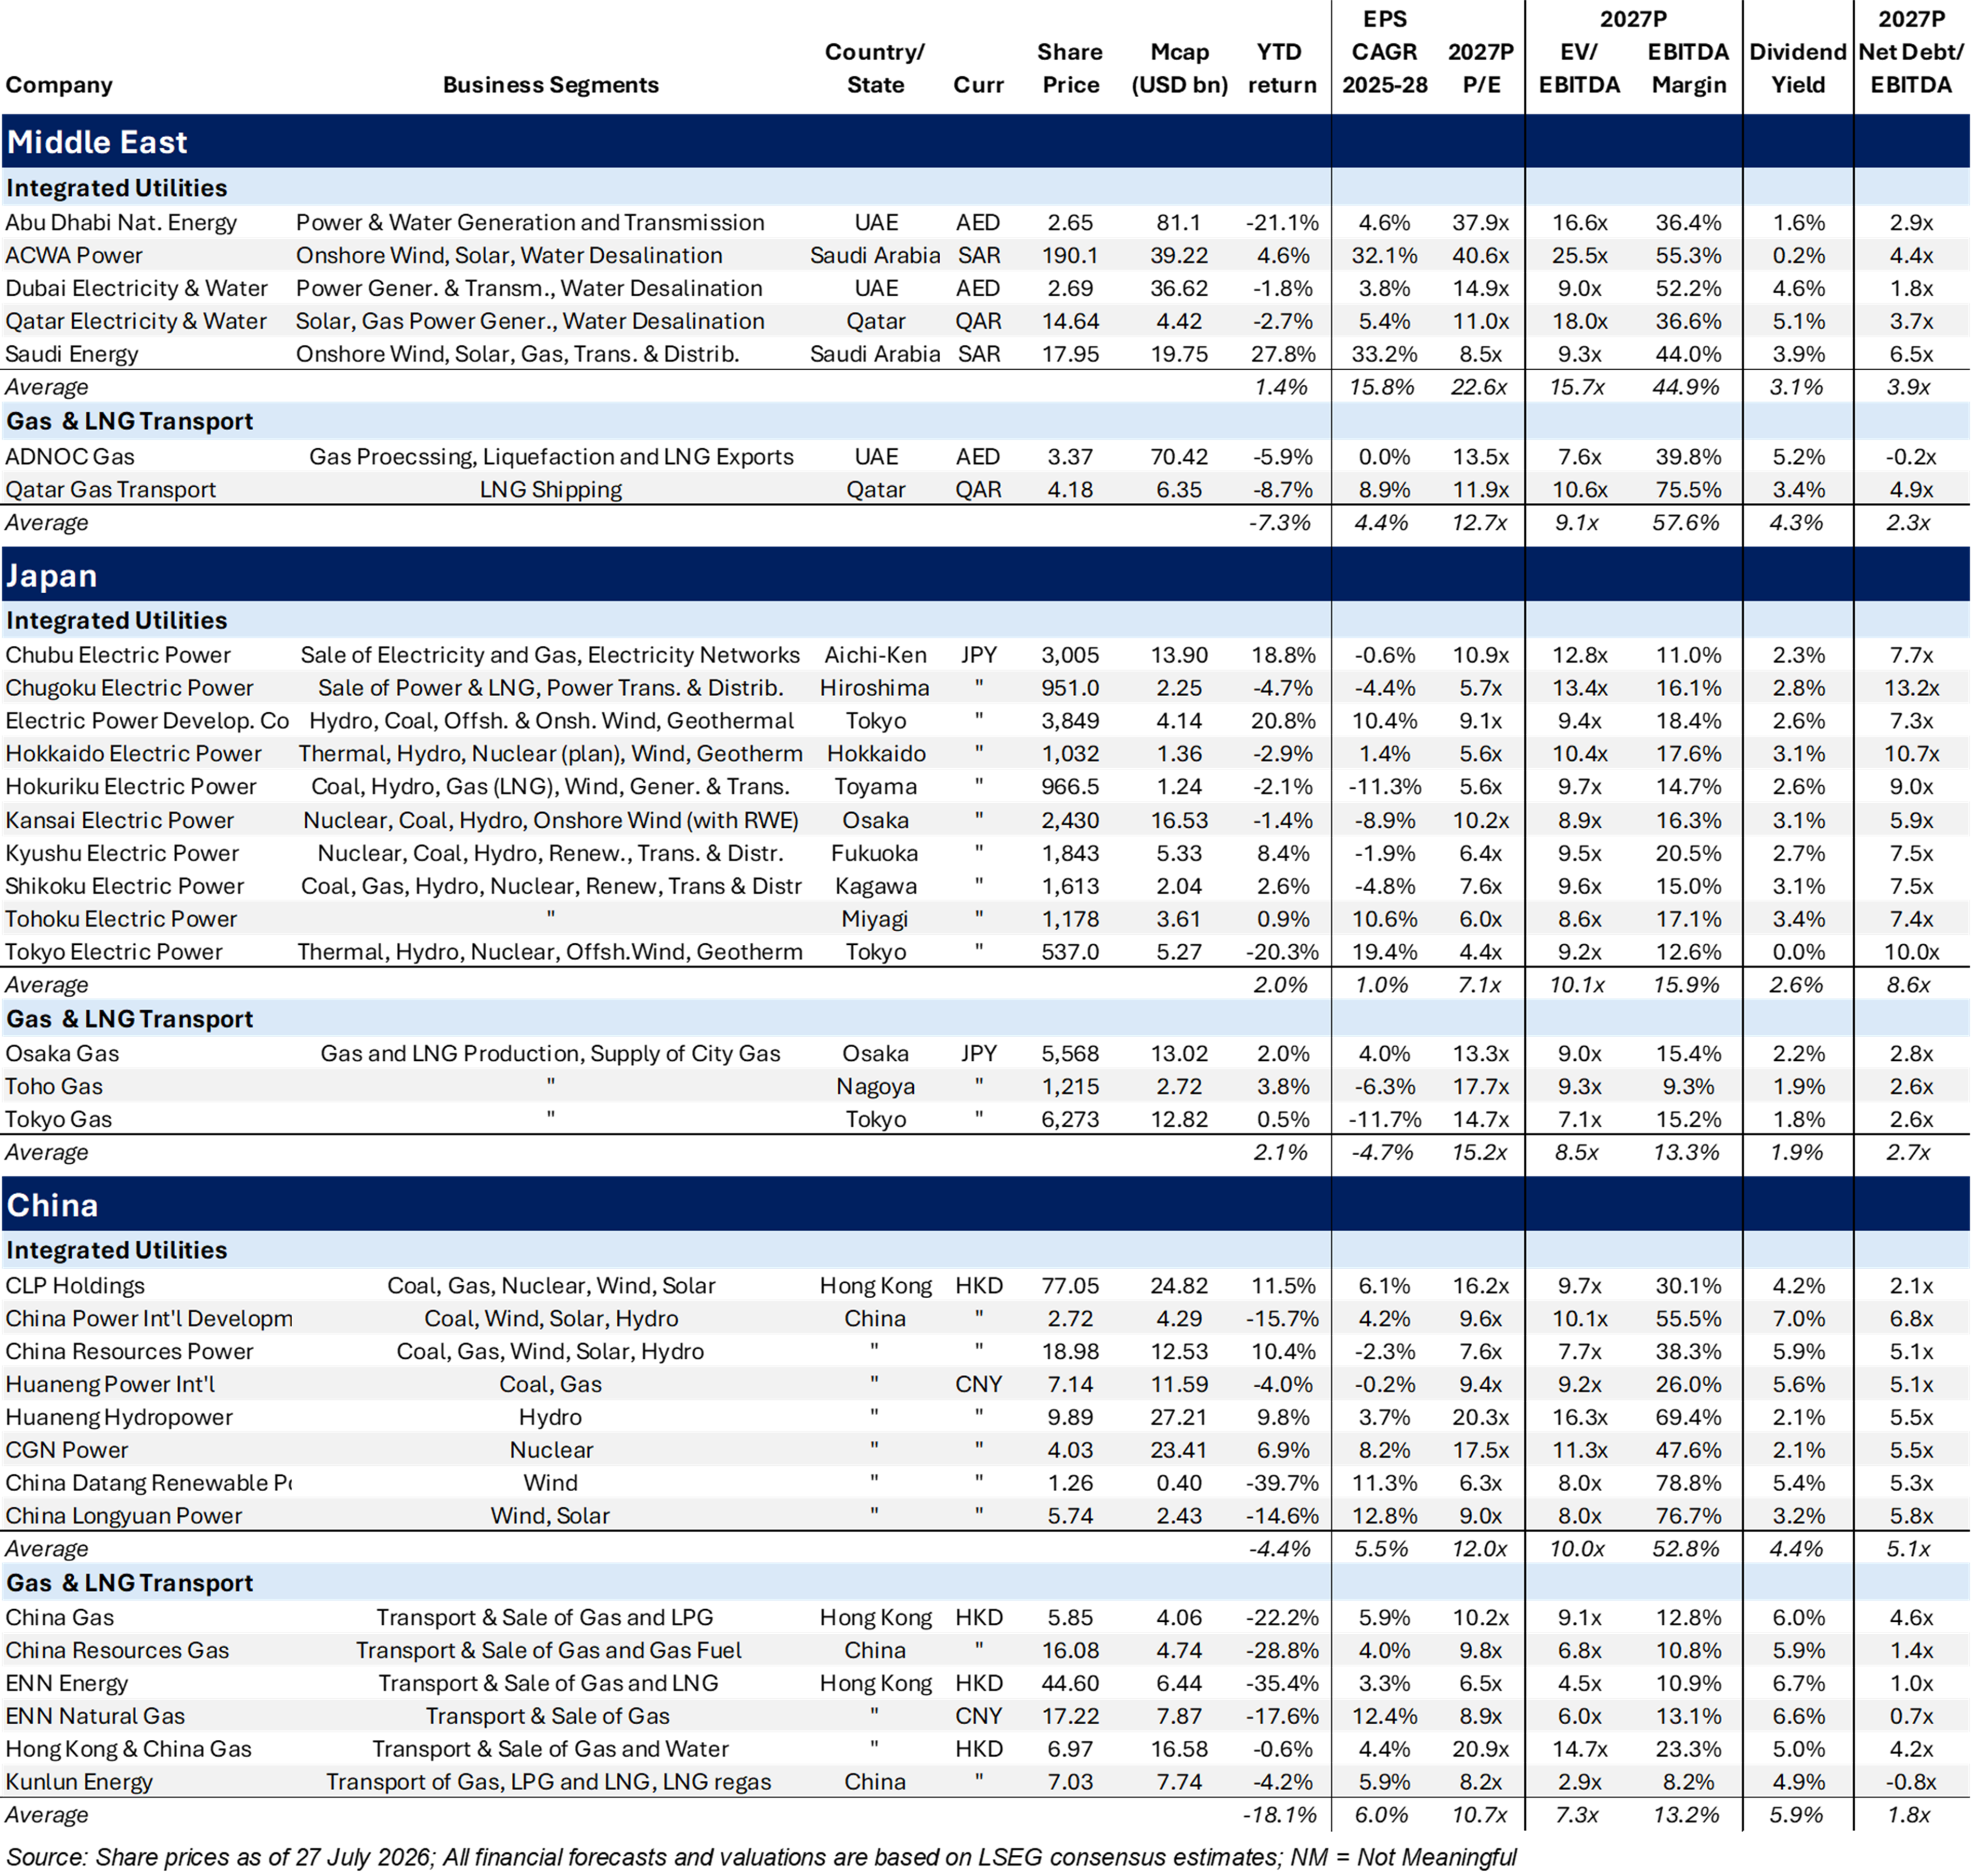
Table 4 Global Utilities – Performance & Comparative Valuation


©Gabelli Funds 2026
249 Royal Palm Beach Way, Palm Beach, FL 33480 Gabelli Funds TEL (561) 671–2100
This whitepaper was prepared by Jens Zimmermann, CFA, by Ashish Sinah, CFA, by Chong-Min Kang, and by Mitsuyoshi Kikuchi. The examples cited herein are based on public information and we make no representations regarding their accuracy or usefulness as precedent. The Research Analysts’ views are subject to change at any time based on market and other conditions. The information in this report represent the opinions of the individual Research Analysts’ as of the date hereof and is not intended to be a forecast of future events, a guarantee of future results, or investments advice. The views expressed may differ from other Research Analyst or of the Firm as a whole.
As of June 30, 2026, affiliates of GAMCO Investors, Inc. beneficially owned less than 1% of all companies mentioned.
Funds investing in a single sector, such as utilities, may be subject to more volatility than funds that invest more broadly. The utilities industry can be significantly affected by government regulation, financing difficulties, supply or demand of services or fuel and natural resources conservation. The value of utility stocks changes as long-term interest rates change.
Investors should carefully consider the investment objectives, risks, charges and expenses of the Fund before investing. The prospectus, which contains more complete information about this and other matters, should be read carefully before investing. To obtain a prospectus, please call 800 GABELLI or visit www.gabelli.com
Returns represent past performance and do not guarantee future results. Current performance may be lower or higher than the performance data quoted. Investment return and principal value will fluctuate so, upon redemption, shares may be worth more or less than their original cost. To obtain the most recent month end performance information and a prospectus, please call 800-GABELLI or visit www.gabelli.com
Distributed by G.distributors, LLC., a registered broker dealer and member of FINRA.
This whitepaper is not an offer to sell any security nor is it a solicitation of an offer to buy any security.
For more information, visit our website at: www.gabelli.com or call: 800-GABELLI
800-422-3554 • 914-921-5000 • Fax 914-921-5098 • info@gabelli.com
Gabelli Funds, LLC is a registered investment adviser with the Securities and Exchange Commission and is a wholly owned subsidiary of GAMCO Investors, Inc. (OTCQX: GAMI).