Overview
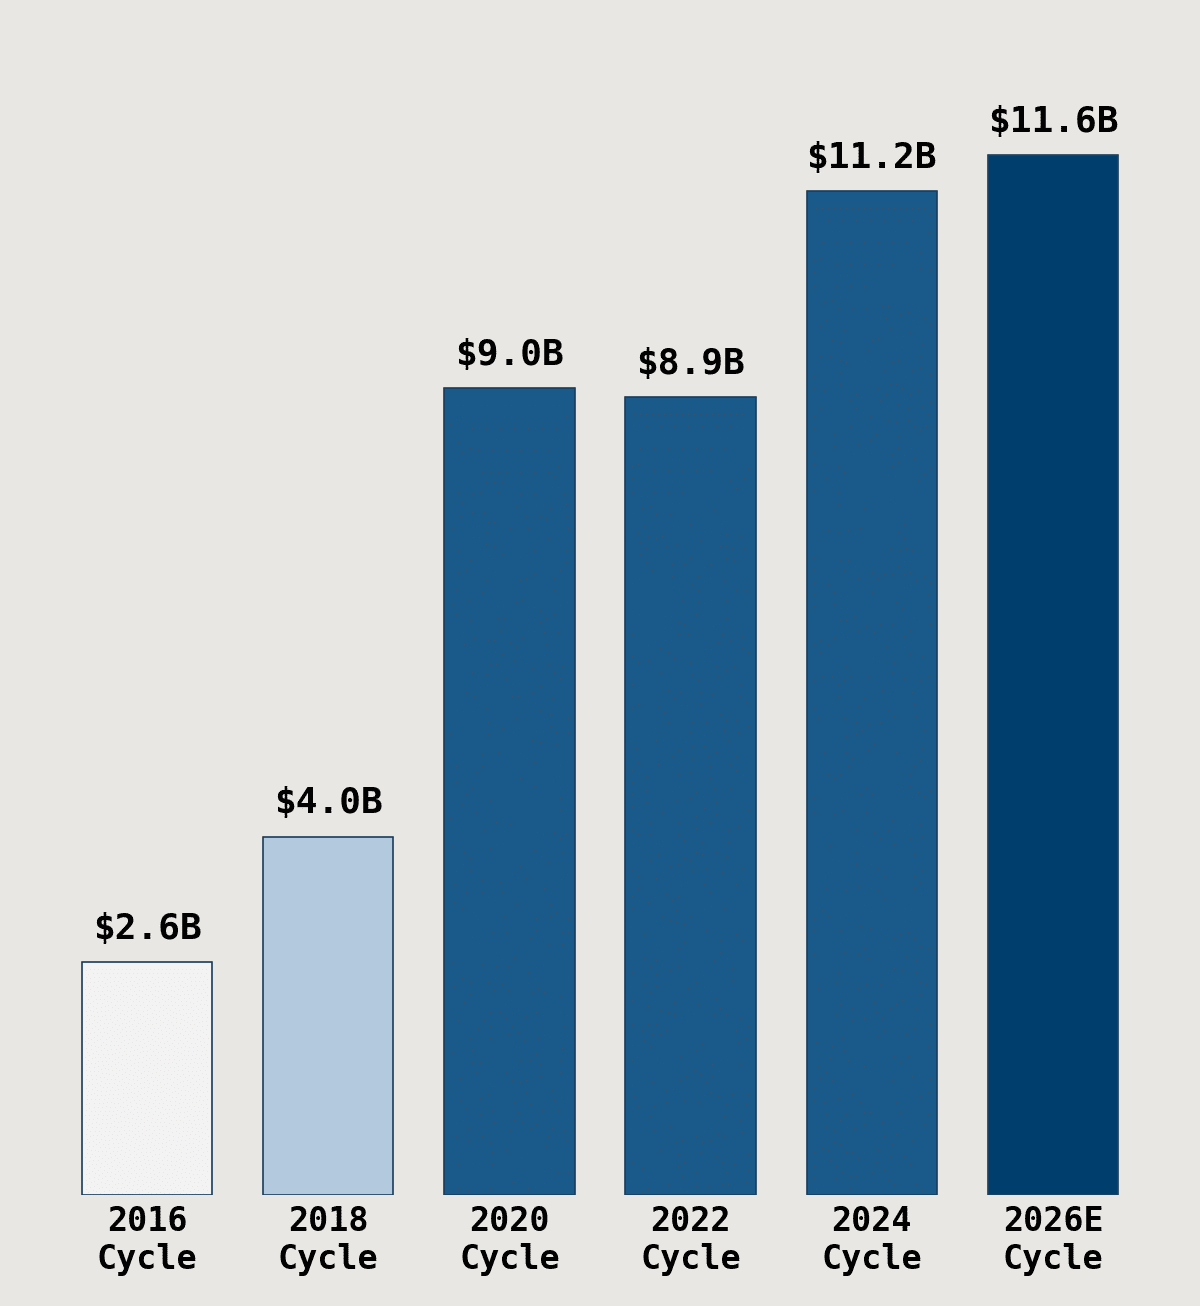
U.S. political advertising is on track for another record in 2026. AdImpact projects the 2025-2026 election cycle will reach $11.6 billion across broadcast, cable, connected TV (‘CTV’), digital, radio, and satellite – the most expensive cycle of all time. This would be ~30% above the prior midterm record of $8.9 billion set in 2022 and would even surpass the $11.2 billion spent during the 2024 presidential cycle. An expanded Senate battleground, record gubernatorial races, and a robust downballot category are driving the increase, and spend is arriving earlier than ever. Local TV, which is uniquely positioned for political ads, is expected to capture nearly 50% total or $5.6 billion. Broadcasters are already seeing the benefit, which should help mitigate softness in core (non-political) advertising.
U.S. Political Advertising Overview
The majority of U.S. political advertising occurs in even calendar years corresponding to major elections, with presidential cycles historically generating higher political advertising revenues than midterms; however, 2026 is set to break that pattern. Spending is also heavily weighted toward the end of the cycle: the August through November window has historically accounted for 58-67% of total cycle spending, with October alone representing 28-36%, as rates rise sharply approaching Election Day, which will be held this year on Tuesday, November 3, 2026.
While core advertising is highly volatile during recessionary periods (during the 2008-2009 financial crisis, U.S. advertising saw steep declines of more than 15%), politicians and PACs are generally well-financed. Accordingly, they have not been as significantly impacted by recent macro dynamics, including tariffs and economic uncertainty, as most other advertisers. Fundraising remains robust: combined cash-on-hand among major party committees and super PACs reached $755 million in Q1 ’26, up from $555 million at the same point in 2024 and $656 million in 2022. Political continues to be one of the few advertising areas to show growth cycle over cycle, from roughly $4 billion during the 2018 midterm to $11.6 billion projected for the 2026 cycle, per AdImpact.
Exhibit 1 U.S. Political Advertising, 2016-2026E
Source: AdImpact 2025-2026 Updated Political Projections Report
2026 Election Cycle Outlook & Race Expectations
With no presidential race this cycle, the Senate is the largest category, projected at $3.4 billion, a 48% increase over 2022 and 27% above 2024. Eleven competitive Senate races are expected to draw $3.0 billion, with six projected to exceed $300 million and two to exceed $400 million; Texas is expected to be the most expensive race at ~$445 million. Gubernatorial spending is projected at a record $2.4 billion with 36 governorships on the ballot, and three of the four most expensive gubernatorial races in history fall in this cycle (California, New Jersey, and Georgia). House spending is projected at $2.0 billion, the highest midterm total on record, though redistricting made 28 seats less competitive. The downballot category, which consists of all political spend that is not Presidential, House, Senate, or Gubernatorial, is projected at a record $3.0 billion, with state legislative races adding another $698 million.
Spending Across the Map
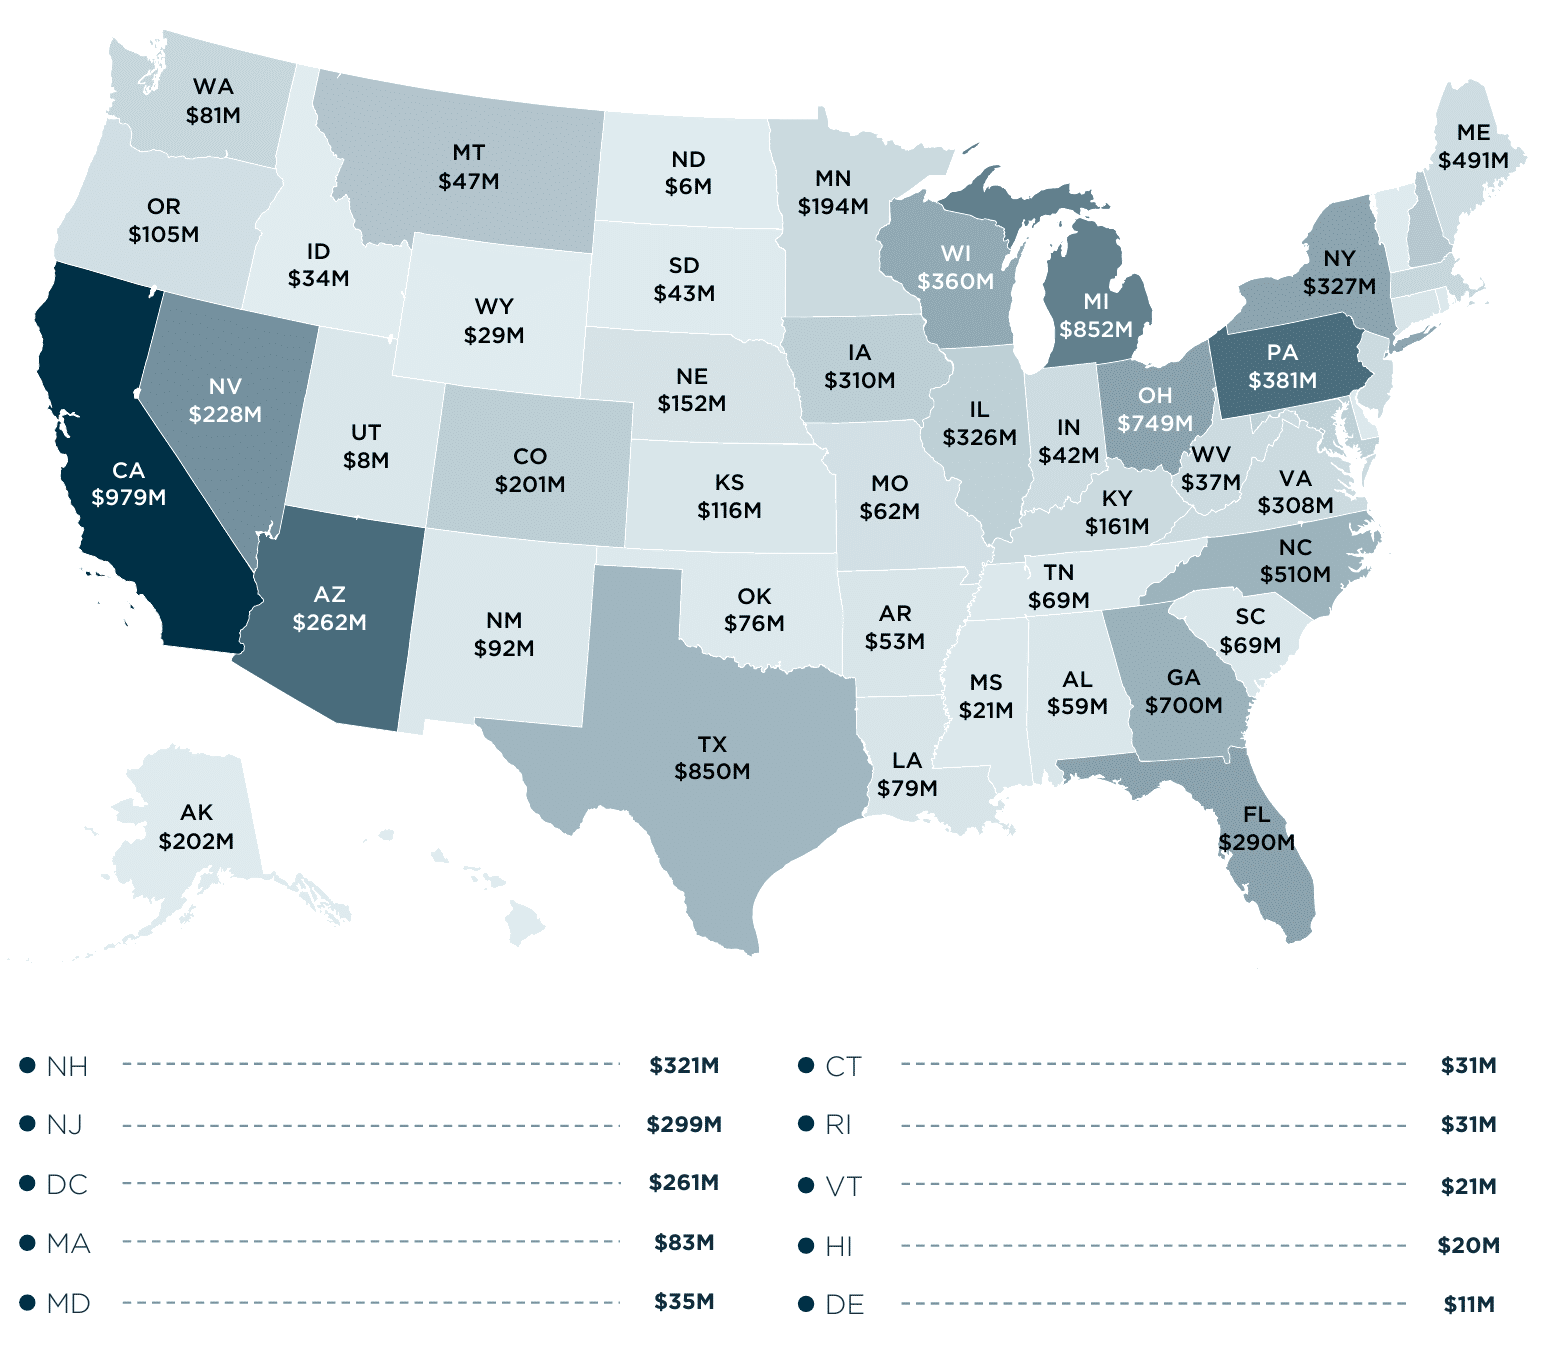
California is projected to see the most political advertising dollars this cycle at $979 million, driven by its record gubernatorial race as well as the Proposition 50 redistricting measure. Michigan ($852 million), Texas ($850 million), Ohio ($749 million), and Georgia ($700 million) round out the top five, each hosting competitive Senate and/or gubernatorial contests, followed by North Carolina ($510 million), Maine ($491 million), Pennsylvania ($381 million), and Wisconsin ($360 million) – see Exhibit 2 below for additional detail.
Since AdImpact’s initial projections for the cycle last fall, the largest increases have come in Ohio, Texas, Maine, Alaska, and Iowa on newly competitive statewide races, while Florida, New York, and North Carolina saw the largest reductions as key races became less competitive.
| Exhibit 2 | Projected 2025-2026E Political Advertising Spend by State |
Source: AdImpact’s 2025-2026 Updated Political Projections Report
Drivers of Record 2026 Political Advertising Forecasts
Increasingly Competitive Senate Battleground: In the U.S., all 435 House seats and one-third of the 100 total Senate seats are renewed every two years, while most gubernatorial elections occur in midterm years. In 2026, 35 Senate seats are on the ballot including special elections in Ohio and Florida, with control of both chambers in play. Since last fall, Maine and Ohio have moved to Toss-up, and Nebraska and Alaska have become more competitive.
Record Gubernatorial Cycle: 36 governorships are on the ballot this year, and the ten Toss-up and Lean races alone are projected at a combined $1.3 billion, with several marquee contests on pace to set new records.
Robust Downballot & State Legislative Spending: Downballot and state legislative spending are projected at a combined $3.7 billion, 14% above the prior high set in 2022. There were 121 statewide ballot measures certified across 37 states as of June 1st, and spending in this category is expected to accelerate further up until Election Day.
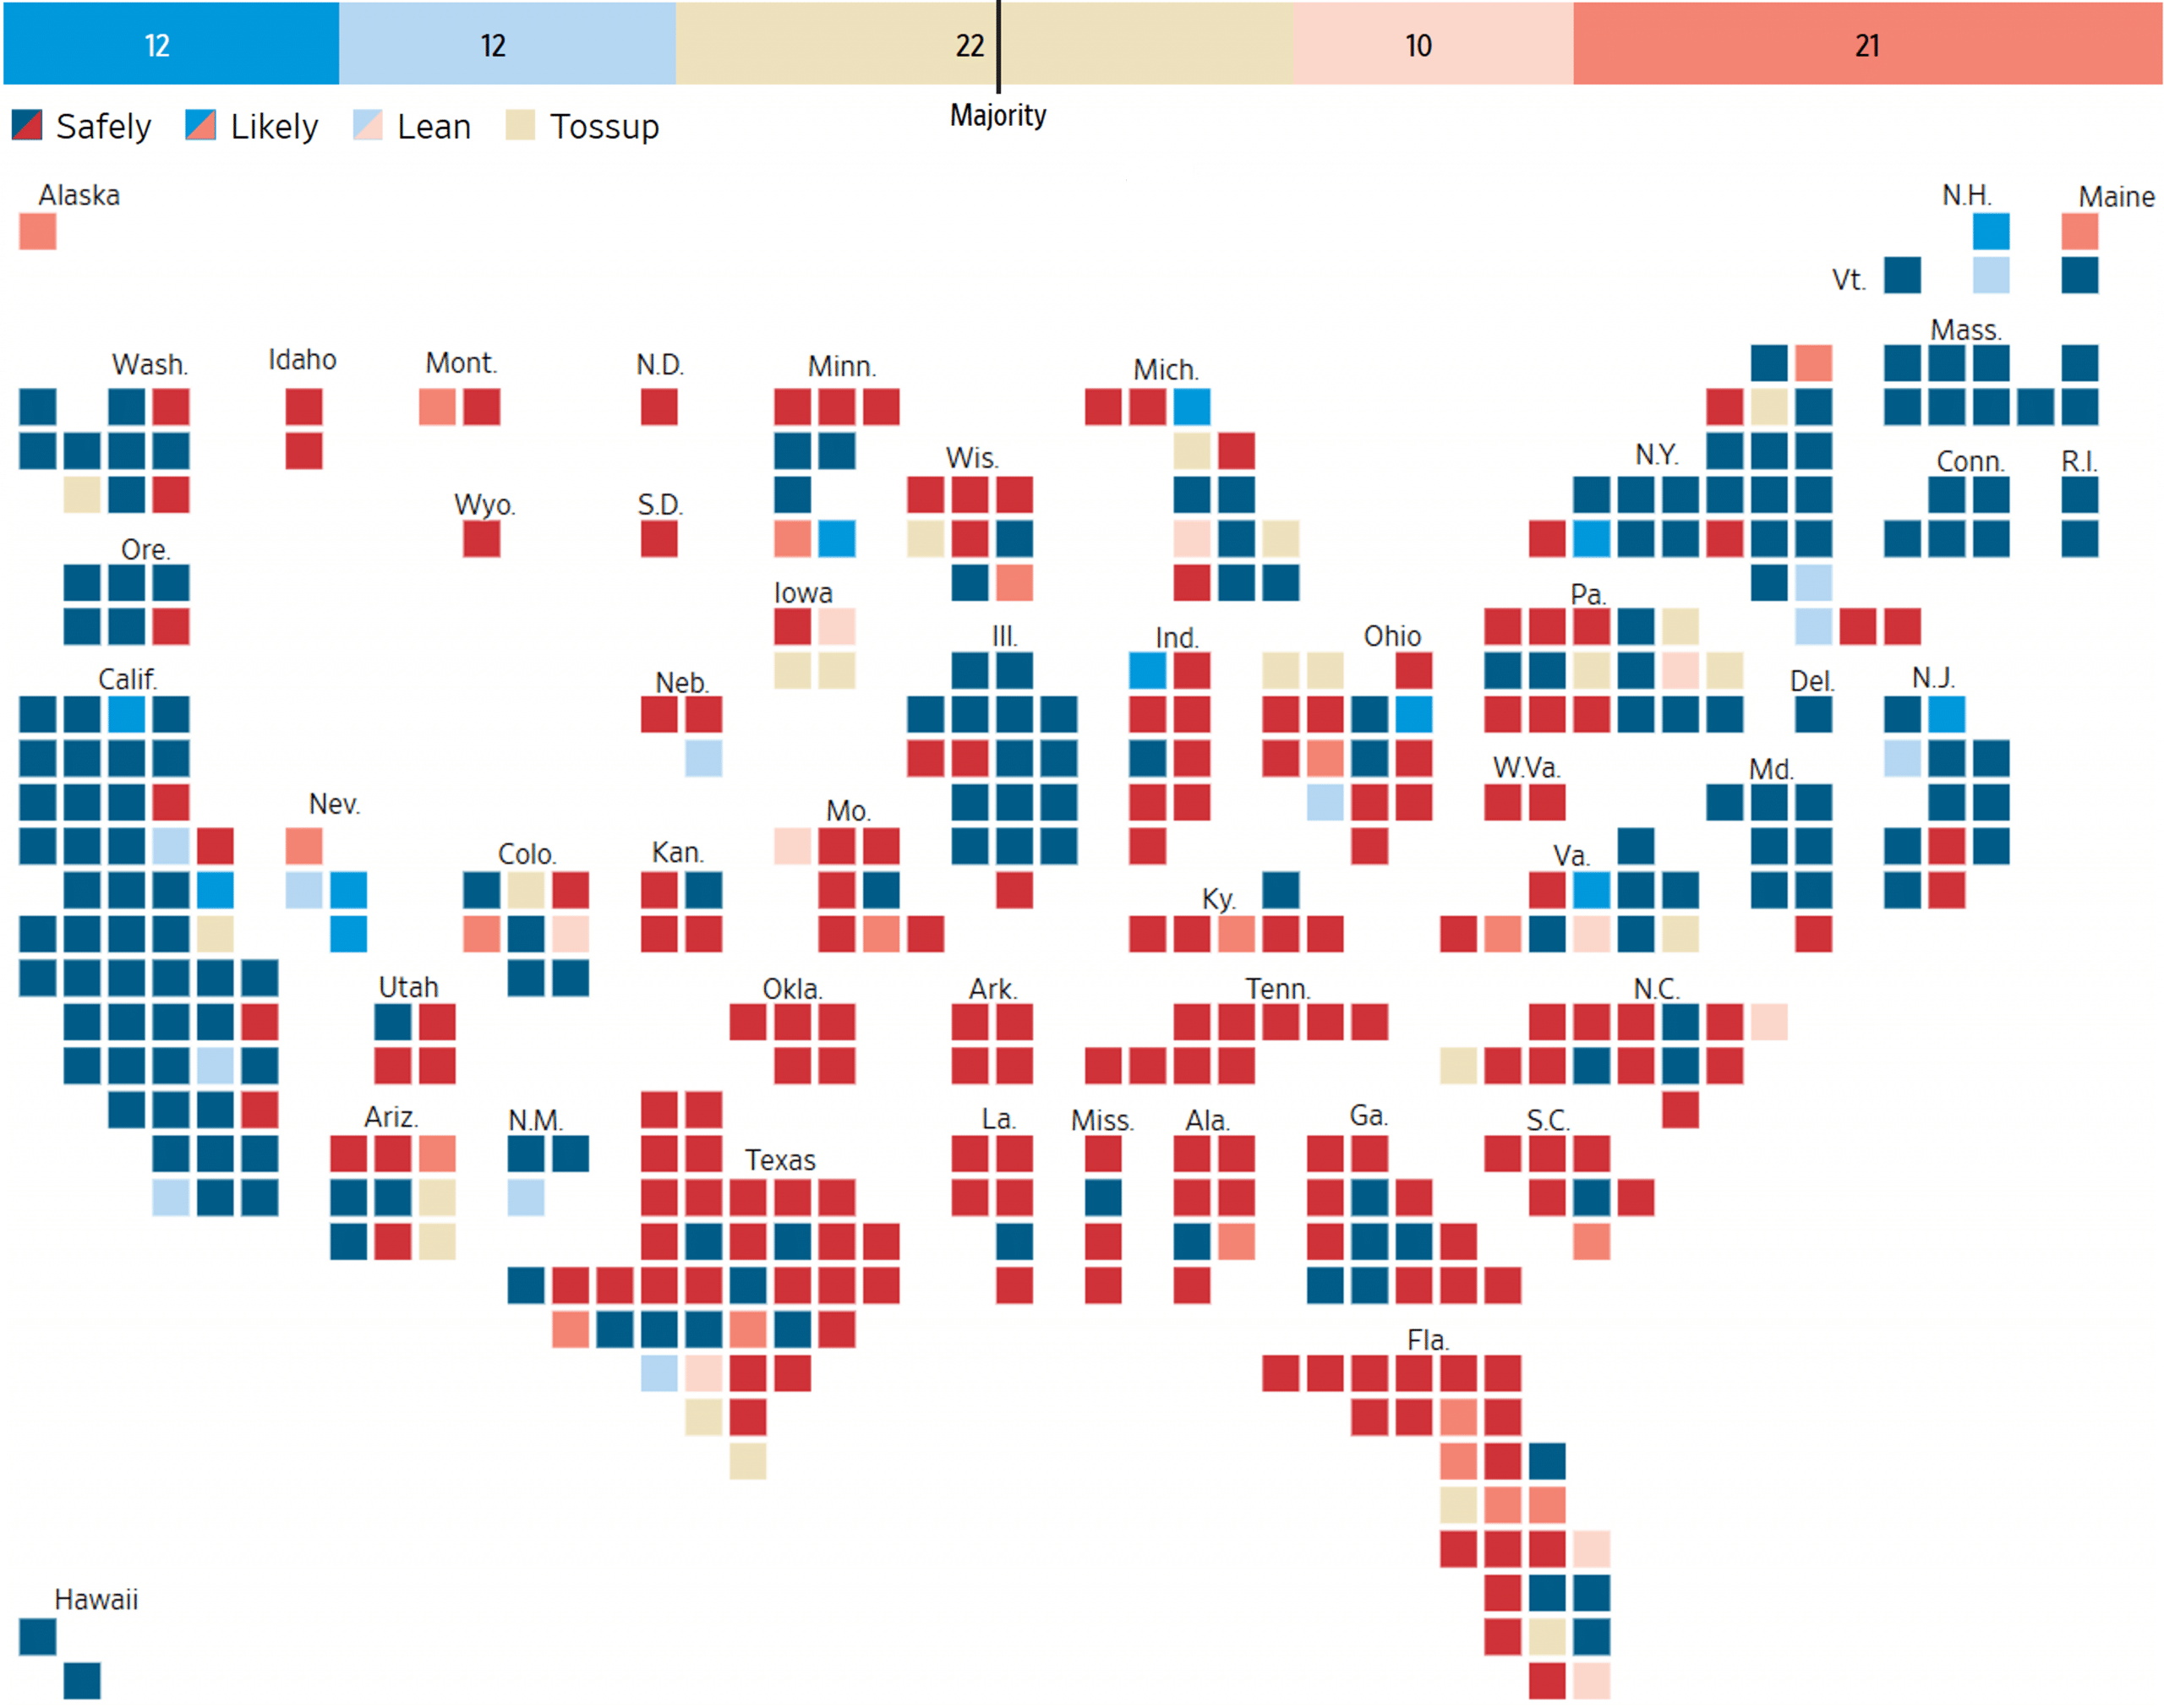
Redistricting Concentrating House Dollars: An unprecedented wave of mid-decade redistricting across California, Texas, Missouri, North Carolina, Ohio, and other states has reshaped the House map and reduced the number of competitive seats. Rather than lowering spending, this is expected to concentrate more dollars into the remaining battlegrounds. Redistricting battles have also generated meaningful spending on their own. The House remains closely divided – Republicans hold 219 seats to Democrats’ 214, and either party can gain control with 218 members (a majority of the total 435 House representatives). Aggregated nonpartisan ratings (Cook Political Report, Inside Elections, UVA Center for Politics’ Crystal Ball Report) show 44 competitive races including 22 tossups; Democrats would need to win 12 of those tossups and every seat leaning their way to flip the chamber (see Exhibit 3).
Earlier, Record-Setting Pace: Spend is materializing earlier than in any prior cycle, with multiple record-setting races, including the most expensive Senate primary on record in Texas ($135 million), concluded before the summer. Broadcasters note that political crowd out, which historically ramps in October, is now starting around Labor Day.
| Exhibit 3 | U.S. House Outlook by Race Rating, 2026E Cycle |
Source: The Wall Street Journal (as of September 25, 2026); ratings aggregated from Cook Political Report, Inside Elections, and Sabato’s Crystal Ball
Political Ad Regulation & Pricing Dynamics
Political ads aired on TV and radio are regulated by the FCC and regulations stipulate that in the 45 days before a primary and 60 days before a general election, broadcasters must offer qualified candidates an equal amount of advertising time at the lowest unit rate (‘LUR’) for that spot. Super PACs and issue groups are not subject to LUR and generally command the highest rates, which drives up the price of ad inventory. Issue groups have accounted for a growing majority of linear TV political in every cycle since 2018. The digital channel is not regulated by the FCC and has had trouble managing political content; several major digital players have chosen to limit political ads.
Rates also typically climb sharply into Election Day: in 2024 candidate rates rose 38% from April-June to September, with a further 20% increase in October. With spending starting and demand visible earlier this cycle, broadcasters are focused on managing yield across a longer selling window rather than relying on late-cycle pricing alone.
Implications from Coordinated Party Spending & Lowest Unit Rate (‘LUR’) Rulings
Recent Supreme Court action has, for now, extended LUR access to party spending coordinated with candidates. Broadcasters view the impact as manageable this cycle, as party money has historically represented only a low- to mid-single-digit percentage of their political revenue (~5% at Nexstar). LUR also applies by class of time, so an actively managed monthly rate card can neutralize much of the pricing impact. Broadcasters have noted that the change could even be a modest positive: linear TV remains among the most effective ways to get out the vote, and access to the preferential rate may pull more party dollars toward local TV.
Who Benefits from Record 2026 Political?
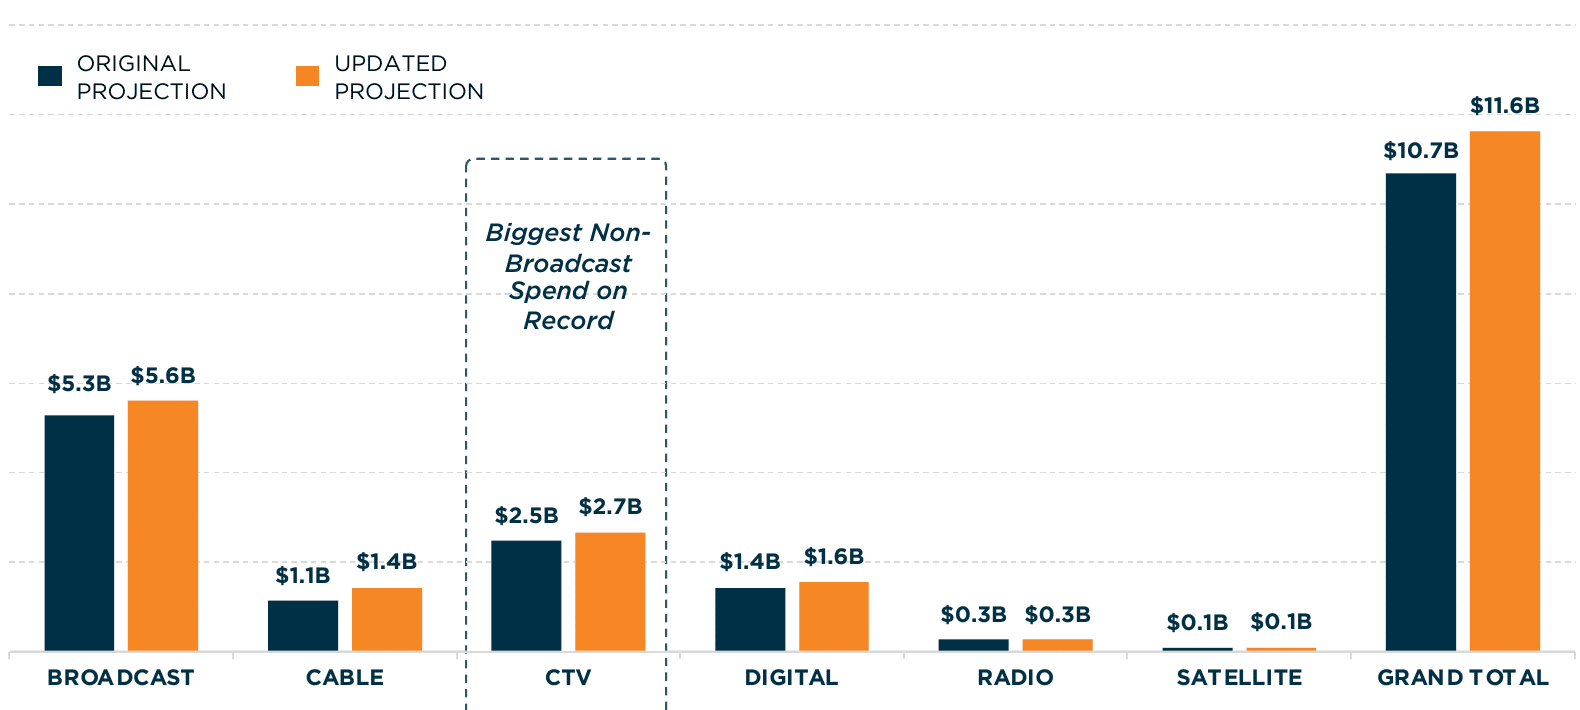
Given the regional nature of their signals, local TV stations are uniquely positioned for political advertising. While digital and CTV continue to take share of the broader ad market, local TV still captures the lion’s share of political spend: AdImpact forecasts $5.6 billion, or just under 50%, to broadcast, followed by CTV ($2.7 billion), digital ($1.6 billion), cable ($1.4 billion), and radio ($300 million). CTV remains the fastest-growing channel (12% of cycle spend in 2022, 21% in 2024, and a projected 23% in 2026), but broadcast reach remains unmatched for persuading undecided voters and accordingly broadcast political dollars continue to rise cycle-over-cycle.
| Exhibit 4 | Projected Political Spend by Media Type, 2025–2026E Cycle |
Source: AdImpact’s 2025-2026 Updated Political Projections Report
Pure-Play Broadcasters to Benefit Most
Given low variable costs of station ownership, political dollars largely fall to a broadcaster’s bottom line and can drive roughly 10-15% advertising revenue growth over a non-political year. Competitive races generate the most spend, so stations in markets with crucial races should outperform. In our view, pure-play broadcasters are best-positioned for a robust 2026 cycle, as high-margin political ads make up a larger share of revenue: Nexstar (NXST), which closed its TEGNA acquisition in March (still held separate pending litigation), Gray (GTN), Sinclair (SBGI), and E.W. Scripps (SSP). Company commentary to date supports a record midterm (see Exhibit 5).
| Exhibit 5 | Broadcaster Political Outlook & Commentary, 2026E Cycle |
| Company | Political Guidance and Recent Commentary |
| Gray Media (GTN) | Q3 political guide raised to $188-$195 million (vs. $165-$185 million), incl. ~$9 million from recent acquisitions; 9M political of ~$305 million vs. $260 million in 2022 and $247 million in 2024 |
| Nexstar (NXST) | Historically captures a low-teens % share of broadcast political (TEGNA hsd’s); pre-TEGNA footprint already covered 80-90% of contested markets; Q3 core guided down msd’s, partly on political crowd out |
| Sinclair (SBGI) | 2026 political guide for $375 million+; Q2 political up 9% vs. Q2 ’22; top 10 political markets include 6 competitive Senate, 7 Governor, and 30+ House races |
| E.W. Scripps (SSP) | 2026 political guidance of $225-$250 million vs. ~$200 million in 2022; not expected to surpass 2024 given that cycle’s presidential spend across a highly competitive footprint; expects record political again in 2028 |
Source: Company reports
Political cash flow is also being put to work on balance sheets. Nexstar expects to have repaid $1 billion+ of TEGNA acquisition debt by year-end, Sinclair has retired or repaid $320 million of debt year-to-date, and Gray expects no revolver borrowings at quarter-end as it pursues a refinancing of its credit facility. Scripps, the most levered of the group, plans to delever with free cash flow and sees a potential refinancing window next year.
Conclusion
Political advertising is set for a record 2026 midterm cycle and is expected to surpass even the 2024 presidential cycle. In contrast, core (non-political) advertising remains soft amid macro uncertainty, pressure in various consumer-facing categories, and political crowd out. Local TV should remain the primary beneficiary, capturing nearly half of all political advertising. Given low variable costs, those dollars largely fall to a pure-play broadcaster’s bottom line, supporting free cash flow generation and deleveraging across the group heading into 2027 and another record political election cycle expected in 2028.
249 ROYAL PALM WAY PALM BEACH, FL 33480 Gabelli Funds TEL (561) 671-2100
This white paper was prepared by Hanna Howard. The examples cited herein are based on public information and we make no representations regarding their accuracy or usefulness as precedent. The Research Analyst’s views are subject to change at any time based on market and other conditions. The information in this report represent the opinions of the individual Research Analyst’s as of the date hereof and is not intended to be a forecast of future events, a guarantee of future results, or investments advice. The views expressed may differ from other Research Analyst or of the Firm as a whole.
As of June 30, 2026, affiliates of GAMCO Investors, Inc. beneficially owned 10.9% of Sinclair, 5.7% of E.W. Scripps, 2.5% of Gray Media Class A, and less than 1% of all other companies mentioned.
This whitepaper is not an offer to sell any security nor is it a solicitation of an offer to buy any security.
Investors should consider the investment objectives, risks, sales charges and expense of the fund carefully before investing.
For more information, visit our website at: www.gabelli.com or call: 800-GABELLI
800-422-3554 • 561-671-2100 • info@gabelli.com