Monthly Utilities Sector Update – Europe, Middle East & APAC
What You Need to Know
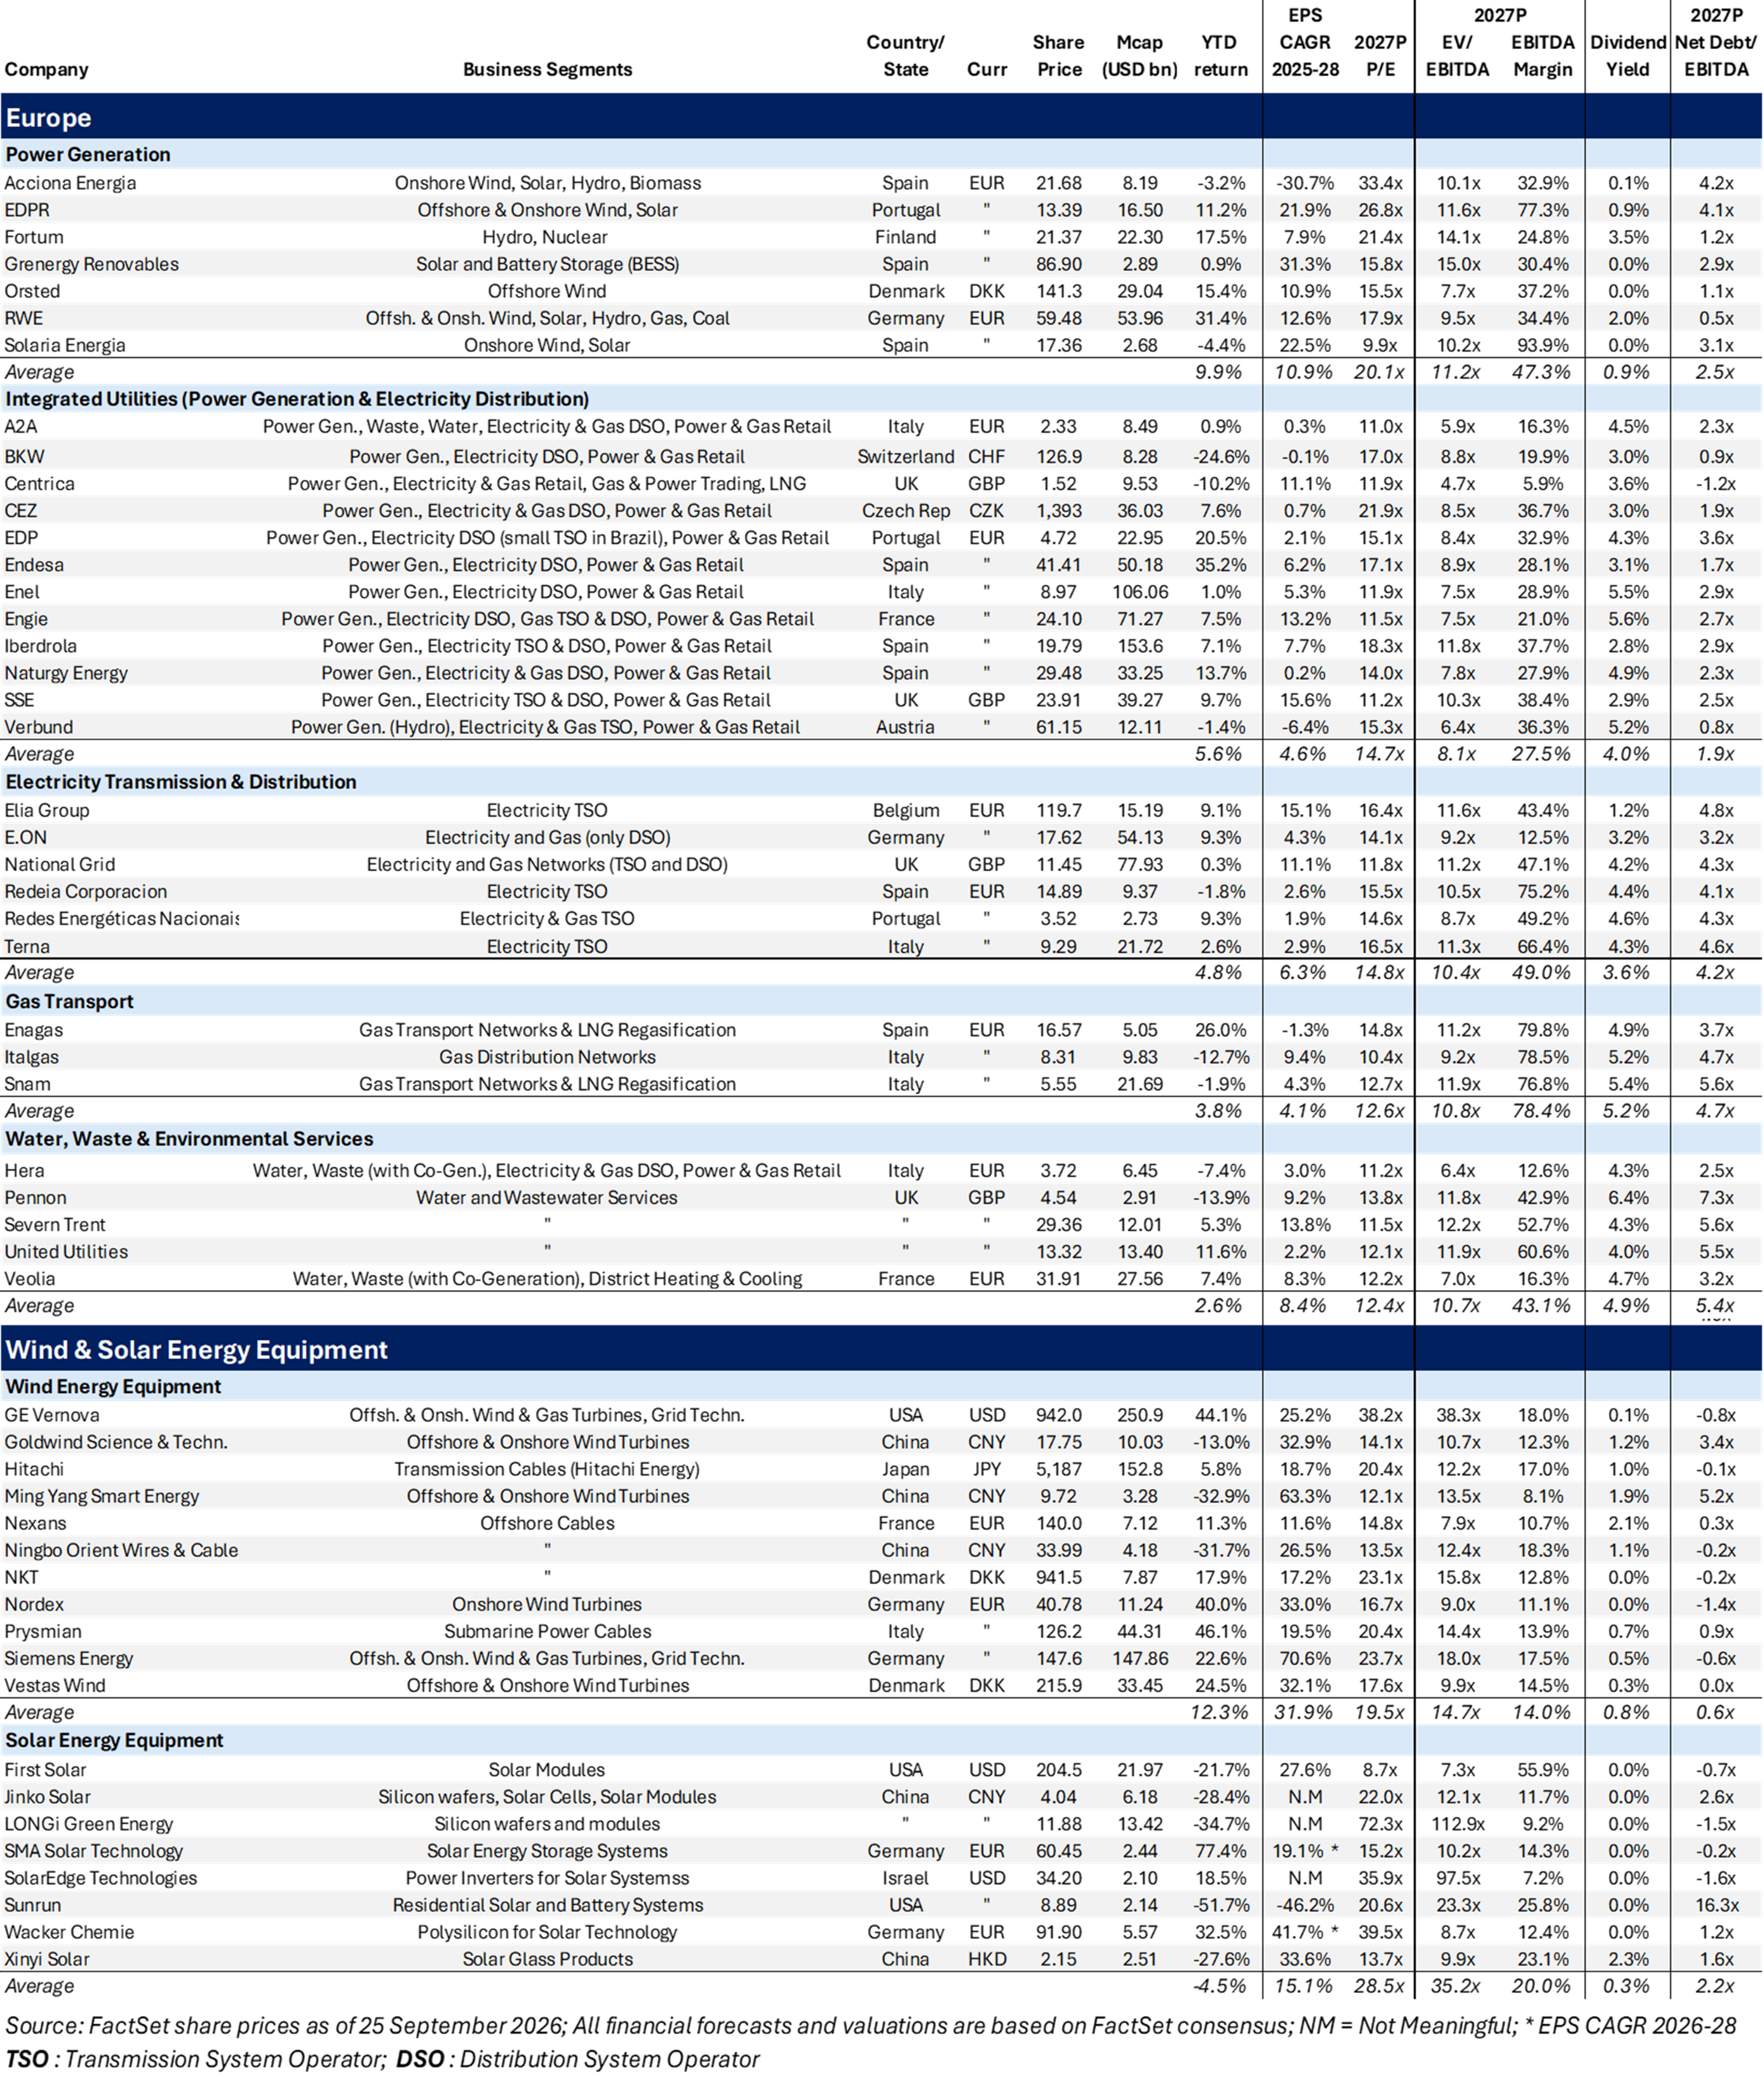
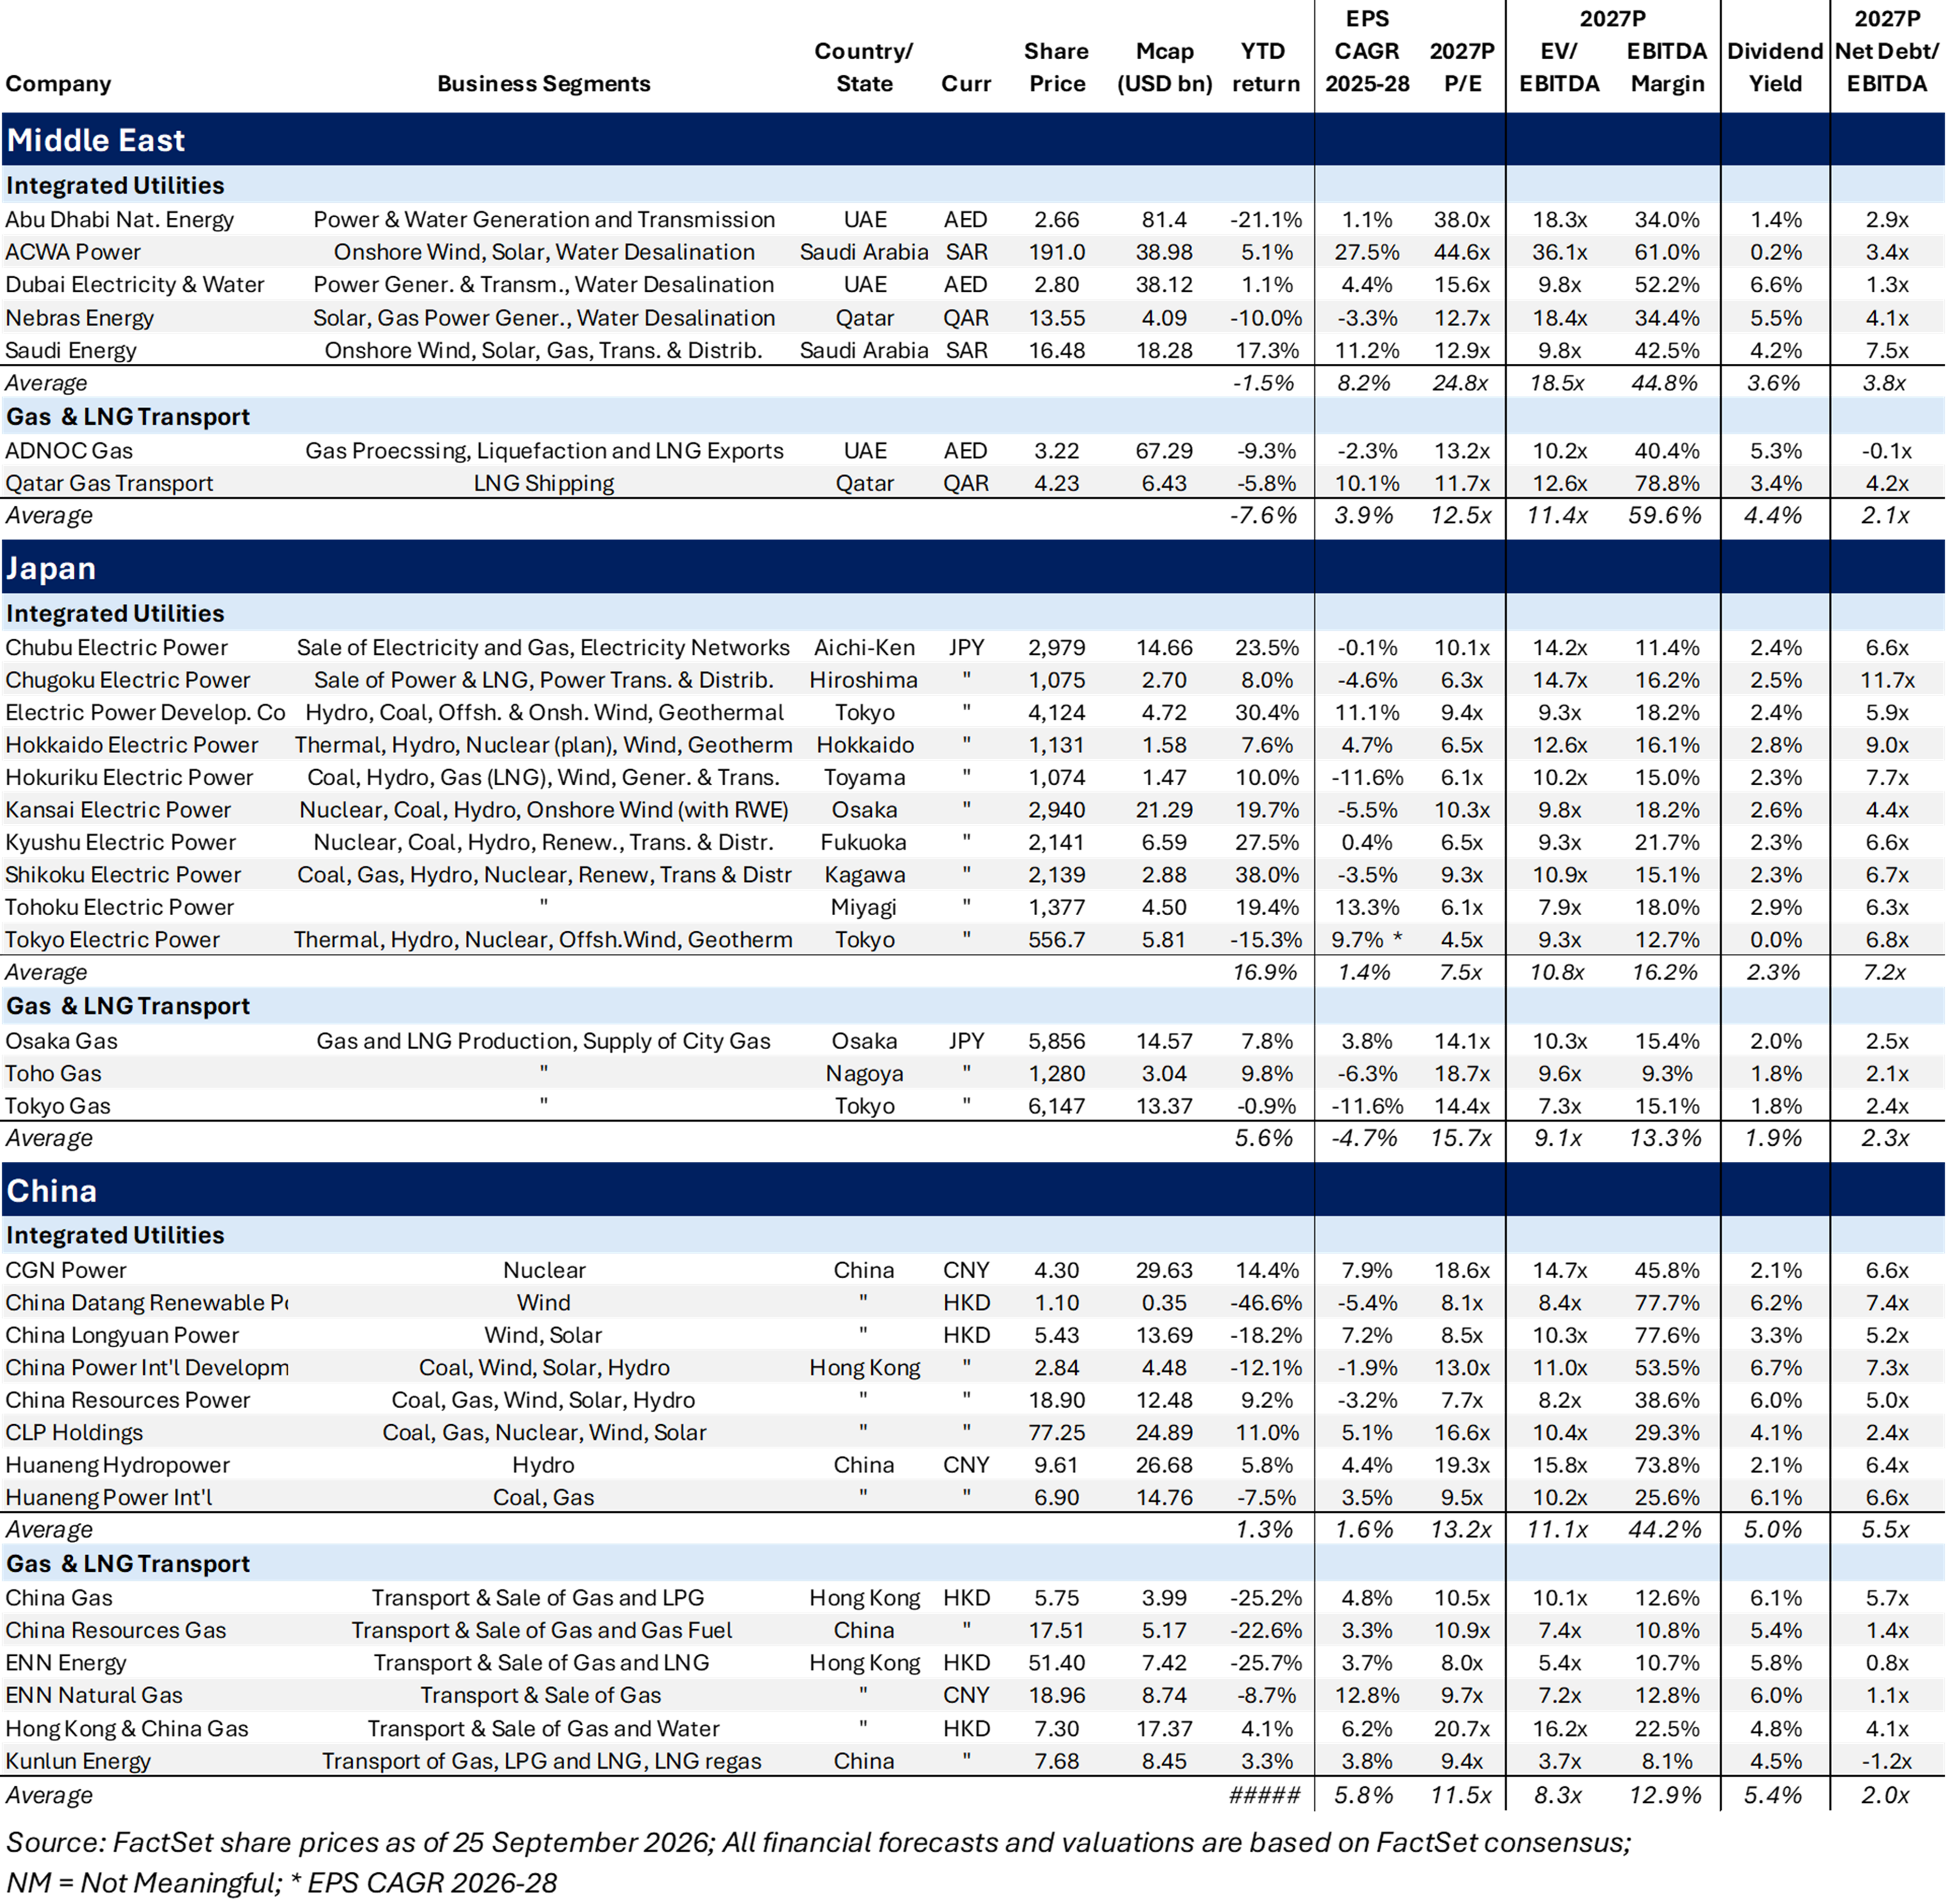
As the Middle East conflict drags on, the rebound in commodity prices has pushed up inflation expectations, triggering violent moves in government bond markets last week. With Brent and WTI jumping back above $100/bbl in September, and Asian LNG and European gas prices hitting their highest levels since the start of the military conflict in February, the benchmark 10-year US Treasury yield jumped to 5.2% last week. European 10-year yields also rose to 5.4% in the UK, 4.7% in France and 3.6% in Germany. So far, the rise in bond yields has not weighed on equities broadly: the MSCI World benchmark index is still on track for a small 3Q gain, along with a solid 12.6% year-to-date (y-t-d) gain as of 24 September. Utilities, by contrast, have been hit hard, with the MSCI World Utilities index now posting a 2.9% y-t-d loss (see Table 1). Investor sentiment apparently still treats utilities mostly as bond proxies, continuing to ignore the sector’s strong underlying fundamentals: mid-to-high-single-digit medium-term EPS growth on the back of rising power demand from data centers in the US and the electrification of various economic sectors in Europe, Japan and China (see valuation Table 5 in the back).
Table 1 Index Performances
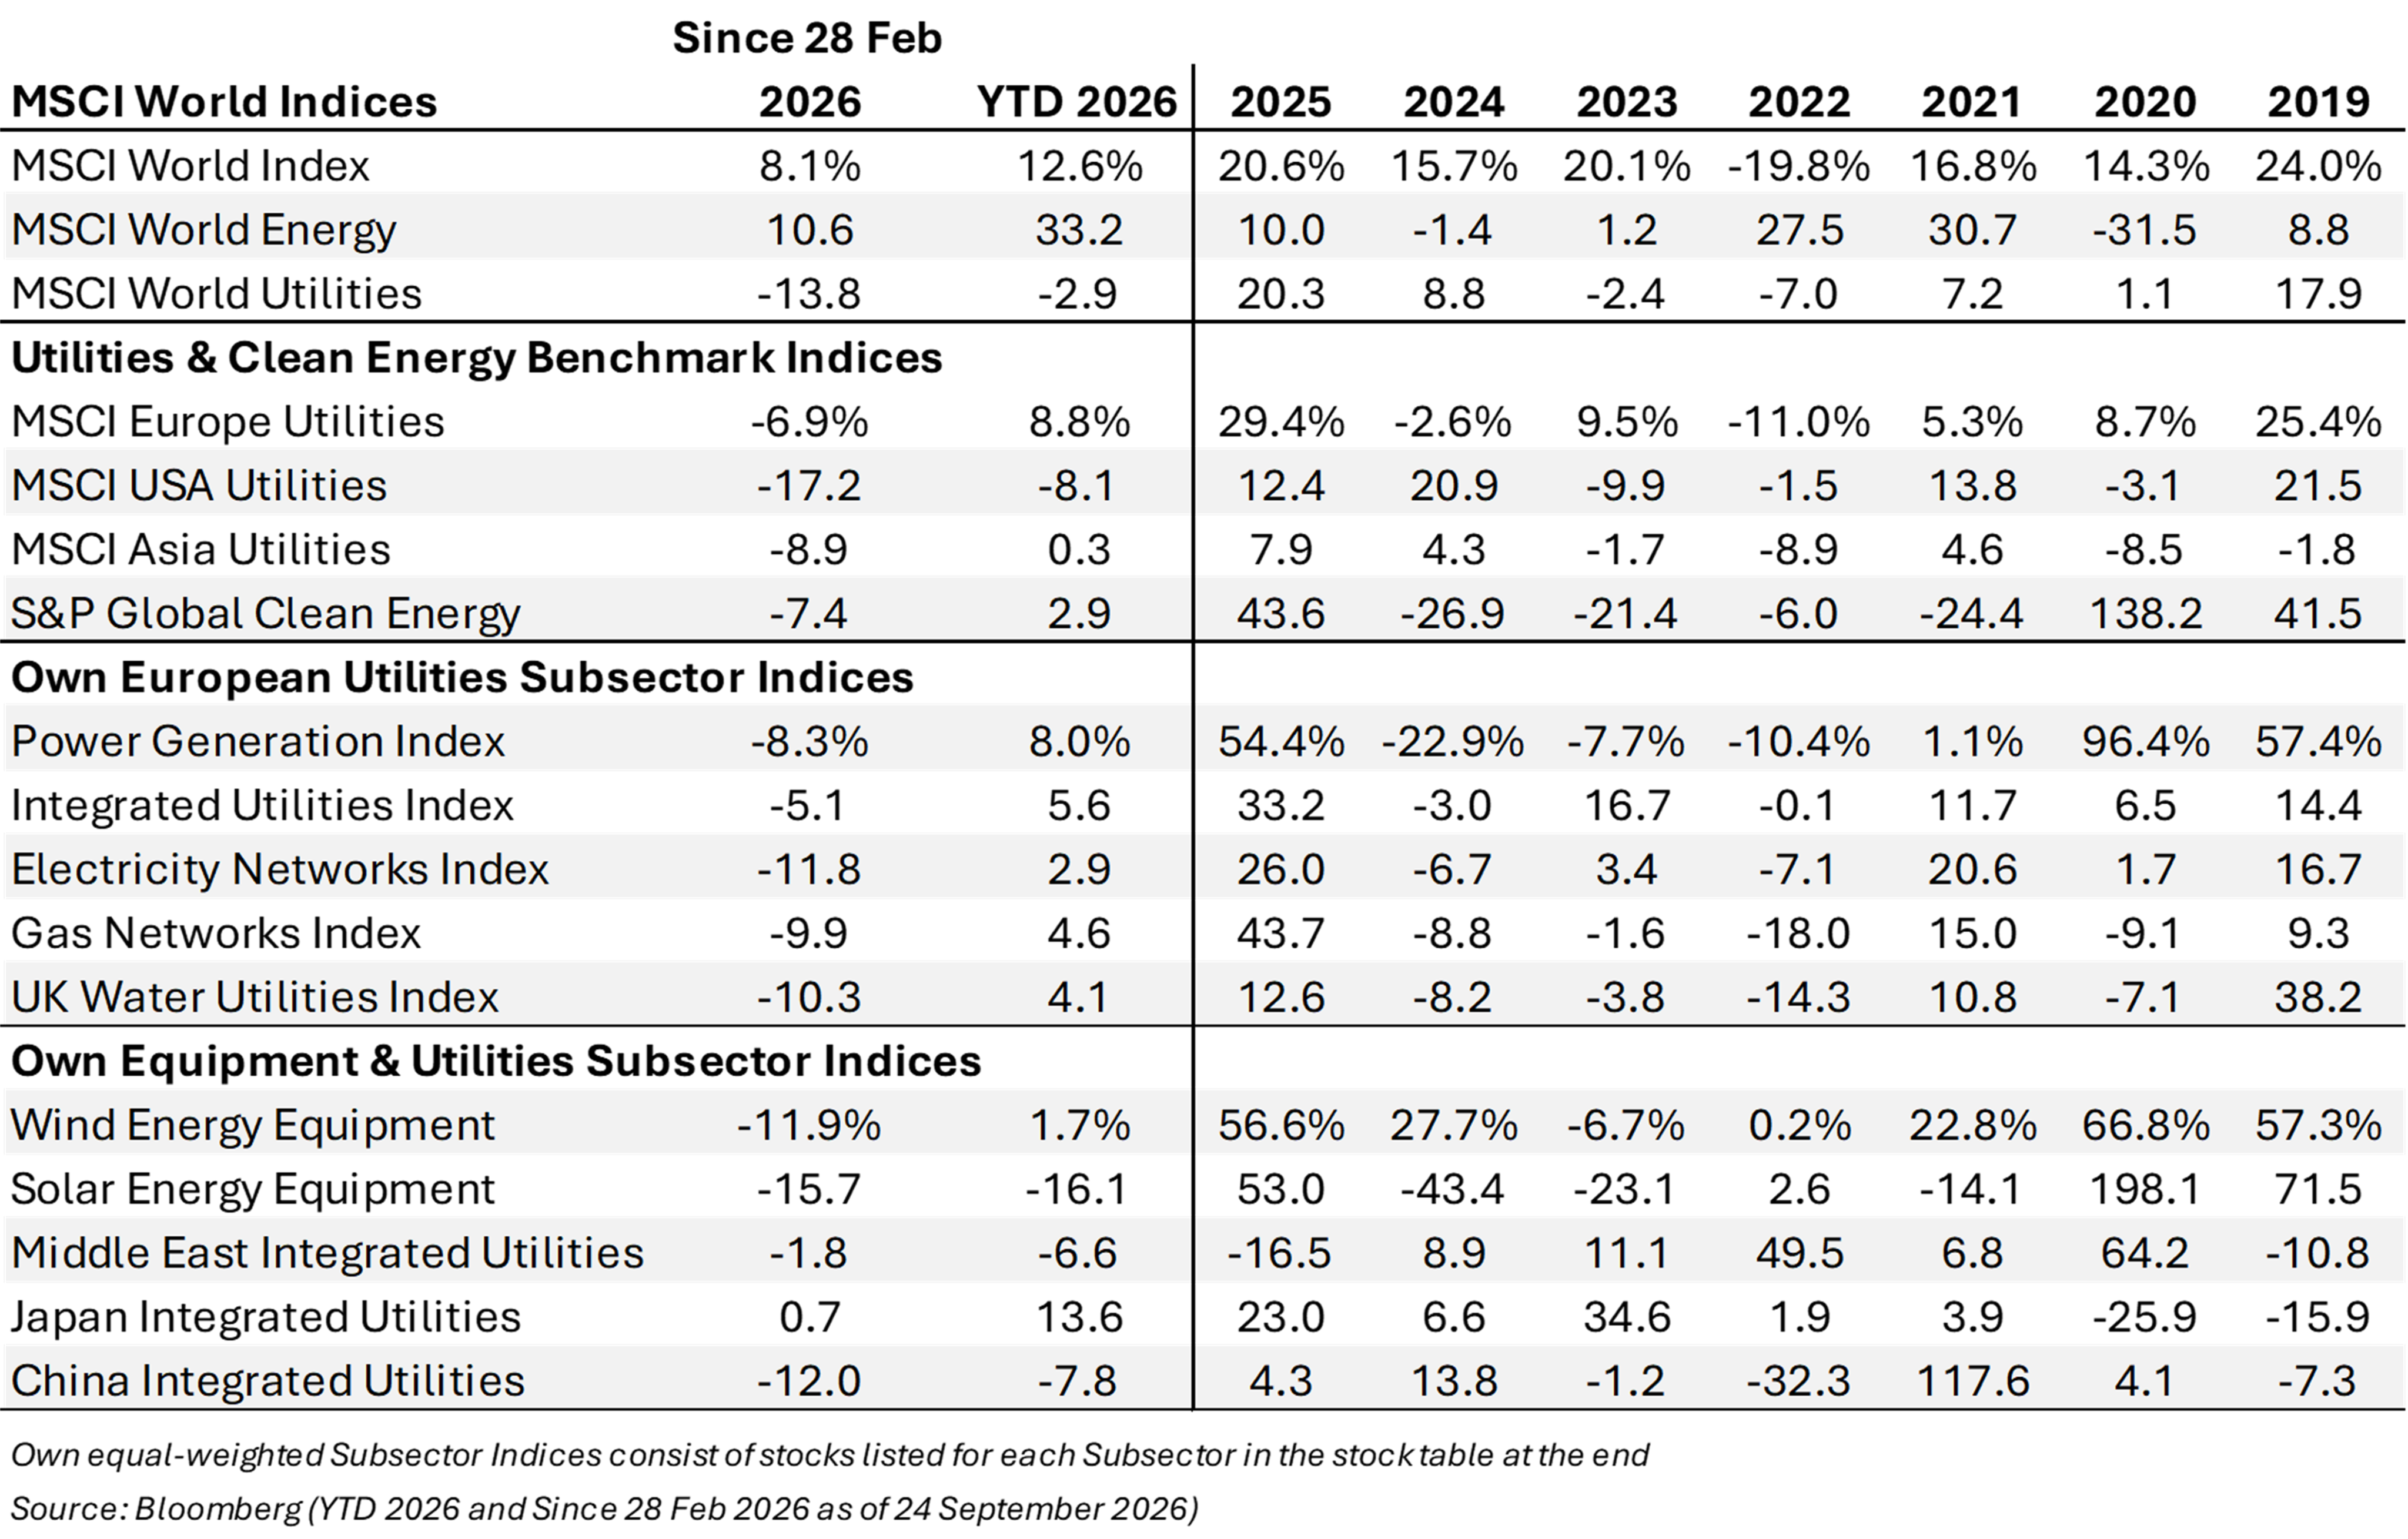

US utilities have suffered the most, mostly from rising rates but also from growing data center pushback in the US, with the y-t-d performance of the MSCI US Utilities index now negative (-8.1%), while the MSCI Asia Utilities is still hanging on to a small gain (see Table 1). European utilities have also given back a large part of their double-digit gains from before the start of the Iran war, but the MSCI Europe Utilities is still up 8.8% y-t-d, because parts of the sector benefit from higher natural gas prices. As gas-fired generation is the marginal power supplier in Europe, gas prices set power prices under Europe’s merit order principle, and an increase in gas prices translates directly into higher electricity prices. With power generators benefiting from higher power prices, our equal-weighted “Power Generation” and “Integrated Utilities” subsector indices show the strongest y-t-d performance among all European subsectors in Table 1. In other regions, only Japanese utilities are posting strong y-t-d gains, while the y-t-d performance of our equal-weighted indices for power and gas utilities in the Middle East and China has also turned negative (see Table 1).


Exhibit 1 Short-Term PERFORMANCE Exhibit 2 Long-Term VALUATION
(rebased since 2025) (1-yr Forward EV/EBITDA since 2017)
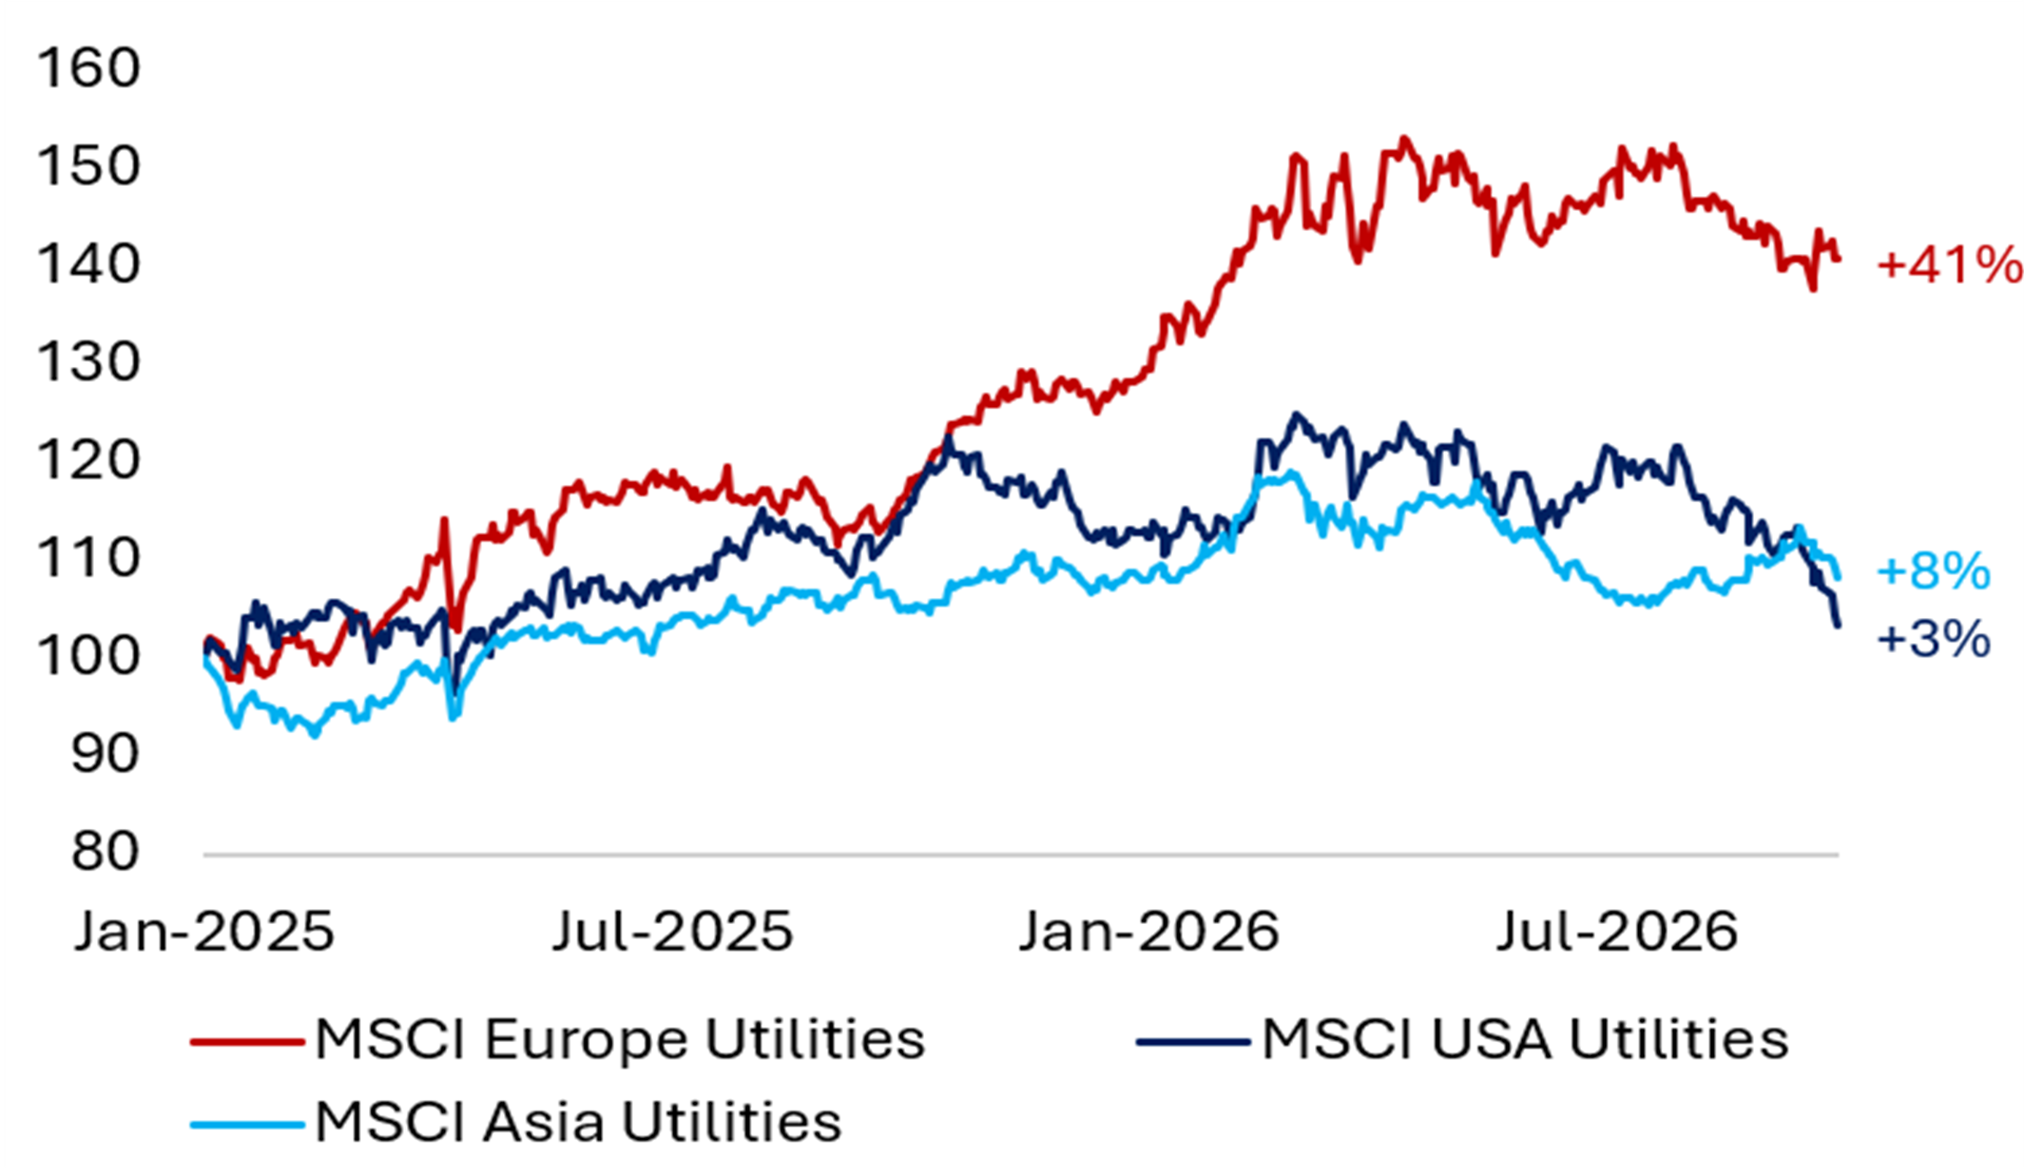
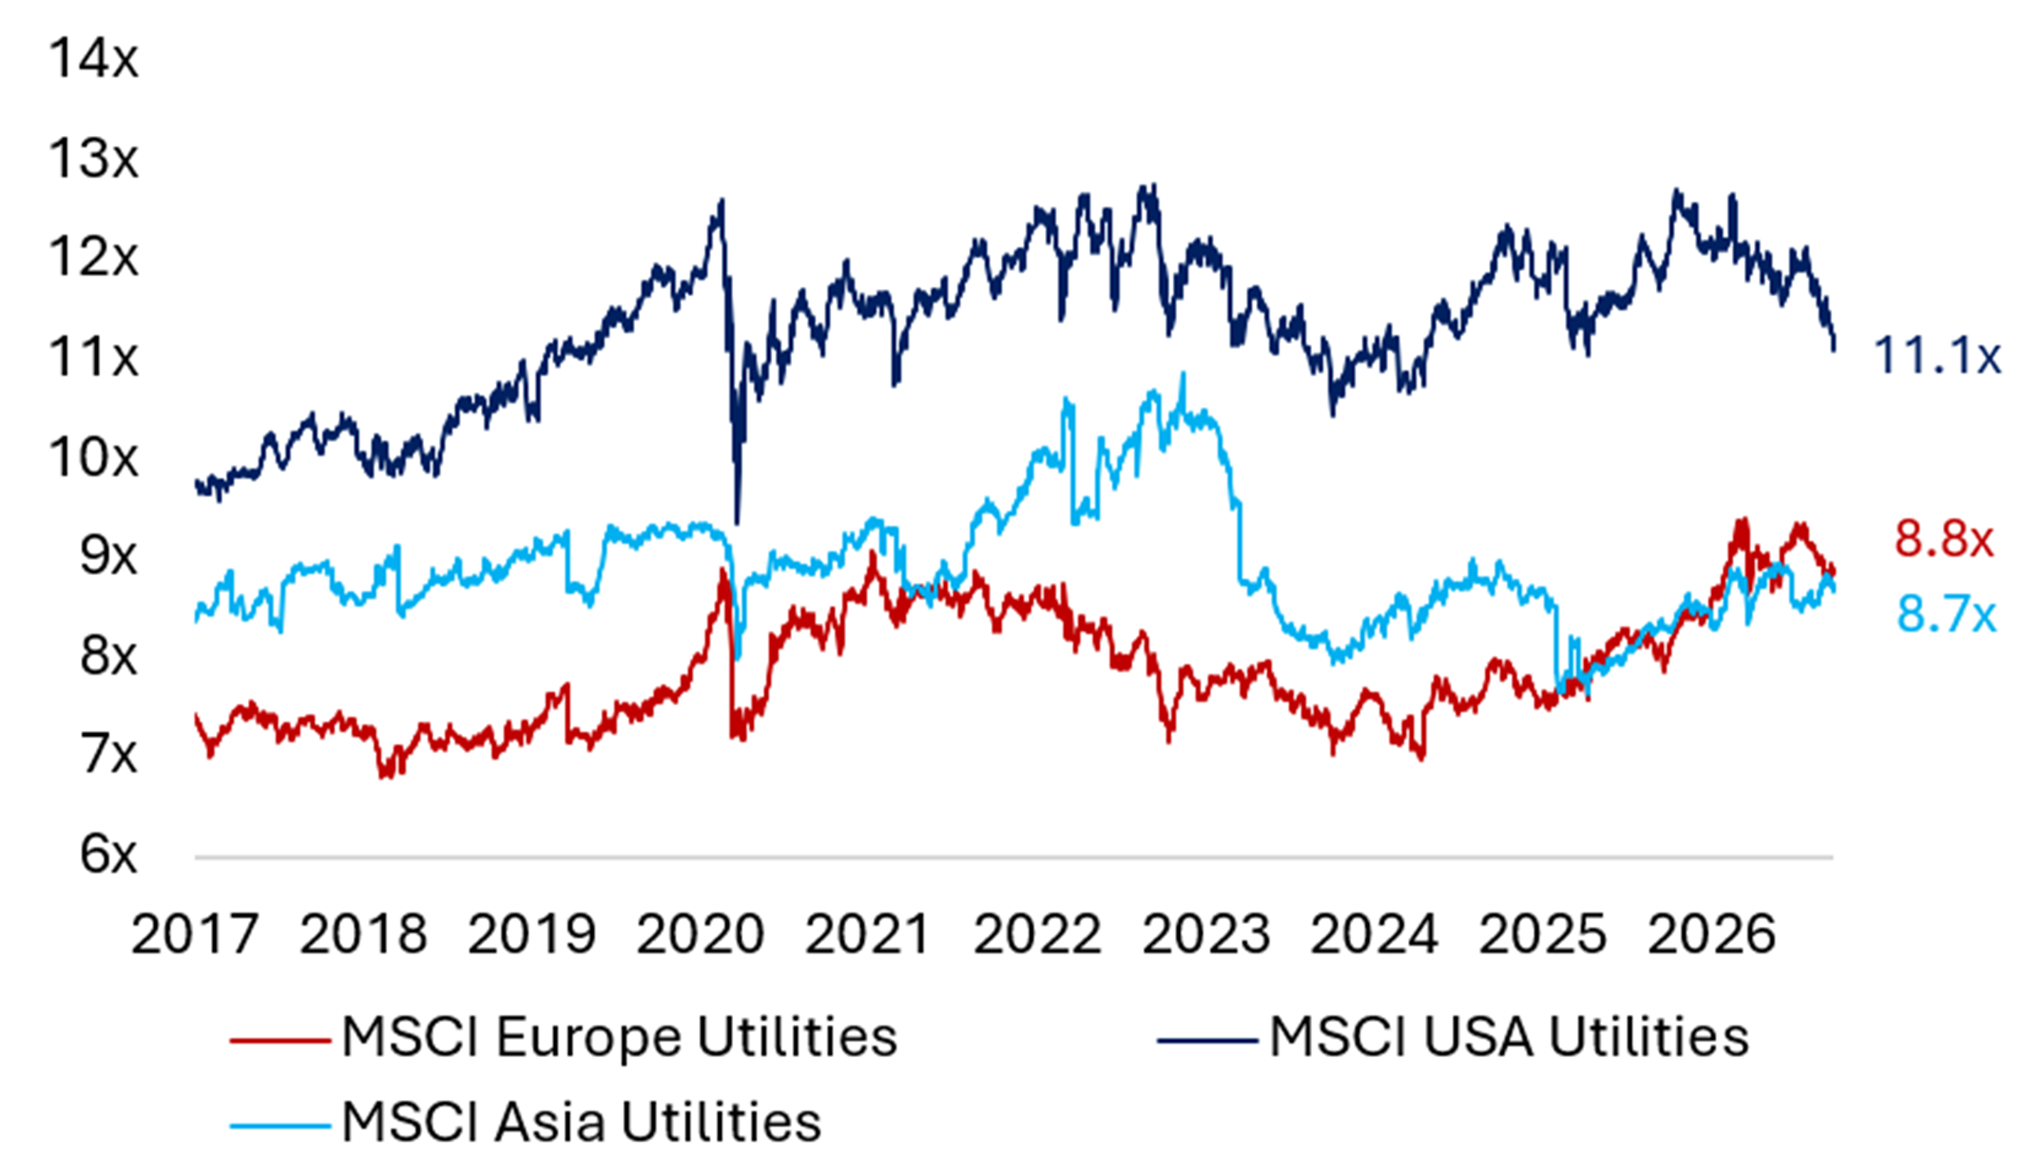

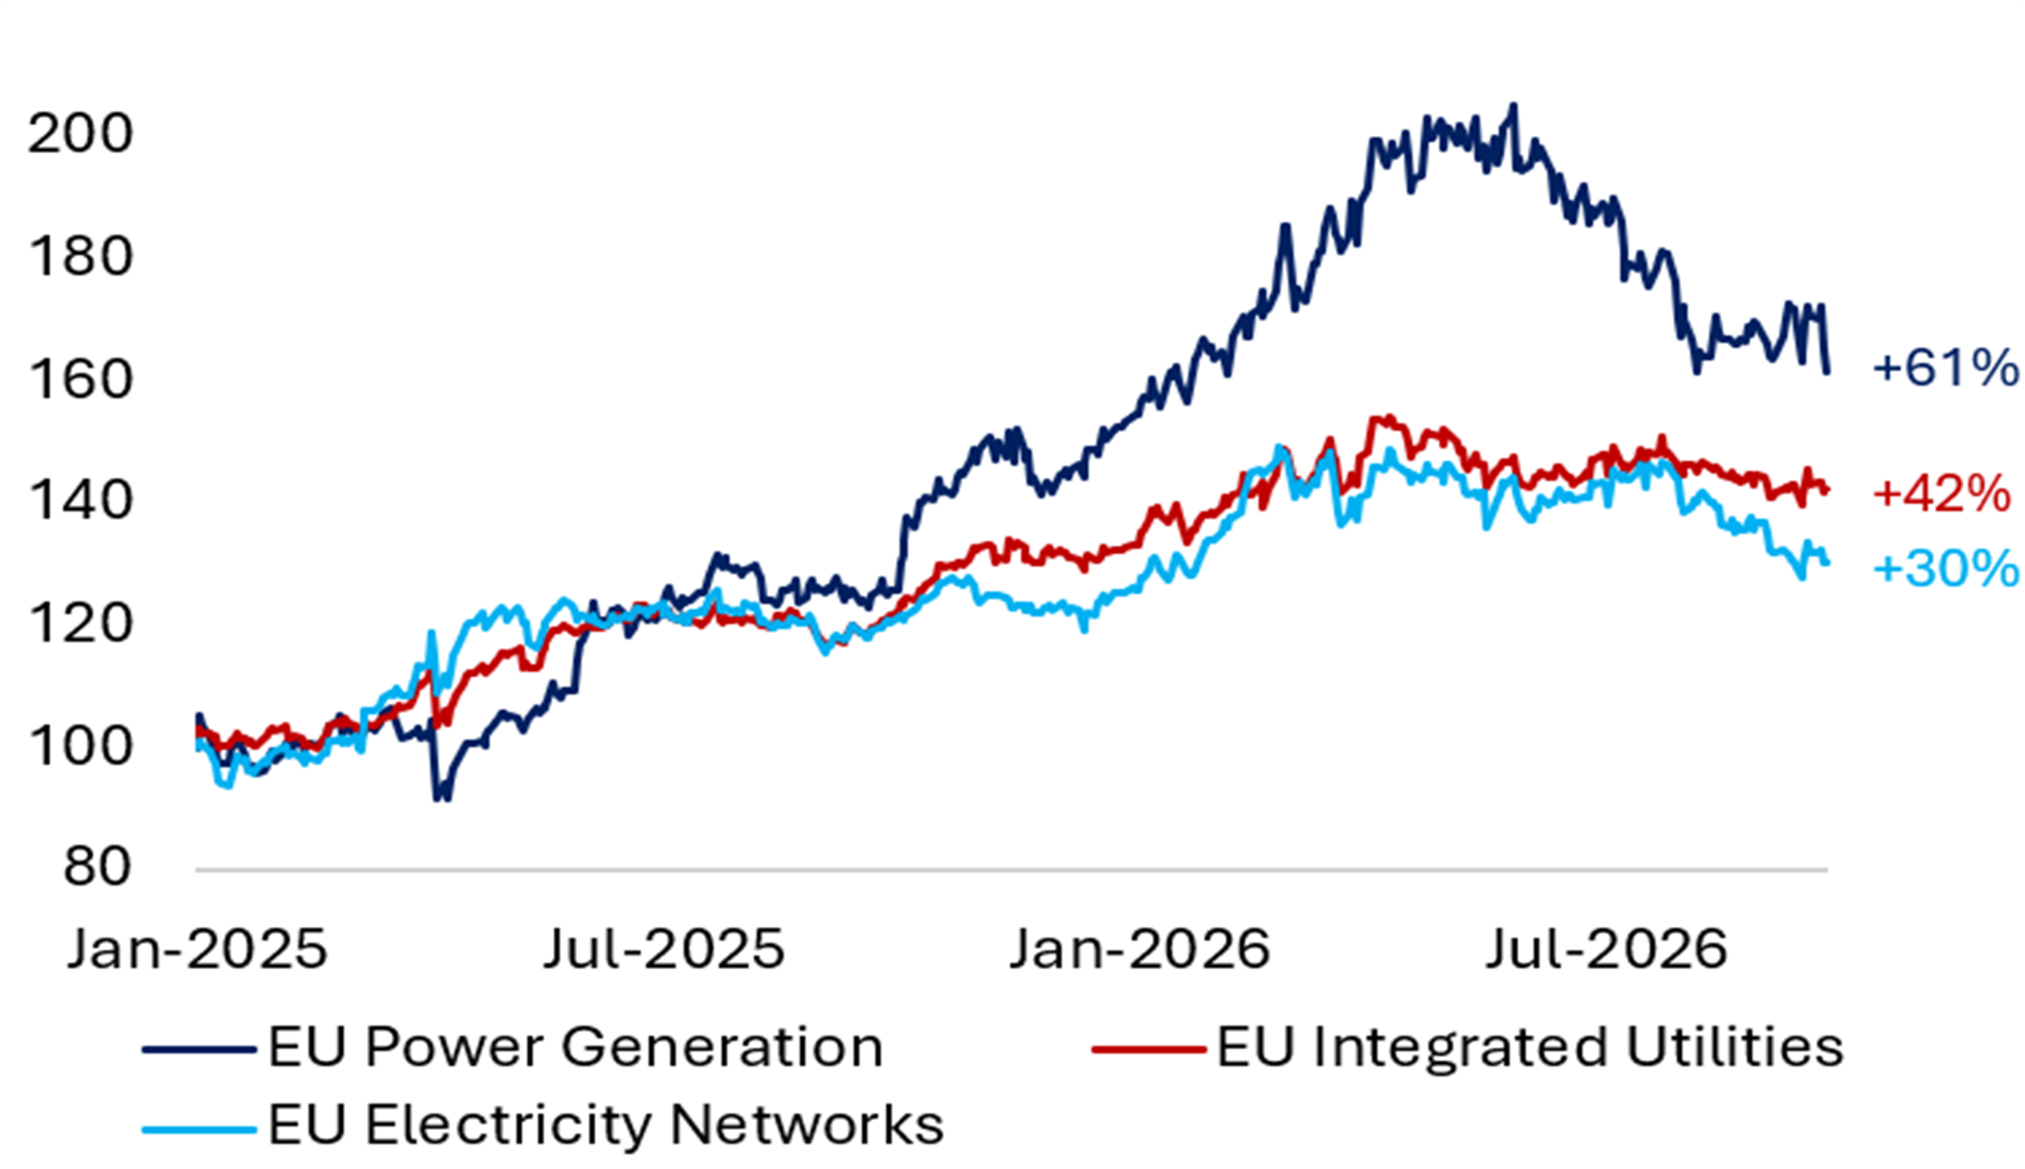
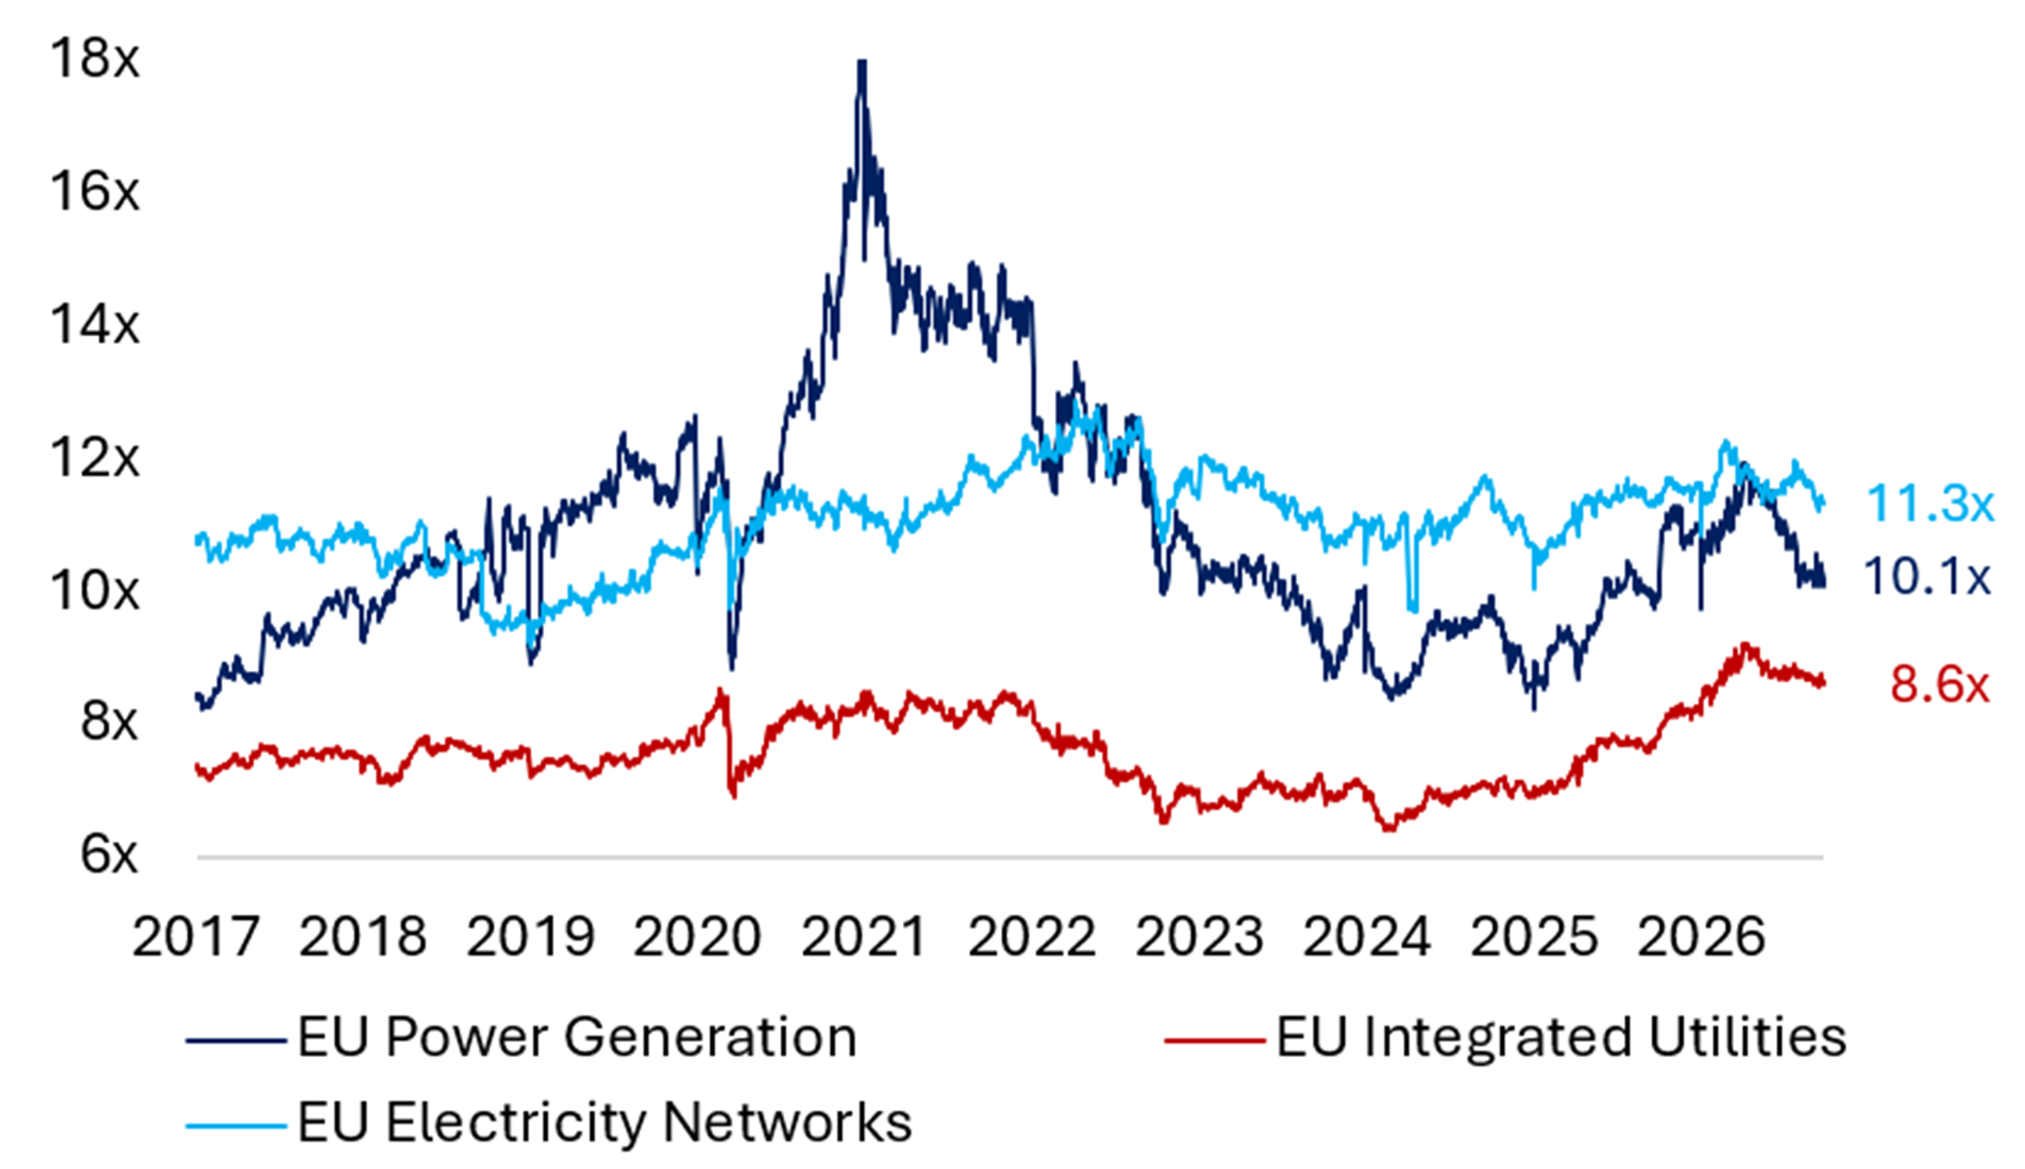

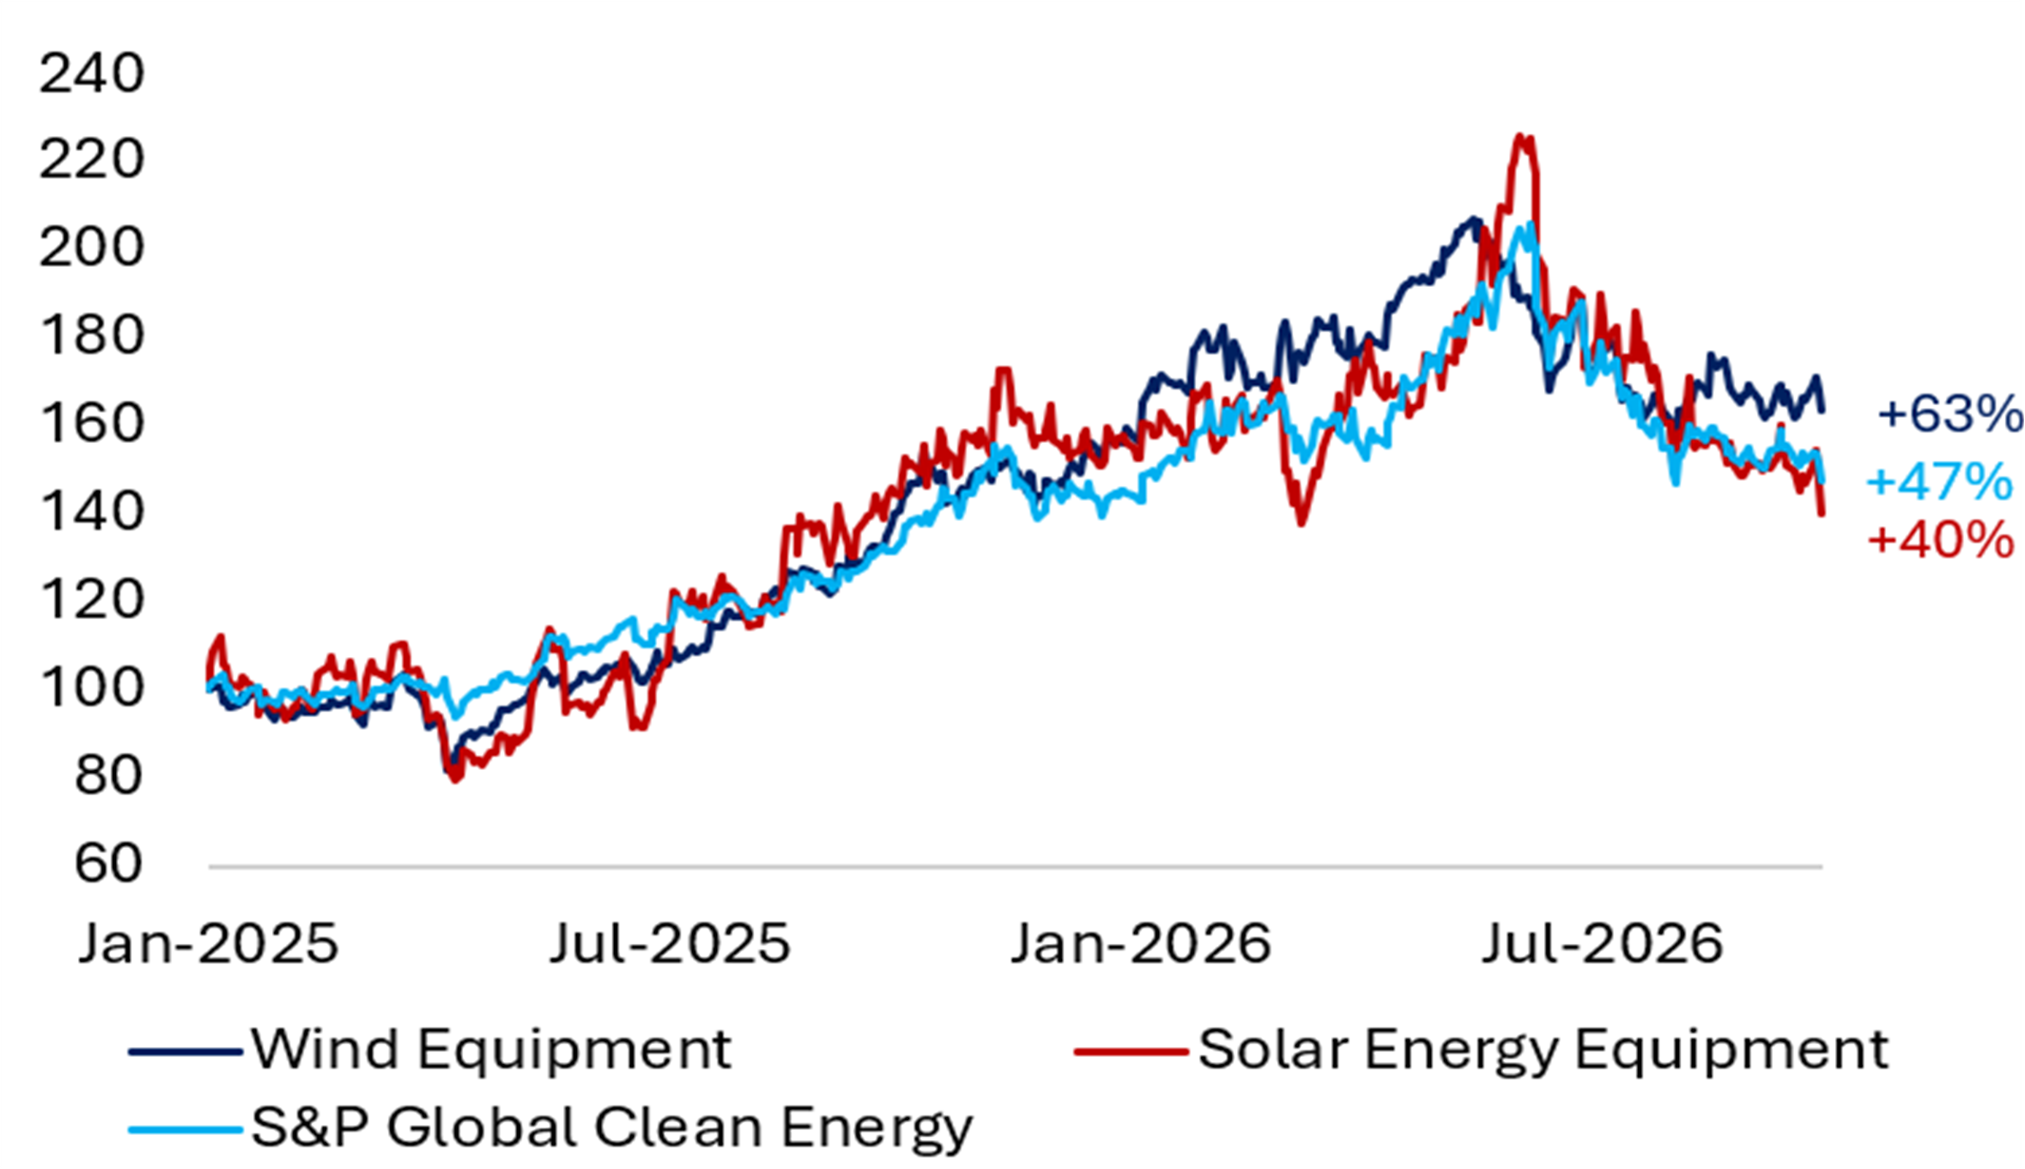
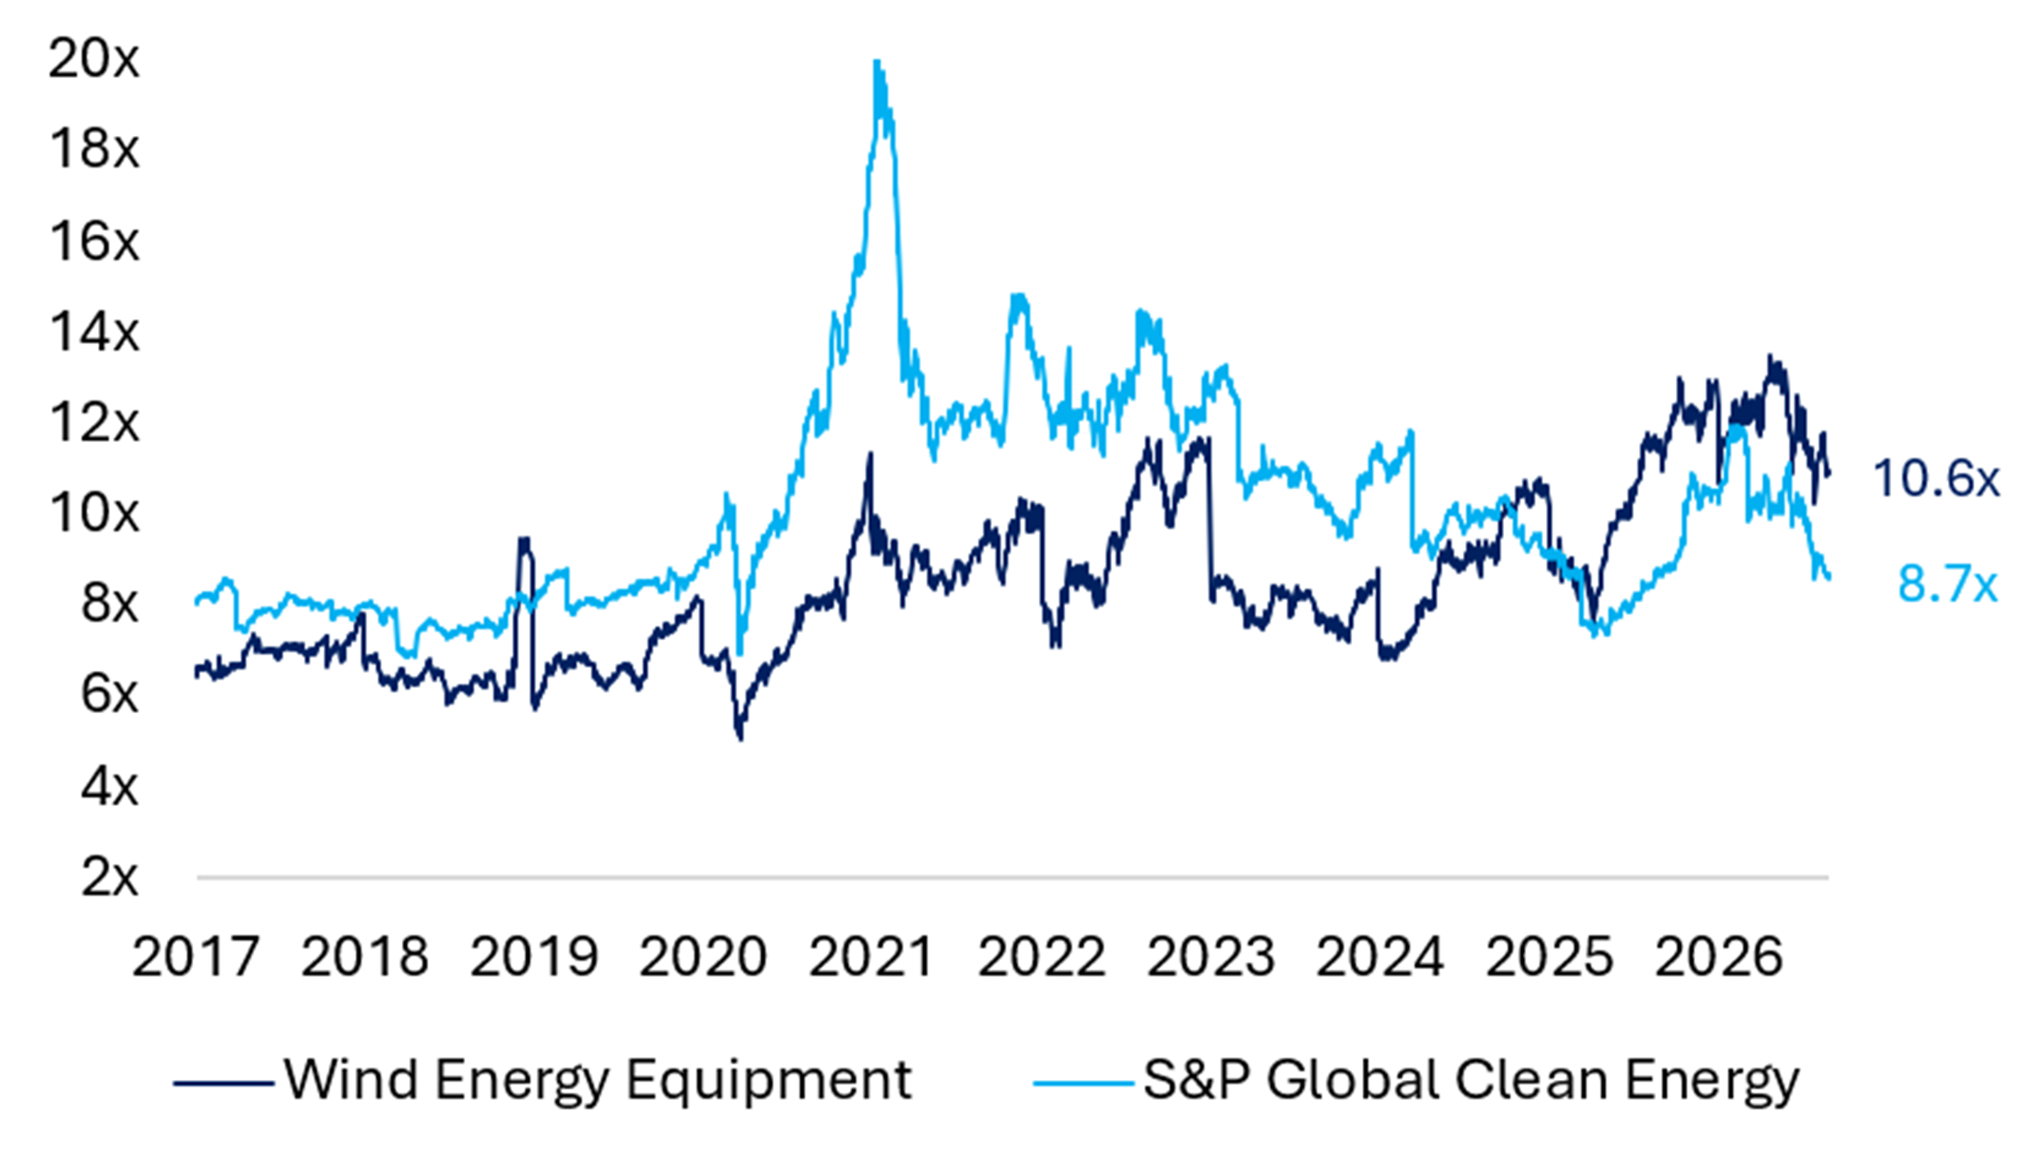
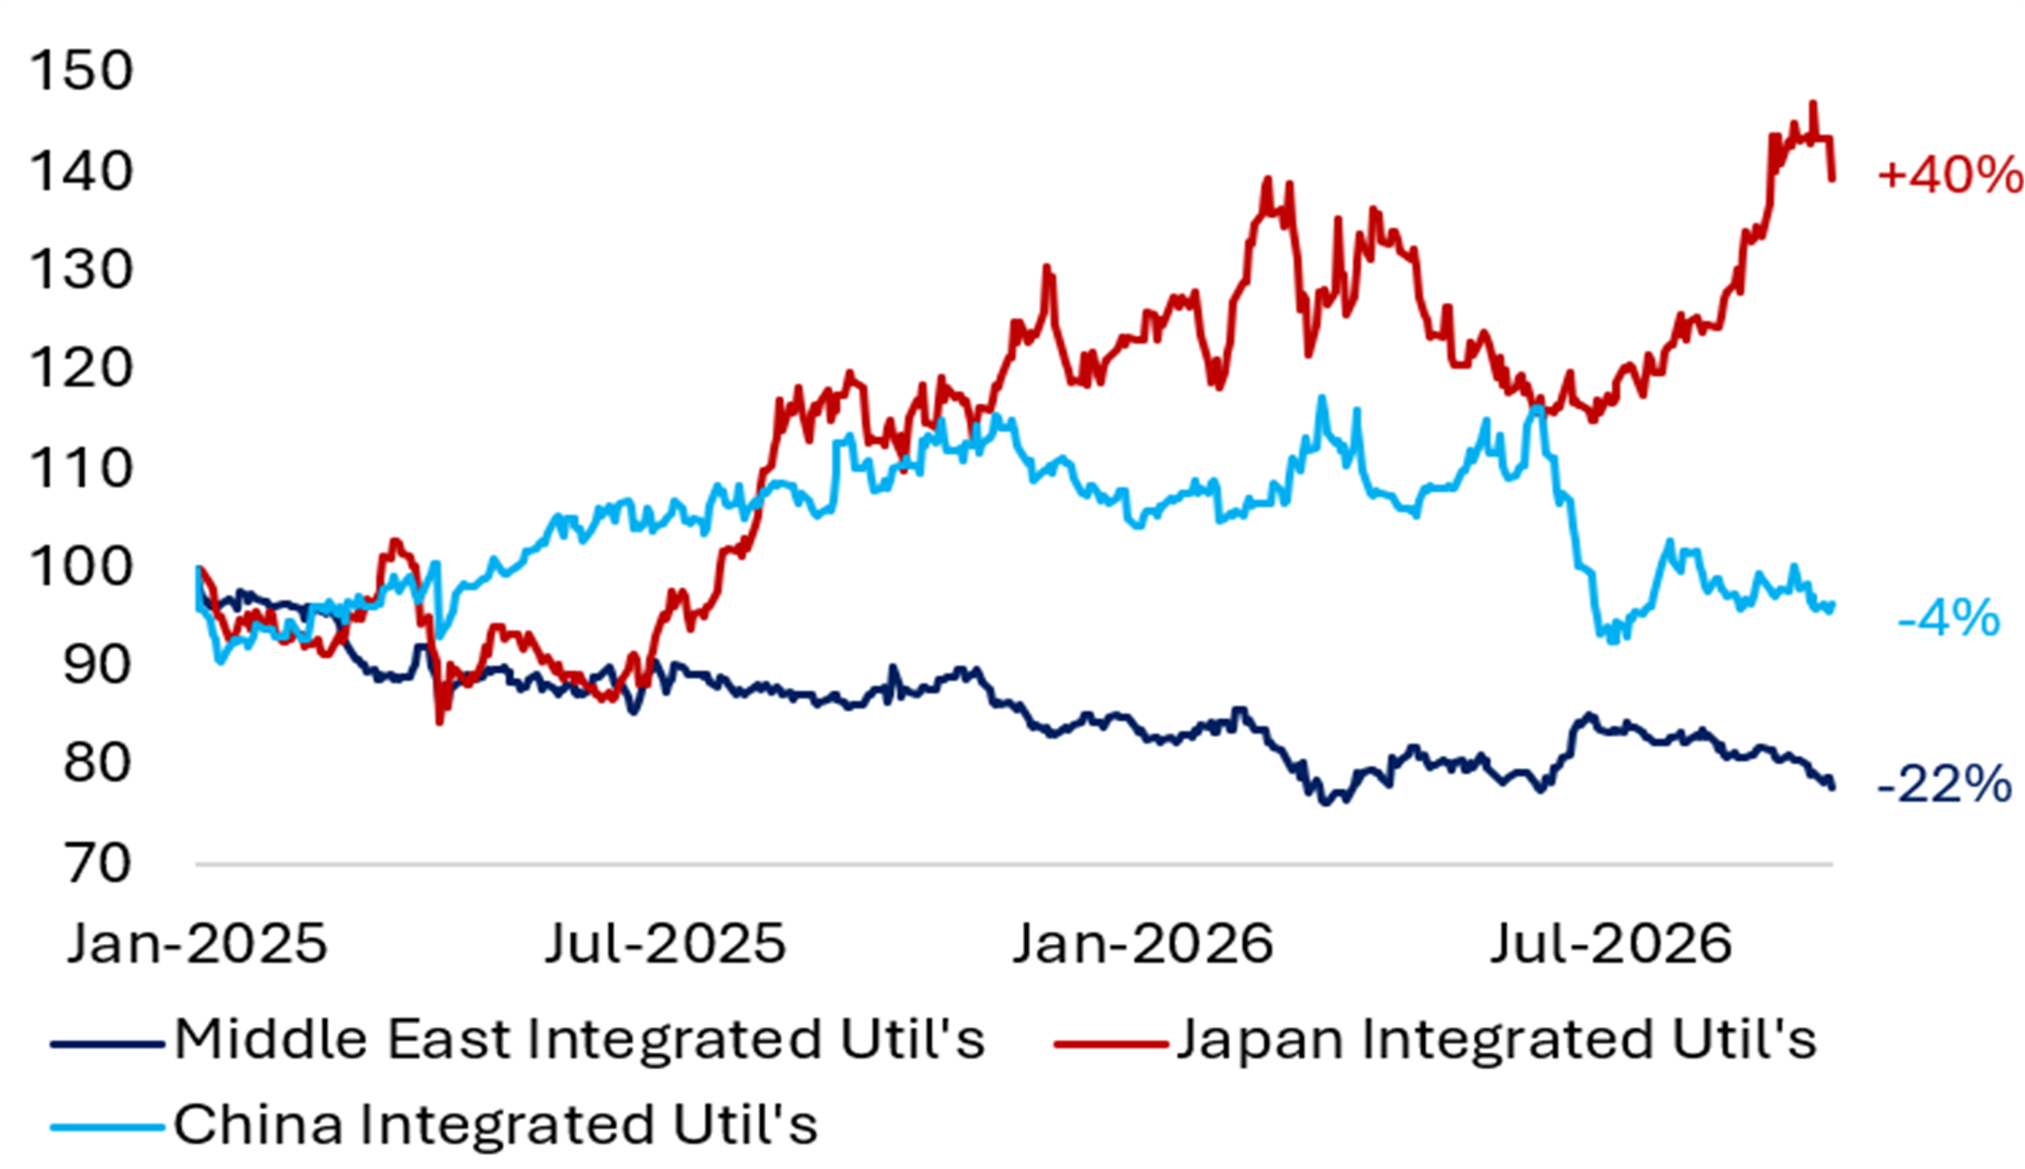
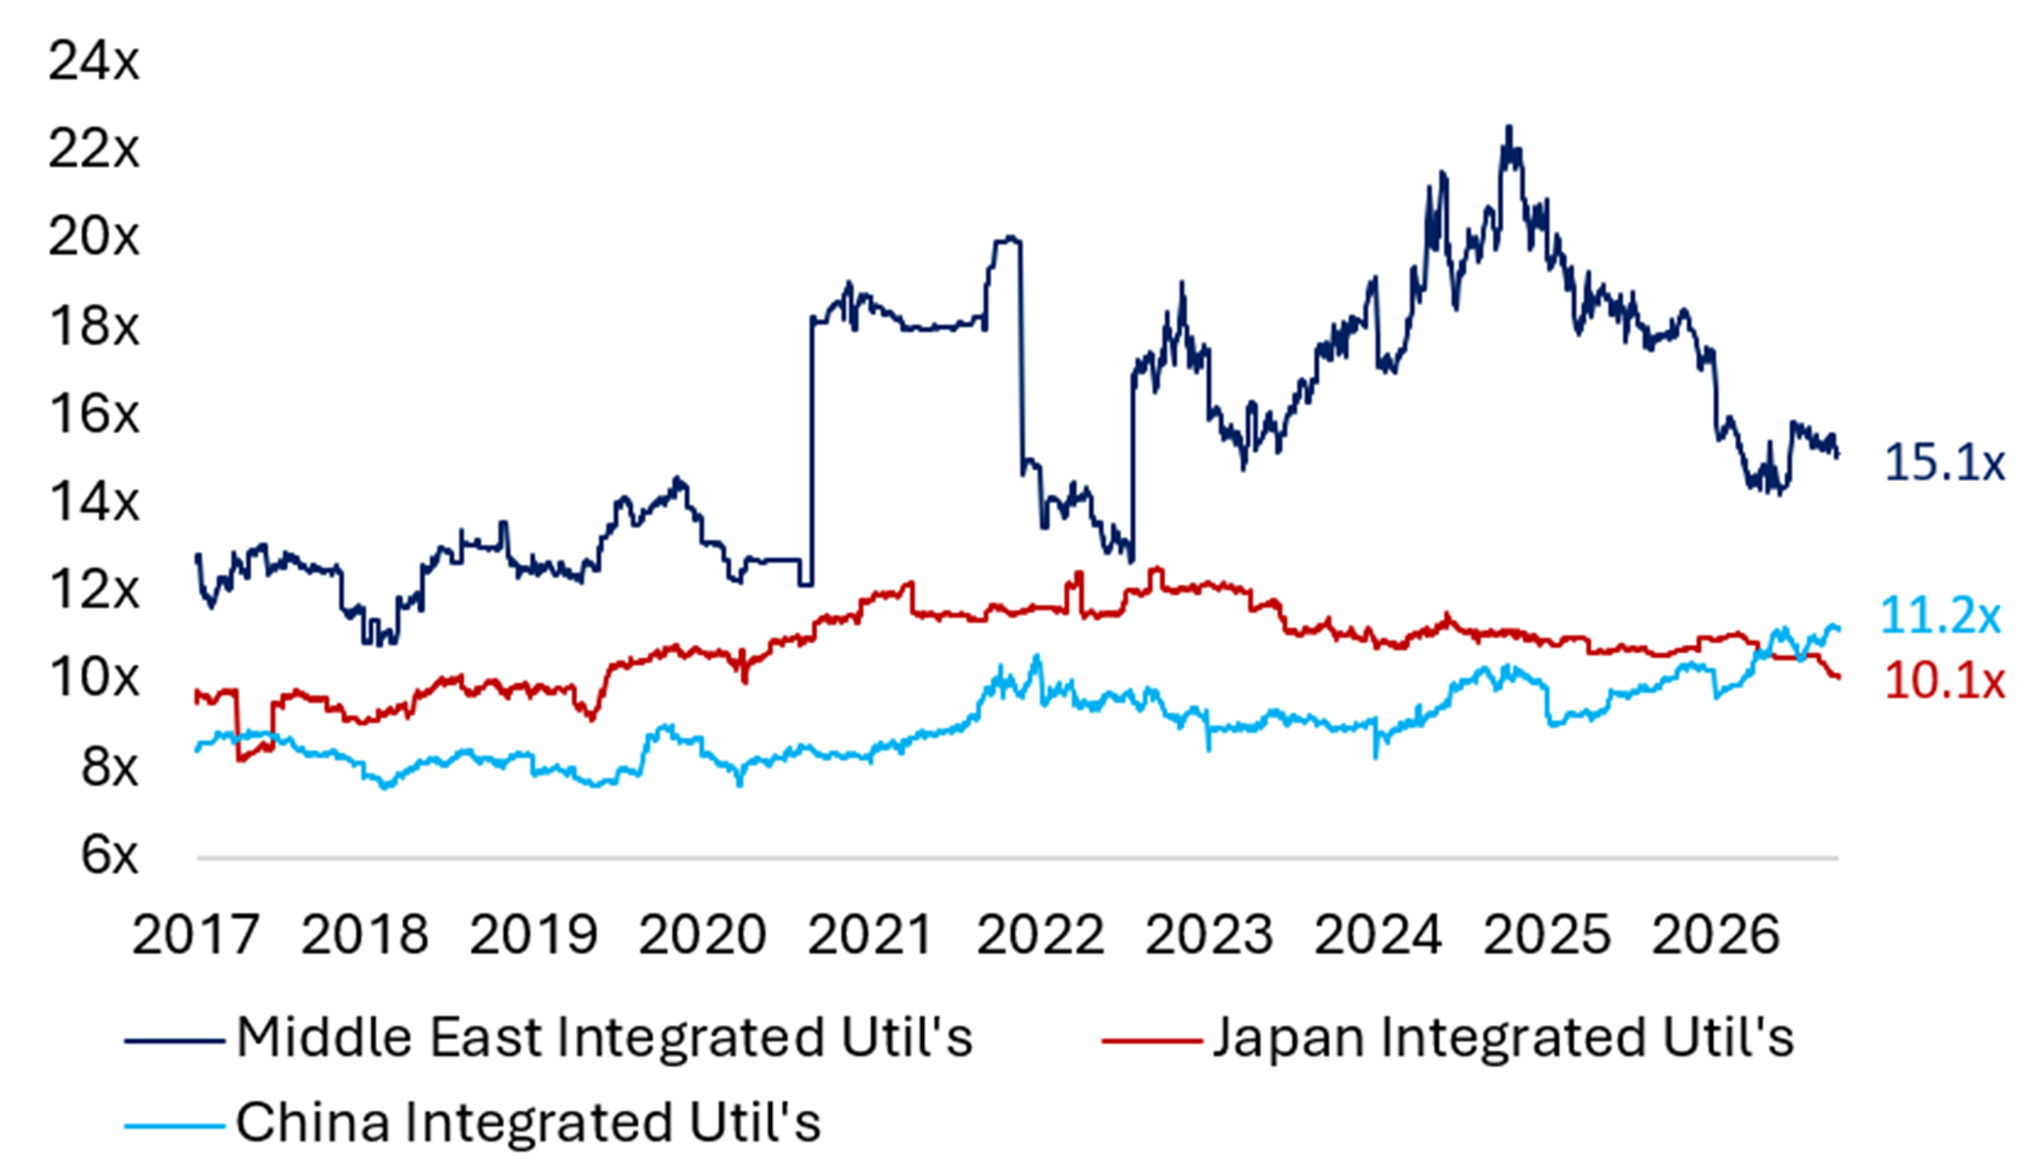

Source: Bloomberg (Prices as of 24 September 2026) Source: Bloomberg (Valuations as of 24 September 2026)
Monthly Focus: High Hopes for a Nuclear Renaissance
Nuclear’s Second Act: Mind the Construction Gap
We attended the World Nuclear Symposium held in London on 9–11 September 2026. The industry event drew over 1,000 participants from across the world as nuclear energy has recently received renewed attention again.
In 2024, Microsoft and Constellation Energy signed a landmark 20-year Power Purchase Agreement (PPA) at a 60% price premium to renewable spot prices to restart the 1 GW Three Mile Island plant. Back then, the premium looked defensible for a hyperscaler securing reliable baseload electricity; in hindsight it was a visionary move ahead of significant energy cost inflation. The 22-year PPA announced this month between Google and Fortum — life-extending a Finnish nuclear asset to 2050 at a similar 60% premium to forward power prices — should therefore not be ignored (see “Power Points” section). The scramble for energy to power US data centers is well underway; in the EU it is only just beginning, and the market underappreciates it because the opportunity is complex and affects many industries. In our Monthly Focus, we provide a deep dive into the nuclear energy industry and share some of our key conference takeaways.
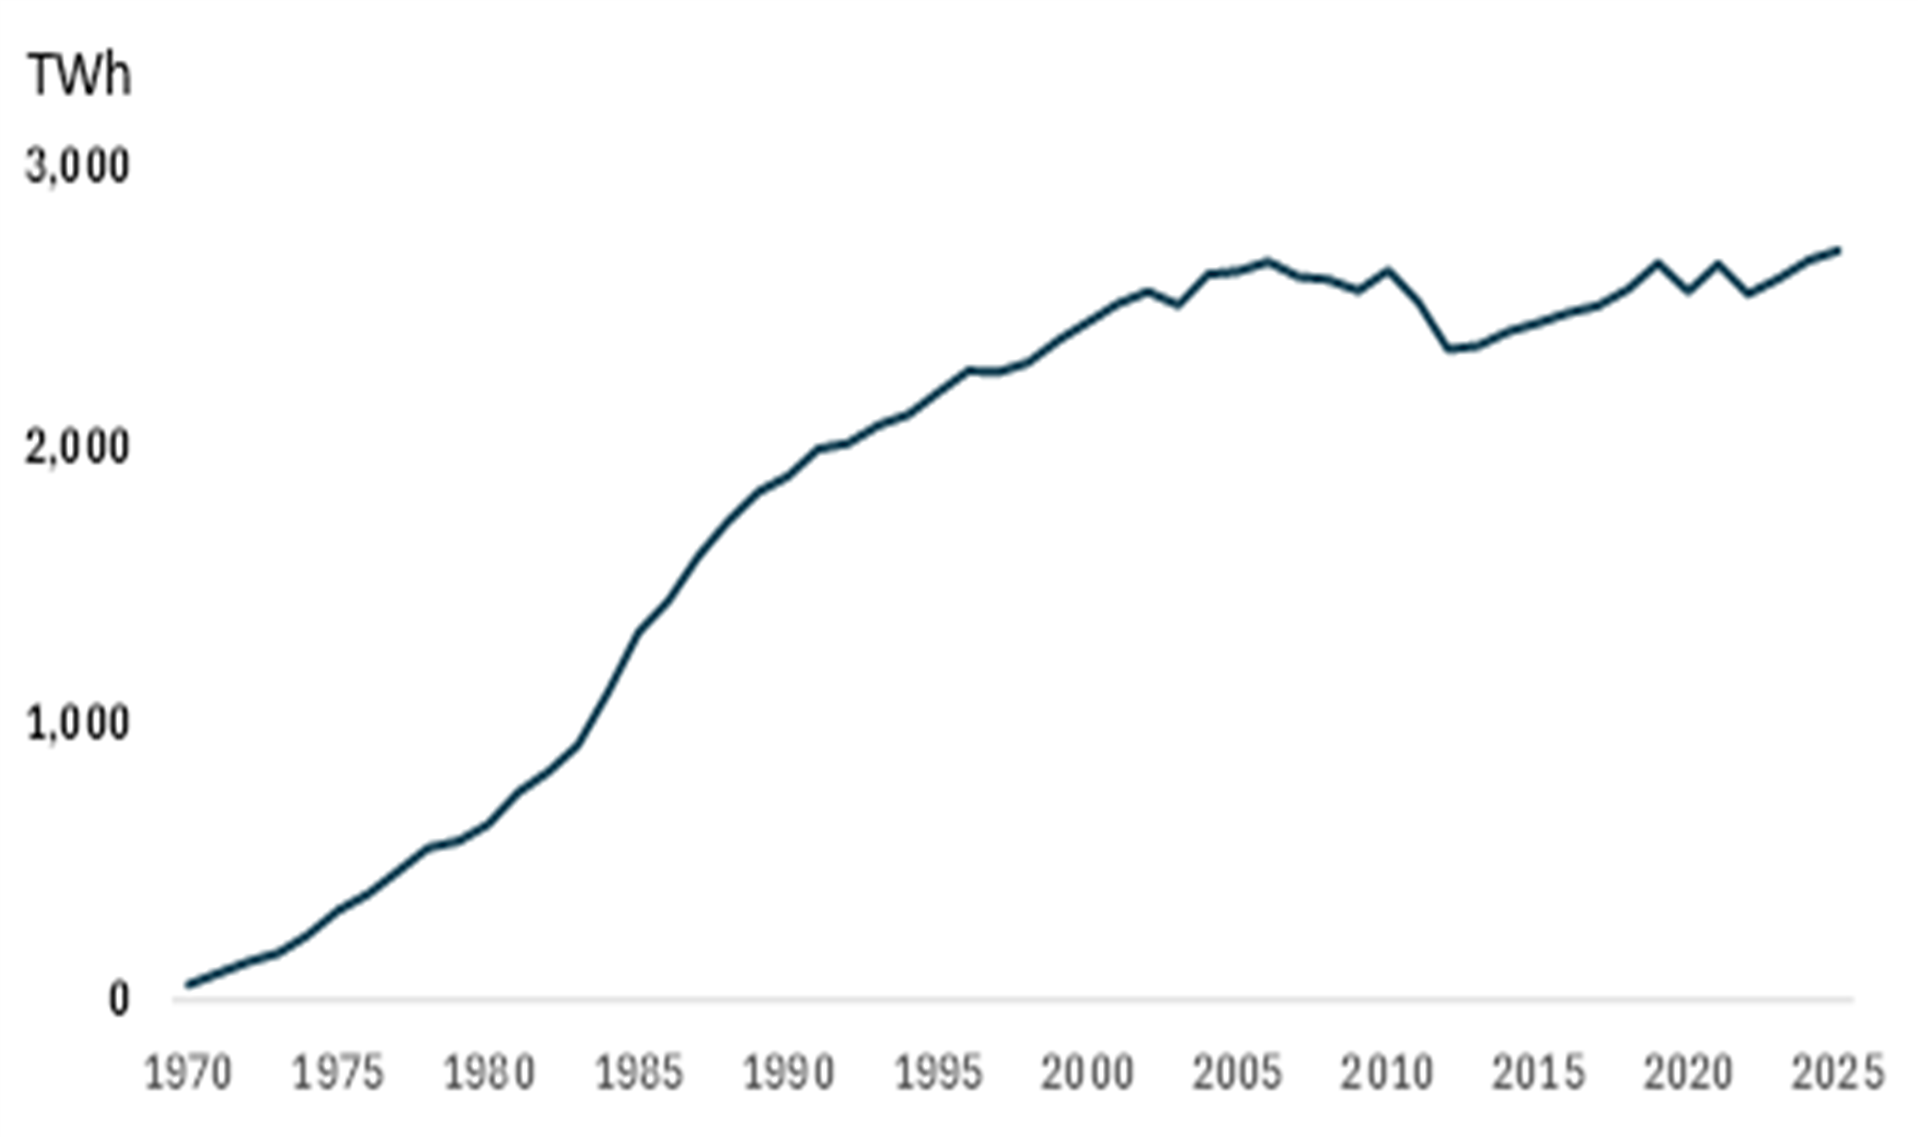
Nuclear generation and reactor performance hit record levels in 2025, reaching 2,702 TWh of global generation from an installed capacity of around 401 GW (see Exhibit 3). An 83.7% fleet average capacity factor underpins the existing fleet as a de-risked, cash-generative asset base, with reactors aged 40 years and above showing no significant fall-off in performance versus younger units. The mean age of the current global reactor fleet is around 33 years, and about 10% of reactors are older than 50 years but still performing well.
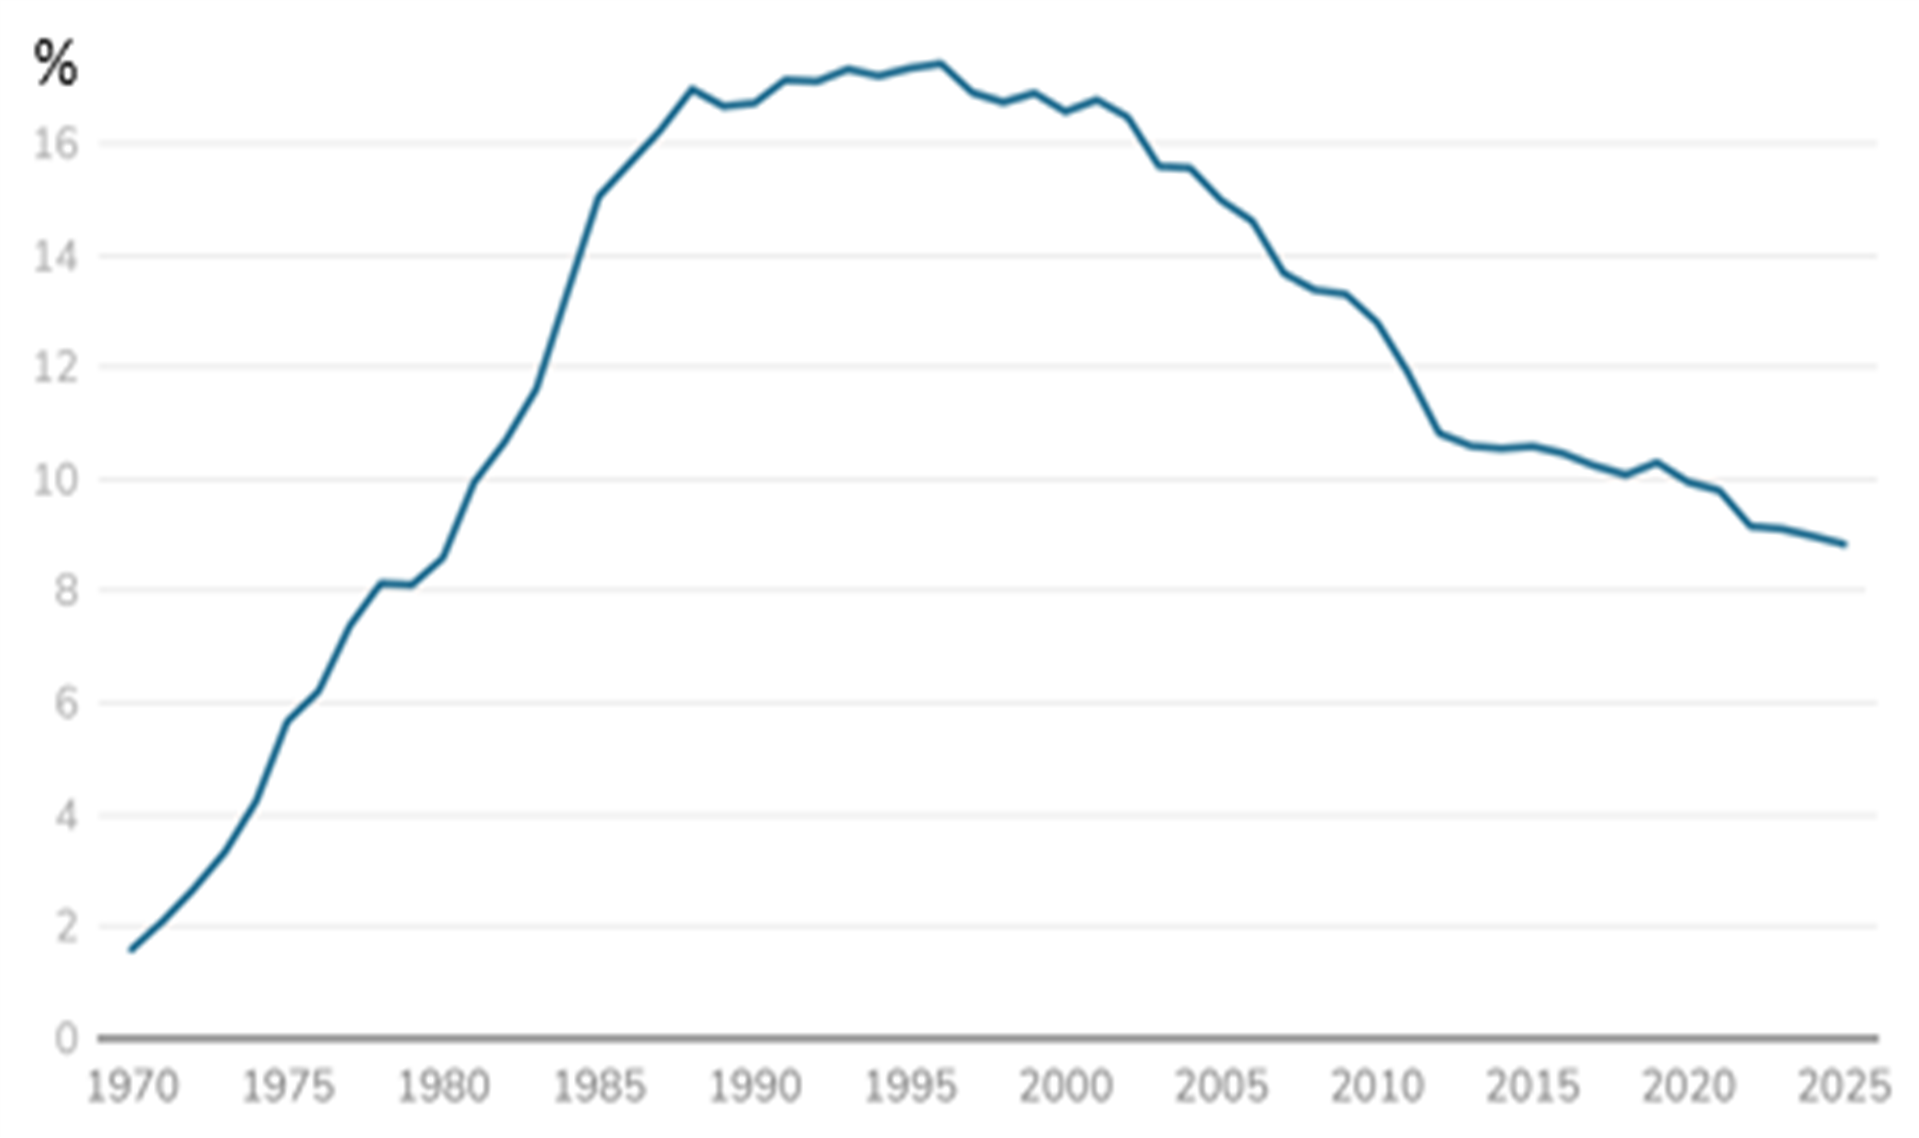
Global nuclear electricity supply has grown at varying pace since the 1970s: the first decade saw rapid growth, followed by a period of slowing growth through to 2011–12, when supply declined in the wake of the Fukushima disaster. Growth has picked up since then again, with Asia (China, India, Pakistan) and the UAE contributing most of the increase. Nuclear’s share of total electricity supply peaked at around 17% in the mid-1990s, with total electricity growing faster than nuclear since, the share of nuclear energy now stands at around 9% (see Exhibit 4).
Exhibit 3 Global Nuclear Power Generation Exhibit 4 Share of Nuclear in Global Power


Source: World Nuclear Association
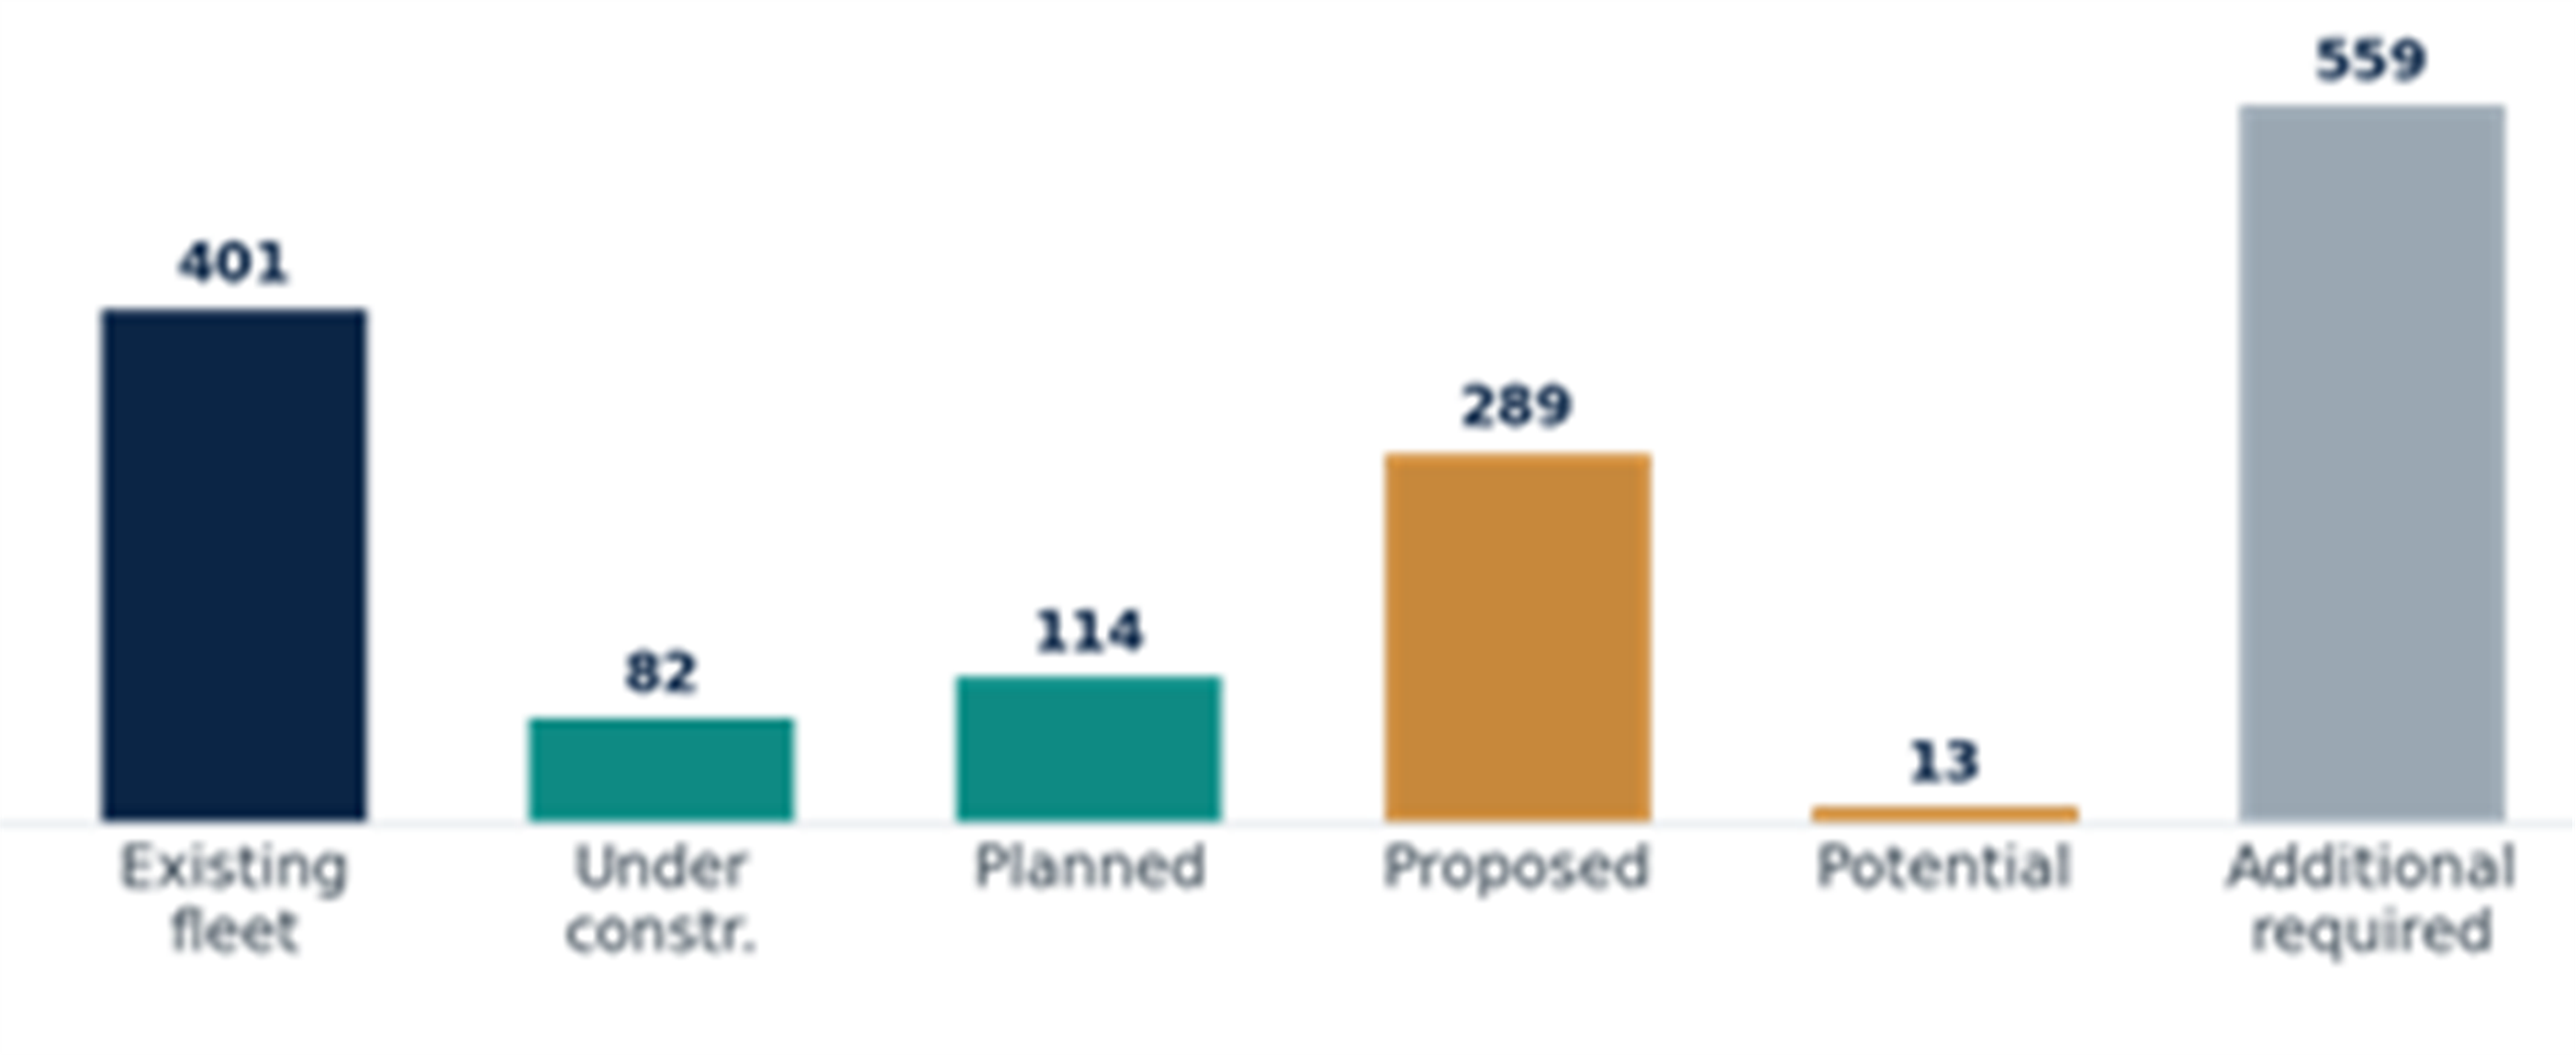
Given the advantages of low-carbon but firm power generation, nuclear energy has found favor as a preferred electricity source, and the global ambition is to more than triple capacity to 1,457 GW by 2050 (see Exhibit 5). However, this pipeline is concentrated in countries that already have nuclear: just five (the US, China, France, India and Russia) are projected to account for about 68% of the 2050 target. Project-delivery readiness and execution, rather than policy intent, will therefore be the decisive factor in meeting it. While 2050 is still 24 years away, current lead times mean that converting the 559 GW of currently unassigned target capacity into actual projects is the key variable determining whether the growth target can be met.
Exhibit 5 Projected Nuclear Capacity Additions Until 2050

Source: World Nuclear Association
The 2050 targets require a step change in the build rate. In 2025, 11 reactors started construction — nine in China and two in Russia. Recent annual capacity additions have typically been below 10 GW, against a historic peak, reached only briefly in the 1980s, of more than 30 GW. Most industry participants point to the pace of regulatory approval for designs, technologies and projects as the key constraint.
Panelists and participants also cite the need for greater global standardization of processes, components and regulation, alongside less customization and localization. We note that a presentation from China’s State Nuclear Power Technology Corp set out targets including a design reuse ratio above 80%, physical rework below 3% and a 56-month construction schedule — the basis on which it aims to deliver nuclear at fleet scale.
How to invest in the sector
We see four investable themes emerging in nuclear energy: life extensions and uprates for the existing fleet, repeat build of large reactors, Small Modular Reactors (SMRs) and advanced reactors, and fuel cycle capacity expansion.
A significant part of the capacity addition to 2050 is currently envisaged to come from large reactors built to proven, repeatable, standardized designs. SMRs offer simpler delivery, lower capital requirements and substantial off-site factory manufacture, and they suit smaller grids, industrial facilities and remote locations. A pick-up in SMR adoption, however, depends on how quickly first-of-a-kind projects move to deployment.
The SMR and micro-reactor landscape today comprises numerous companies, several with multiple designs, but only a handful have reached construction, licensing approval or a firm commercial order; the rest remain in pre-licensing. Among western companies, GE Vernova Hitachi is building an SMR at Darlington, Canada, expected to connect to the grid in 2030. Rolls-Royce SMR has signed a technology design contract and is the preferred provider for the UK’s small modular reactors, with initial deployment in Wales, and has signed agreements for three reactors in Sweden and with Czech utility ČEZ. NuScale has received design approval from the NRC and is looking to partner with ENTRA1 Energy on the Tennessee Valley Authority’s 6 GW nuclear project.
As the nuclear industry grows, a seamless, unhindered and expanding fuel cycle becomes paramount. Kazakhstan, Canada and Namibia account for around 75% of world uranium production, and three companies — Kazatomprom, Cameco and Orano — account for 50%. Long lead times across mining, conversion and enrichment call for capacity expansion and investment, and the need is more pronounced still because advanced reactor designs require advanced fuels. That in turn requires credible, funded, long-term waste, recycling and decommissioning strategies. Most major fuel players at the symposium described this as a chicken-and-egg problem: fuel investment needs firm reactor orders, and reactor orders need assured fuel supply.
In summary, the ambitious 2050 targets require flawless execution and firm government support that transcends political cycles. Cost overruns are a key risk, though global standardization and benchmarking could mitigate some of it. With more SMRs receiving regulatory approval and licensing, we think the pace of nuclear development globally could finally pick up in the early 2030s.
Power Points
EUROPE
Grenergy Renovables: 1H 2026 bottom-line miss, but share buyback announced
Grenergy reported a 51% YoY increase in revenues to €661million in 1H 2026 and a 47% YoY jump in EBITDA to €126 million, broadly in line with company-collected consensus of €127 million. Net income more than doubled to €74 million but fell short of the €80 million consensus, as analysts had assumed stronger asset-rotation gains. Performance was supported by the Gabriela disposal and an improved contribution from the Energy division. Operational delivery remained strong, with Iberian Oasis (the solar plus BESS platform in Spain) and Greenbox (the European stand-alone platform) progressing faster than expected. The company added a new 285MW solar / 920MWh BESS project to Iberian Oasis and acquired around 400MW of ready-to-build projects, allowing it to deliver the pipeline more quickly. Grenergy announced a share buyback of up to 500k shares (1.7% of share capital) or a maximum of €50m, running until June 2027.
Fortum: Landmark 22-year Power Purchase Agreement with Google at significant power price premium
Fortum and Google have signed a multi-decade Power Purchase Agreement (PPA) providing the long-term revenue certainty required to continue operating Fortum’s Loviisa nuclear power plant through 2050. The PPA starts in 2028 with a smaller capacity, reaching 50% of Loviisa’s capacity (around 4TWh) in 2030-2049. Fortum guides that this deal will increase its comparable return on net assets (RONA) by 1.4% over time, once 4TWh is fully contracted, which implies an EBIT increase of €130 million on around €9 billion net assets, and implies a €30/MWh PPA premium to the current forward power price of around €50/MWh. Additionally, the companies have signed a MoU, under which they will advance new power generation and flexible capacity and explore the use of Fortum’s energy portfolio management services.
Engie: In talks to develop 2.2GW Middle Eastern gas plant
Engie is reportedly advancing negotiations with UAE’s Emirates Water and Electricity Company (EWEC) to develop a 2.2 GW CCGT project known as Nouf 2, aimed at replacing the previously shelved 1.5 GW Madinat Zayed OCGT asset for which Engie had been selected as preferred bidder in 2024. The parties are targeting an agreement signature before end-2026, with the new project representing a configuration shift from OCGT to CCGT (combined cycle gas turbine), a higher capacity profile (700 MW), and a new coastal location nearer Abu Dhabi City. The size of the project reflects almost 10% of Engie’s existing gas asset capacity in the Middle East and revenues will be contracted with EWEC as the power offtaker.
Iberdrola and Naturgy develop pumped-storage hydroelectric plant
Iberdrola and Naturgy have applied, through their joint venture A Senra Infraestructuras, for a water concession of up to 75,000 liters per second from the Sil and Edrada rivers in Parada de Sil, Galicia, to develop a pumped-storage hydroelectric plant. The application, published in Spain’s Official State Gazette (BOE), opens a one-month window for public consultation and competing bids. The project remains at an early stage, with no investment decision taken. Its viability depends on securing a sufficiently broad hydroelectric concession and on the establishment of a capacity payment mechanism to underwrite returns. The Sil basin is already a well-established hydroelectric corridor: Naturgy operates the 28.64 MW Regueiro plant nearby, and Iberdrola’s Santo Estevo complex contributes 451 MW — making it a logical site for expansion. The initiative underscores the growing strategic importance of energy storage in Spain, where pumped-storage facilities supply the flexibility needed to balance intermittent renewable output.
Snam reduces De Nora stake to 16.6%
Snam has sold around 10 million shares of Industrie De Nora (an Italian alkaline electrodes manufacturer) at €6.69 per share, generating gross proceeds of around €67 million. Following the sale, Snam holds around 33 million multiple voting shares, which represents around 16.6% of the company’s share capital and is subject to a 90-day lock-up period on its remaining stake. Snam says that the transaction is consistent with the asset rotation program outlined in its business plan, reallocating capital towards businesses that further strengthen its core gas infrastructure platform and support its integrated energy strategy.
EDP: Masaveu becomes the third largest shareholder
Masaveu, a Spanish family-owned holding group, and Unicaja will end their jv partnership through which they had jointly owned 6.82% in EDP. After purchasing a 2.07% direct stake in EDP from Unicaja, Masaveu will own 5% in EDP, which makes it the third-largest shareholder, behind China Three Gorges Corporation, which holds 22%, and BlackRock, which owns 8.35%.
Spain-France power interconnection already 70% completed
The Spain-France electricity interconnection through the Bay of Biscay is 70% complete and is expected to enter service in late 2027 or early 2028, according to Redeia CEO Roberto García. He put the final budget at roughly €3.1 billion and said the project’s returns to the Spanish electricity system will far exceed its costs. Jointly developed by Red Eléctrica and France’s RTE through their joint venture Inelfe, the link will nearly double cross-border power exchange capacity from 2,800MW to 5,000MW, connecting the Gatika converter station in Spain with Cubnezais, near Bordeaux, via four submarine cables. Danish firm NKT has completed the first 65km phase of subsea cable laying, and Italy’s Prysmian will carry out the next leg through summer 2027, though García cautioned that the sea will ultimately dictate the timeline. Spain’s Secretary of State for Energy, Joan Groizard, said the Iberian Peninsula remains “one of Europe’s great energy islands” and that the new link will improve renewable integration and lower electricity bills on both sides of the border, noting that the existing French interconnection proved critical during the recovery from last year’s power blackout in Spain.
Italy supports nuclear restart
The Italian Senate gave its final approval to the nuclear energy framework delegation bill with 81 votes in favor, 51 against, and 7 abstentions, after delays had pushed this final vote past the summer break. Environment and Energy Security Minister Pichetto called it “a historic day for Italy” and confirmed that the government is already working on implementing decrees to put the law into effect by the end of the year. While the set-up of Italy’s nuclear safety authority remains an open question, Mr. Pichetto said that the new agency will absorb the existing ISIN inspectorate. Thus, almost 40 years after Italy had shut down its nuclear reactors, the country has now the legal framework in place to re-start its nuclear power generation. The government has now 12 months to implement the legal framework and Mr. Pichetto believes it will be done before the end of the year.
Germany plans to phase out fossil fuels by 2045
Germany has committed to phasing out fossil fuels by 2045, setting out for the first time an explicit promise to transition away from fossil fuels rather than merely achieve carbon neutrality. The roadmap includes raising renewables from 55% to 80% of electricity generation by 2030, with an additional 12GW of onshore wind and a 215GW solar target by the same date. The coal exit target of 2038 was reaffirmed, with the possibility of bringing it forward to 2035. Germany is the third major developed economy to publish such a roadmap, after France and the Netherlands. Its economics ministry, however, continues to push for greater use of gas in the short-term, aiming to add 10GW of new gas-fired CCGT capacity by 2032.
France requires EU action to reduce energy prices
French President Macron has urged the European Commission to take immediate action on soaring energy prices, including delaying new methane emission rules by a year and temporarily easing refinery regulations to boost diesel and jet fuel production by up to 20%. France faces strong political pressure over consumer energy and fuel costs, with French ports blockaded in protest as recently as last week. Ahead of next year’s presidential election, the leading party (RN) plans, if elected, to seek an exit from EU power market rules, decoupling French electricity prices from gas costs and aligning them more closely with French nuclear generation costs. In a letter to Commission President Ursula von der Leyen, Macron joined more than a dozen EU member states in calling for postponement of the strict methane law, due to take effect in January 2027, which imposes monitoring requirements and fines on oil and gas importers and has faced heavy lobbying from major gas exporters such as the US and Qatar. European gas prices have tripled this year to €80/MWh amid Middle East tensions, while oil has topped $100/bl, which hit France in particular as it grapples with one of the EU’s highest budget deficits, above 5% of GDP, and has limited fiscal room to shield consumers.
UK WATER:
United Utilities: 1H 2026/27 trading update without surprises
Before United Utilities reports 1H 2026/27 financial results on 12 November 2026, the company released a 1H trading update, which showed performance in line with expectations: the financial framework and FY26/27 guidance remained unchanged and the AMP8 (Asset Management Period) regulatory return target still sits at 10–11%. Capital investment remains on track at roughly £2 billion in FY26/27 and £11.5 billion across AMP8. On the 2026 reopeners, the company has filed further evidence ahead of December’s final determination. For the HyNet-related industrial growth projects, it proposes £191 million routed through a gated mechanism that would go into the Regulatory Capital Value (the regulated asset base of a Water company), with the remaining £79 million of asset-specific infrastructure funded directly. Additional evidence on other projects would lift total allowed expenditure from £958 million in the draft determination to £1,026 million in the final determination.
MIDDLE EAST:
Saudi Energy Company: Power transmission network continues to grow
Saudi Energy Company (SEC) reported preliminary 2Q 2026 results, with revenue growing 11.3% YoY to SAR 30,864 million, EBIT declining 6.5% YoY to SAR 6,630 million and net income also falling 7.4% YoY to SAR 4,891 million. Capex grew in 1H 2026 by 6% YoY to SAR 38.7 billion, primarily directed towards transmission expansion, battery storage and network enhancement projects. This supported 14.1% YoY growth in the Regulated Asset Base (RAB) to SAR 271.8 billion, including SAR 17.1 billion of transmission network additions and SAR 10.9 billion of distribution network additions. Generation capacity increased by 604 MW to 56.9 GW in 1H 2026, supporting a 2.6% YoY increase in energy production to 109.2 TWh. SEC’s transmission network length grew 4% and distribution network length grew 5% in 1H 2026. Furthermore, grid-connected renewable capacity reached 17.8 GW and battery energy storage capacity more than doubled from 8 GWh to 18 GWh.
CHINA:
Government aligns AI power demand growth with renewable energy supply
On September 4, seven government agencies — including the Cyberspace Administration of China (CAC), the National Development and Reform Commission (NDRC), the Ministry of Industry and Information Technology, and the Ministry of Ecology and Environment — issued an “Implementation Plan for Promoting the Coordinated Digital and Green Transformation (2026–2030).” A key focus of this five-year plan is coordinating the growth in electricity demand driven by AI and computing capacity with China’s energy efficiency and green development goals. By 2030, renewable electricity consumption at computing facilities and other key sectors should reach the renewable energy consumption at computing facilities and other key sectors to meet the provincial renewable energy targets. The plan also encourages the clustering of computing resources in areas rich in wind, solar and hydropower, with the aim of aligning data center electricity demand with renewable energy supply. It calls for the development of direct green-power connections between generation and computing facilities, alongside high-efficiency, long-duration, large-scale energy storage. The plan reinforces China’s continued push toward renewables and highlights AI and computing demand as both a key driver and a core component of that effort. Wood Mackenzie projects China’s data center electricity demand to nearly quadruple, to 774 TWh by 2030, accounting for 6% of the country’s electricity consumption.
JAPAN:
Market conditions
Japanese utility stocks continued to outperform the broader domestic equity market during September, supported by announced increases in both wheeling charges (power transmission and distribution tariffs) and retail electricity rates. The market has generally viewed these developments as positive for earnings visibility and cash flow generation across the sector.
Operating conditions for Japanese electric power companies (EPCOs) during the July-September quarter were influenced by multiple typhoons, increased rainfall, and unusually hot weather, particularly in western Japan. While severe weather may have reduced electricity demand in some regions, the impact was likely offset by lower fuel costs attributable to improved hydropower generation and reduced reliance on additional thermal power generation to meet peak demand.
Electricity tariffs are rising – who benefits?
On August 26, the Electricity and Gas Market Surveillance Commission (EGC), under the Ministry of Economy, Trade and Industry (METI), approved applications submitted by EPCO transmission and distribution subsidiaries to raise regulated wheeling charges. Subsequently, during the first week of September, the parent utilities announced corresponding electricity tariff revisions that will become effective on November 1 and will first apply to customer bills based on September consumption.
The average electricity tariff increases are expected to be as follows:
- +5% for residential customers (low-voltage supply of 100-200 volts)
- +9% for ultra-high-voltage customers (above 7kV)
- +12% for commercial and industrial customers (600V to below 7kV)
For illustrative purposes, Table 2 summarizes the estimated impact on residential electricity bills based on September usage.
Table 2 Residential Electricity & Gas Bills for September Usage (JPY)

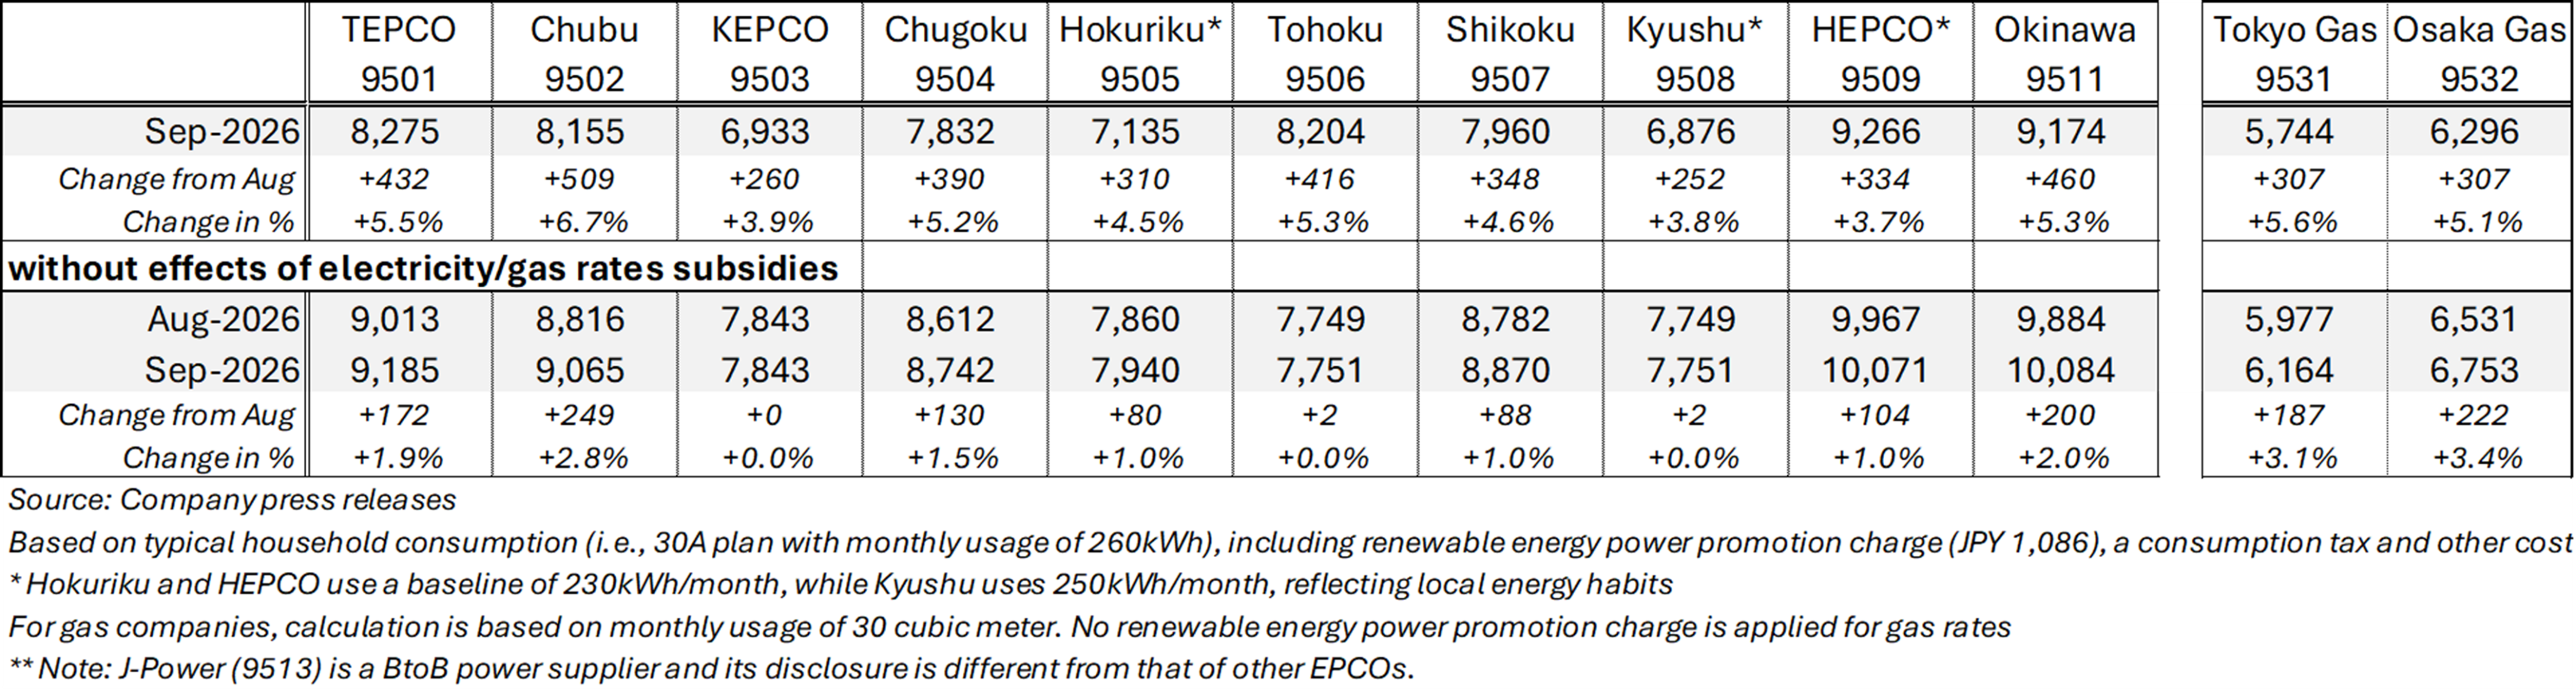
Companies with relatively higher exposure to ultra-high-voltage and commercial customers are expected to be the primary beneficiaries of the tariff revisions. These include Tokyo Electric Power Holdings (9501), Kansai Electric Power (9503), and Tohoku Electric Power (9506). Furthermore, Chubu Electric Power (9502) is also well positioned to benefit from the price increases. However, the positive impact may be materially offset by the long-stalled prospects for the restart of the Hamaoka Nuclear Power Station, caused by the ongoing freeze on application.
Hydro power generation increased from above-average rainfall
From a cost perspective, above-average rainfall during the summer months should support hydropower generation across the sector, reducing fuel procurement requirements and improving generation economics. Among the major utilities, Hokuriku Electric Power (9505) stands out with the highest dependence on hydropower generation, which accounts for approximately 25%-28% of its generation mix.
J-Power (9513) is also widely seen as a beneficiary. The company operates 61 hydroelectric power stations nationwide, with hydropower capable of contributing up to about 20% of total power generation under favorable hydrological conditions. Consensus earnings forecasts for the sector are expected to be updated in the coming weeks, providing greater clarity on the impact of the tariff revisions and favorable hydroelectric generation conditions.
Key Investment Takeaways
The September developments reinforce a constructive outlook for Japanese utilities, driven by tariff increases and favorable hydrological conditions. Utilities with greater exposure to high-voltage commercial customers, including Tokyo Electric Power, Kansai Electric Power, and Tohoku Electric Power, are widely seen as best positioned to capture near-term earnings upside. Meanwhile, strong hydropower generation is expected to provide additional cost support, particularly for Hokuriku Electric Power and J-Power. Investors may consider monitoring upcoming consensus revisions and management guidance updates for further confirmation of earnings momentum.
European Power Prices and Global Electricity Demand Growth
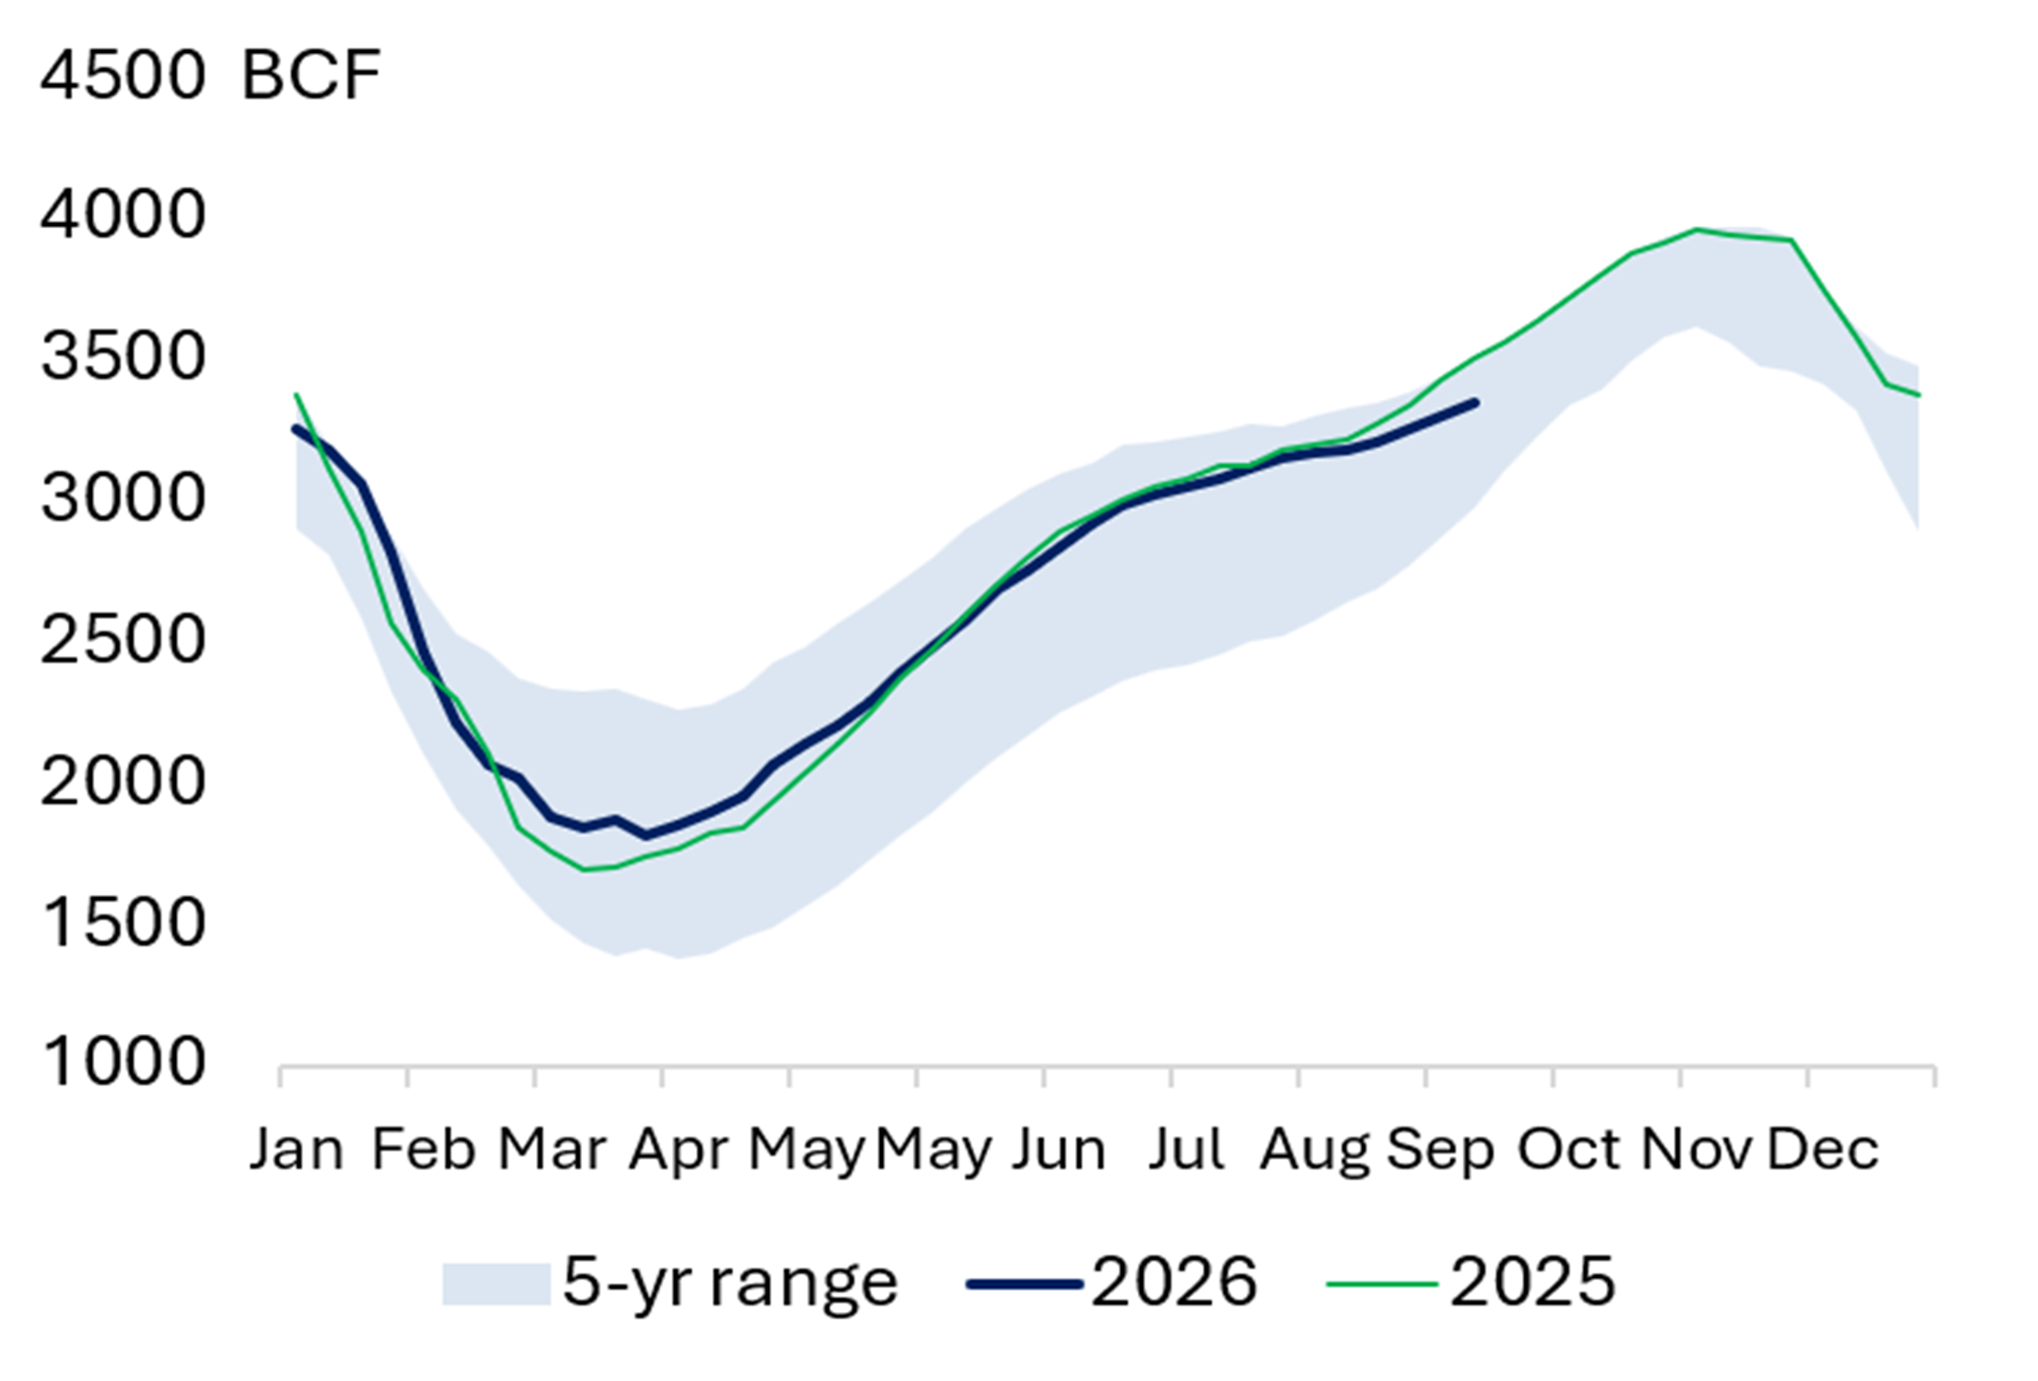
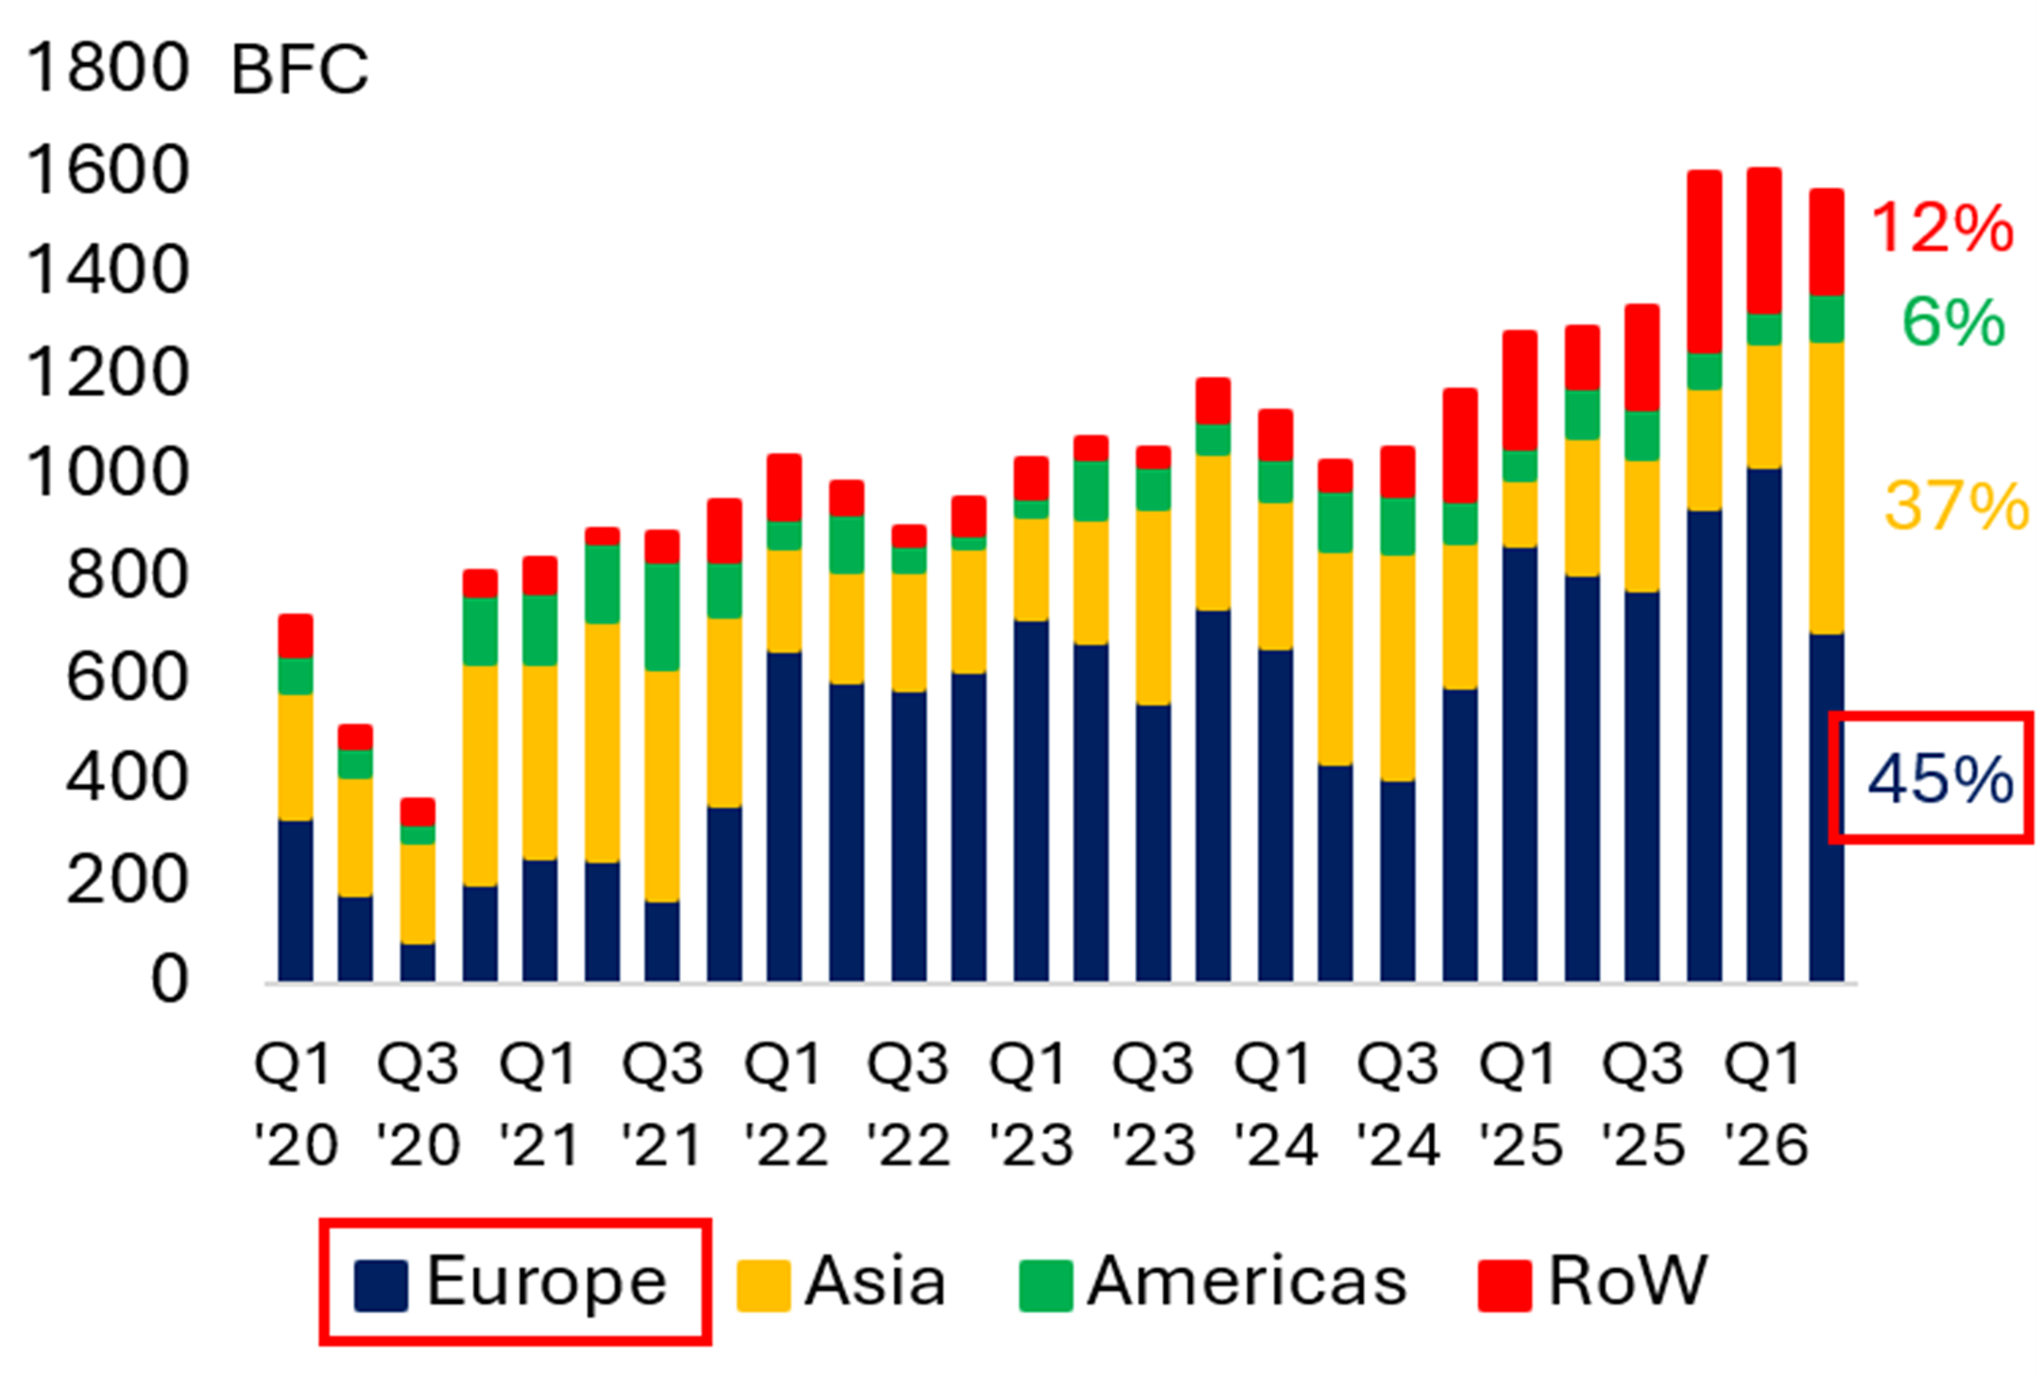
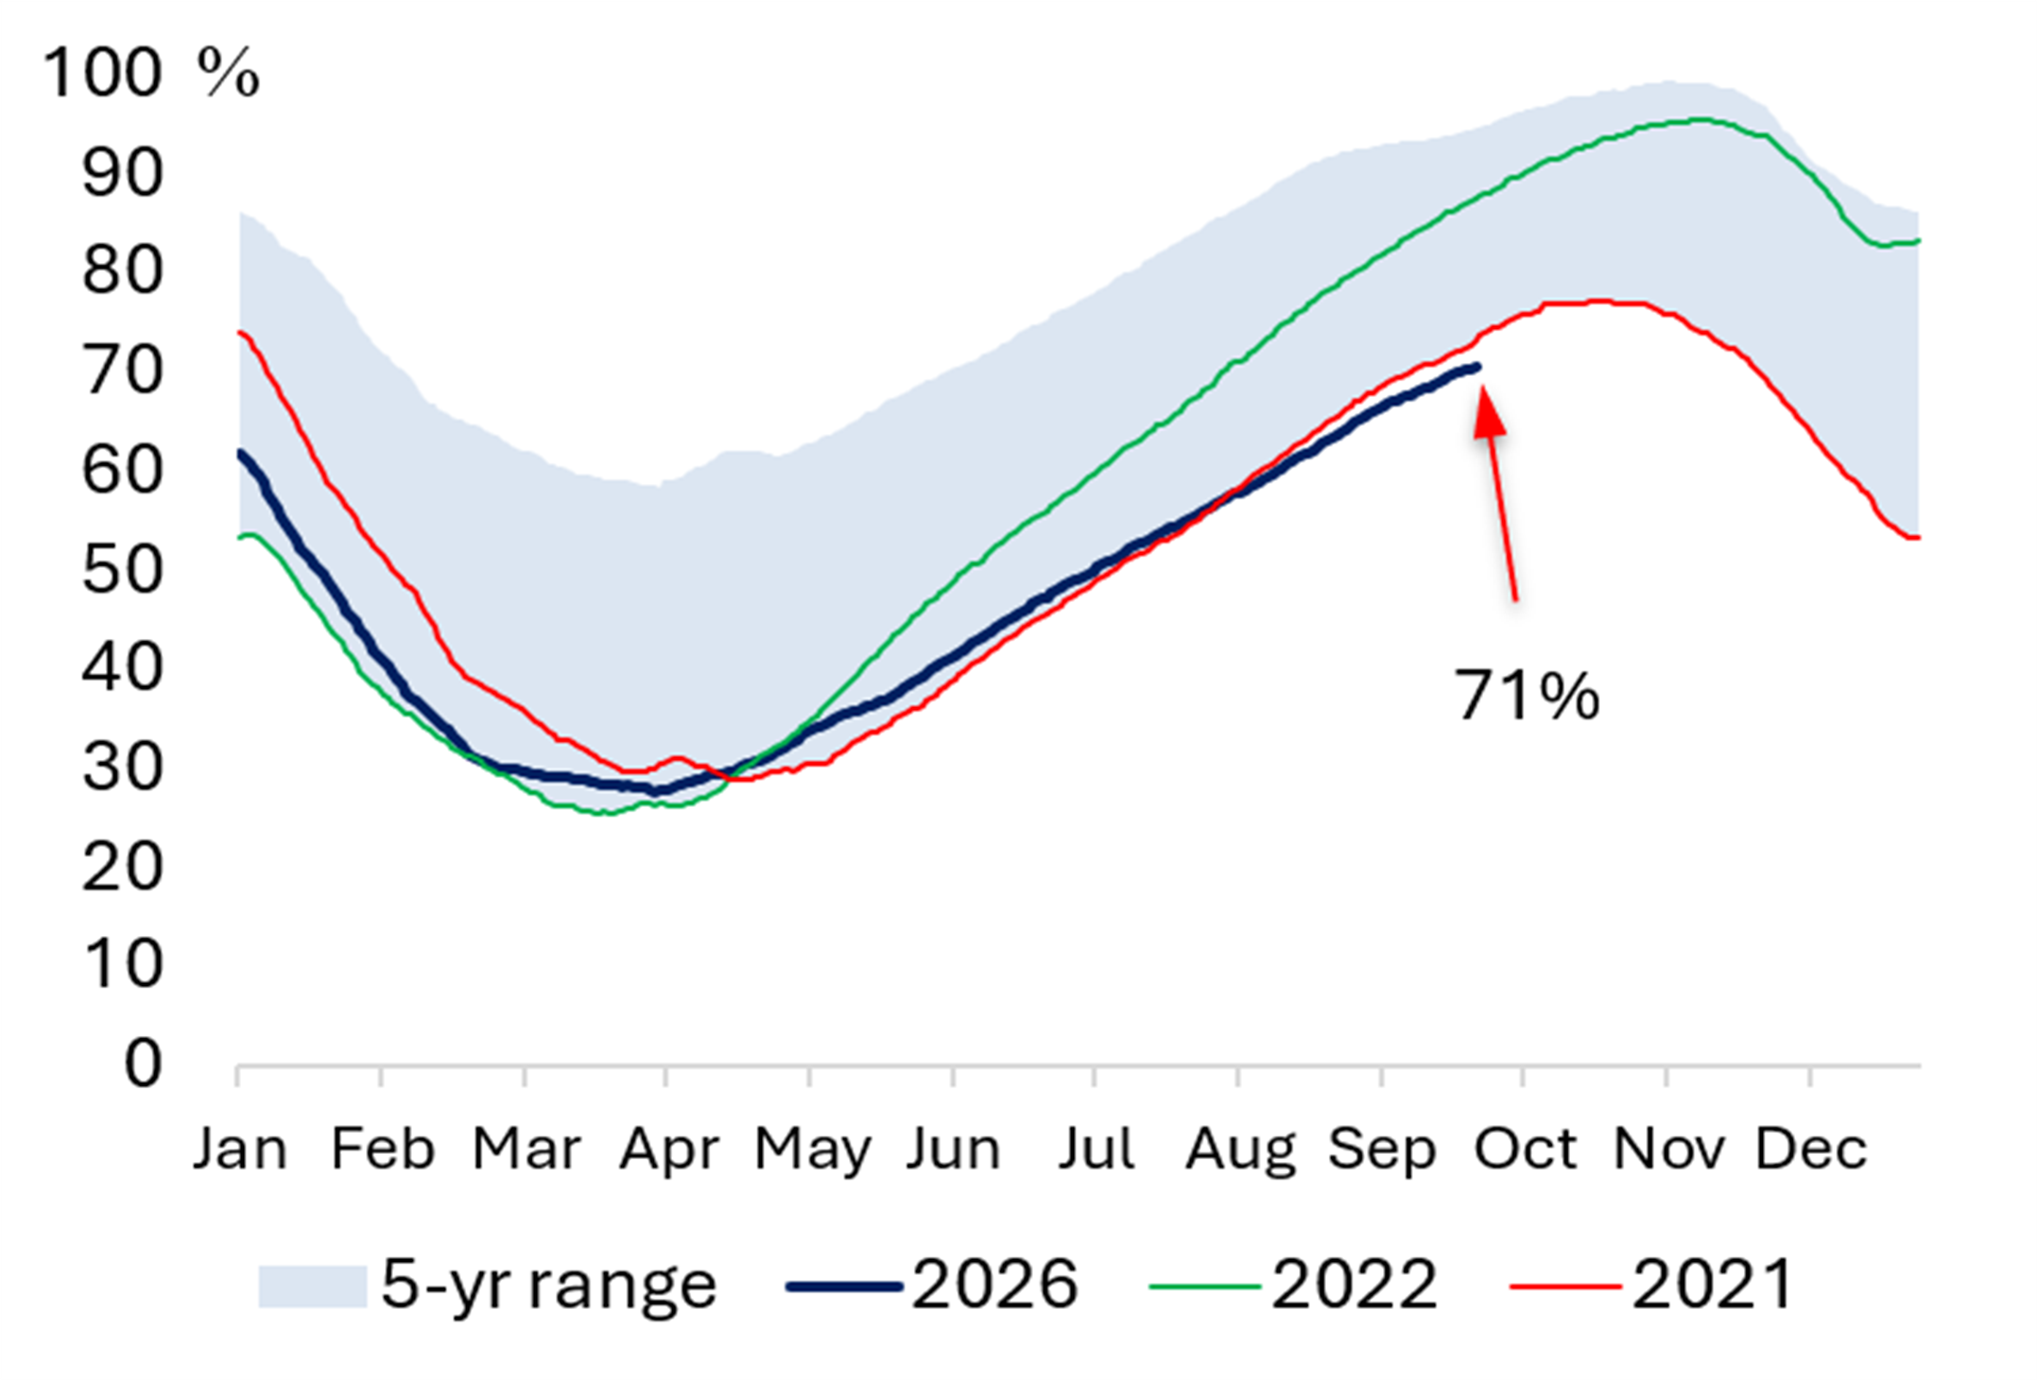
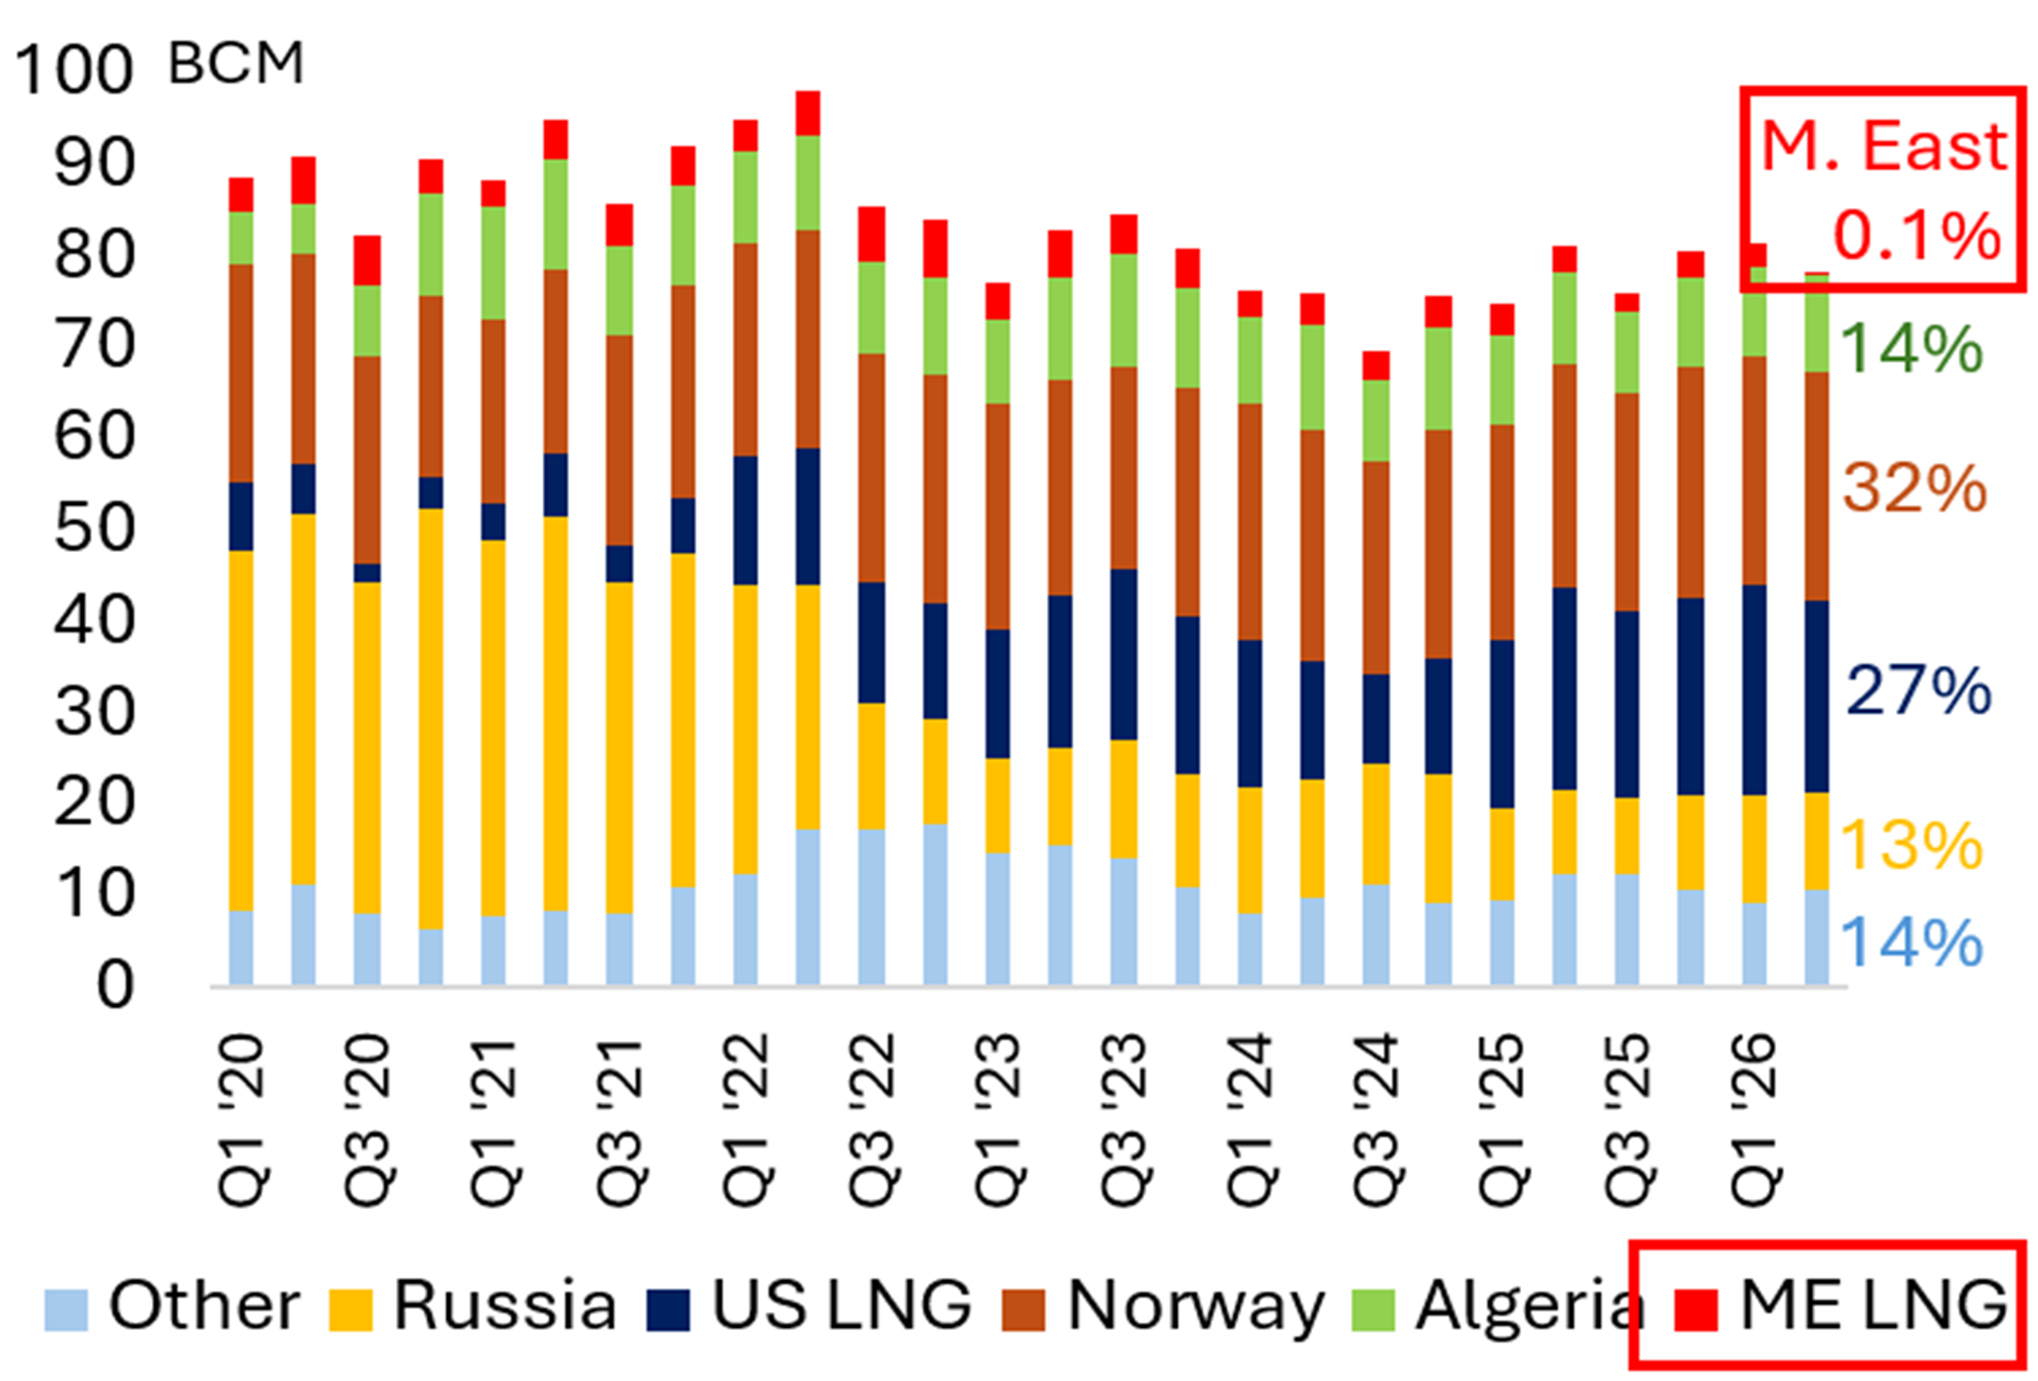
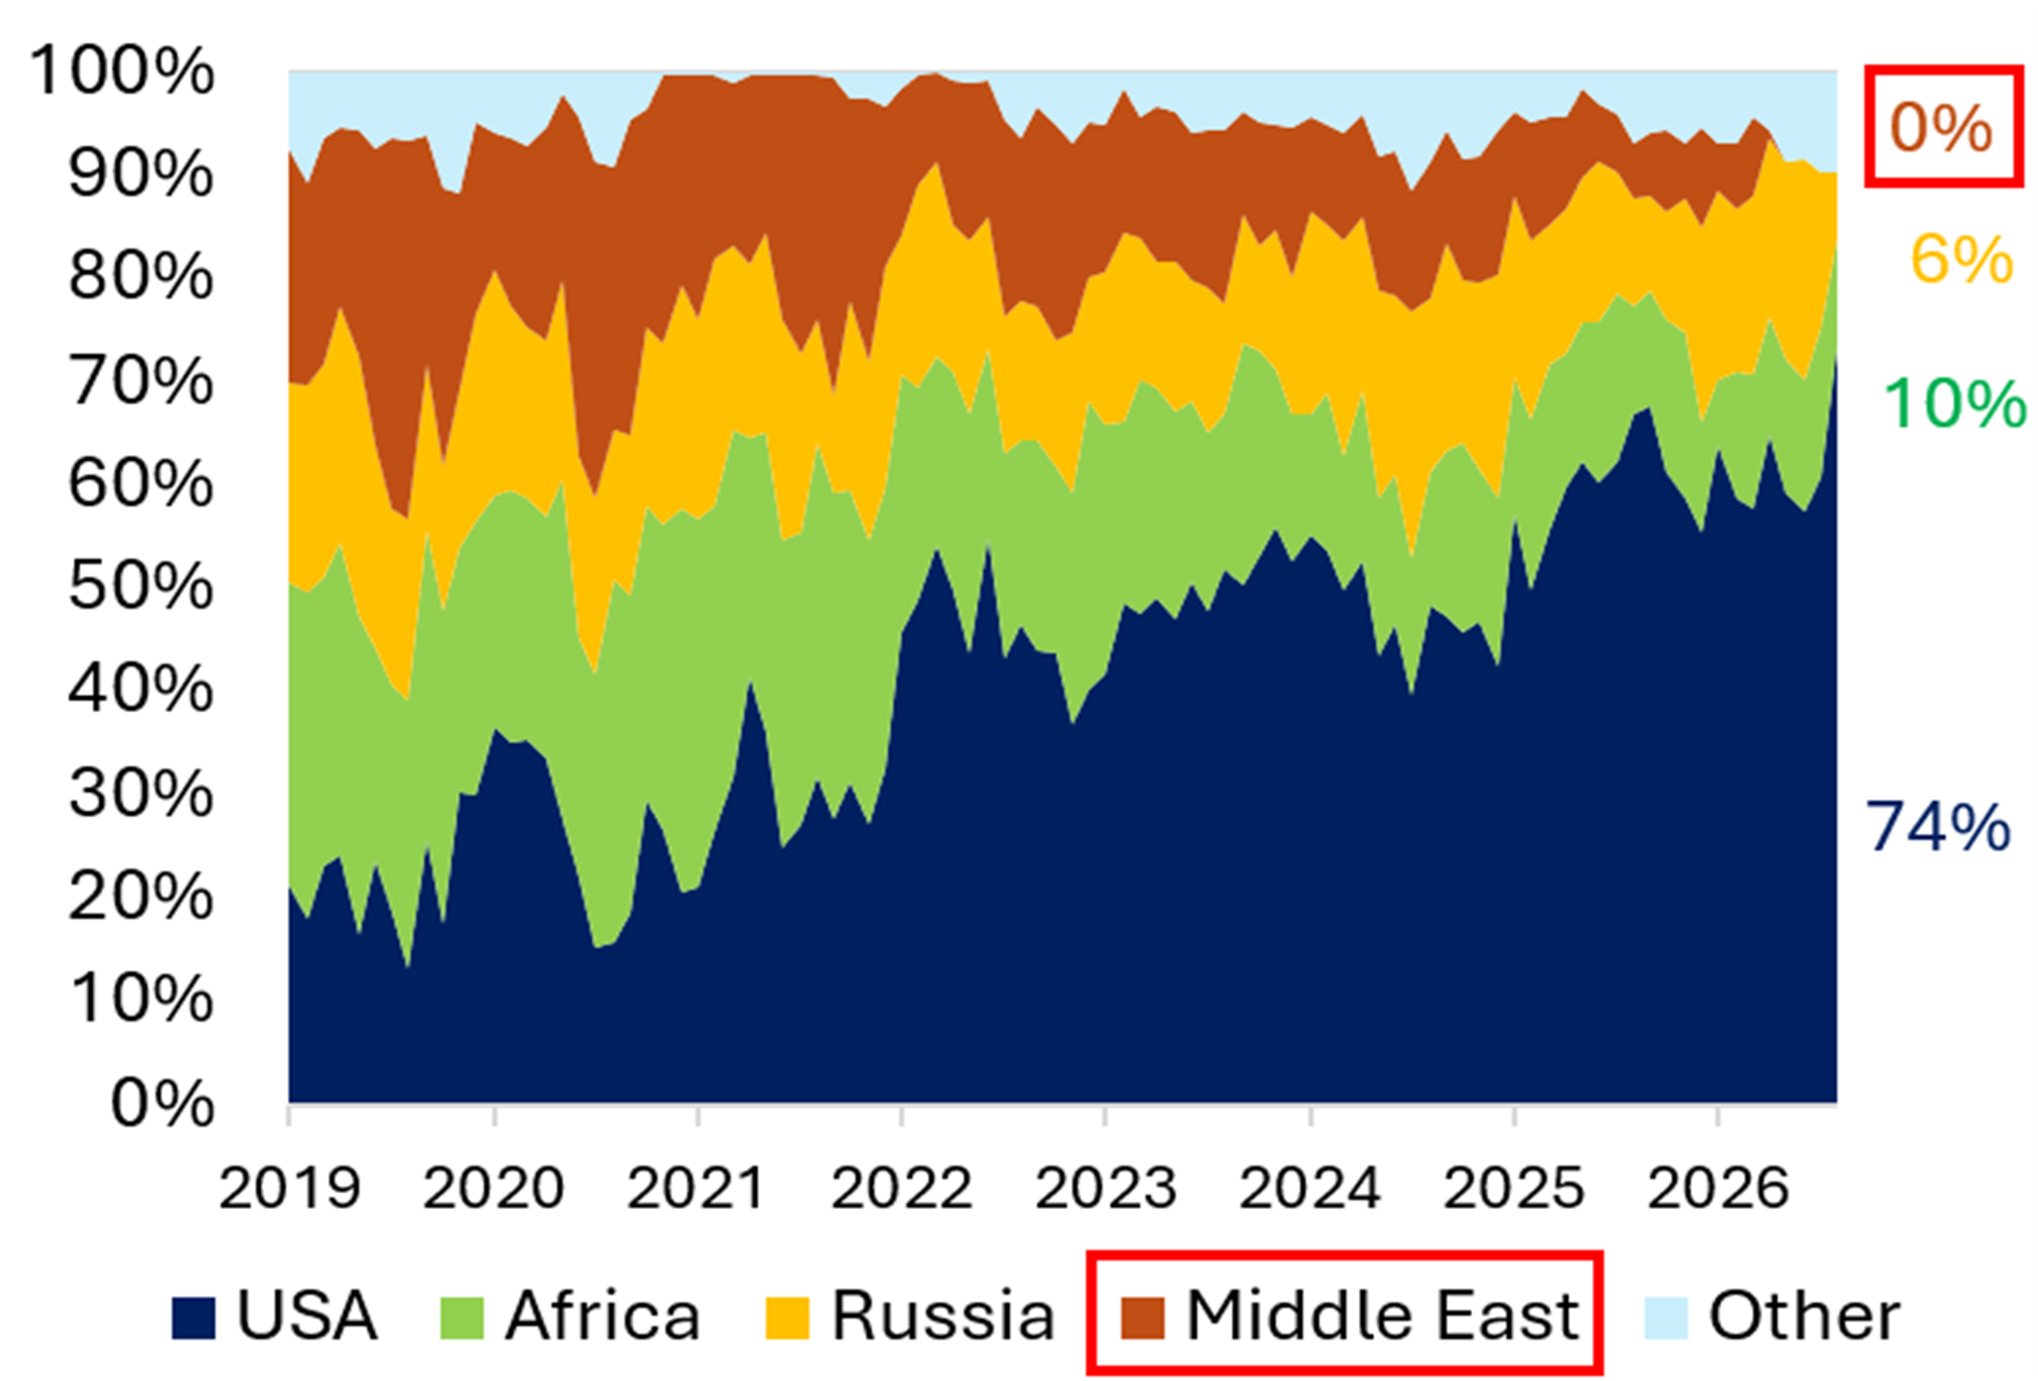
The Iran conflict has pushed Europe into its second energy crisis in four years, but unlike 2022, when Russia cut pipeline gas supplies, Europe faces limited volume risk this time: only around 0.1% of total gas imports in 2Q 2026 came from the Middle East (see Exhibit 10), with the last LNG cargoes delivered in April before monthly LNG imports from the Middle East stopped entirely in May 2026 (see Exhibit 11). However, as Europe failed to replenish depleted gas storage through LNG purchases from the US this summer (US LNG exports were diverted from Europe to Asia, see Exhibit 7), EU gas storage is just 71% full at the end of September, below the lowest level for that time of year since 2021, just before the 2022 energy crisis started (see Exhibit 8). As European buyers now compete with Asian buyers in the spot market to refill storage until November, LNG prices – and, by extension, European gas prices – are likely to remain elevated for the rest of 2026. With average LNG prices already running 43% above last year’s level on a year-to-date basis, European gas prices have moved higher as well. Average EU gas prices are up 36% versus 2025, while average UK gas prices are 27% higher year-to-date than in 2025 (see Table 3).
Table 3 Megawatts & Molecules: Average Annual Electricity, Carbon, Coal and Gas Prices

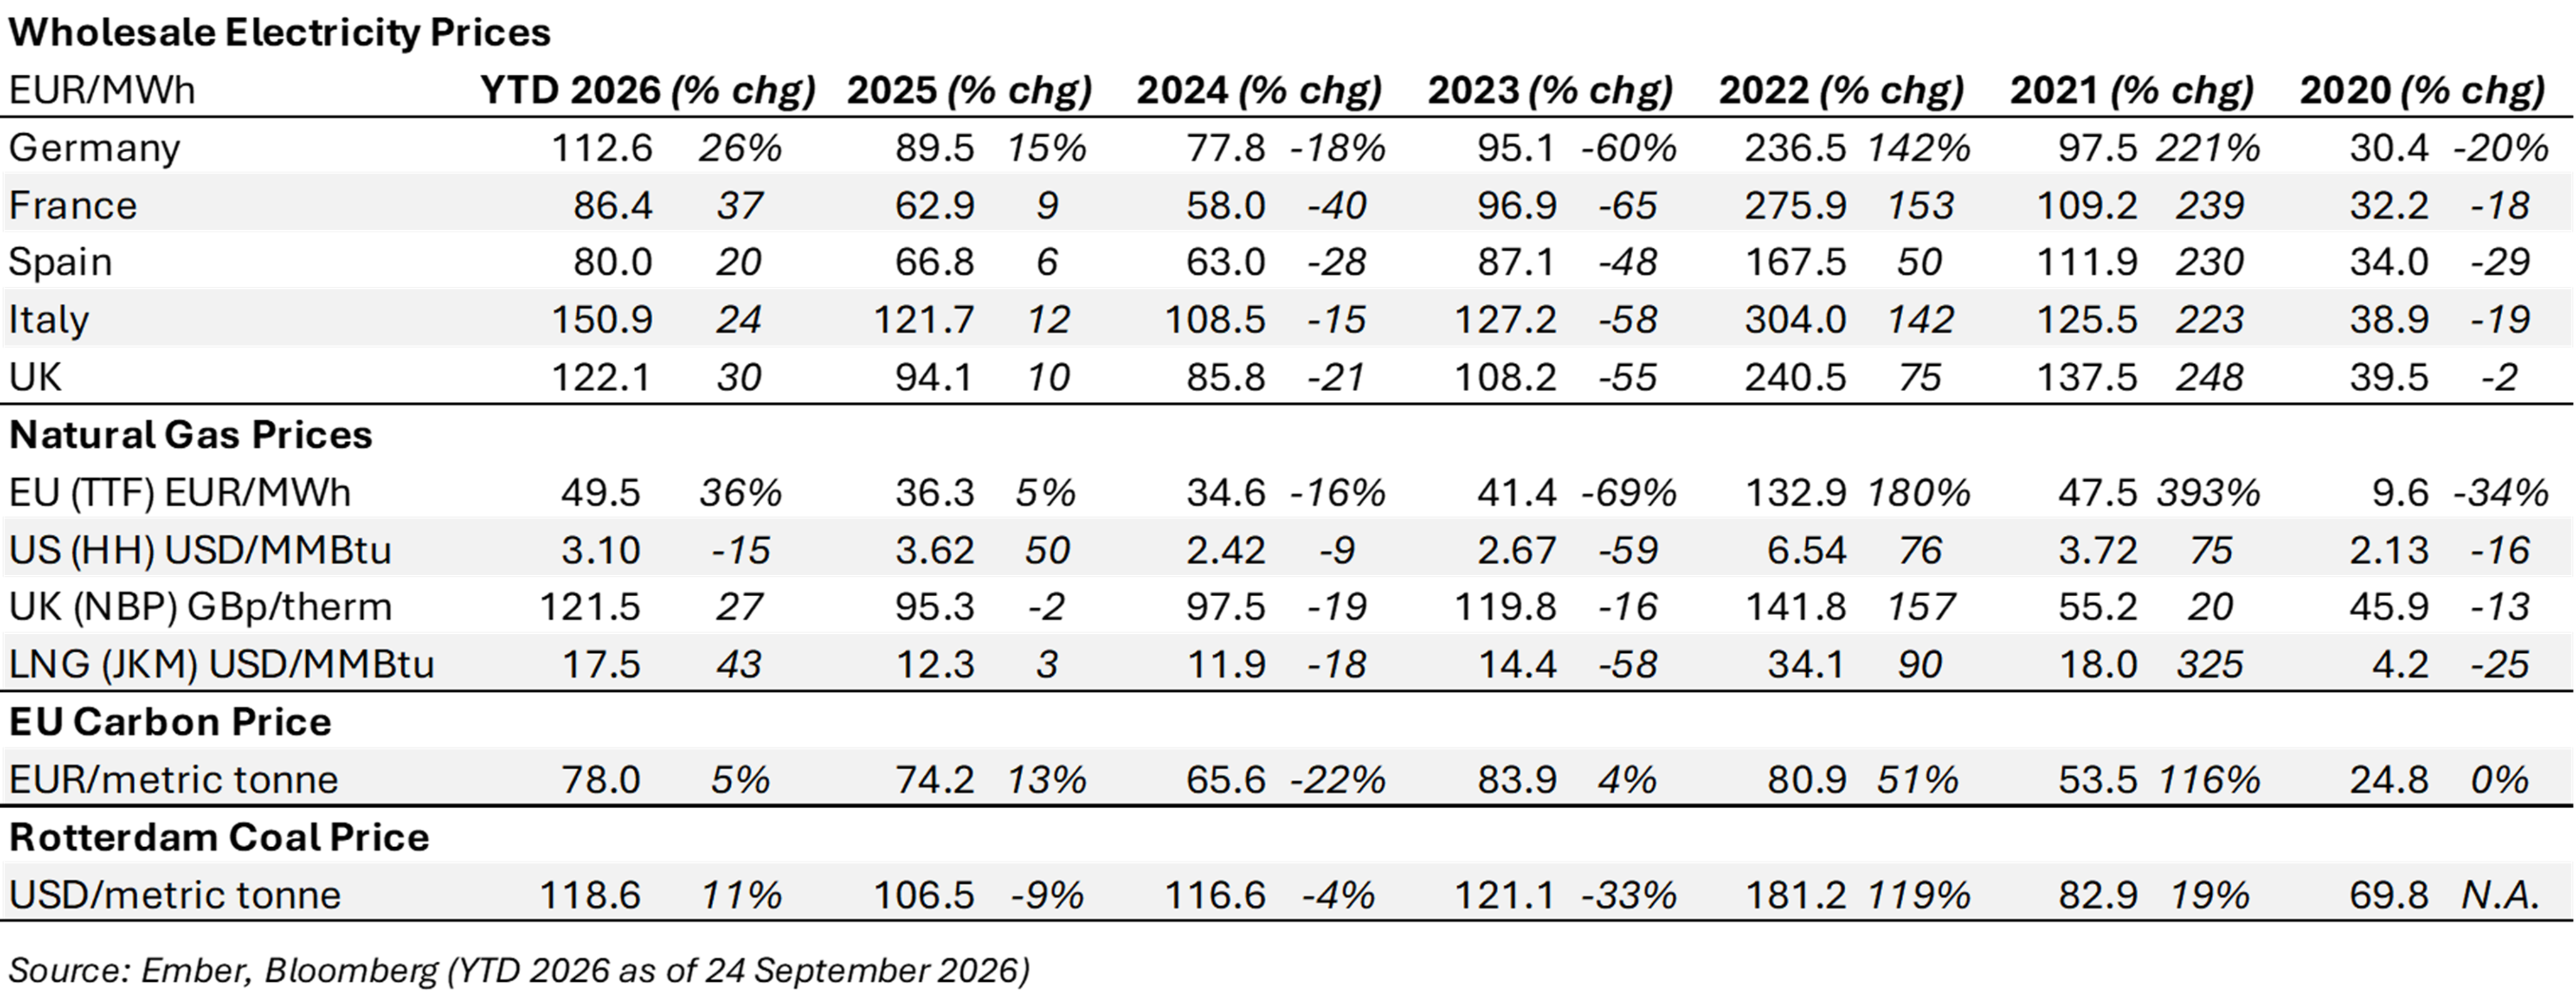
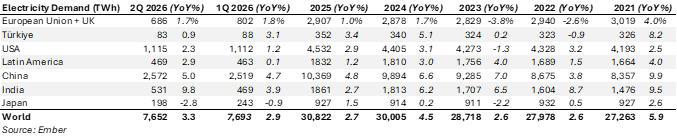
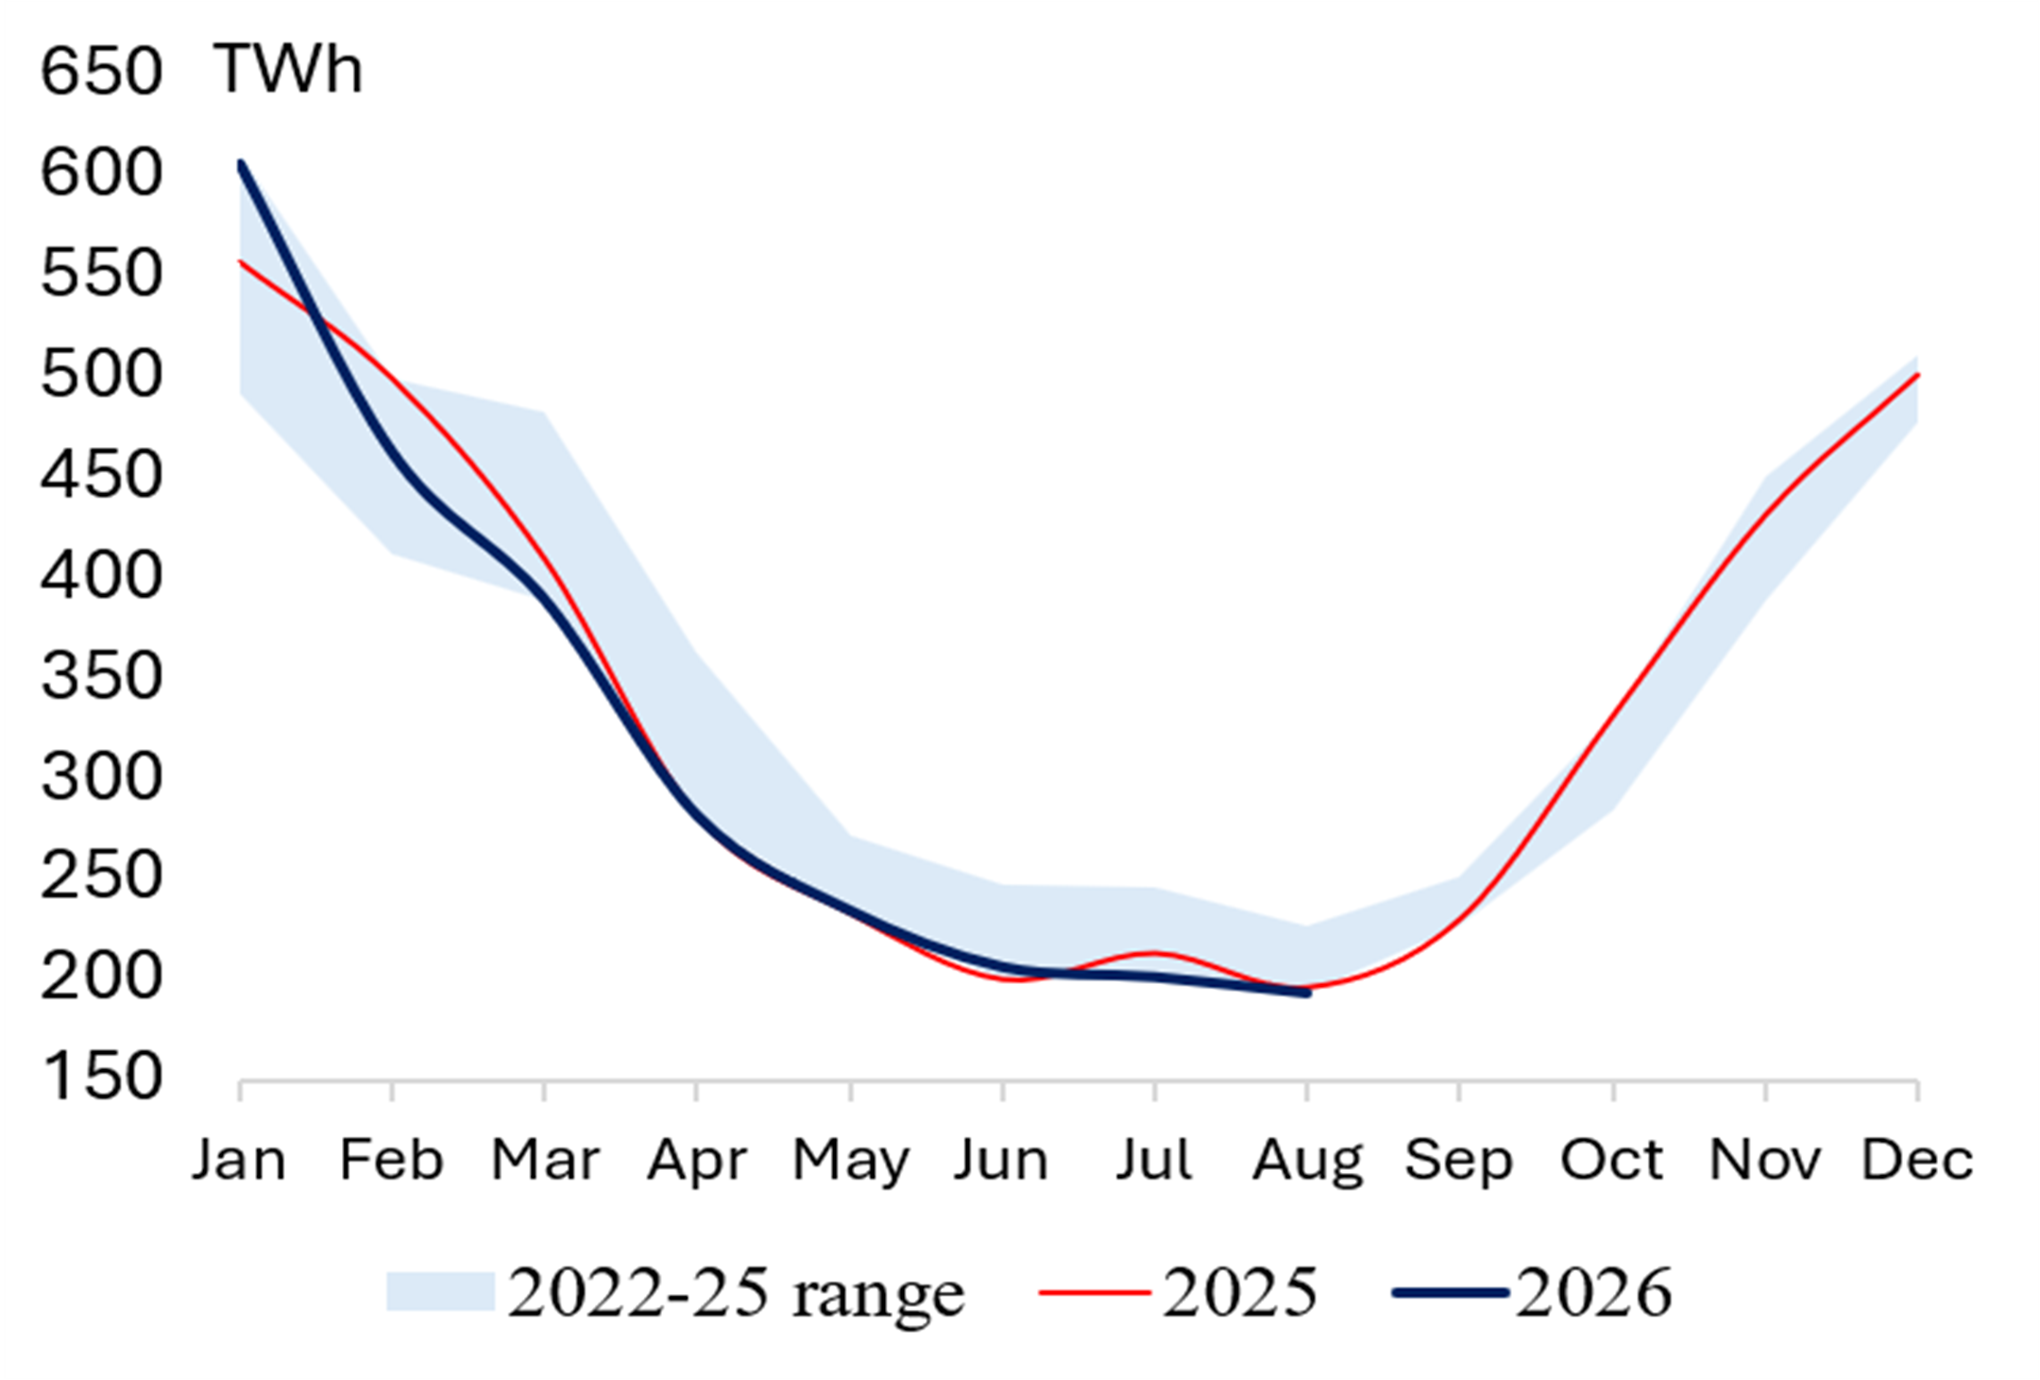
Rising gas prices have also pushed up power prices in countries that rely heavily on gas-fired generation, as gas-fired plants are typically the marginal power producers under Europe’s merit-order system and therefore set wholesale electricity prices. Accordingly, average wholesale power prices in Germany, Italy, and the UK have already exceeded their 2025 averages by 26%, 24%, and 30%, respectively, on a year-to-date basis in 2026 (see Table 3). However, even prices in Spain have now jumped (+20%) although the country is less dependent on gas for power generation. Despite elevated power prices across Europe in 2026, it is encouraging that EU+UK electricity demand has grown 1.8% in 1Q 2026 and 1.7% in 2Q 2026 after several years of declining consumption (see Table 4). EU+UK power demand in July and August continued to grow by 3-4% due to hot weather (see Exhibit 12).
Table 4 Annual Electricity Demand (TWh)

Gas Storage and LNG Flows
Exhibit 6 US Gas Storage Exhibit 7 US LNG Exports 

Source: US Energy Information Administration Source: US Energy Information Administration
Exhibit 8 EU Gas Storage (% full) Exhibit 9 EU + UK Gas Demand 

Source: Gas Infrastructure Europe Source: Bruegel
Exhibit 10 EU Quarterly Gas Imports by Source Exhibit 11 EU Monthly LNG Imports 

Source: Bruegel Source: Bruegel
Global Electrification Trends (Power Demand in TWh)
Exhibit 12 Europe Electricity Demand Exhibit 13 USA Electricity Demand 

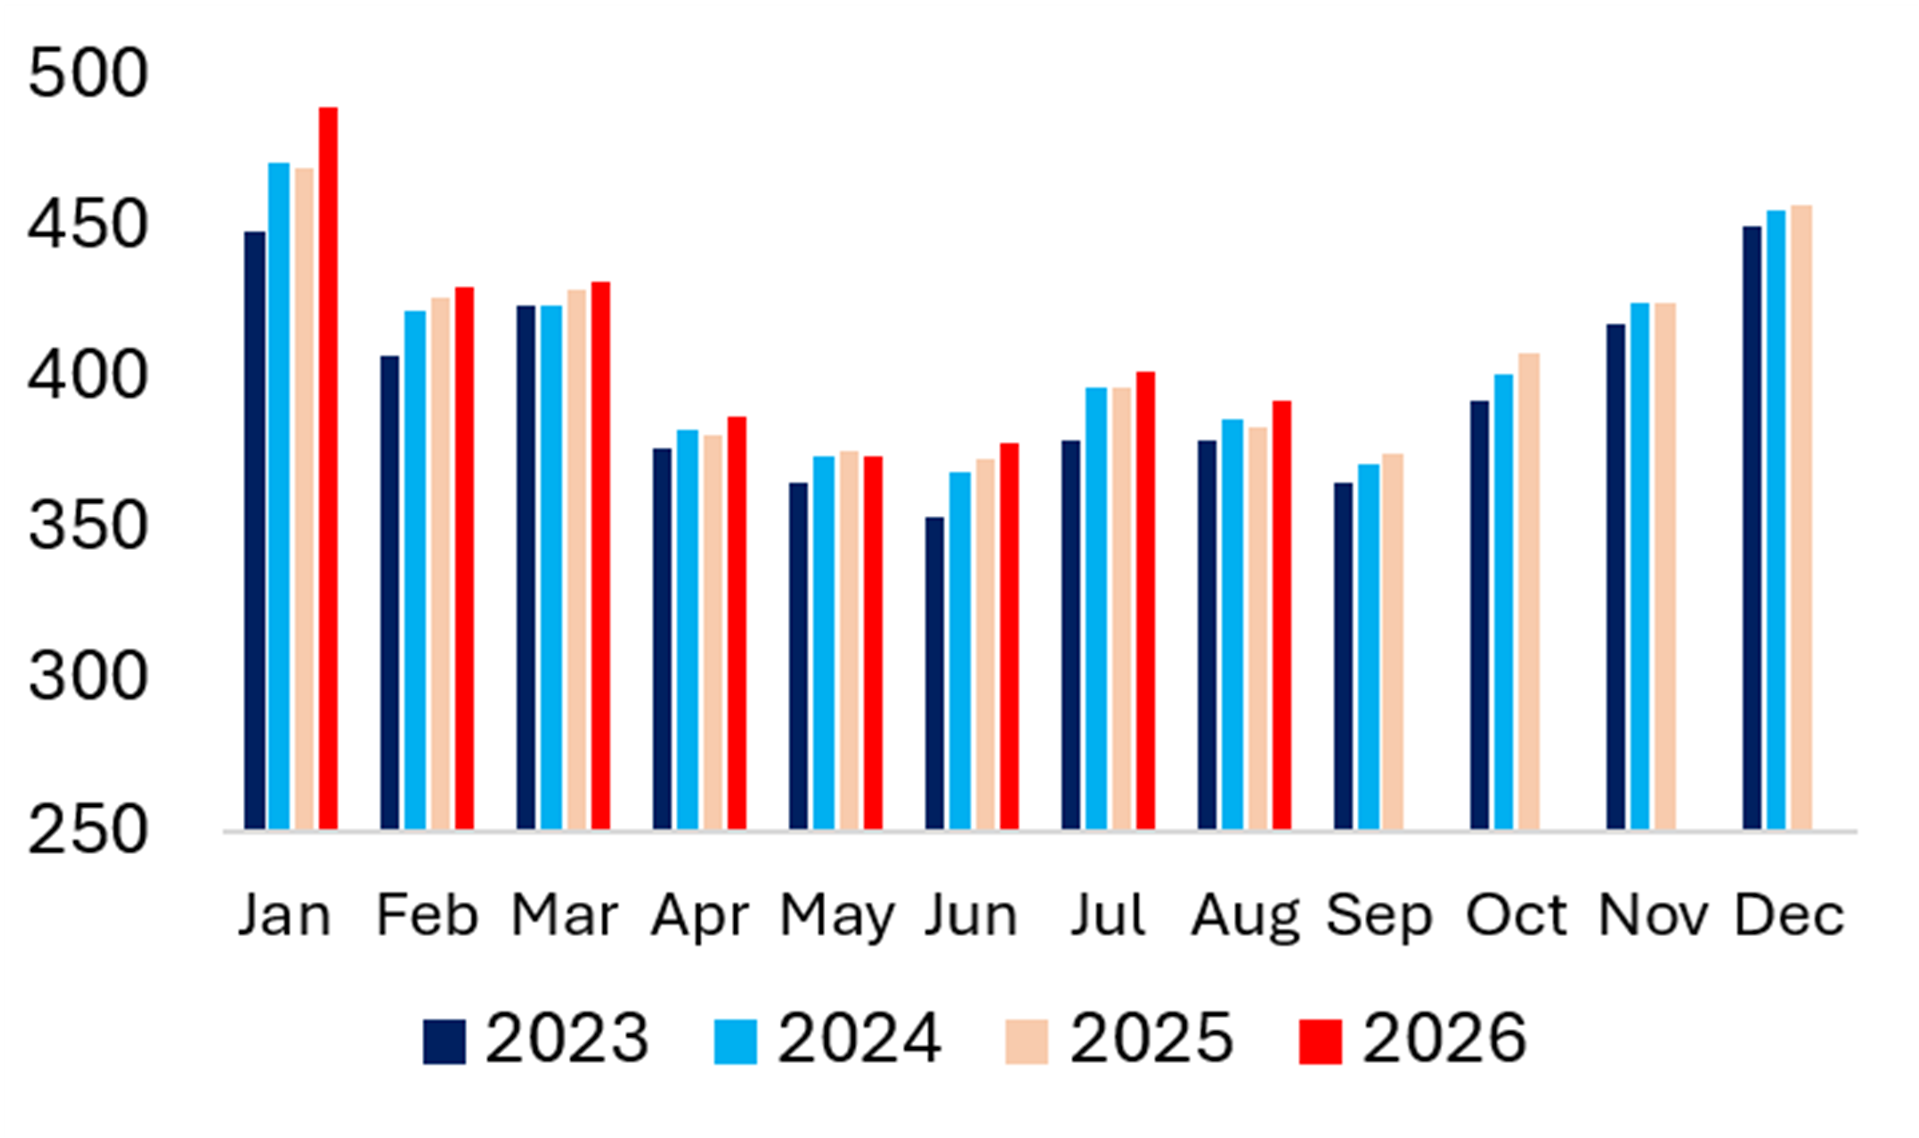
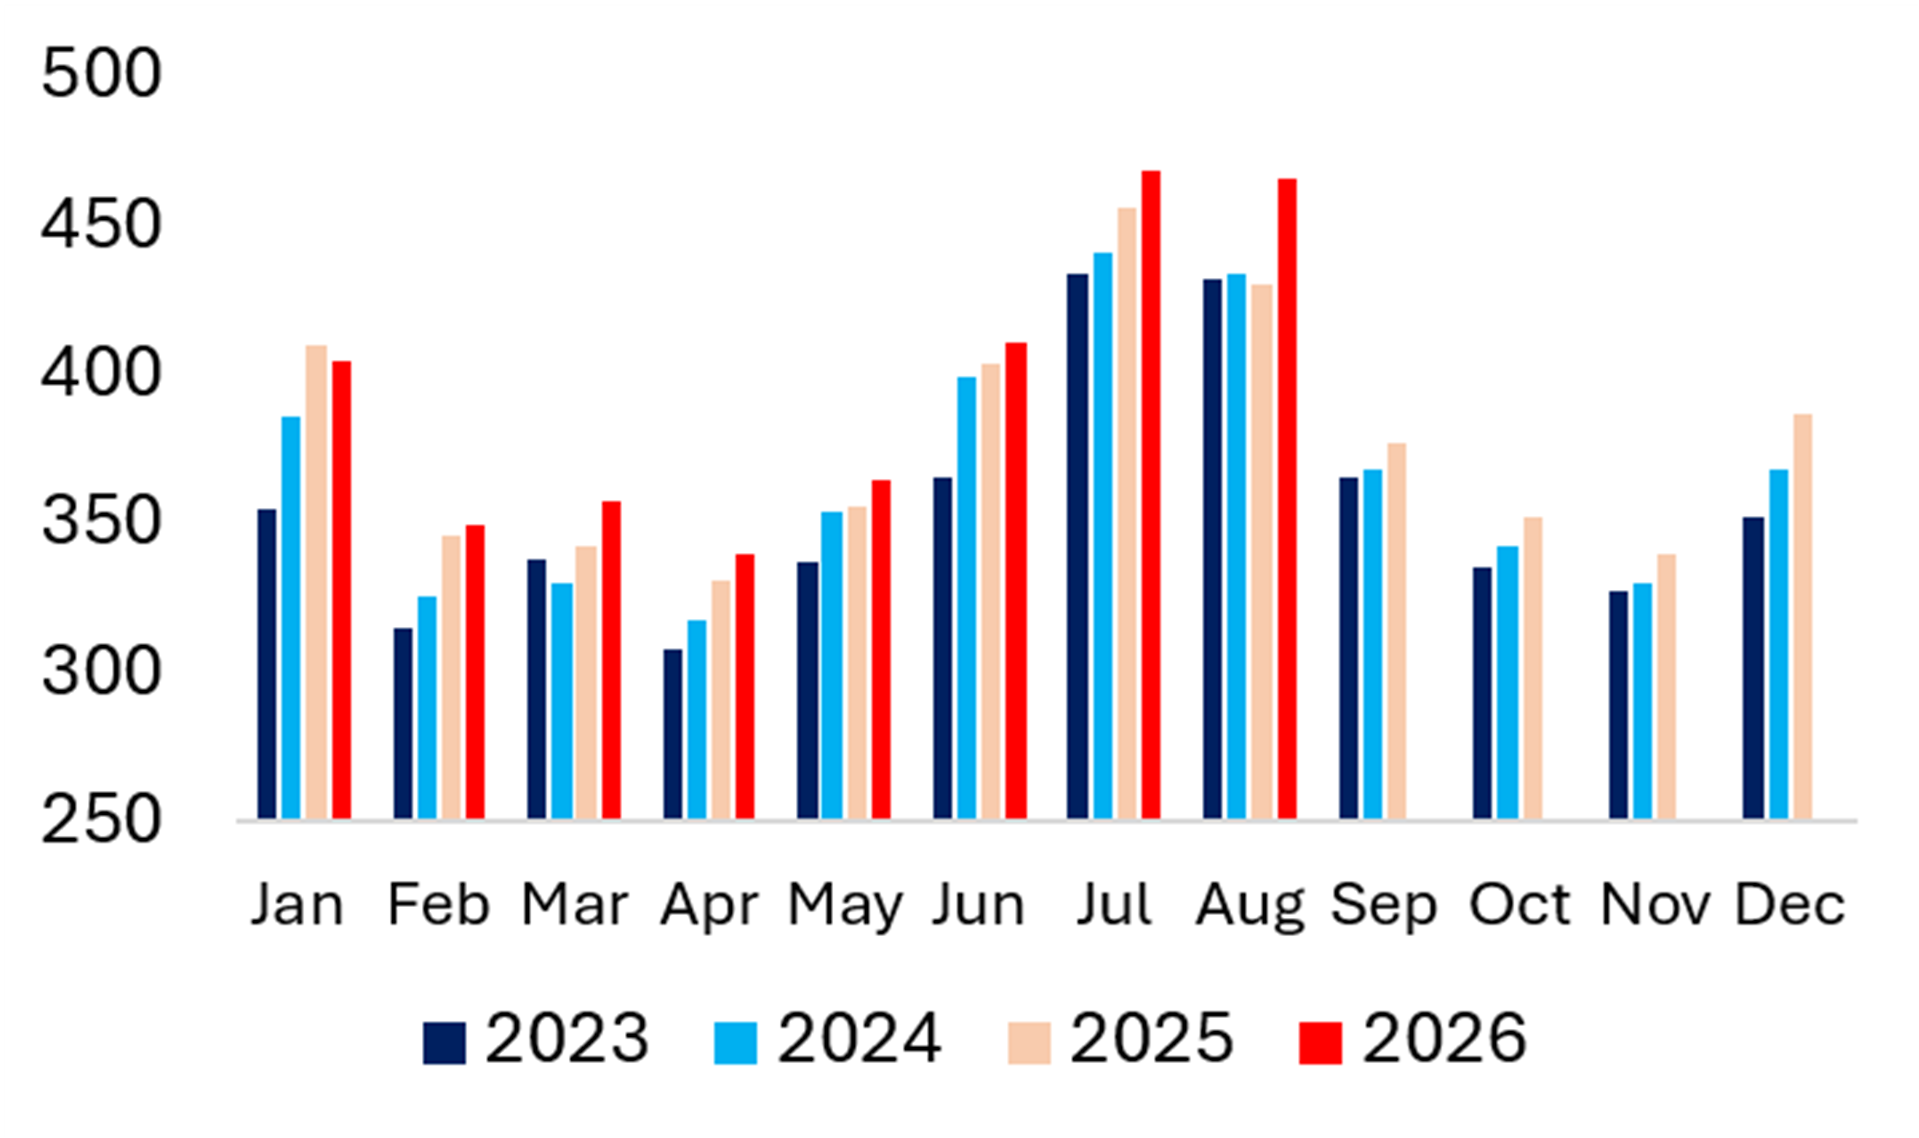
Exhibit 14 Türkiye Electricity Demand Exhibit 15 LatAm Electricity Demand 

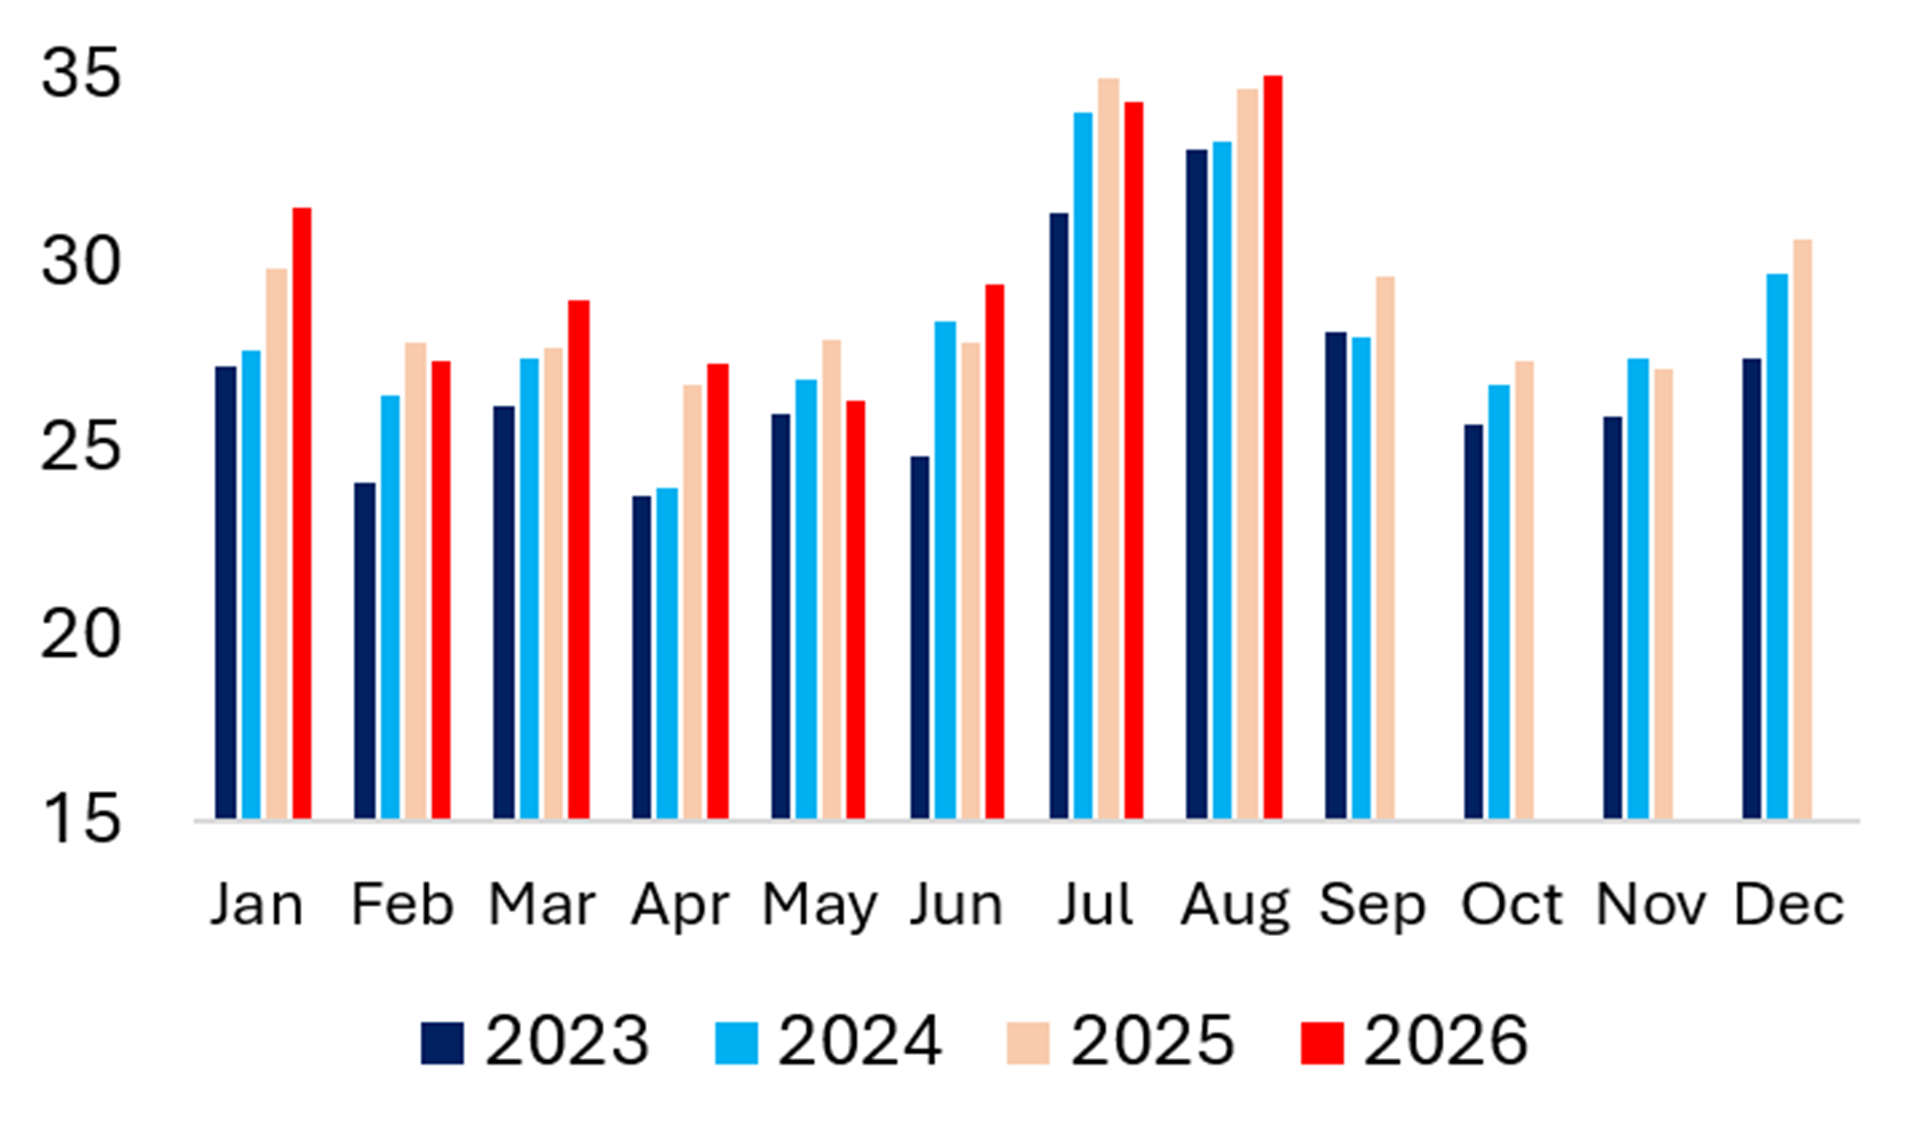
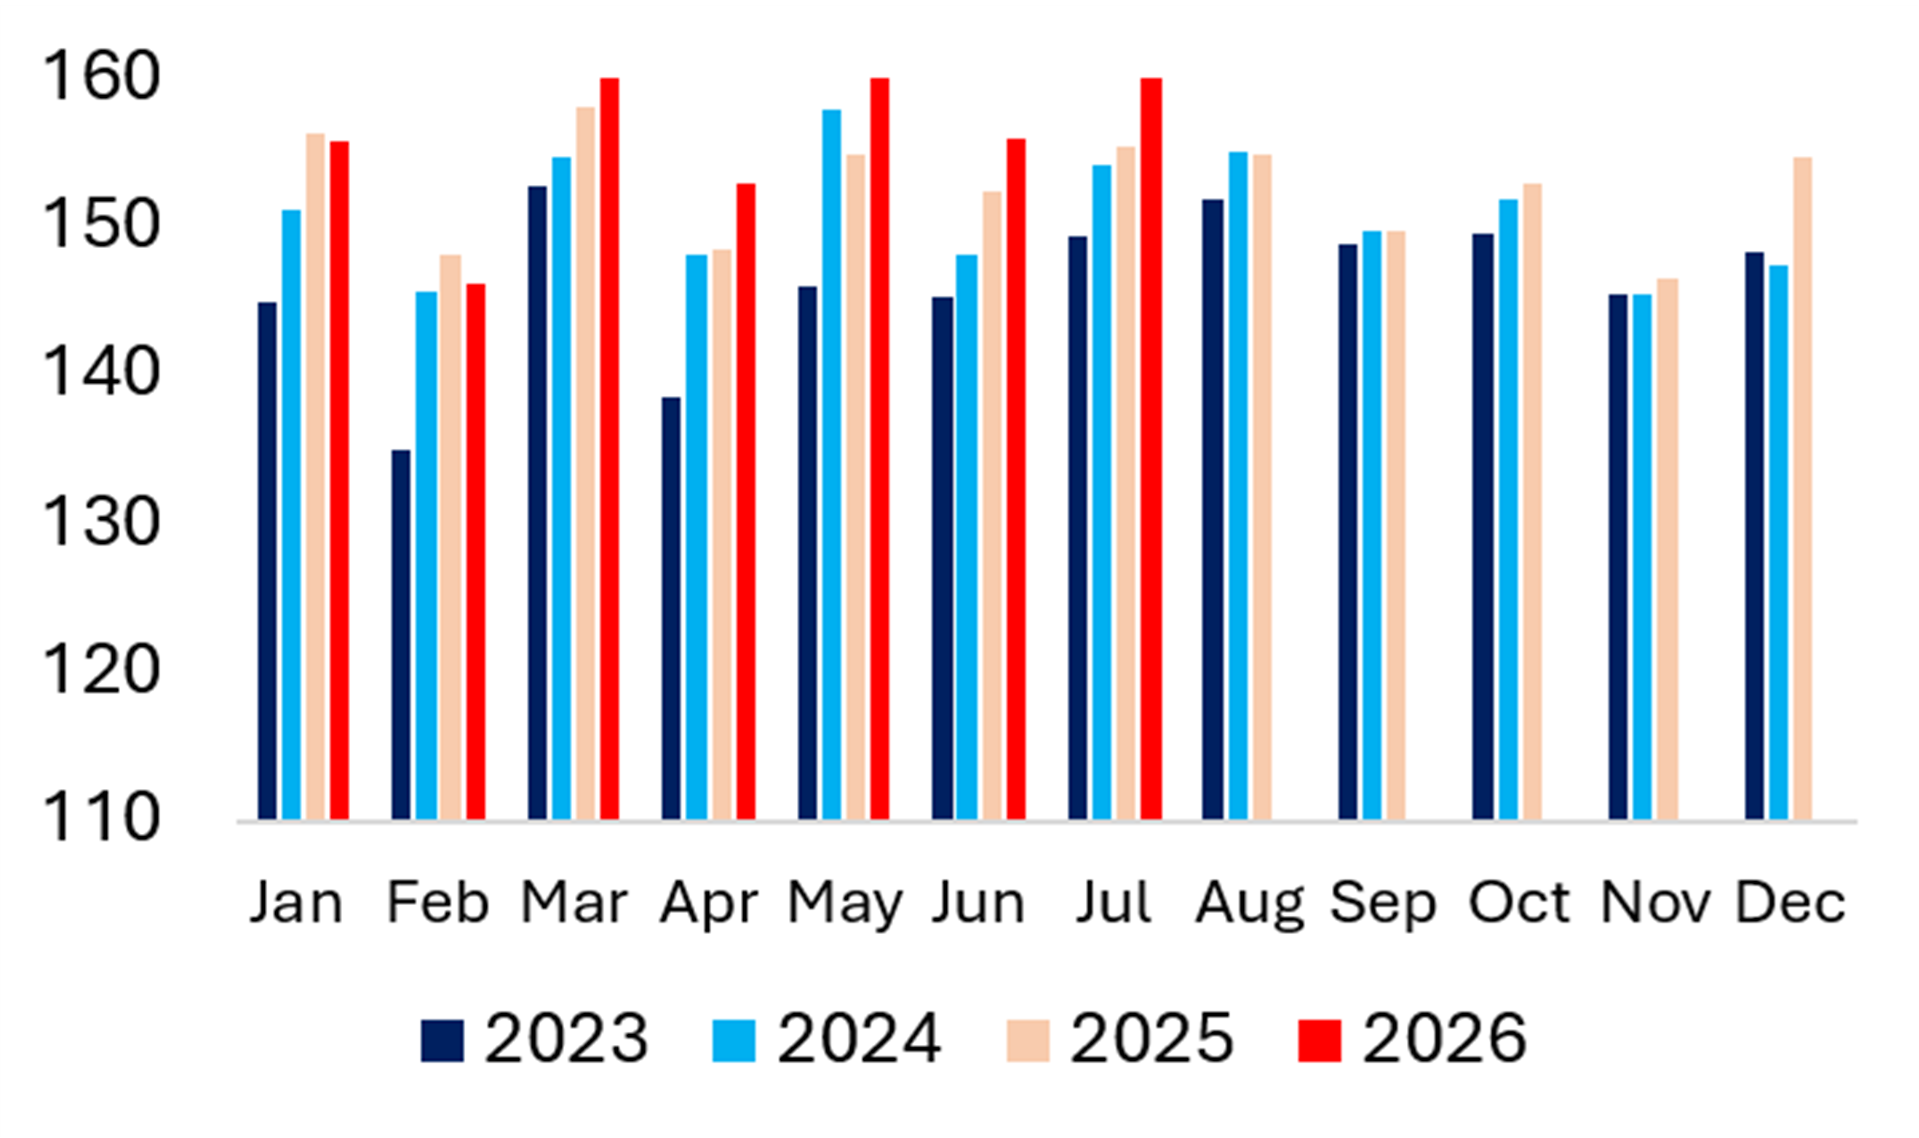
Exhibit 16 China Electricity Demand Exhibit 17 Japan Electricity Demand 

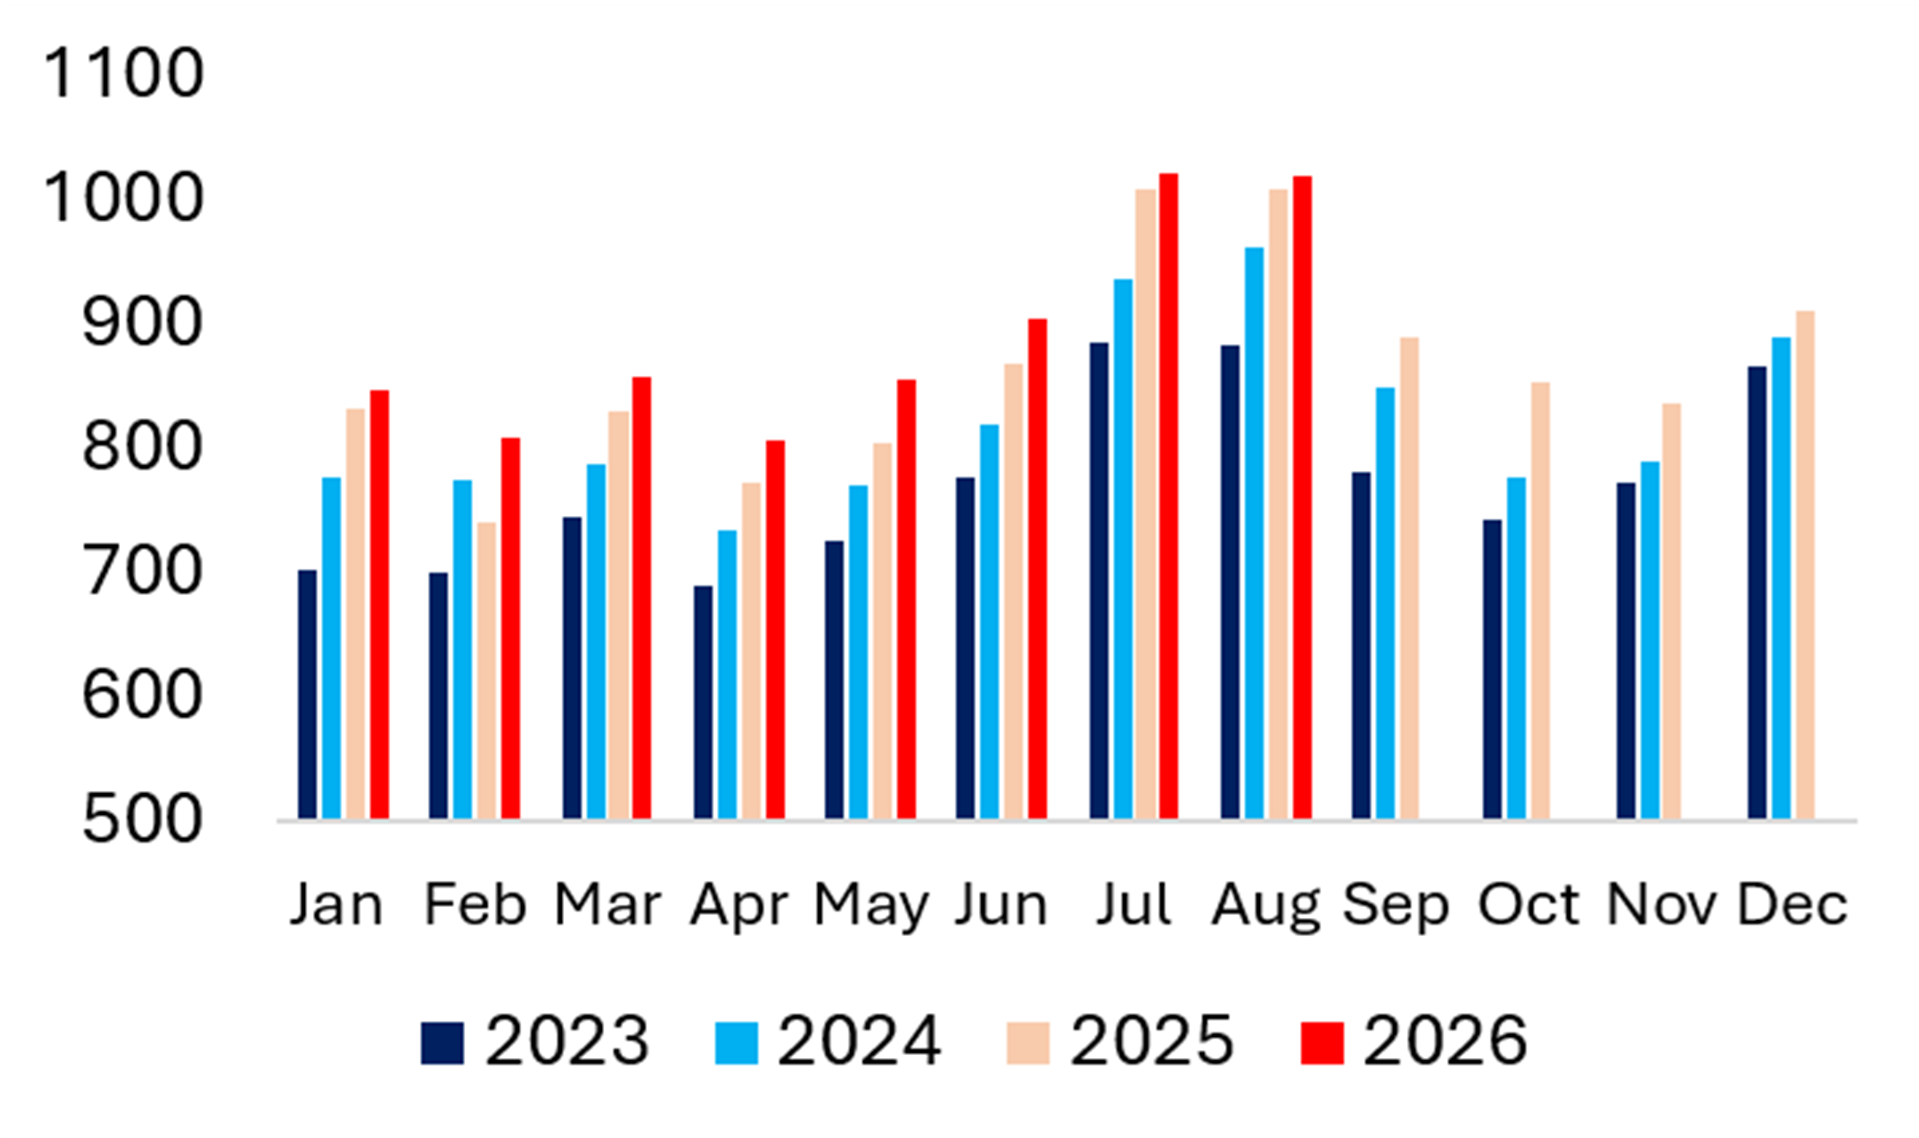
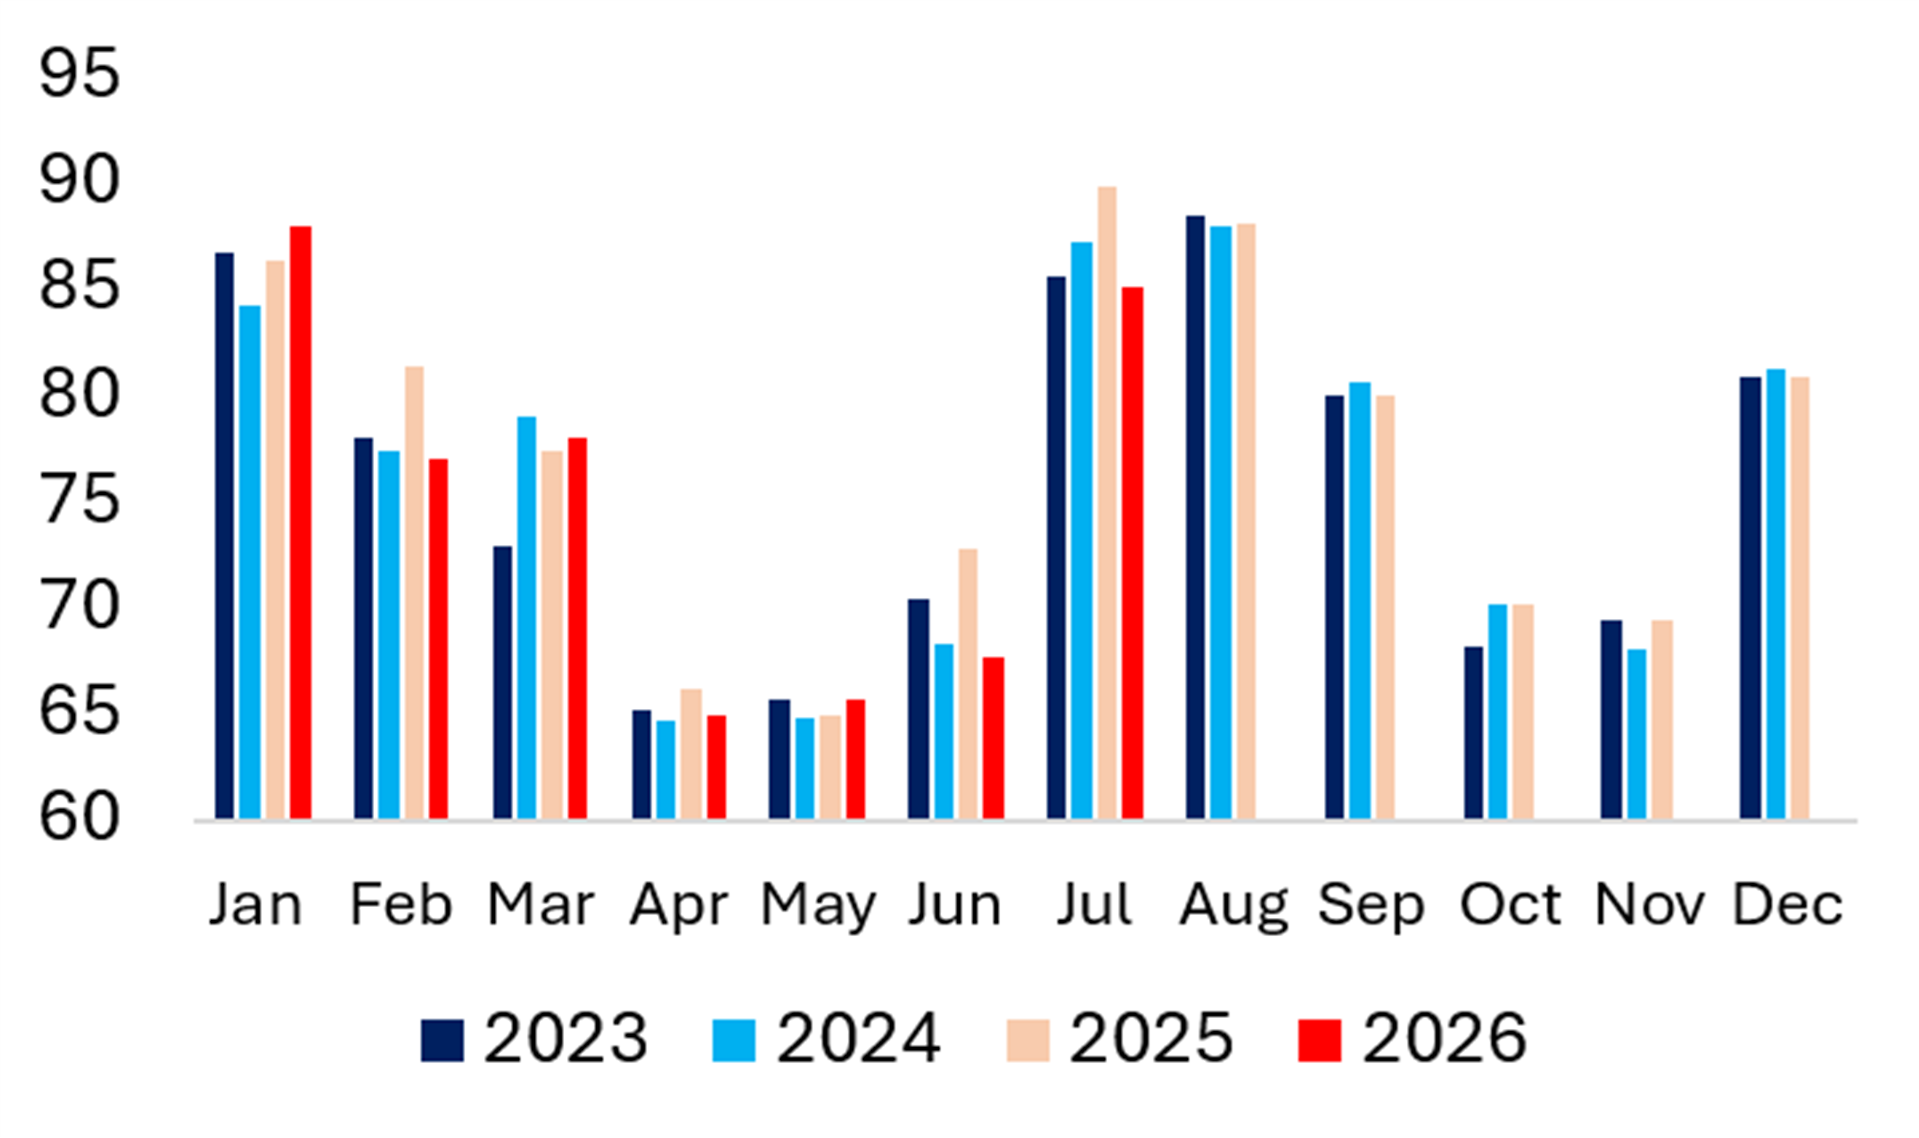
Exhibit 18 India Electricity Demand Exhibit 19 World Electricity Demand

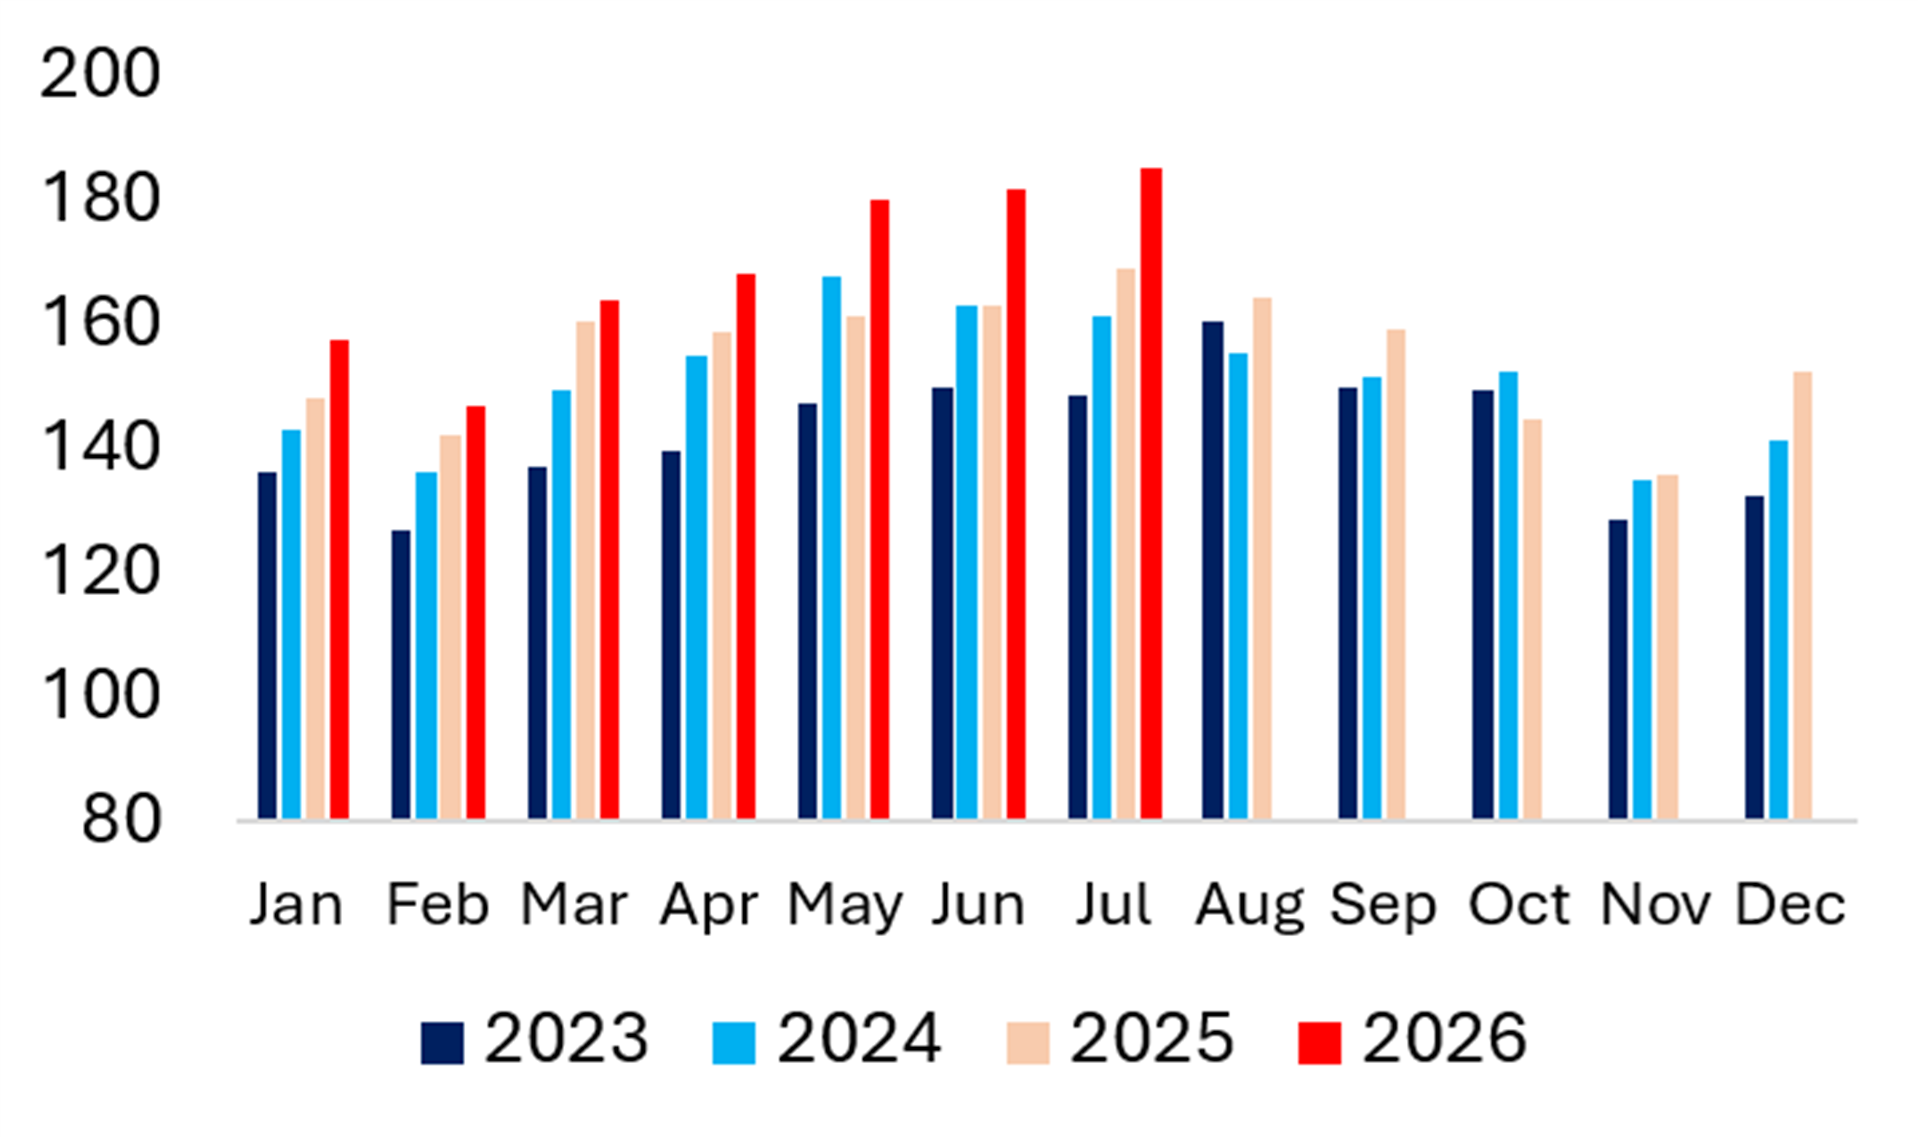
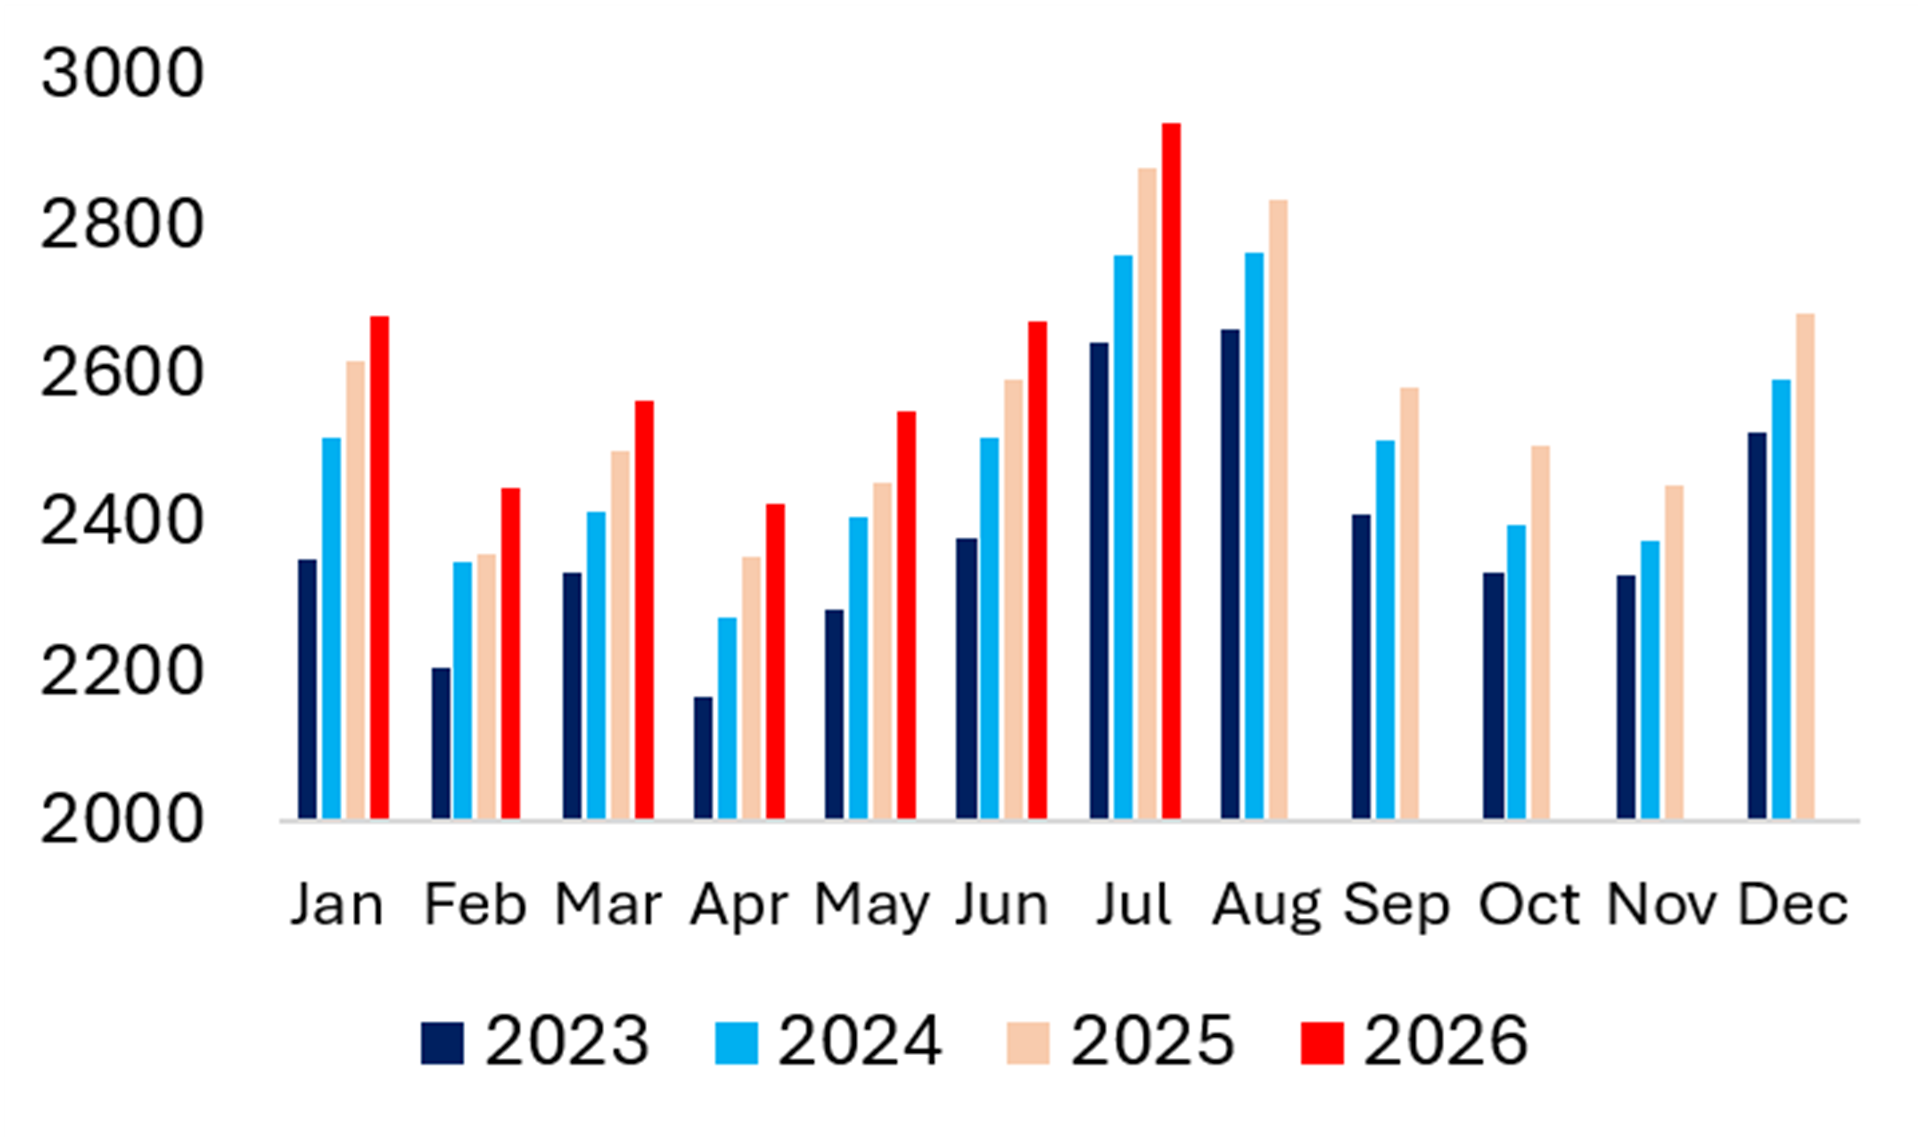

Source: Ember
Power Tracker: Changing Fuel Mix and 3 Biggest Sources of Power Generation
EUROPE
Exhibit 20 Europe: Biggest Source of Electricity in Each Country
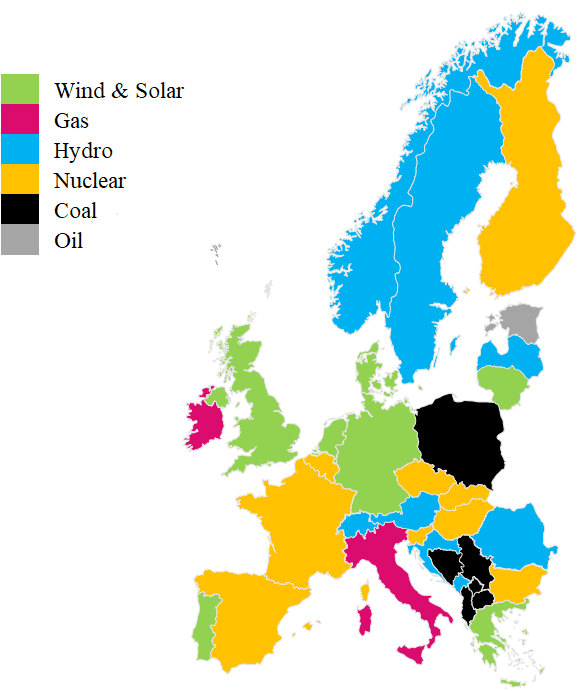
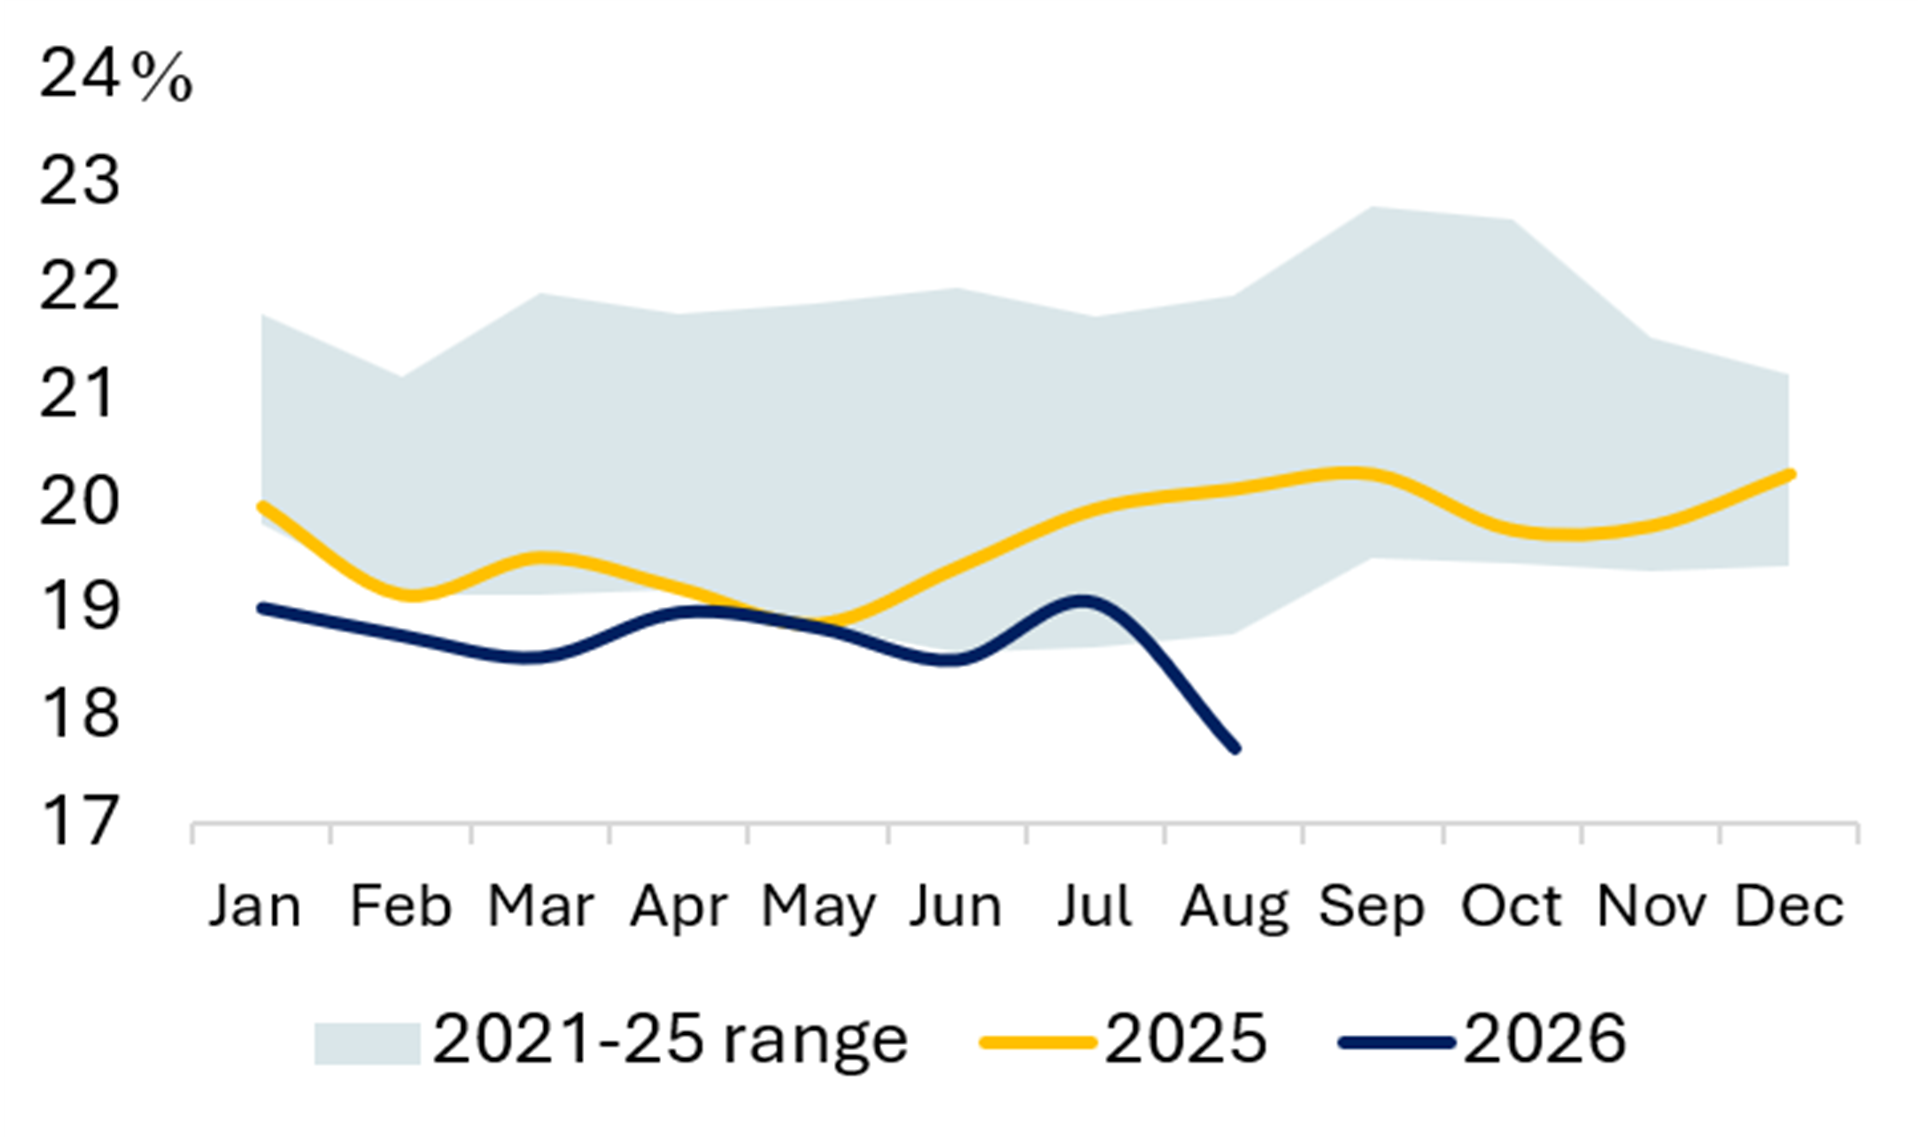
Exhibit 21 Power Generation Exhibit 22 Share of Wind & Solar (%) 

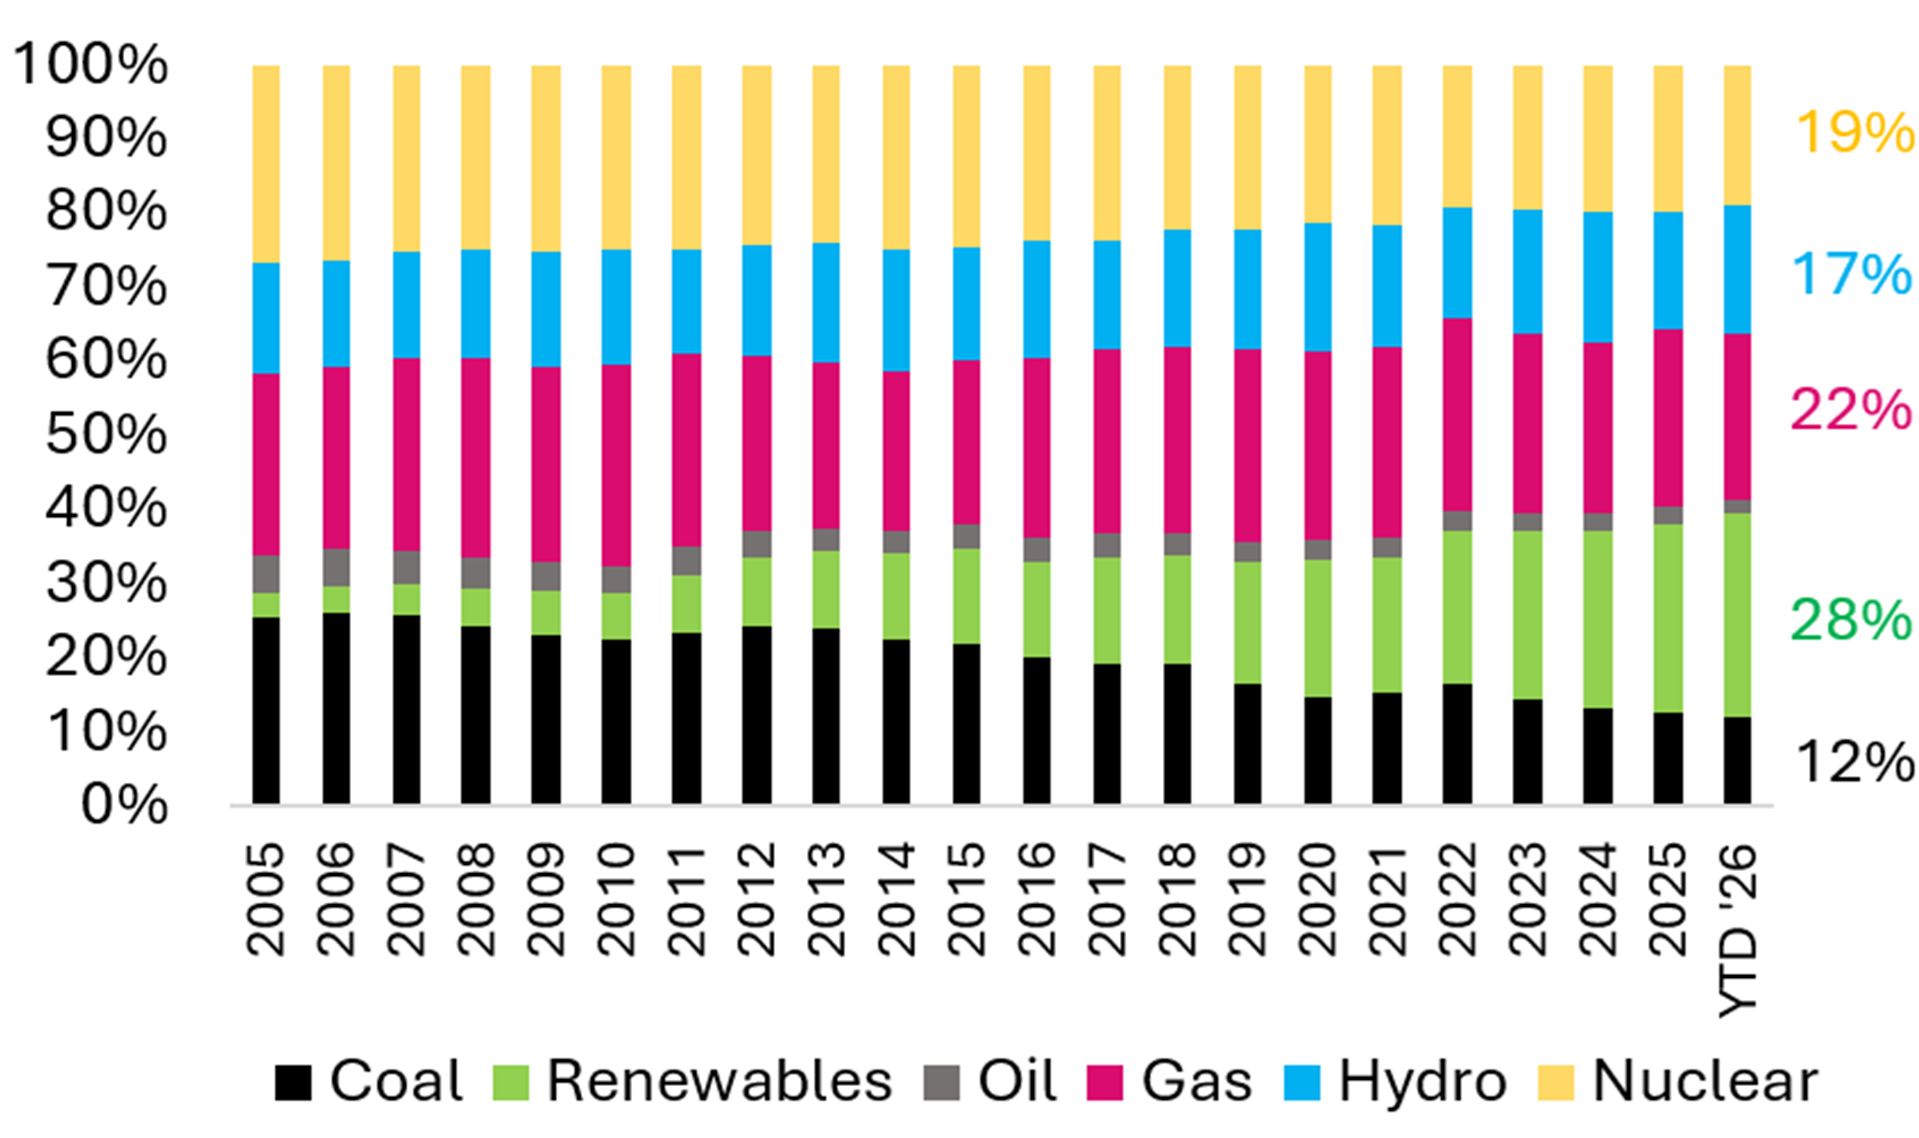
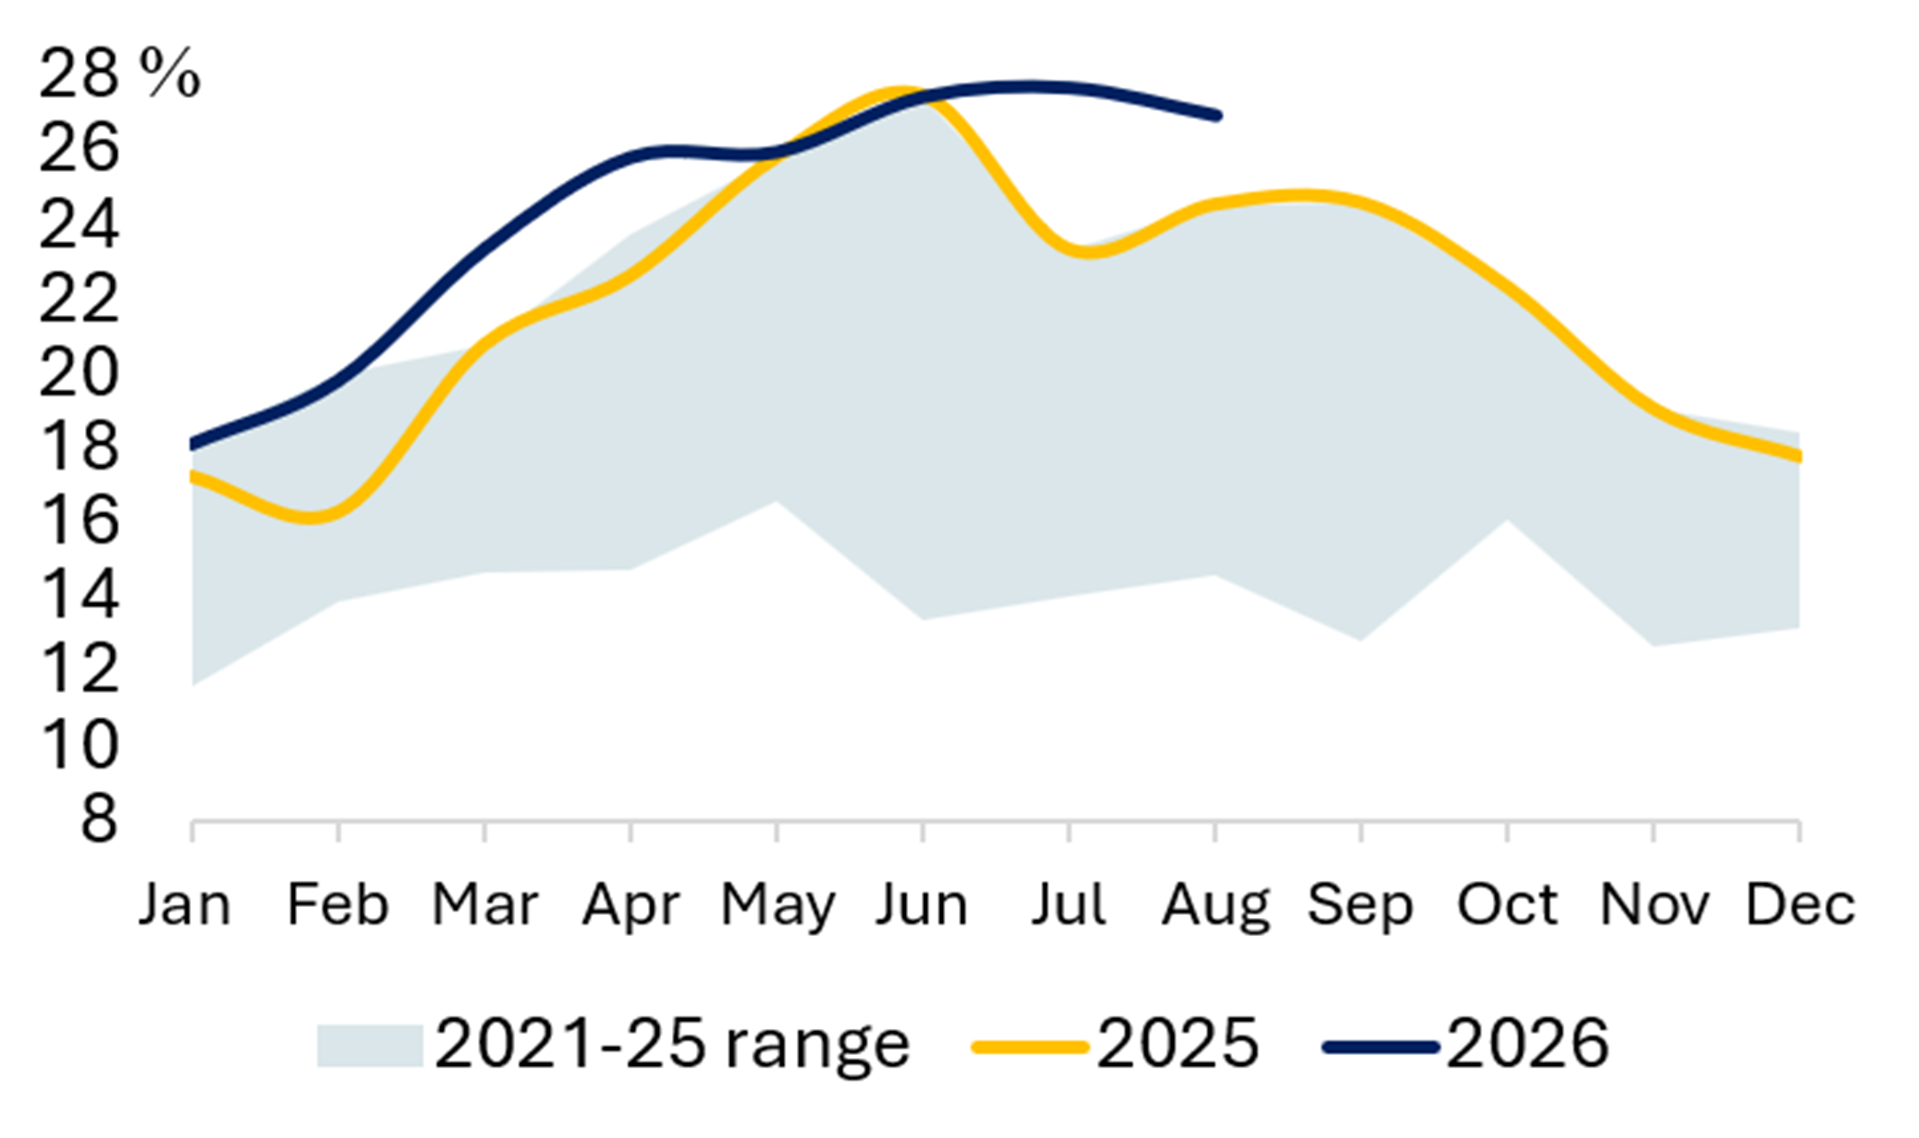
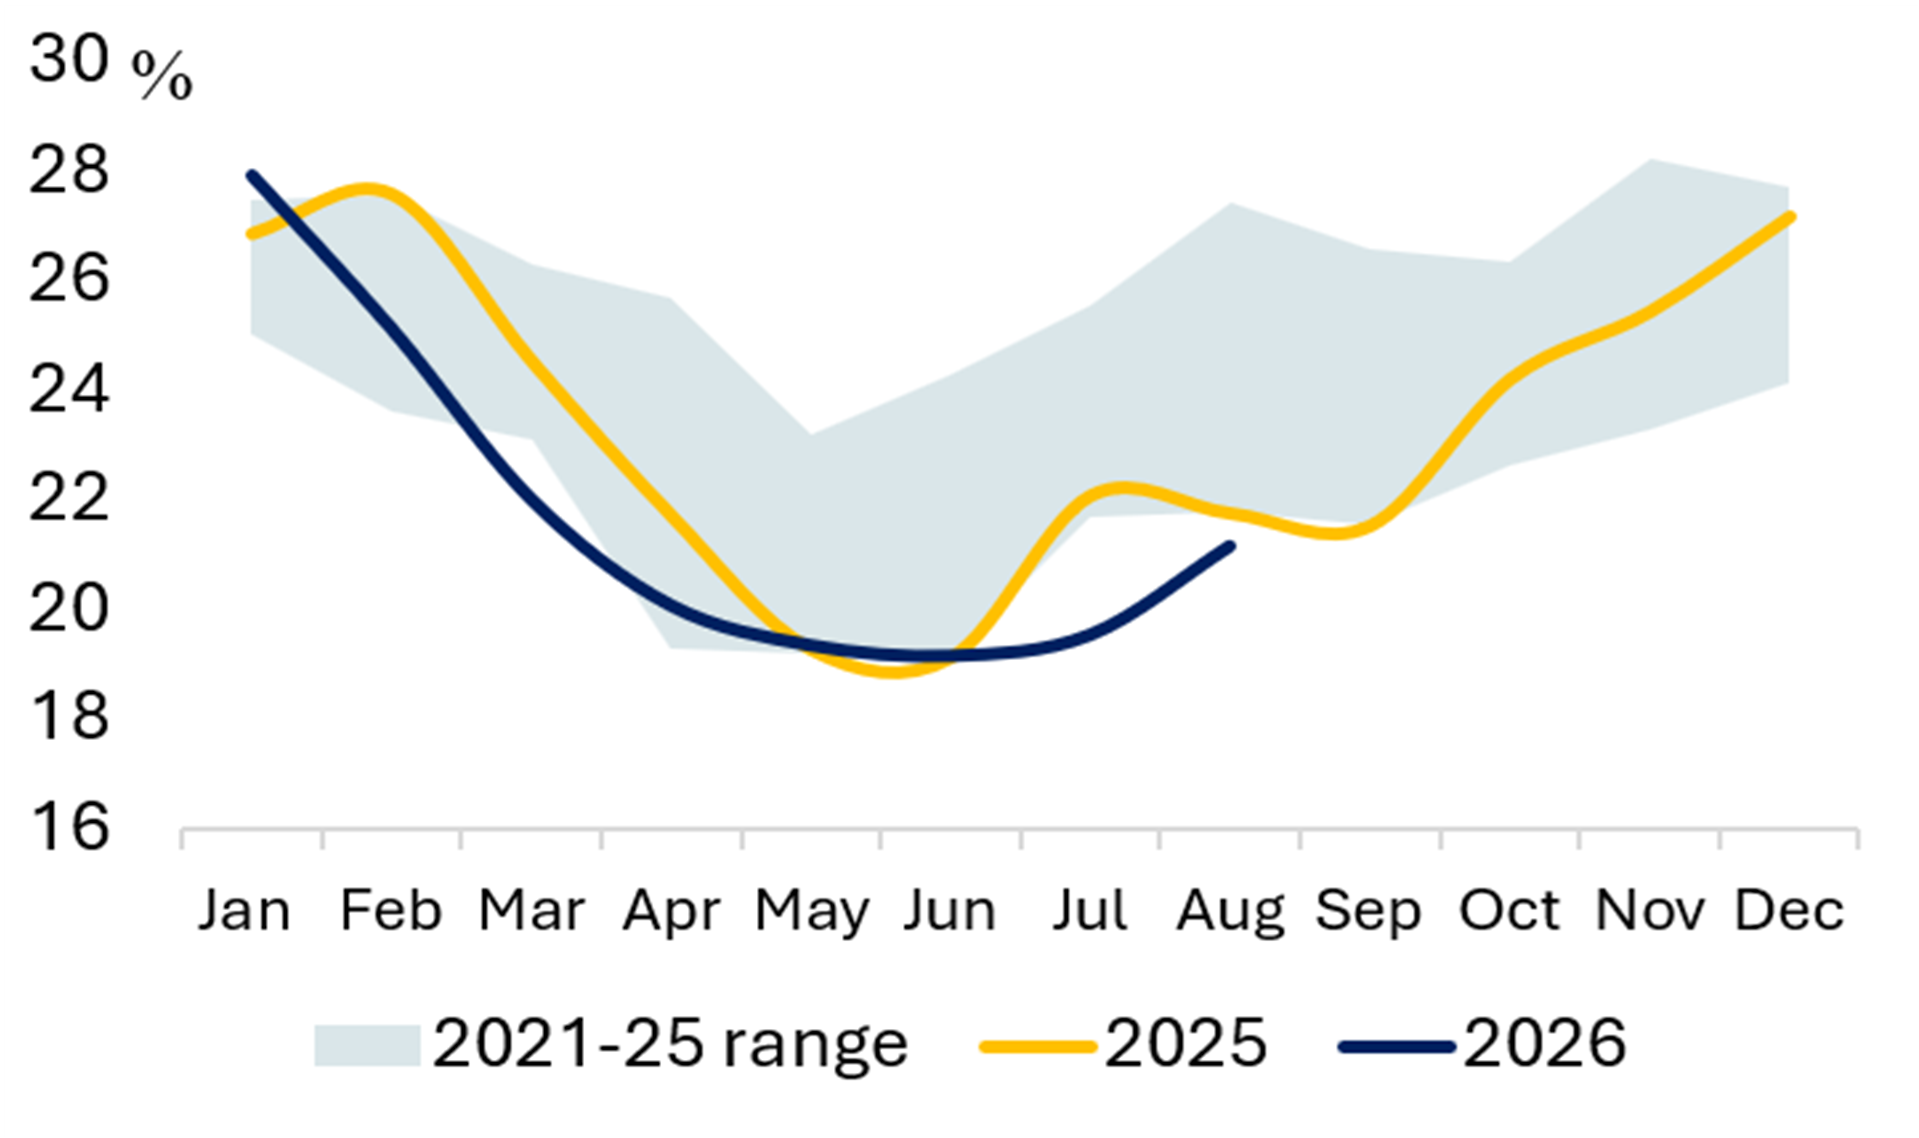
Exhibit 23 Share of Gas (%) Exhibit 24 Share of Nuclear (%) 

Source: Ember
USA
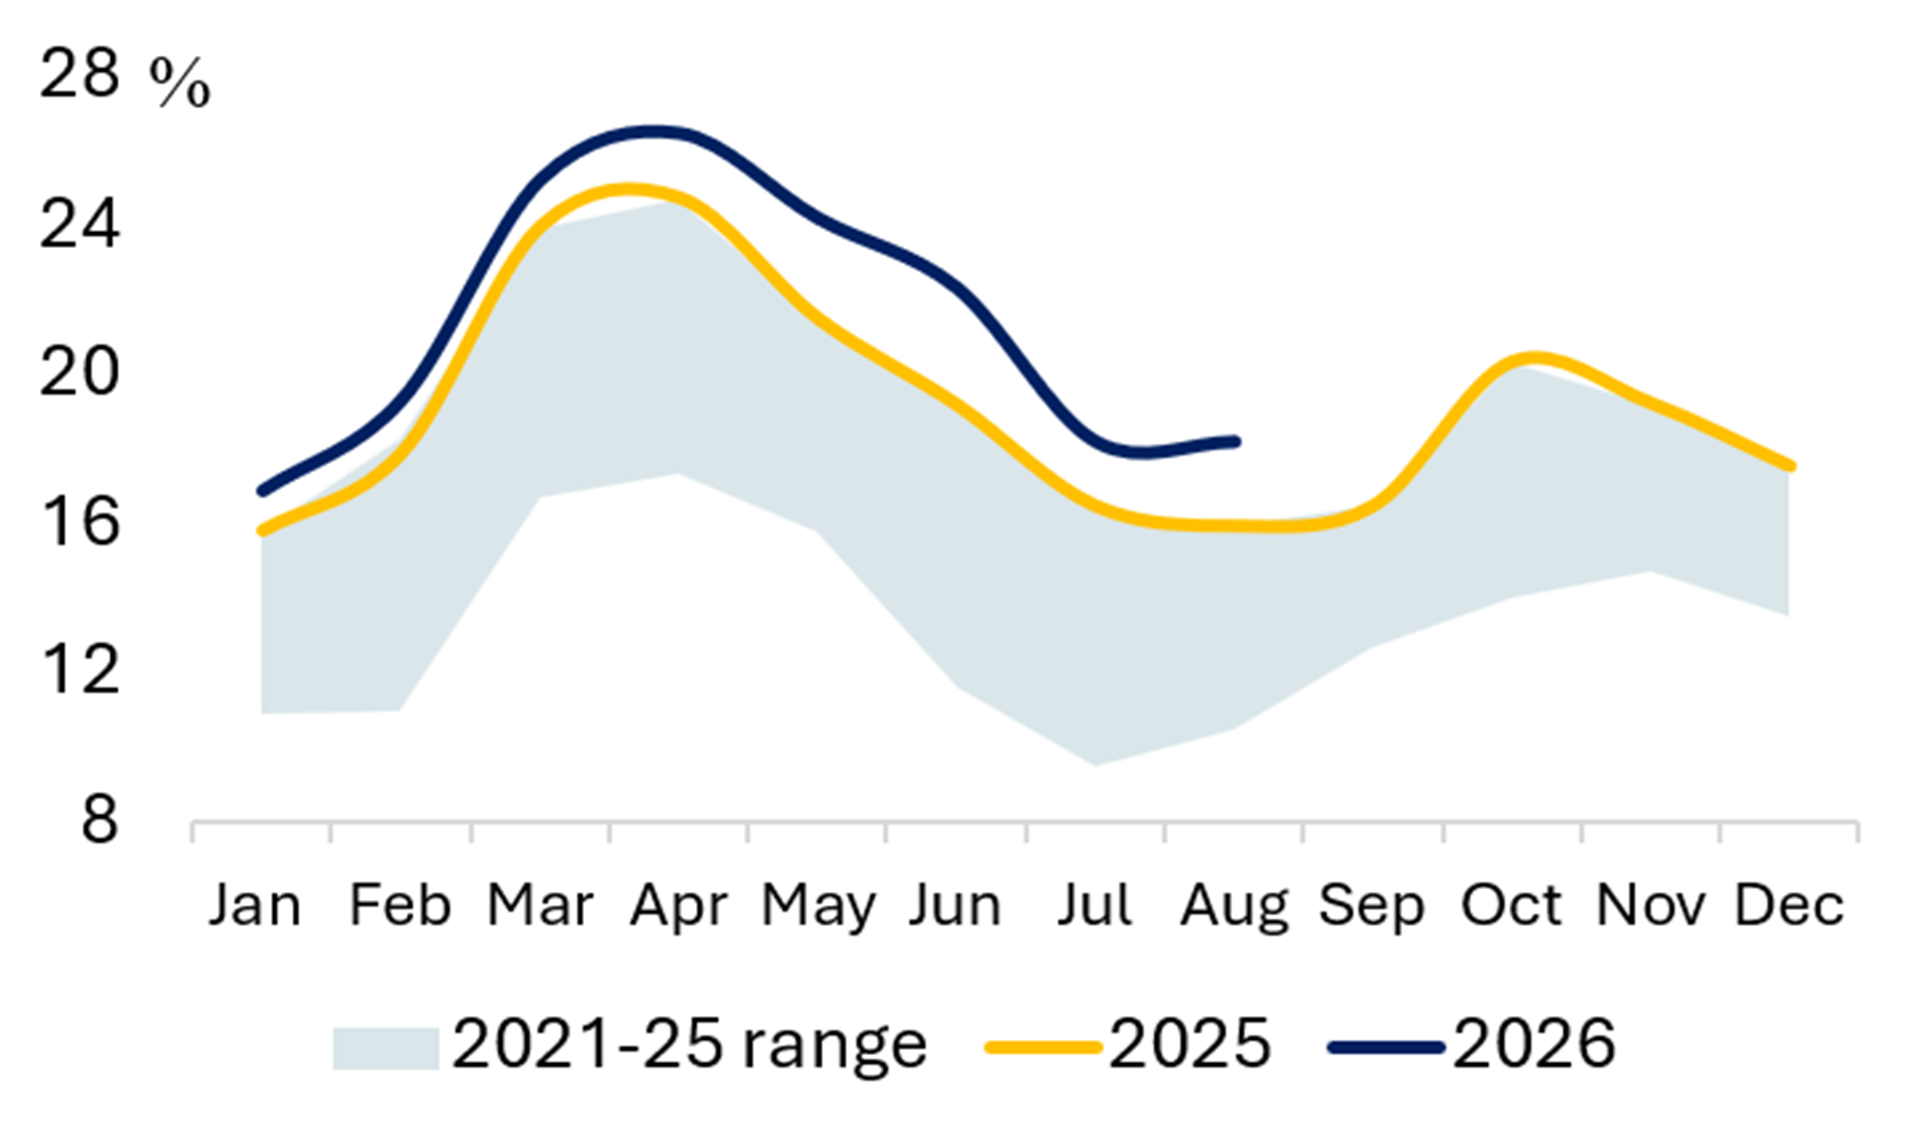
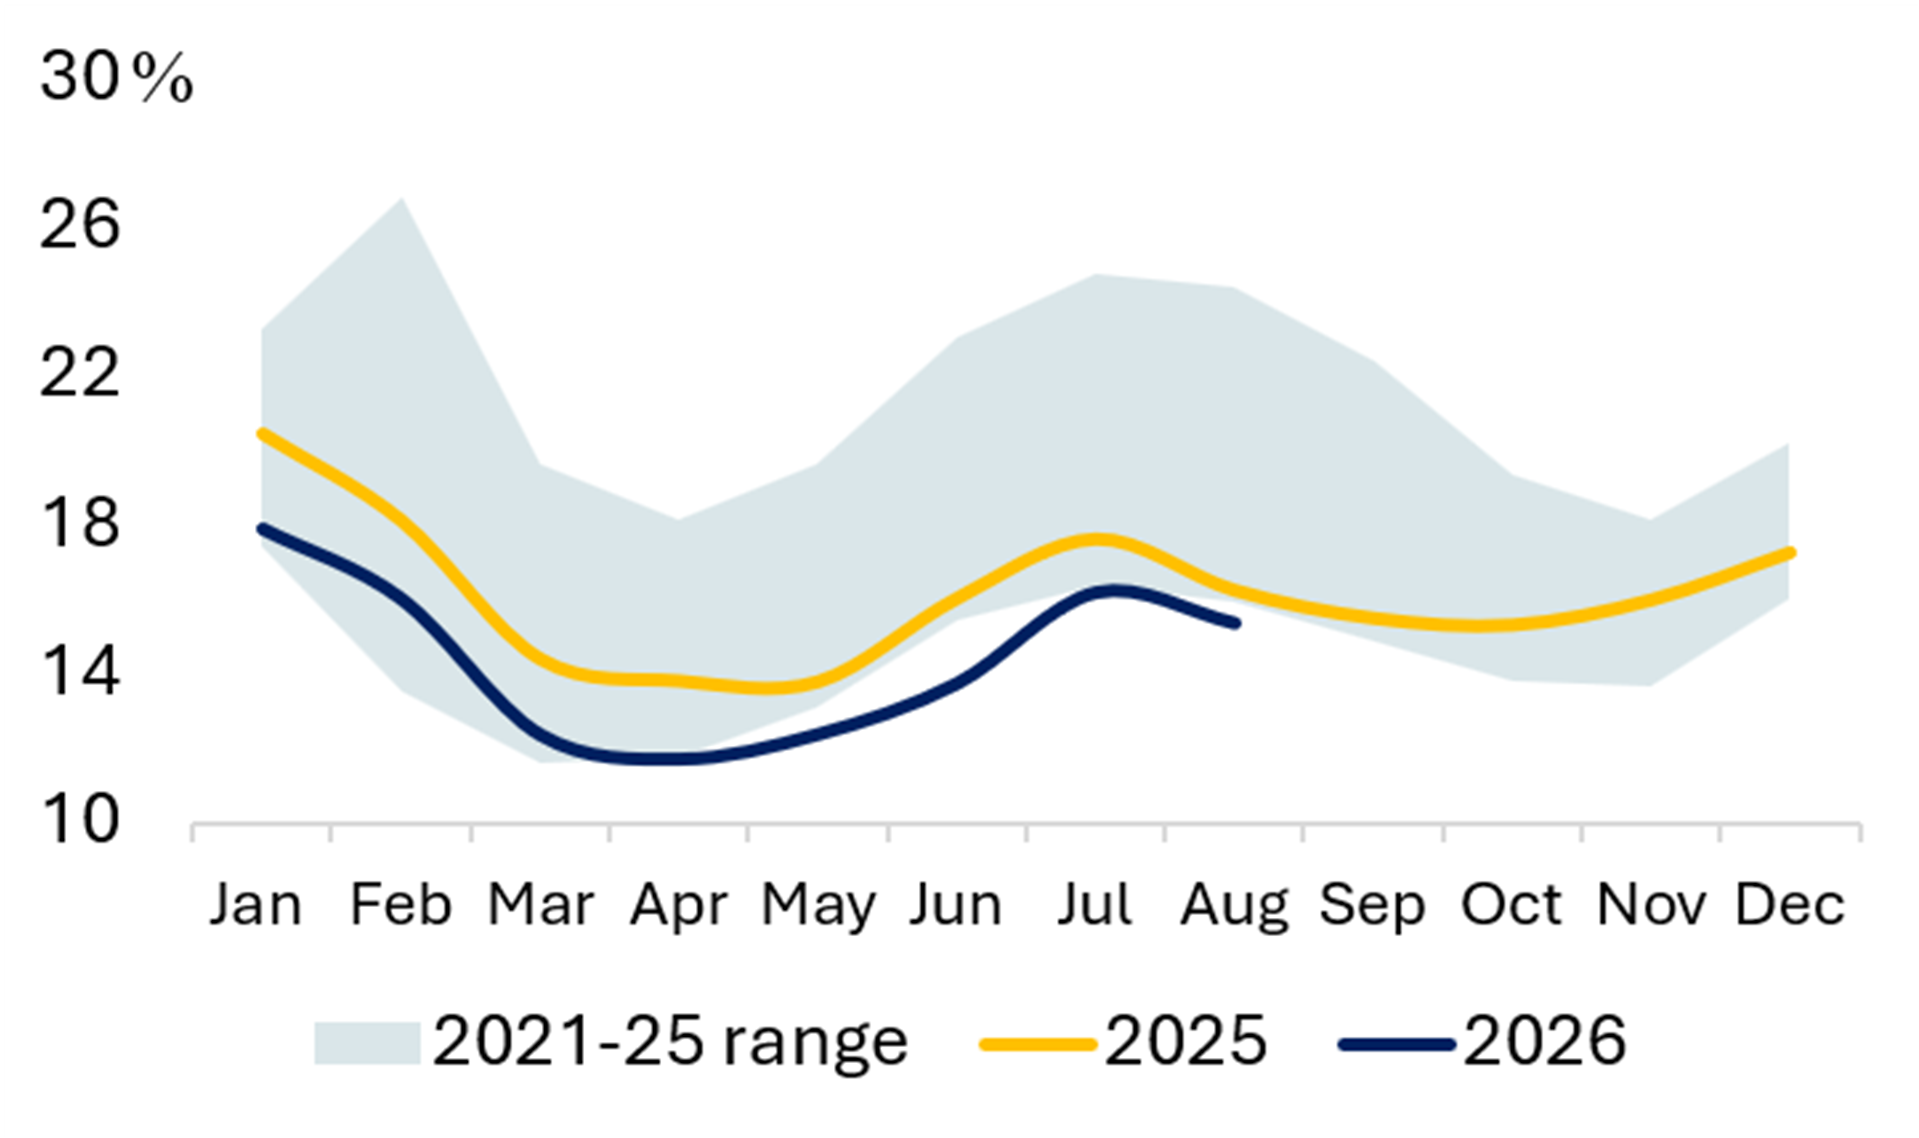
Exhibit 25 North America: Biggest Sources of Power in every State & Province

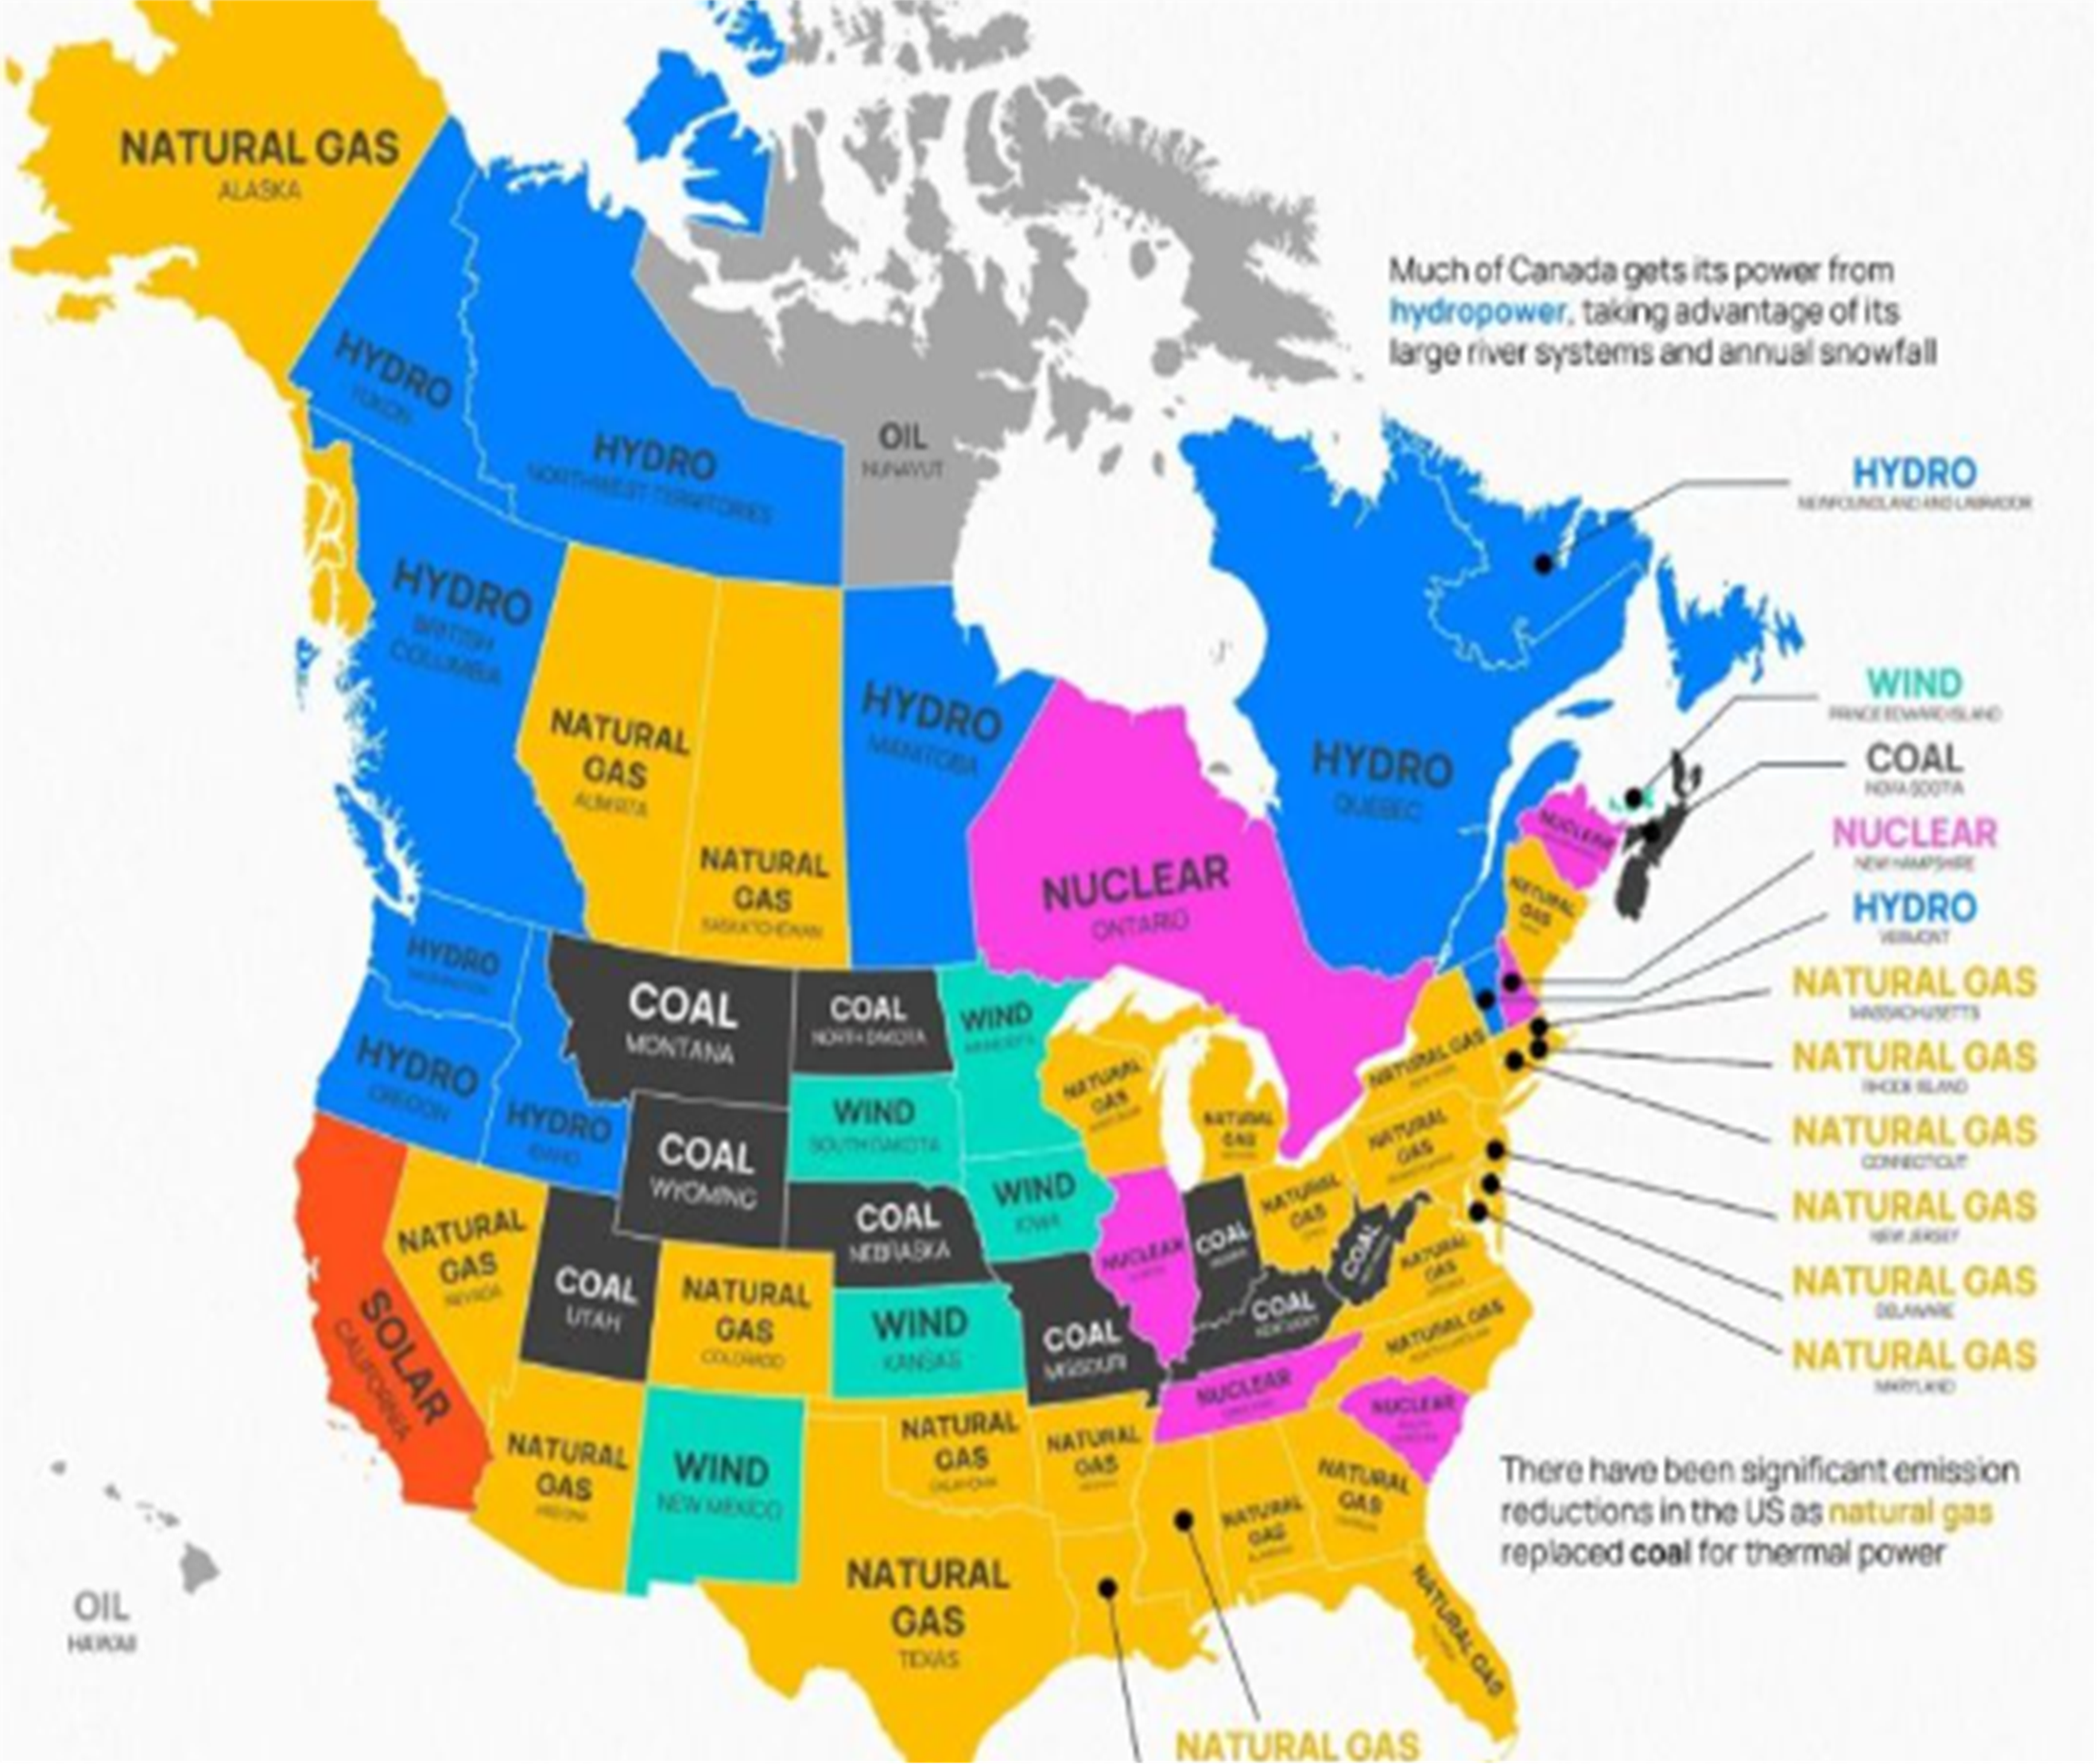
Exhibit 26 Power Generation Exhibit 27 Share of Gas (%) 

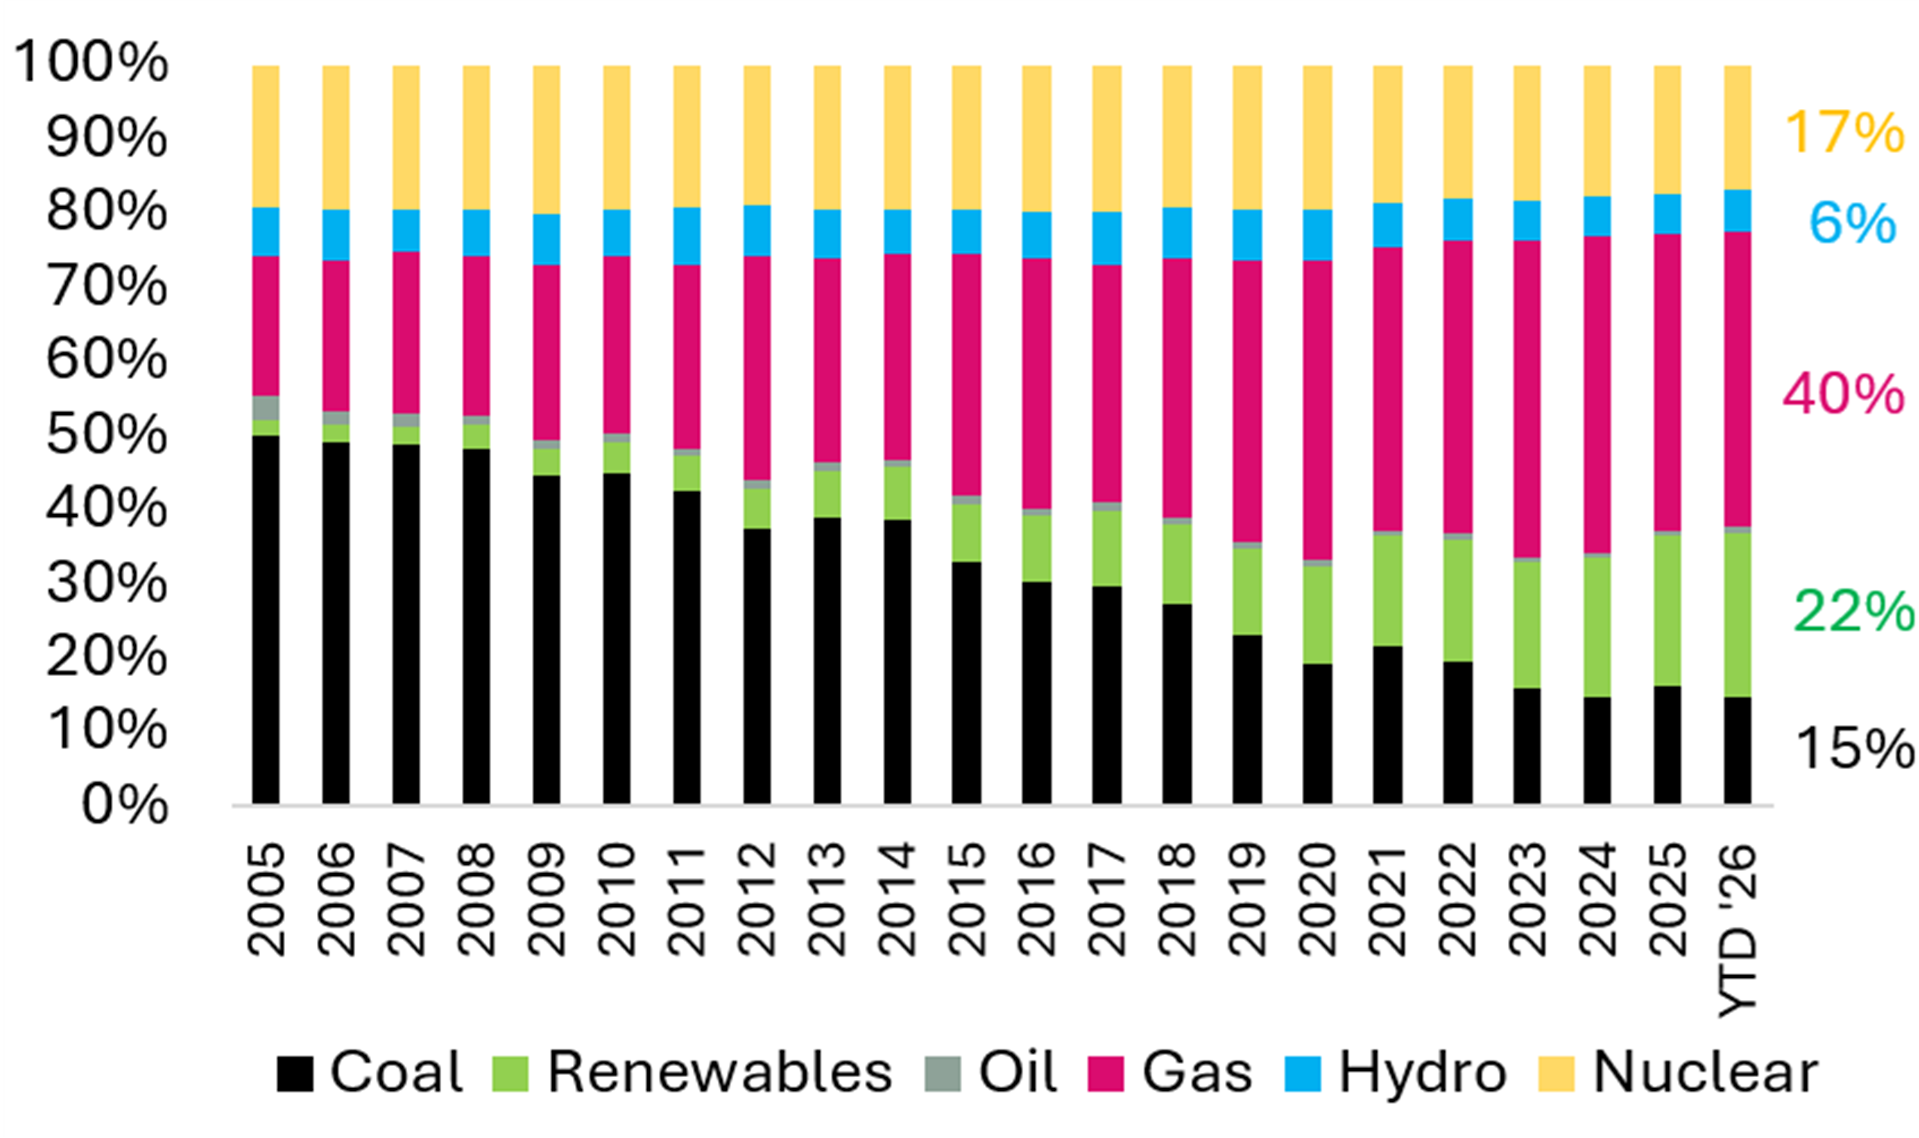
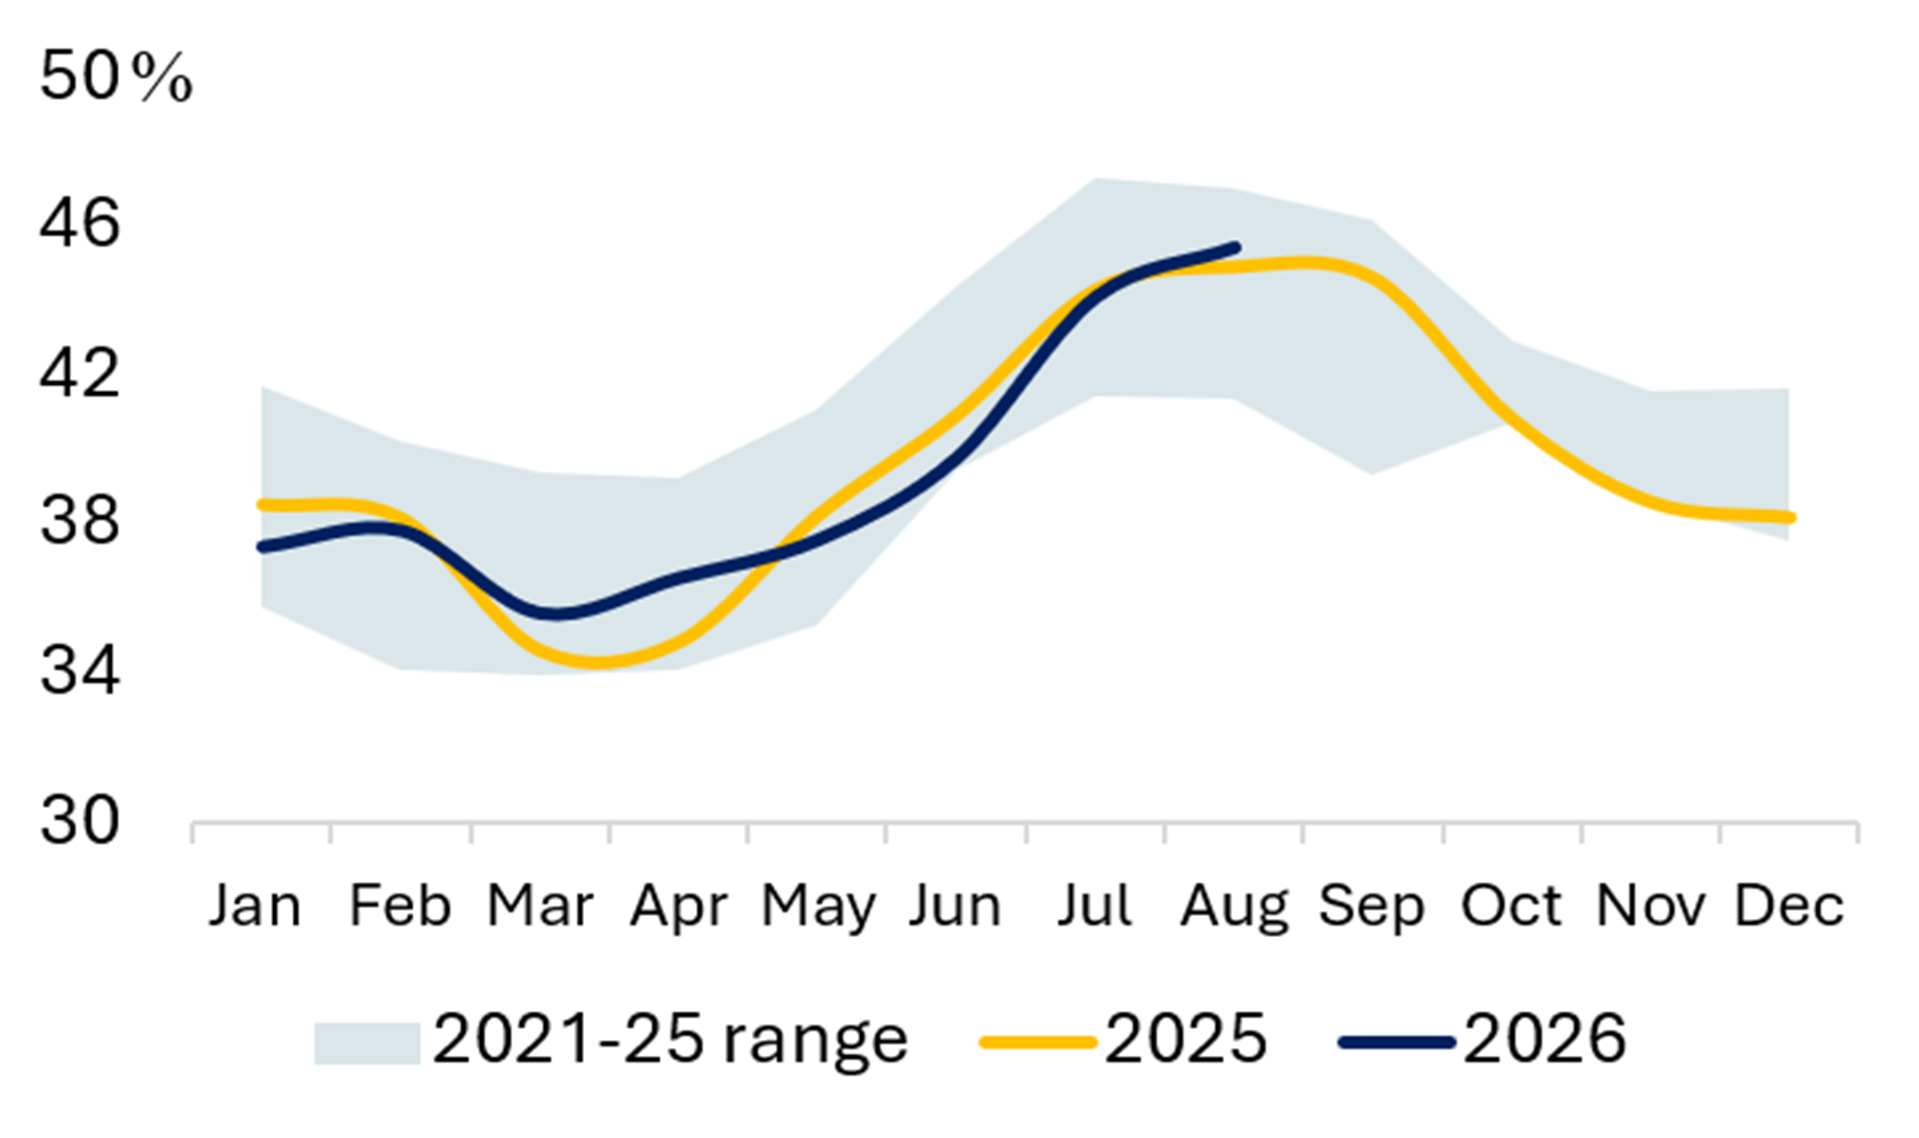
Exhibit 28 Share of Wind & Solar (%) Exhibit 29 Share of Coal (%) 

Source: Ember
TÜRKIYE
Exhibit 30 Power Generation Exhibit 31 Share of Coal (%) 

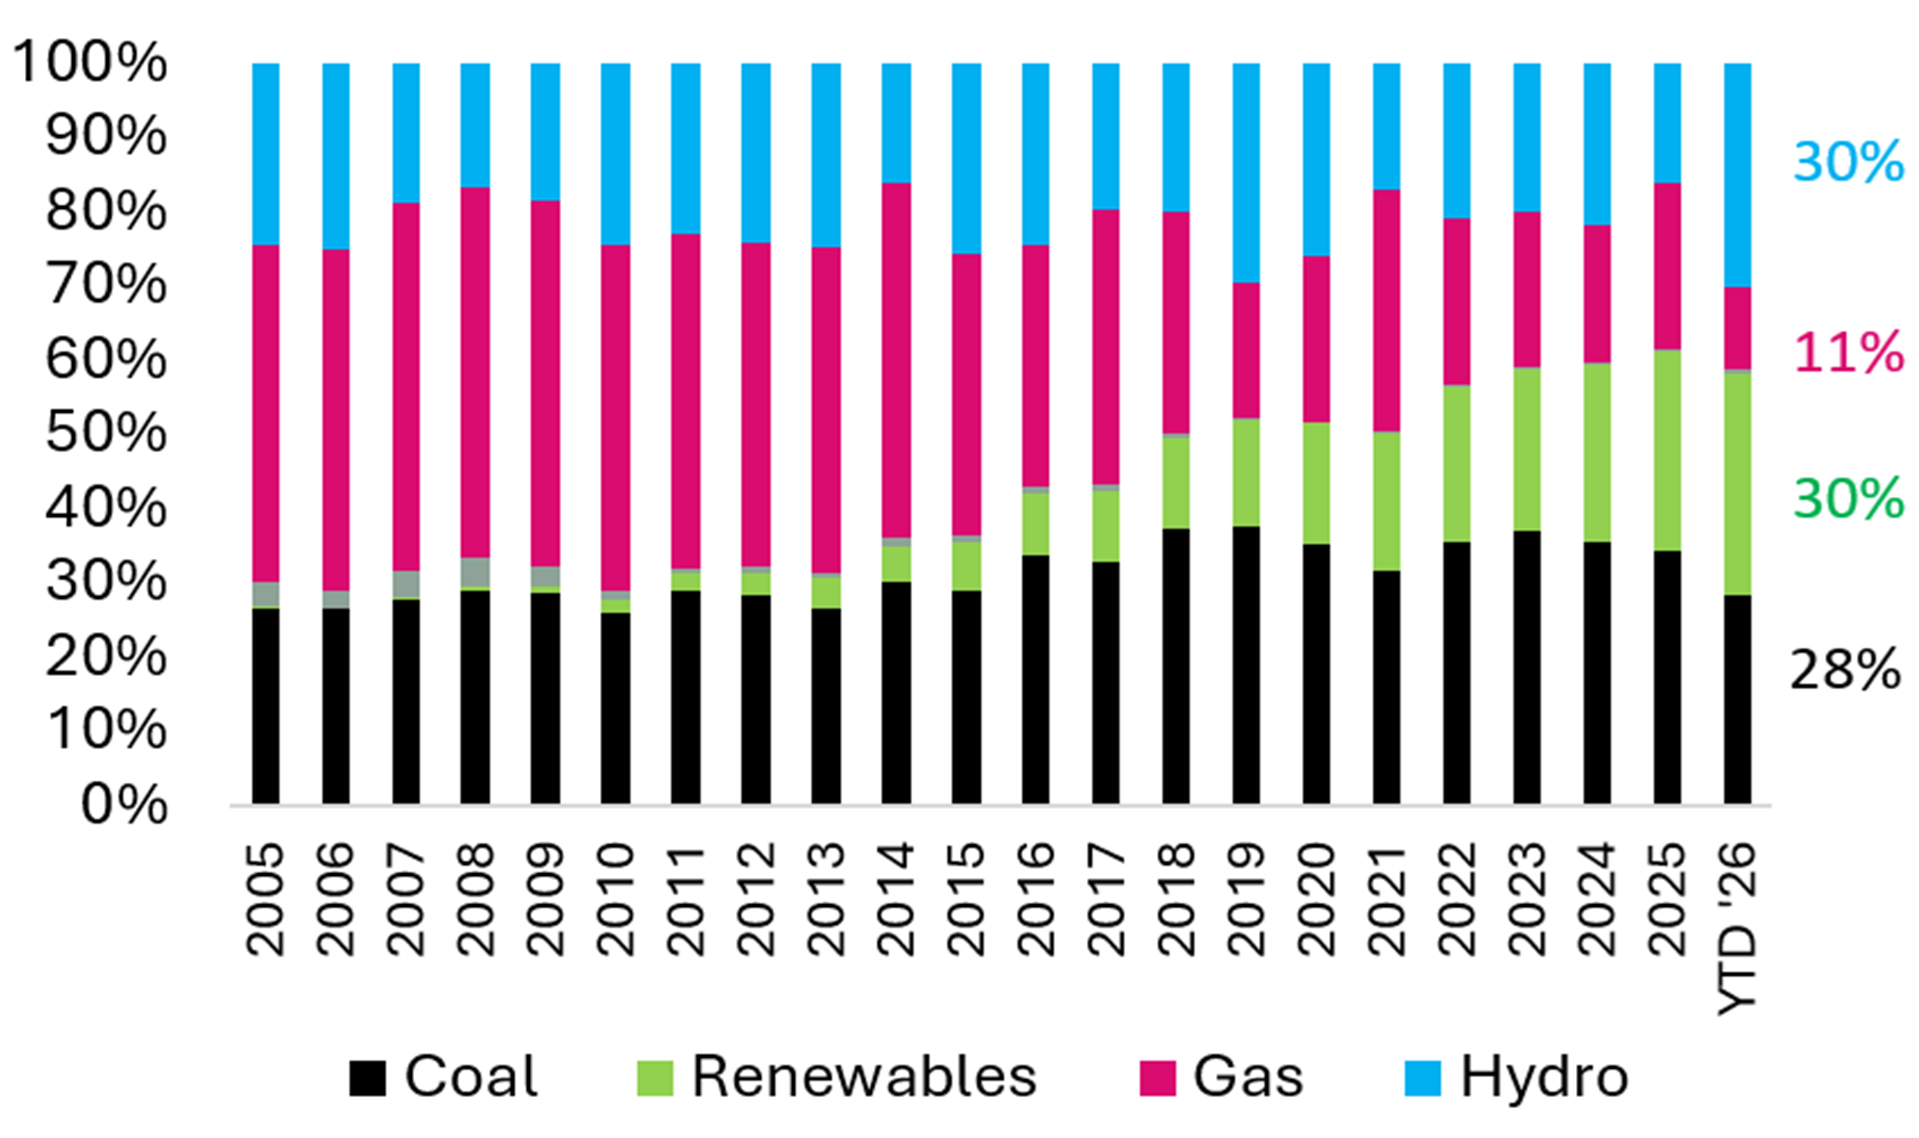
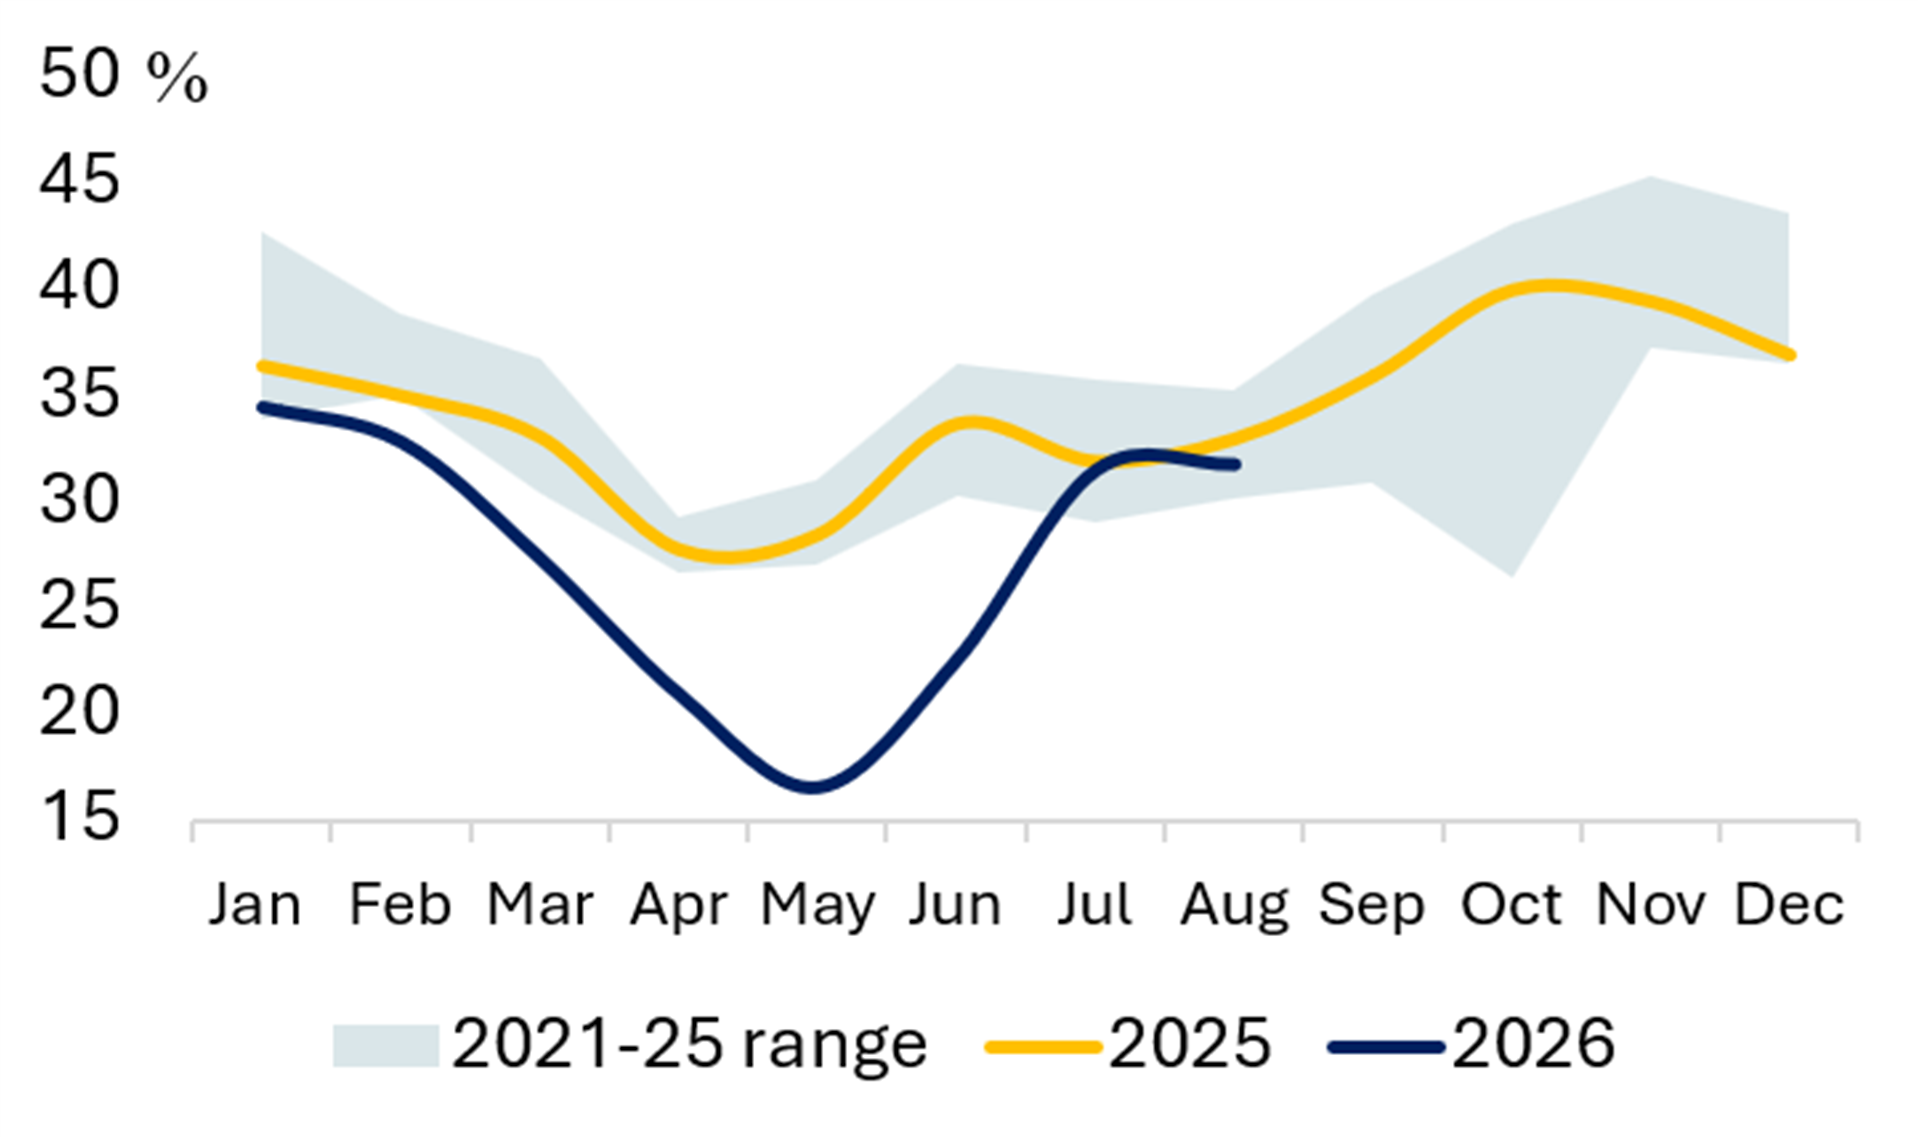
Exhibit 32 Share of Wind & Solar (%) Exhibit 33 Share of Hydro (%) 

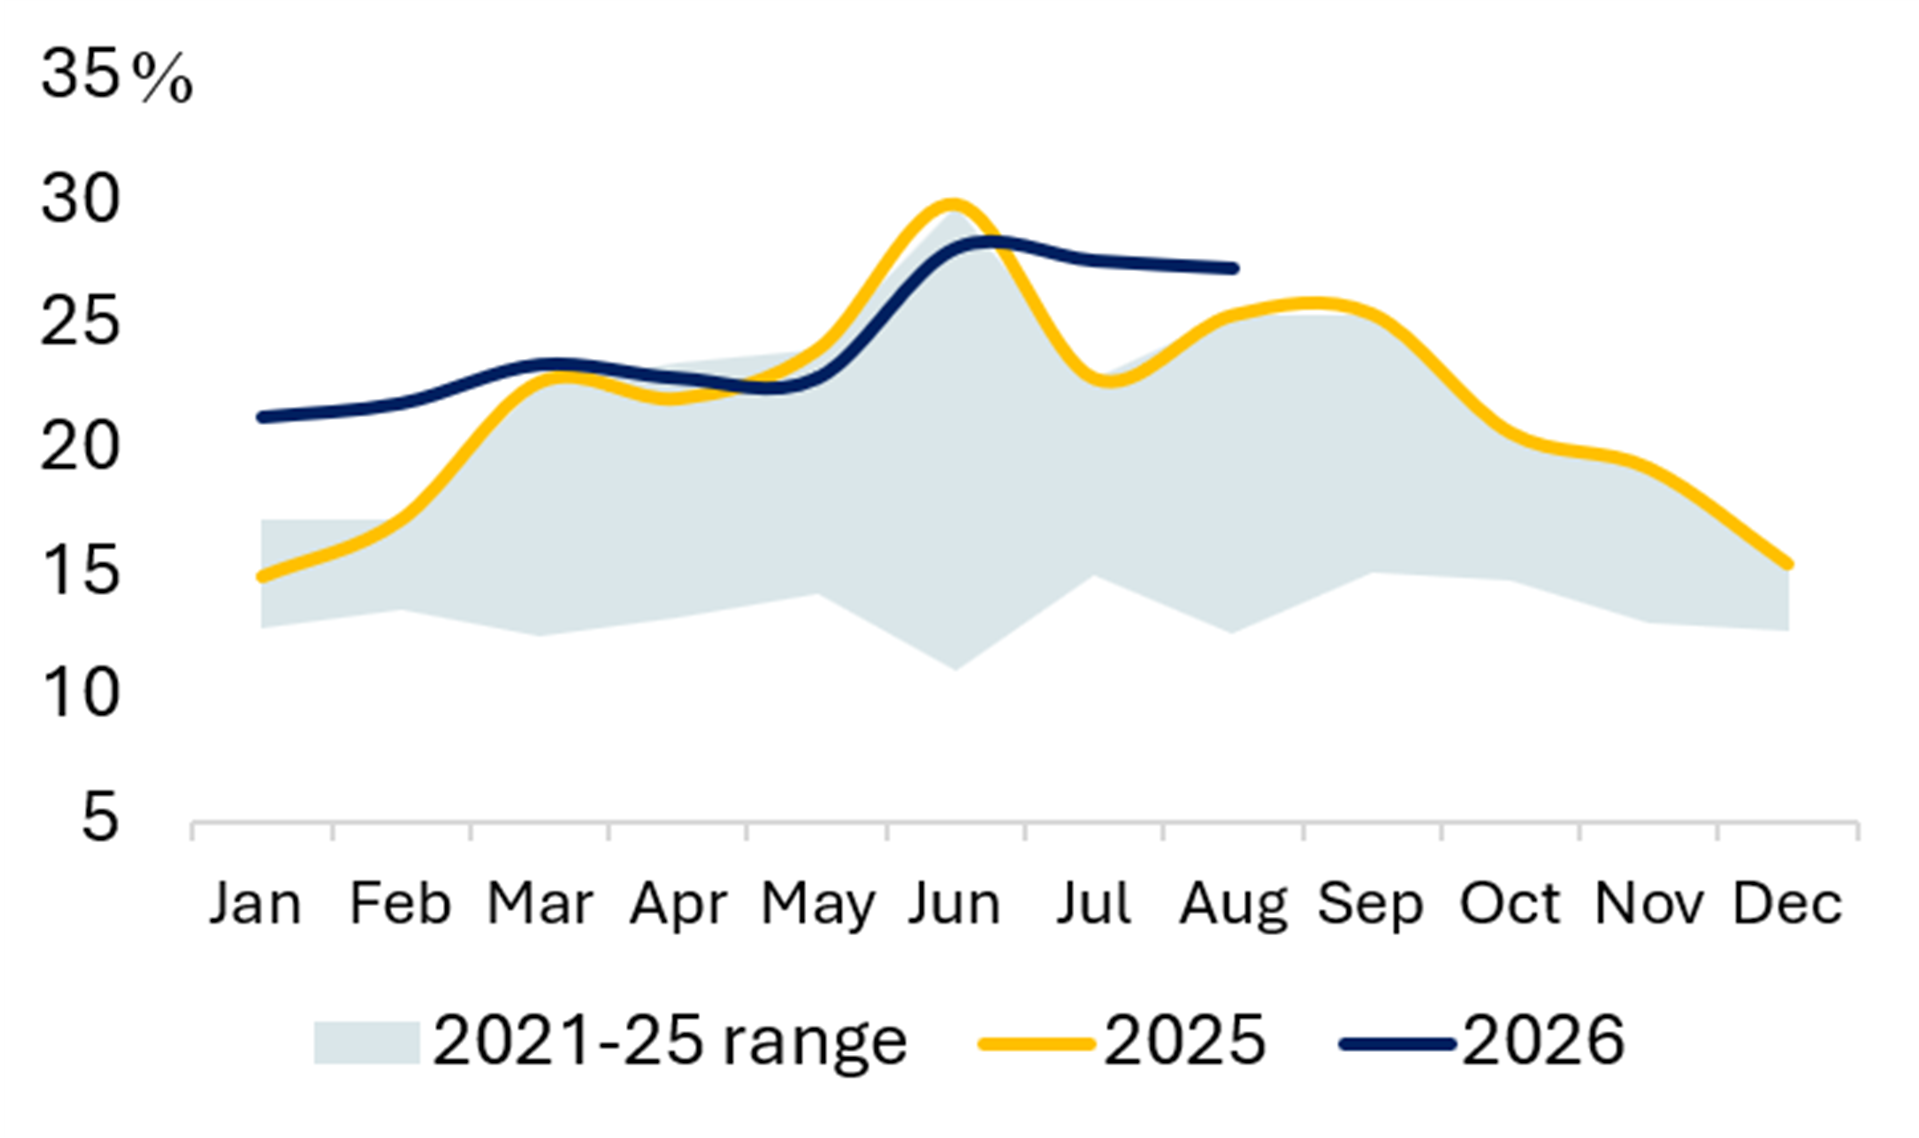
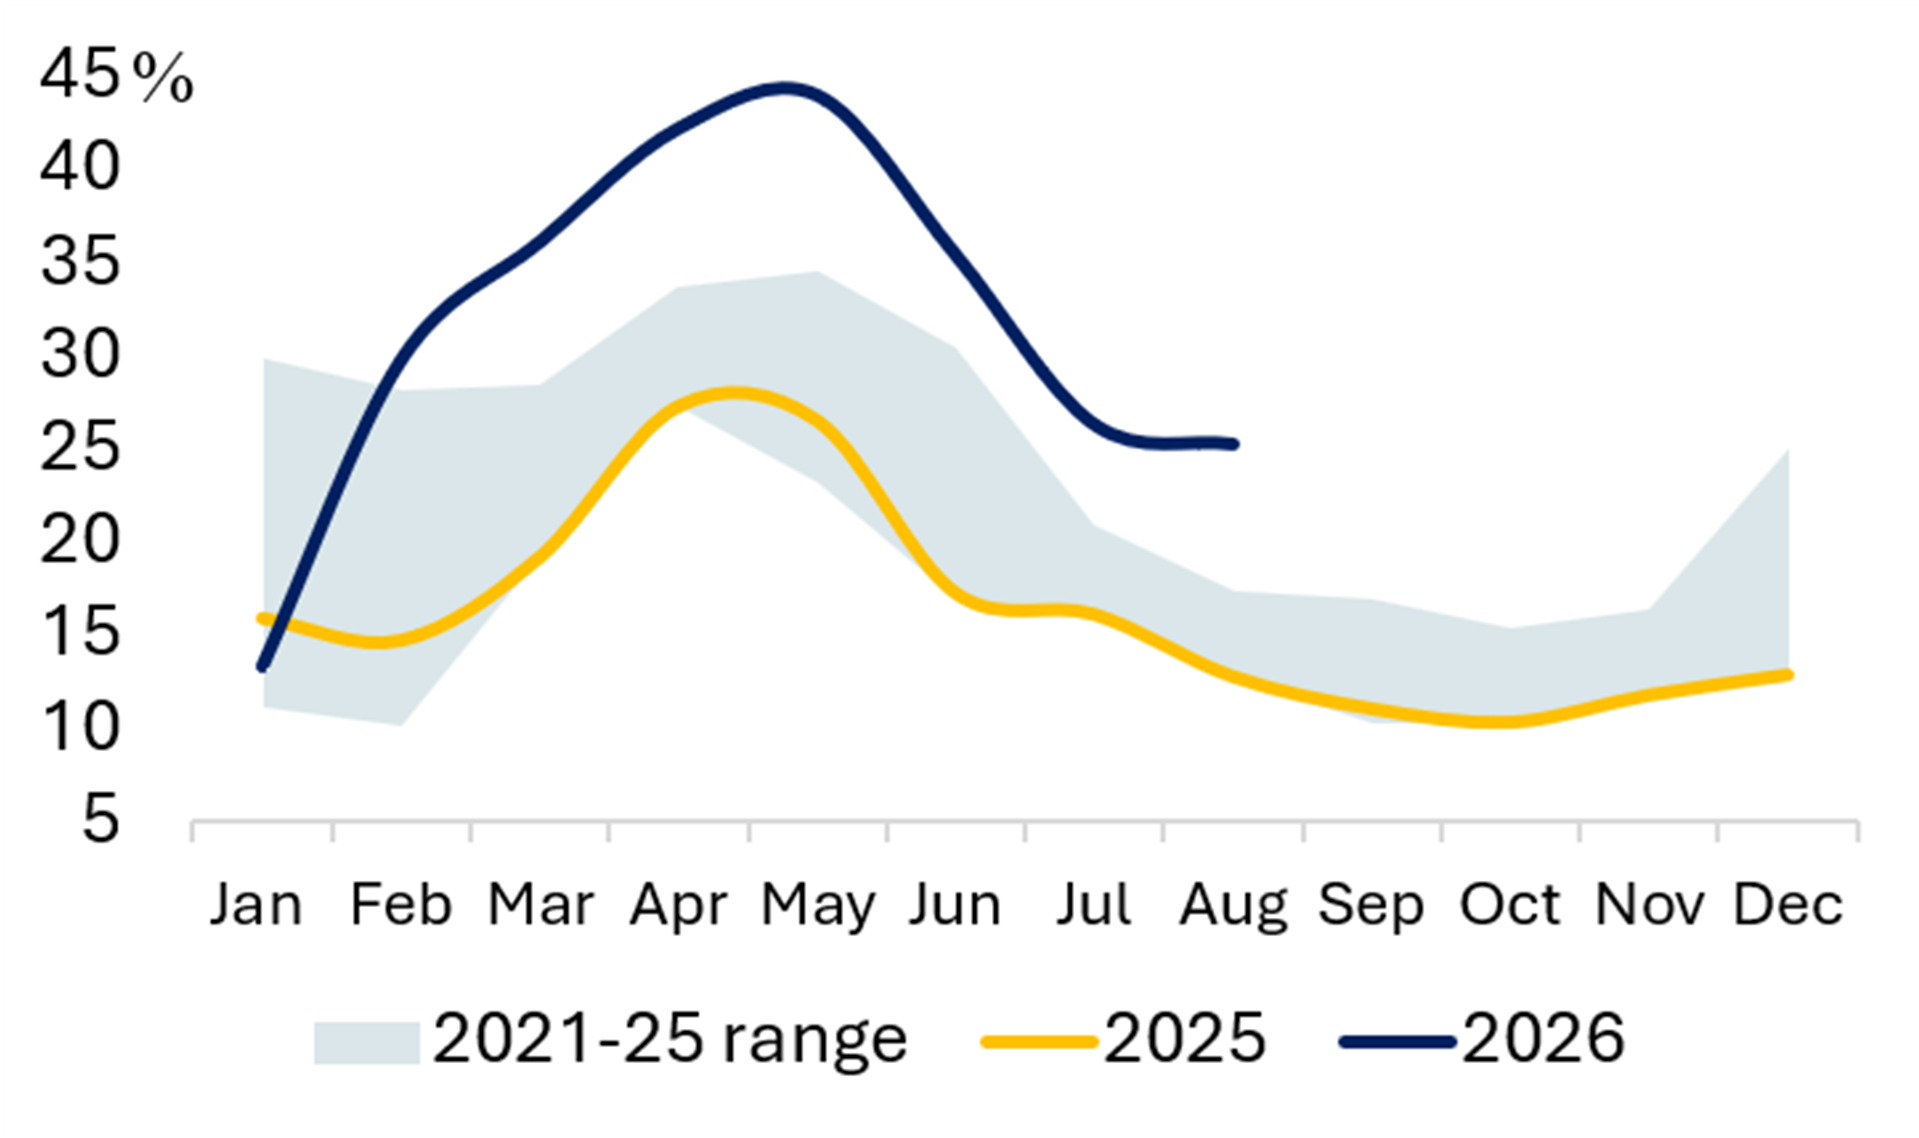
INDIA
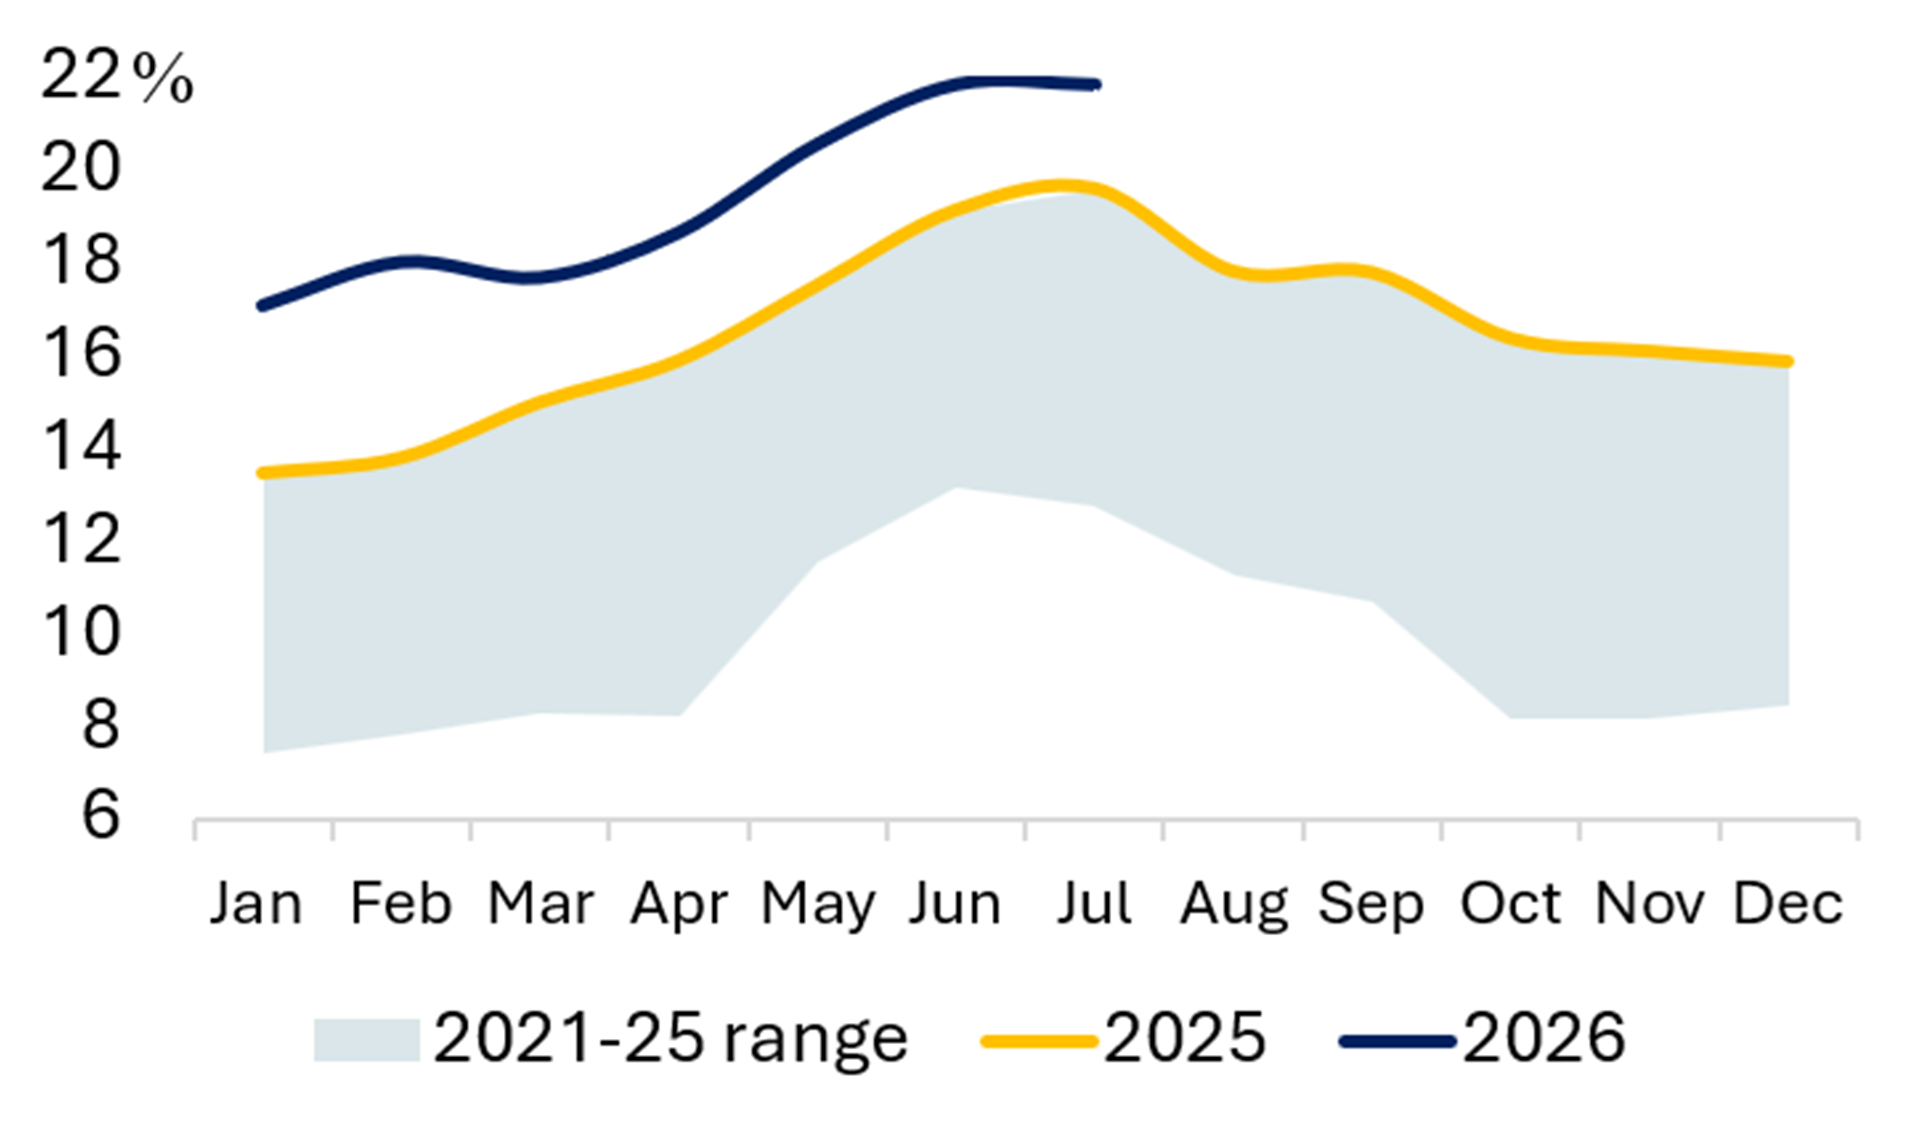
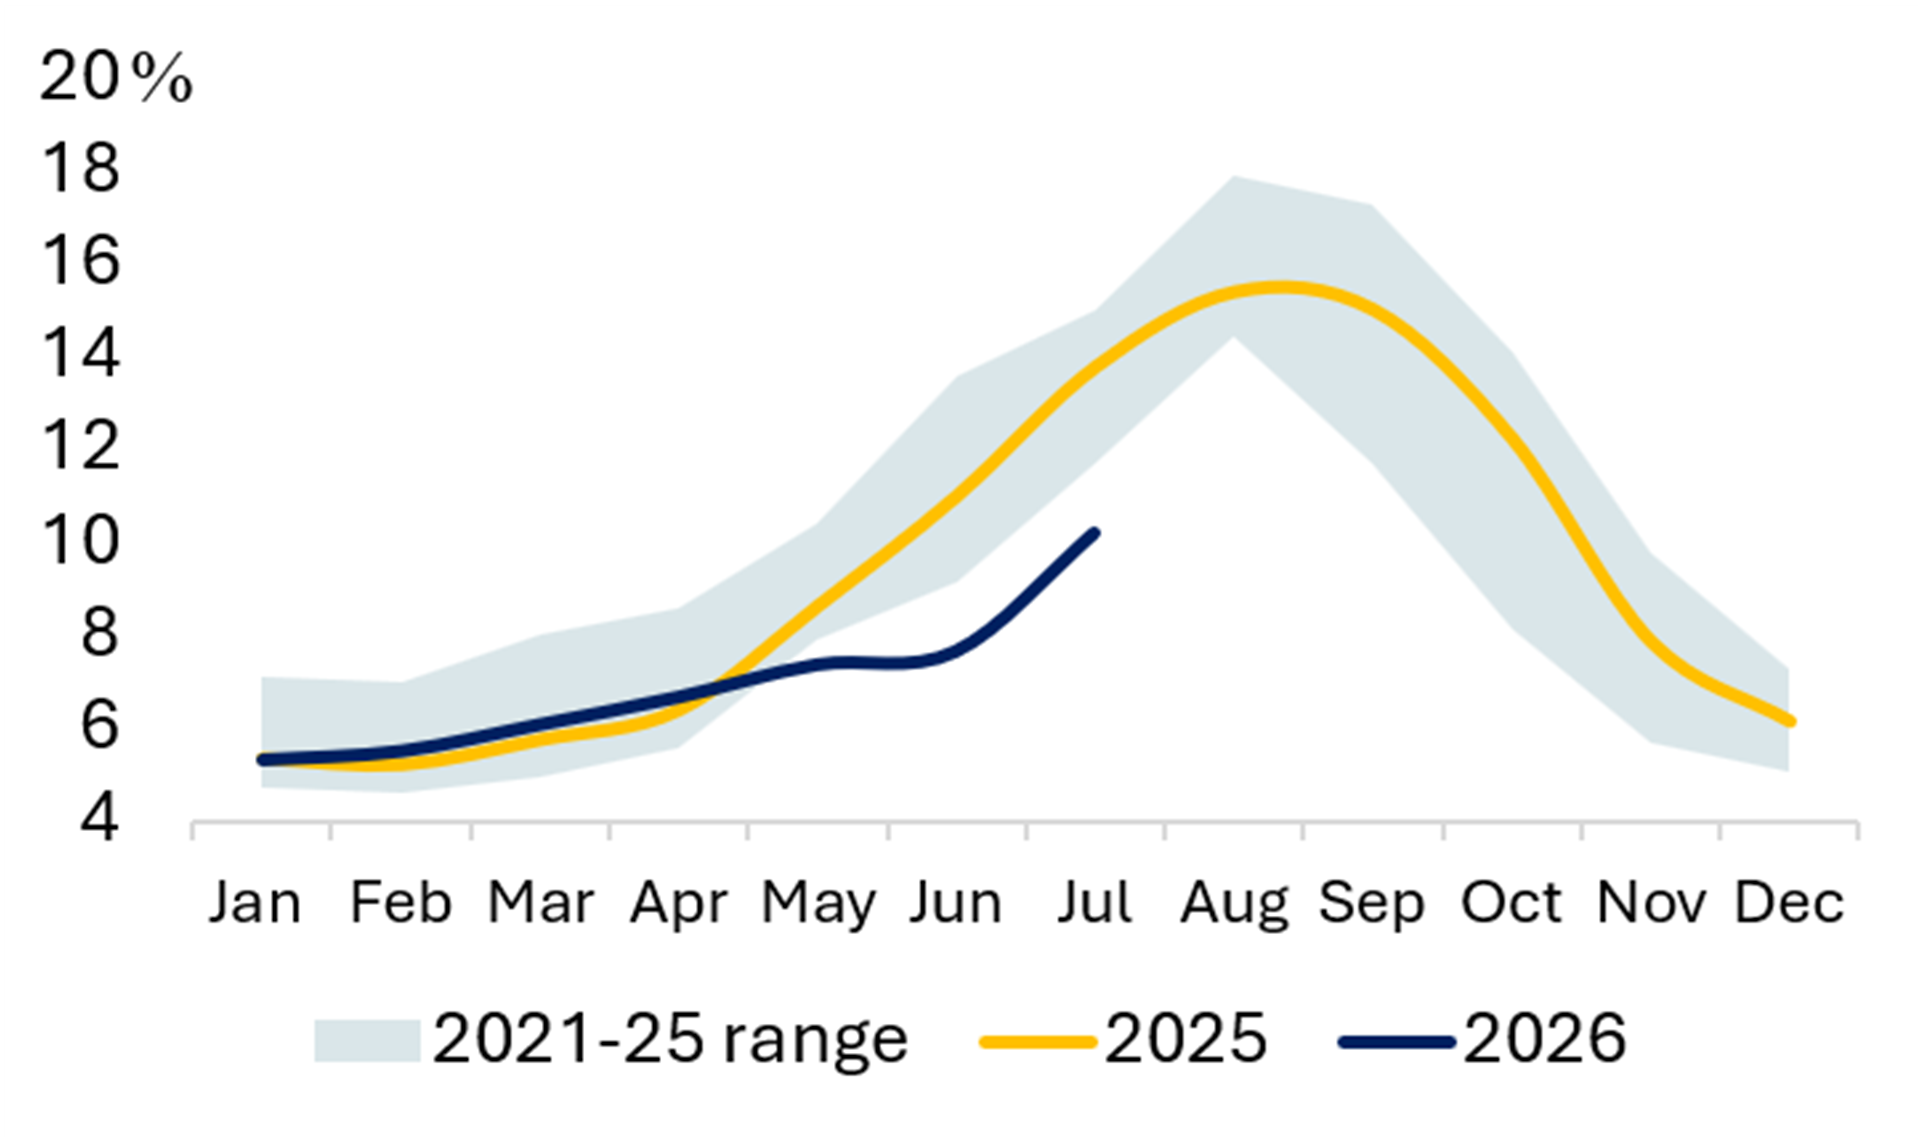
Exhibit 34 Power Generation Exhibit 35 Share of Coal (%) 

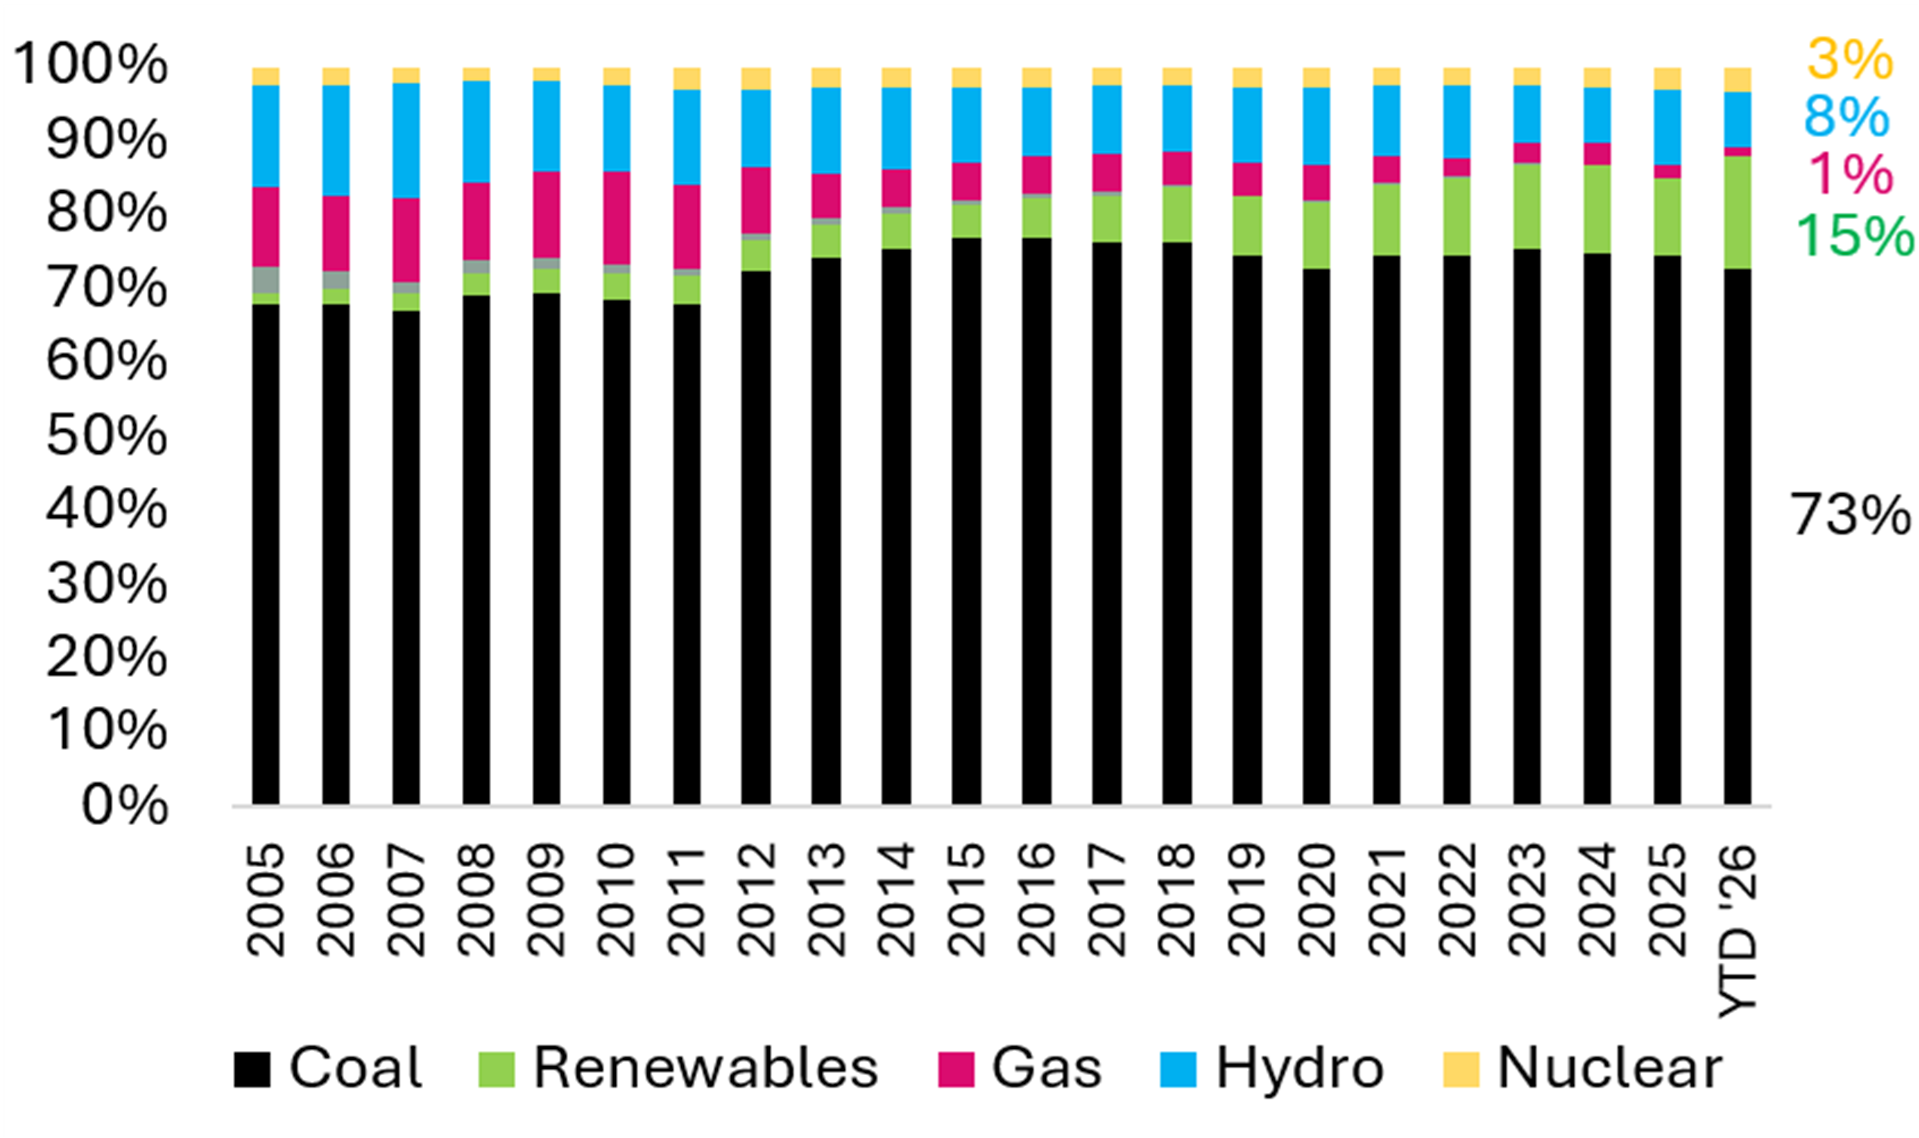
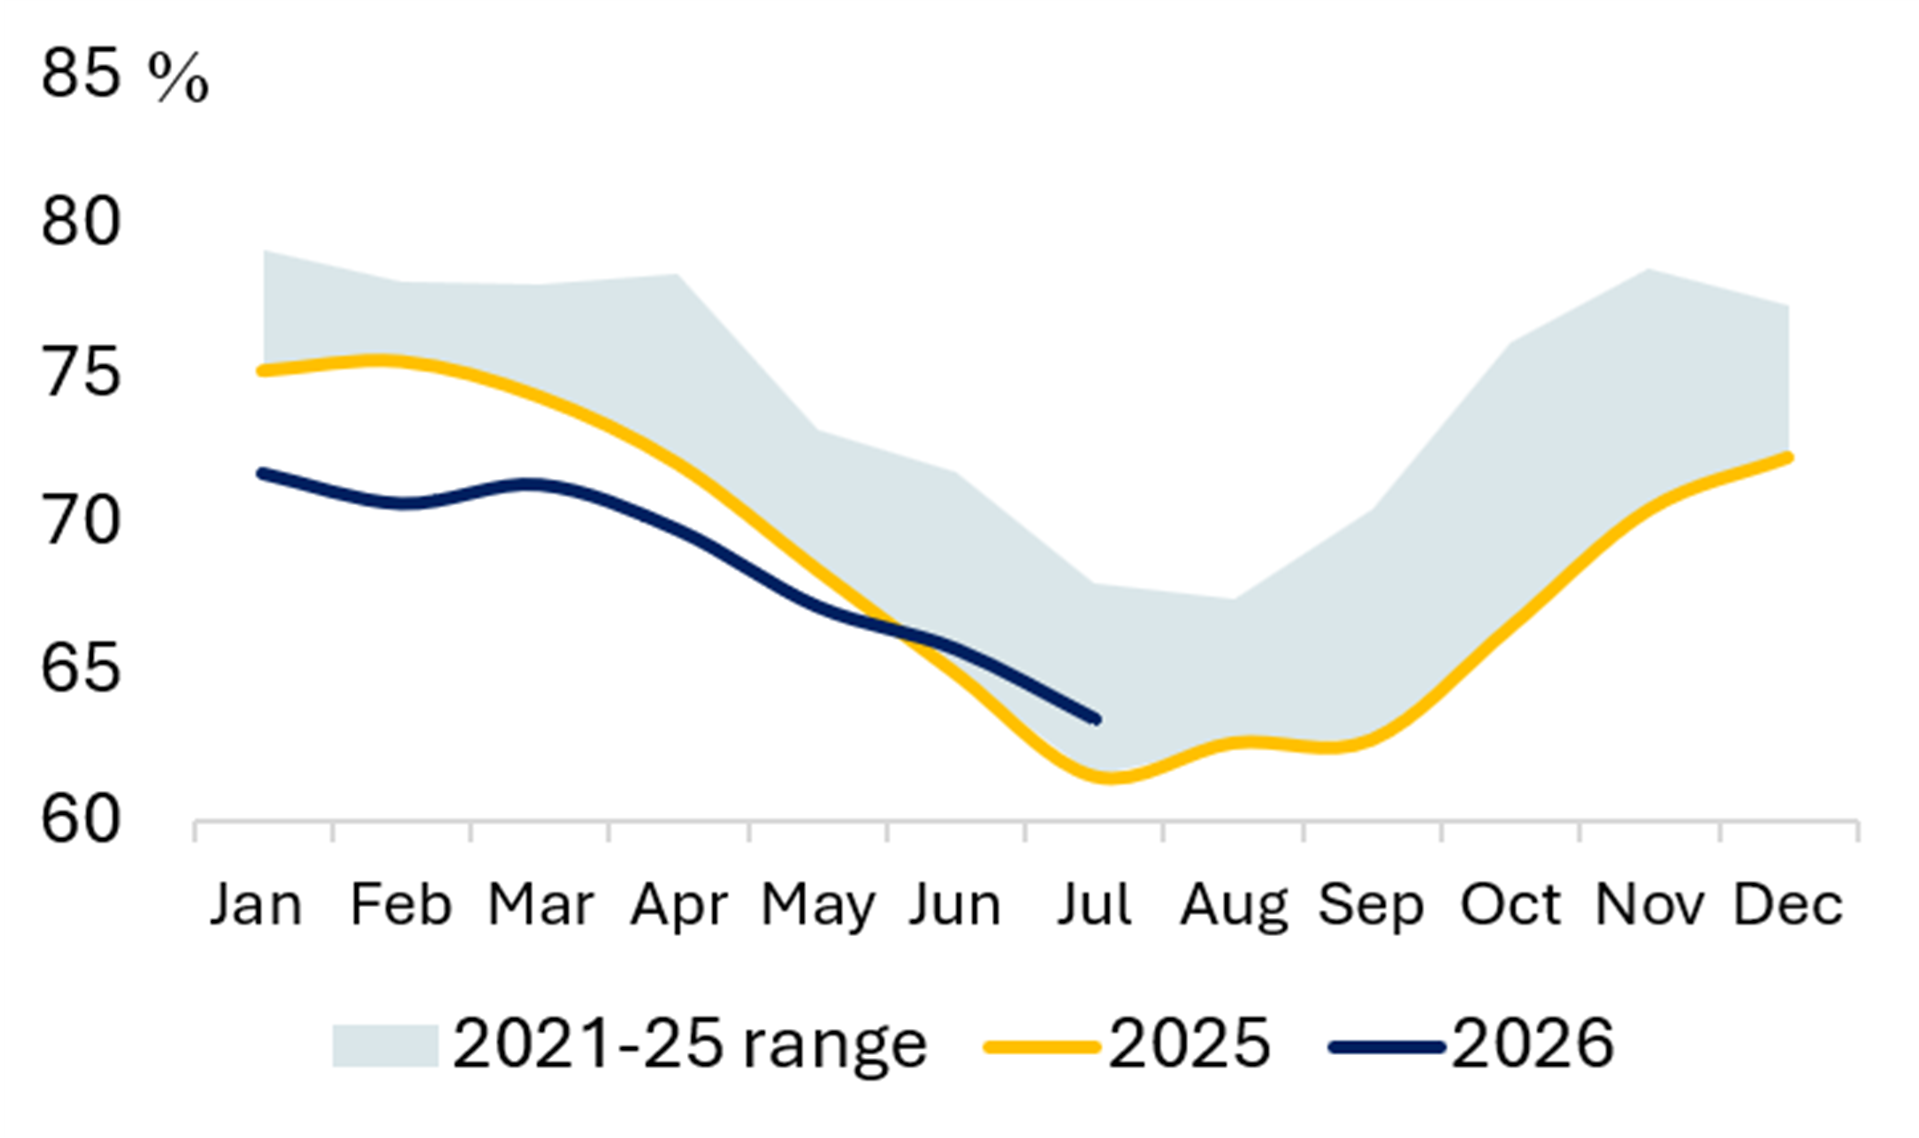
Exhibit 36 Share of Wind & Solar (%) Exhibit 37 Share of Hydro (%) 

Source: Ember
CHINA
Exhibit 38 Power Generation Exhibit 39 Share of Coal (%) 

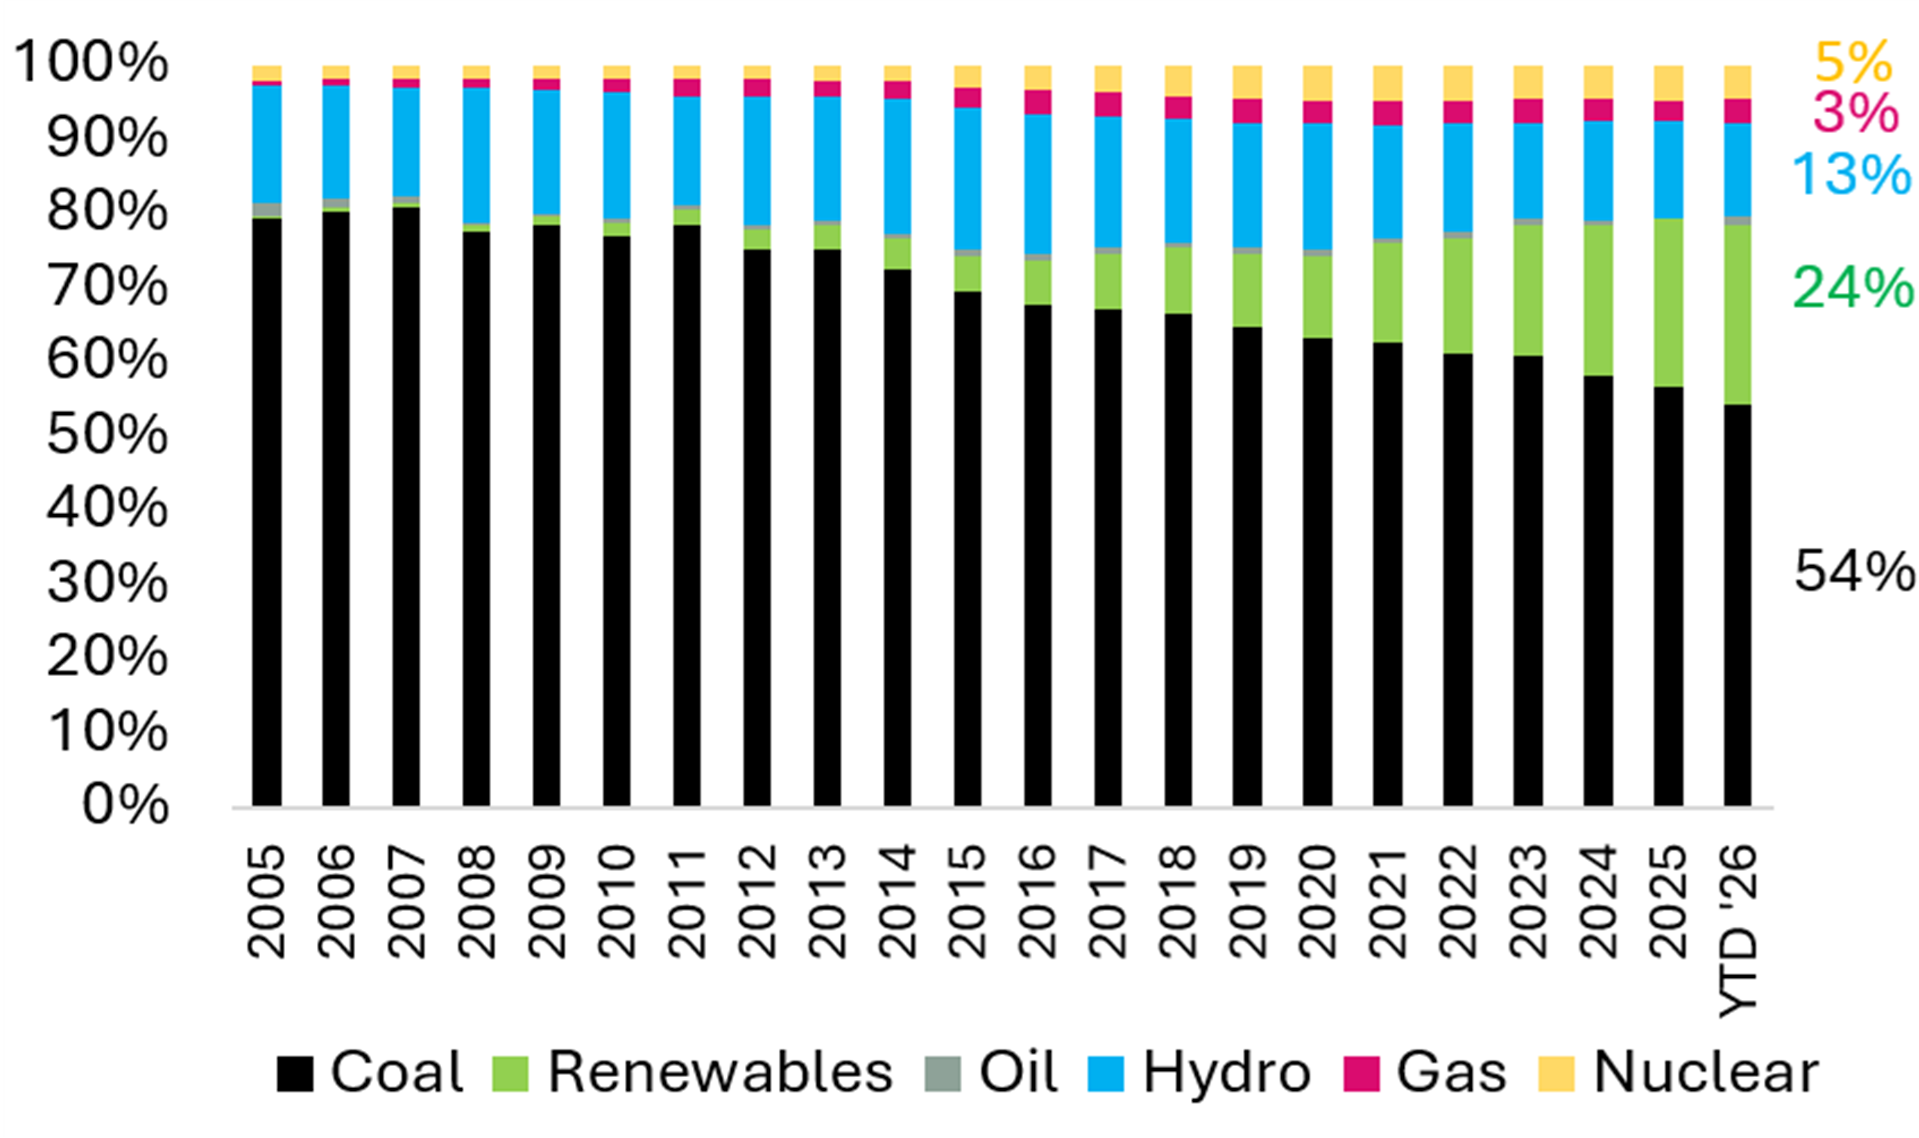
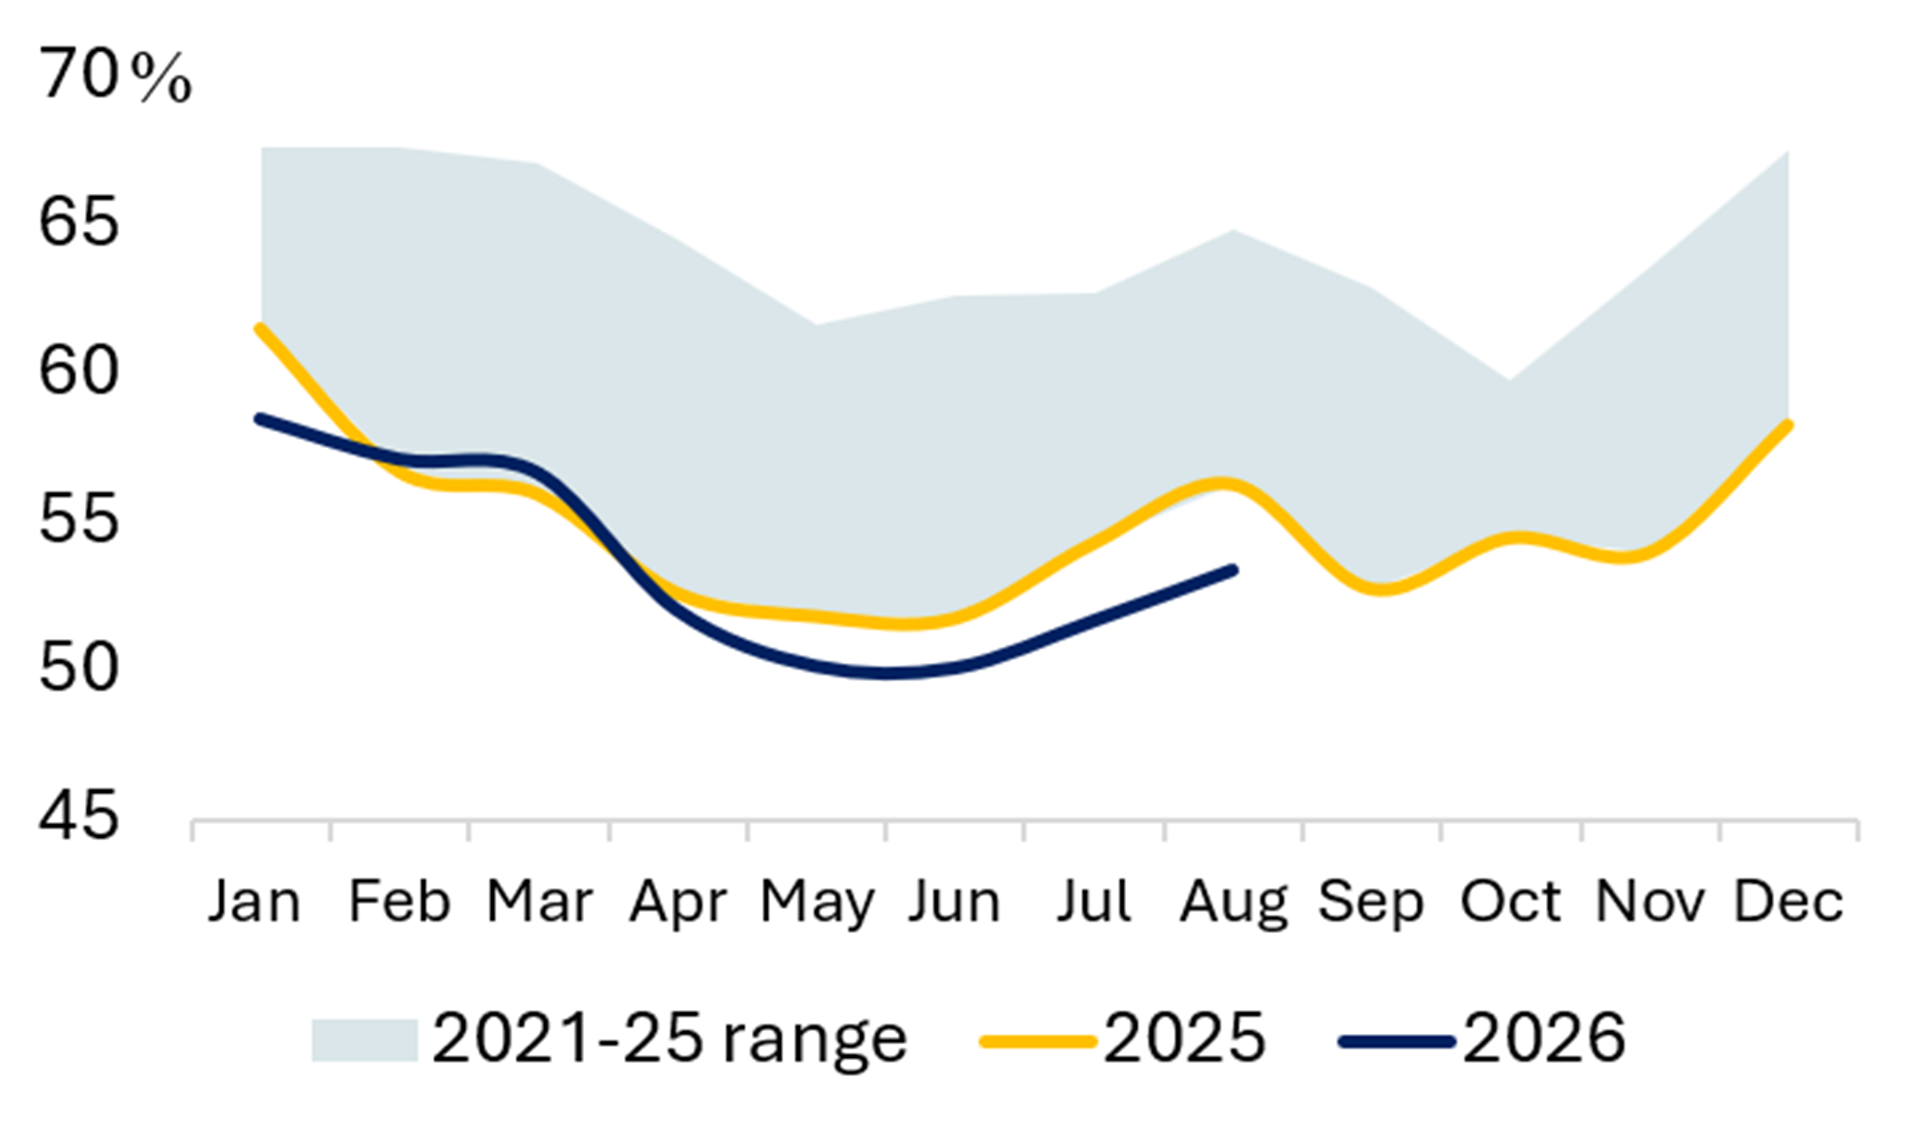
Exhibit 40 Share of Wind & Solar (%) Exhibit 41 Share of Hydro (%) 

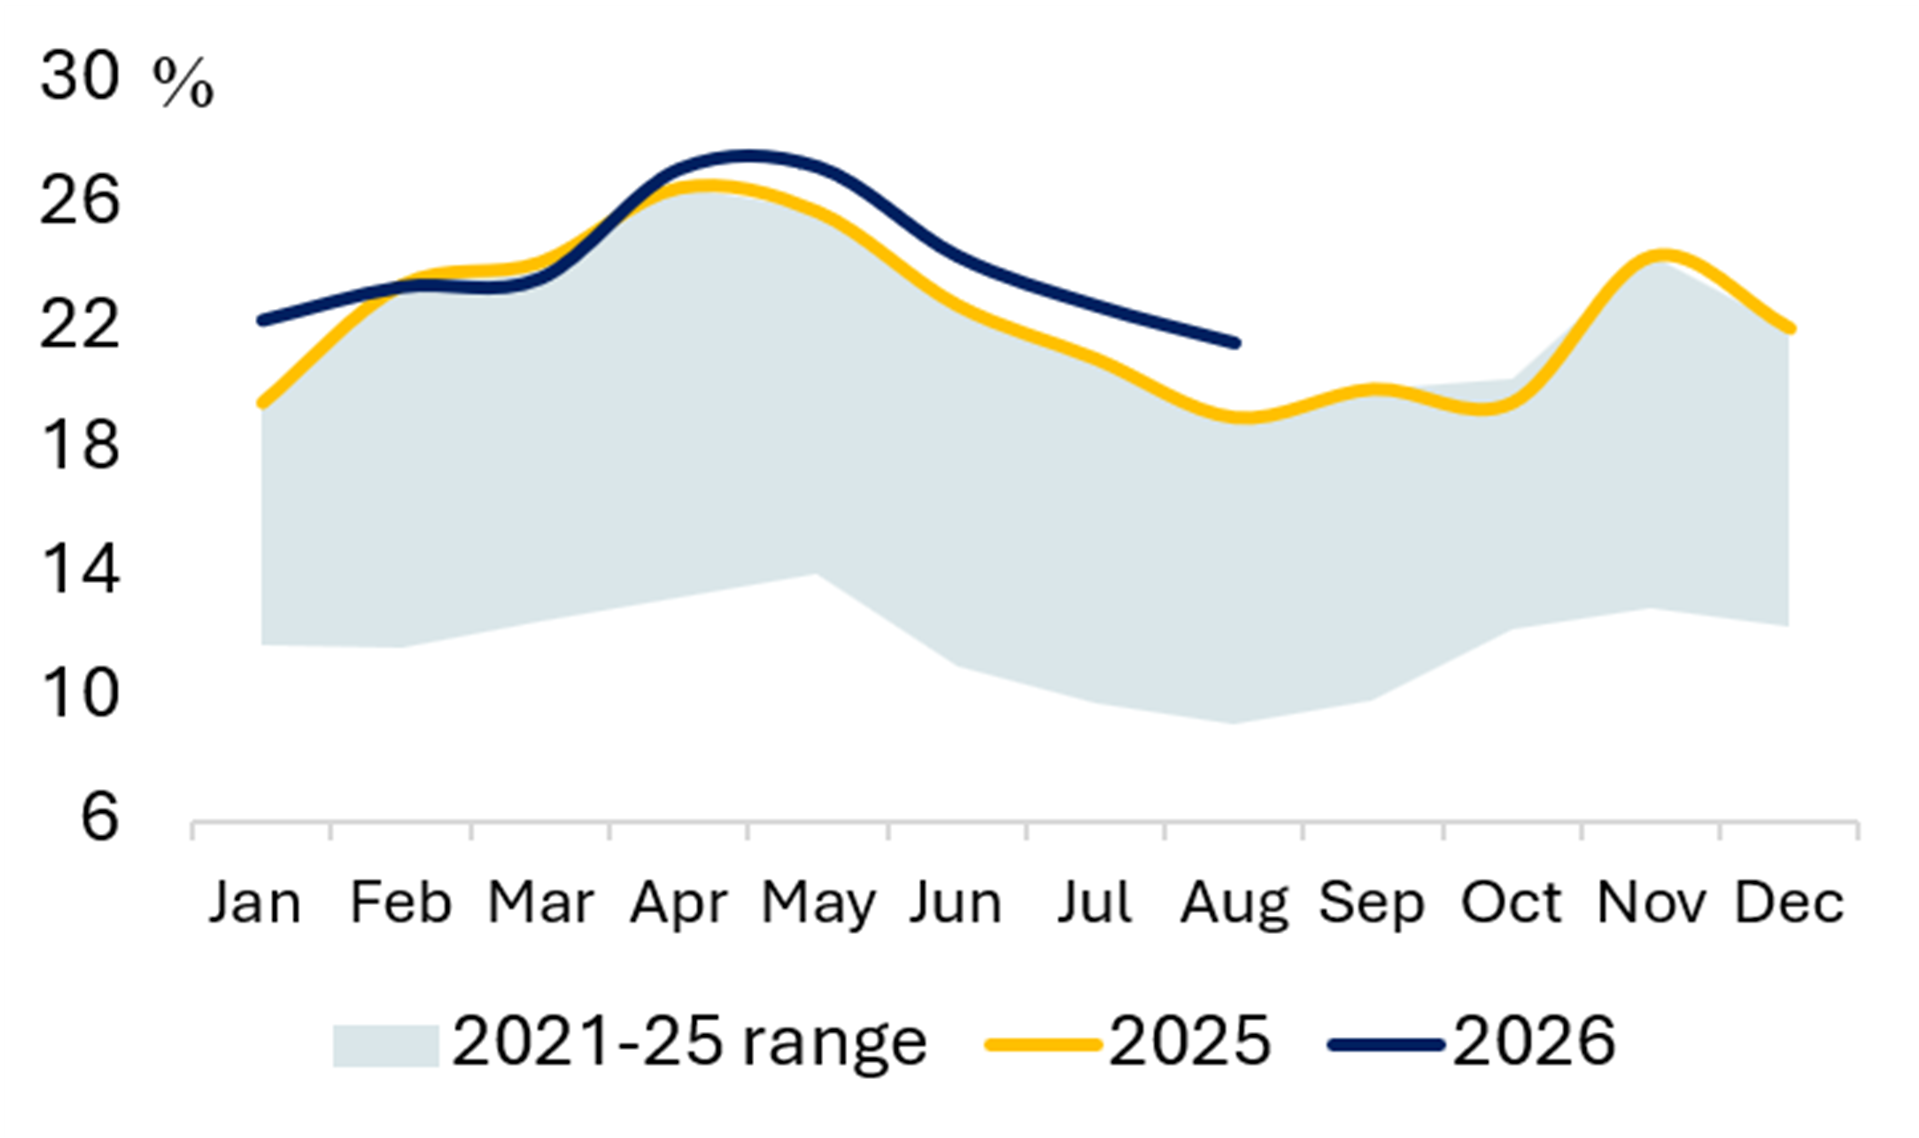
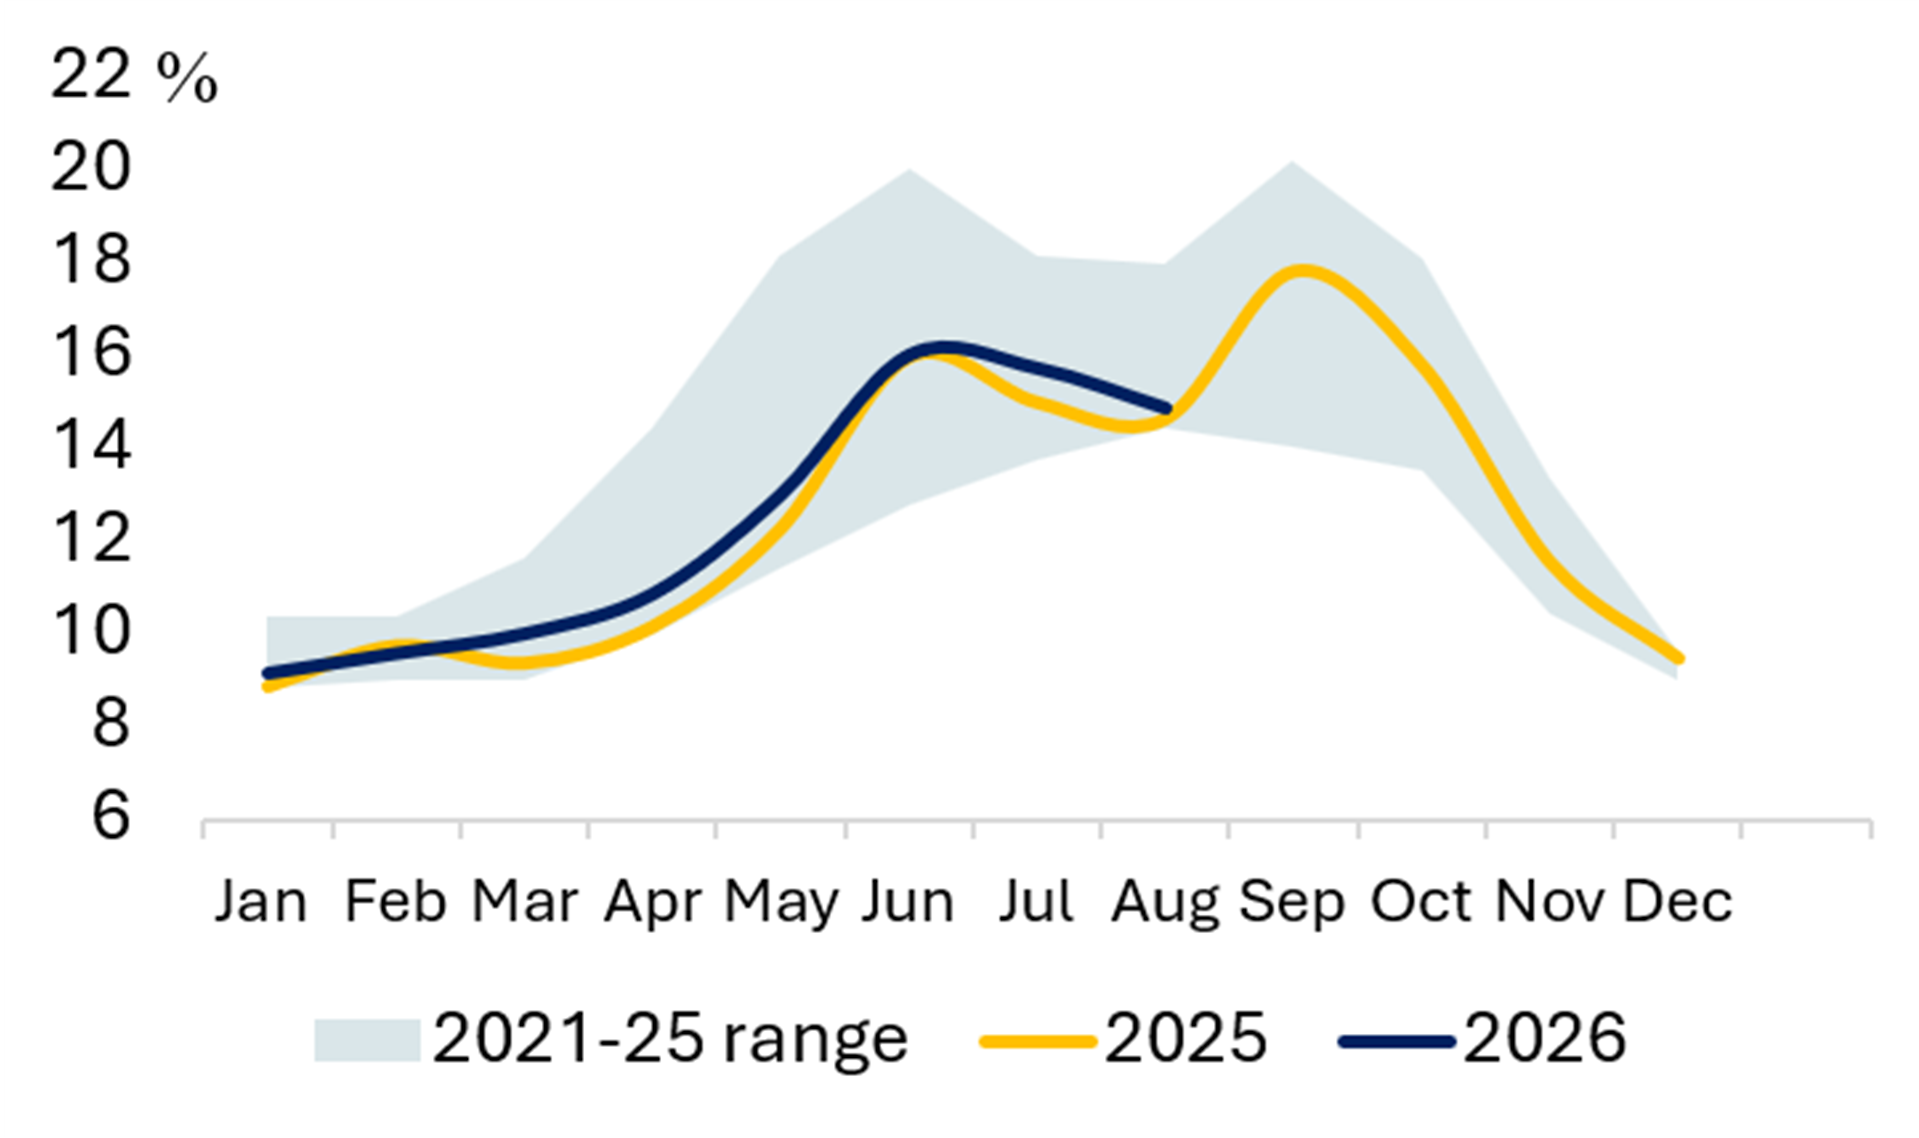
JAPAN
Exhibit 42 Power Generation Exhibit 43 Share of Gas (%) 

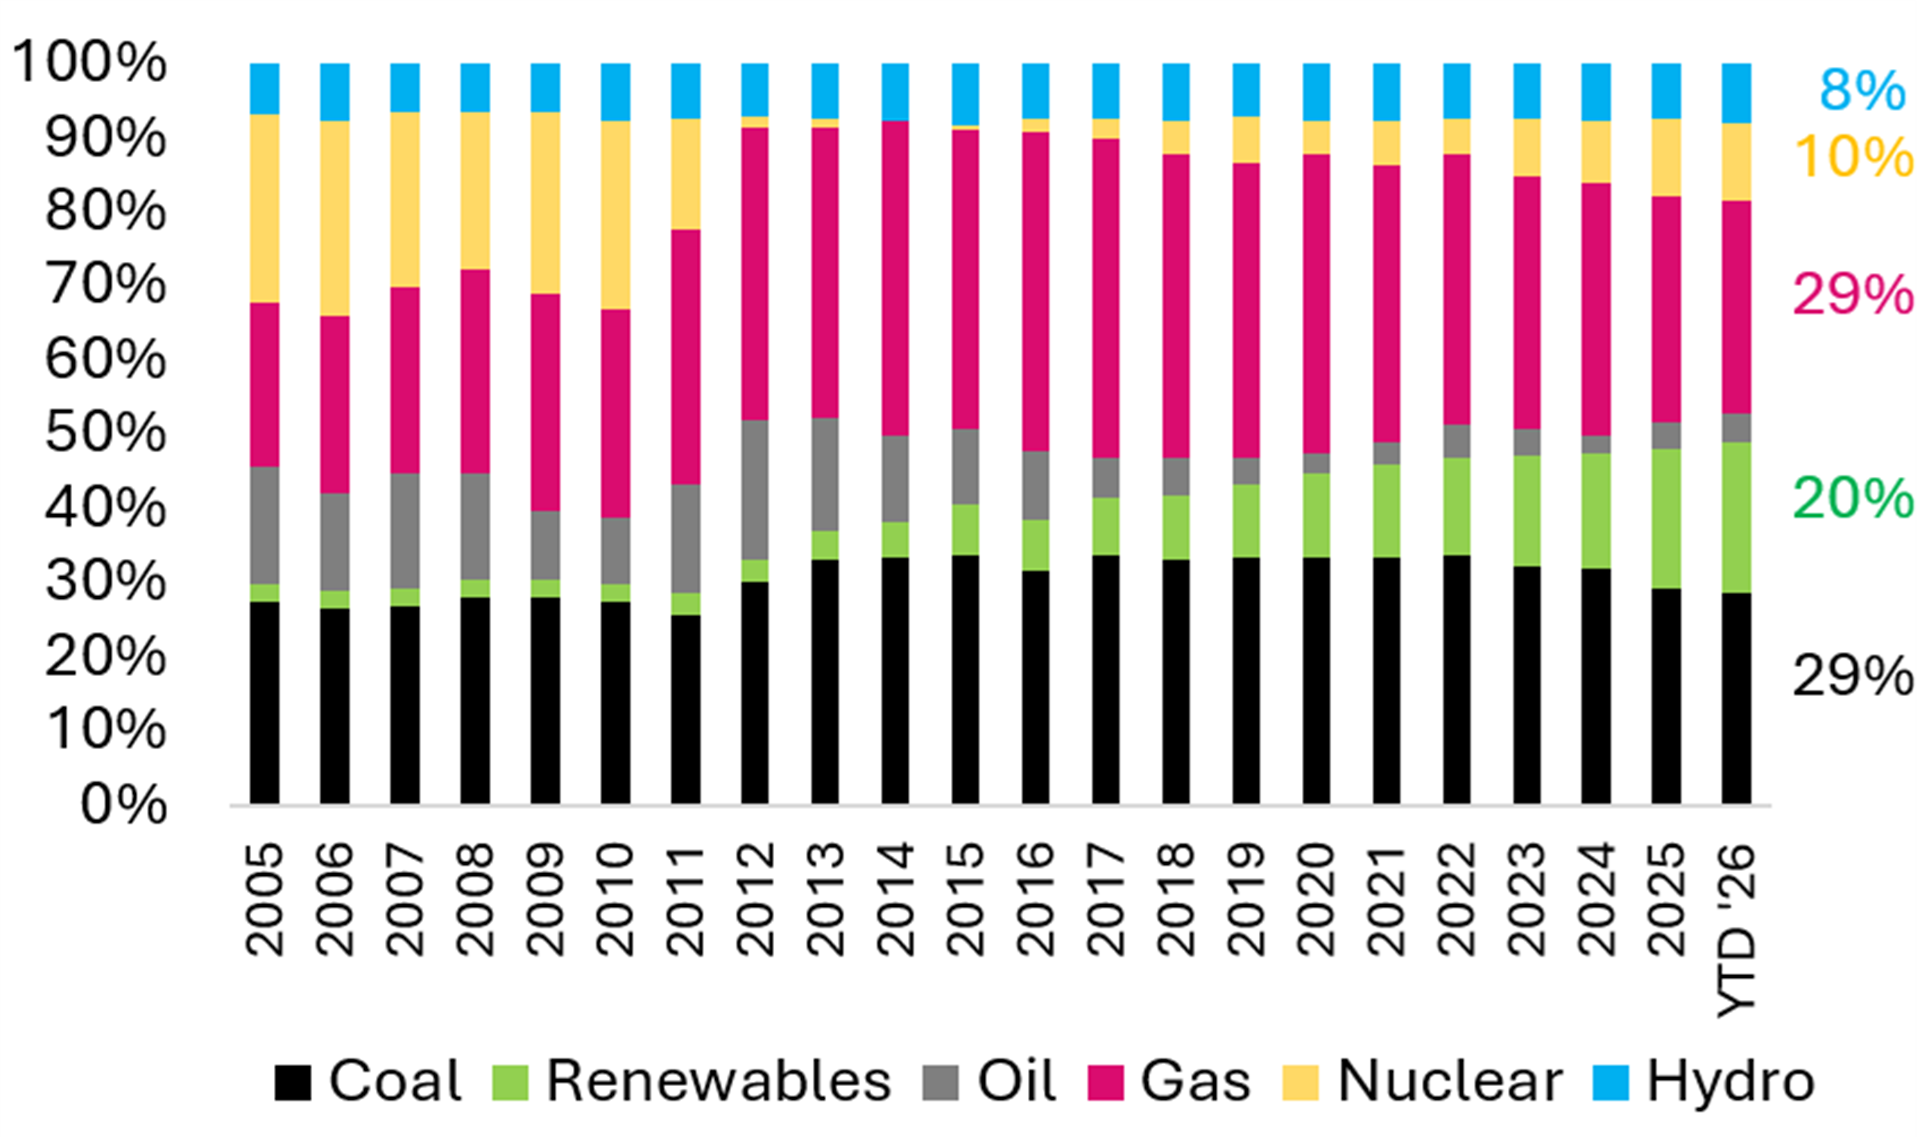
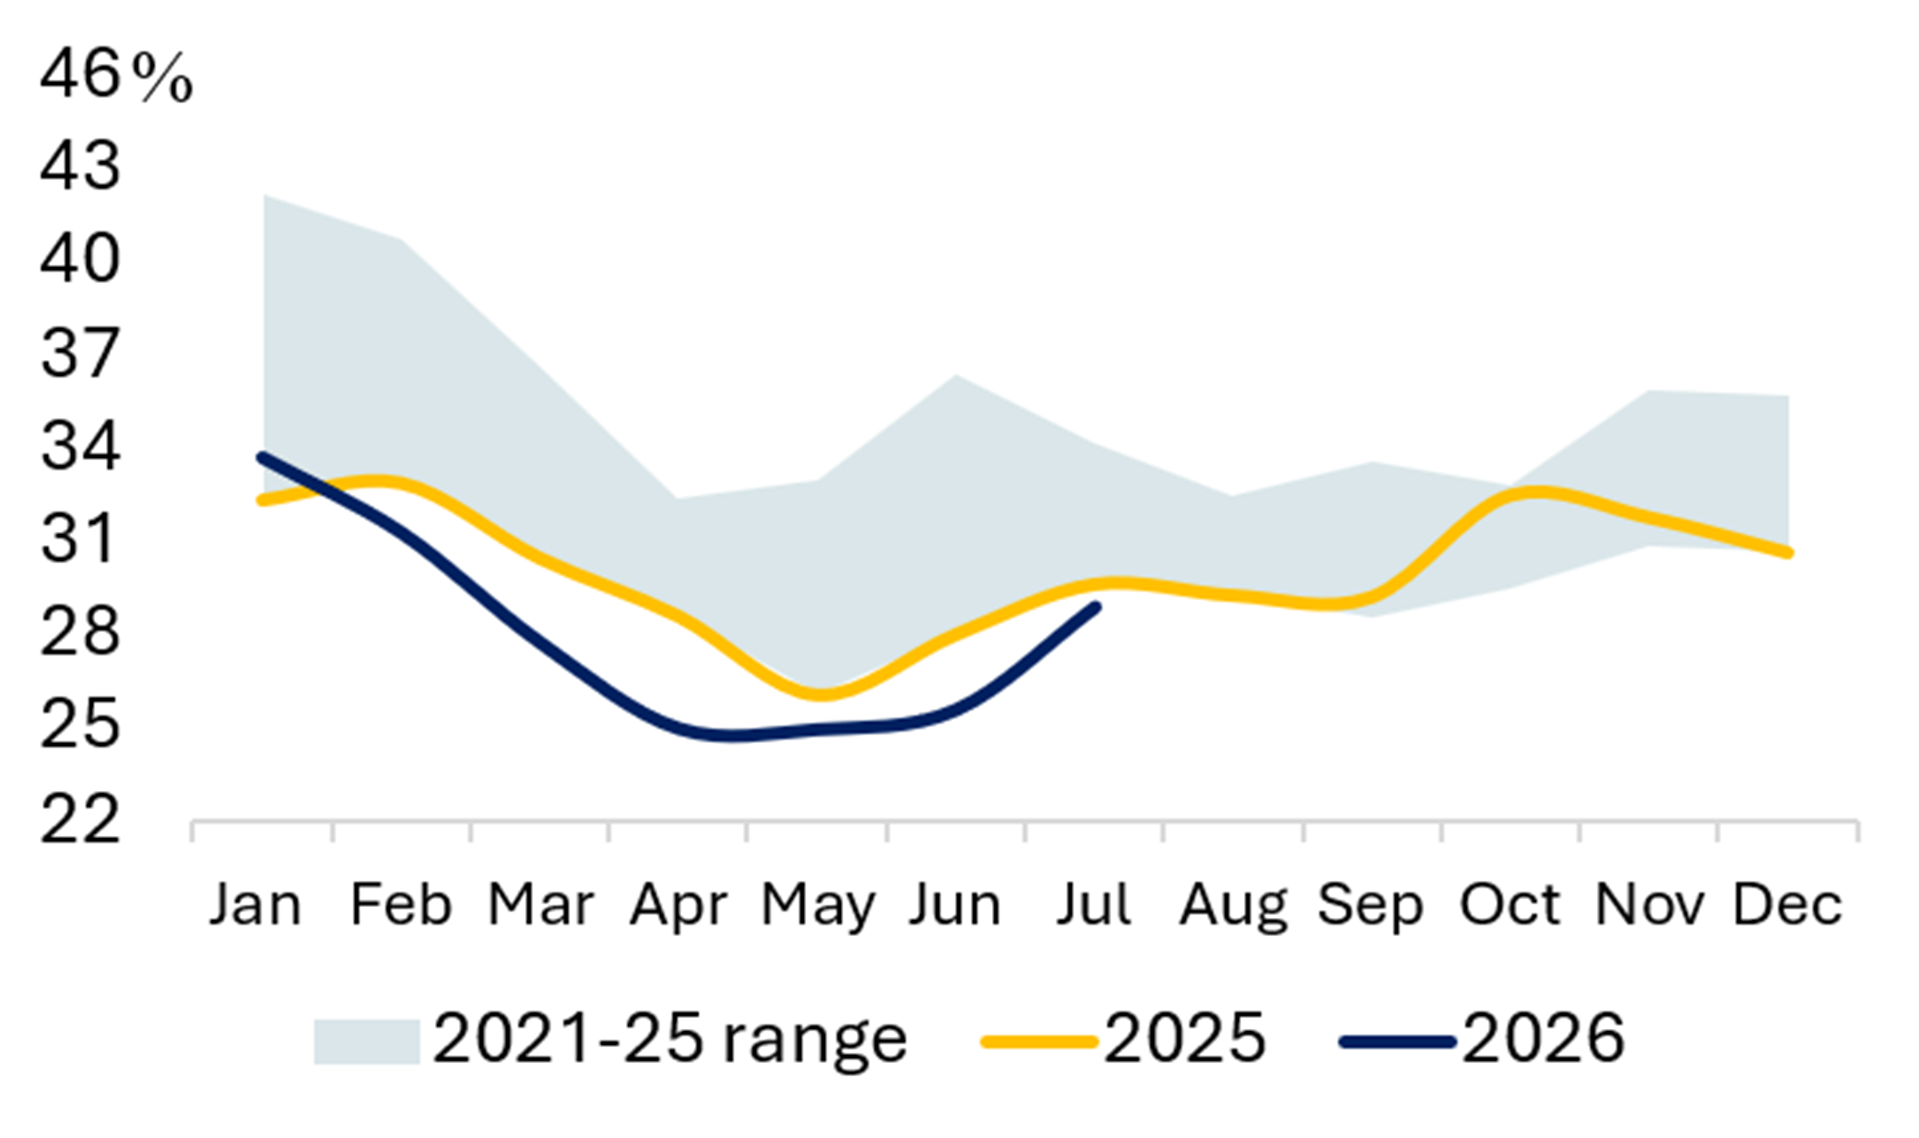
Exhibit 44 Share of Coal (%) Exhibit 45 Share of Wind & Solar (%)

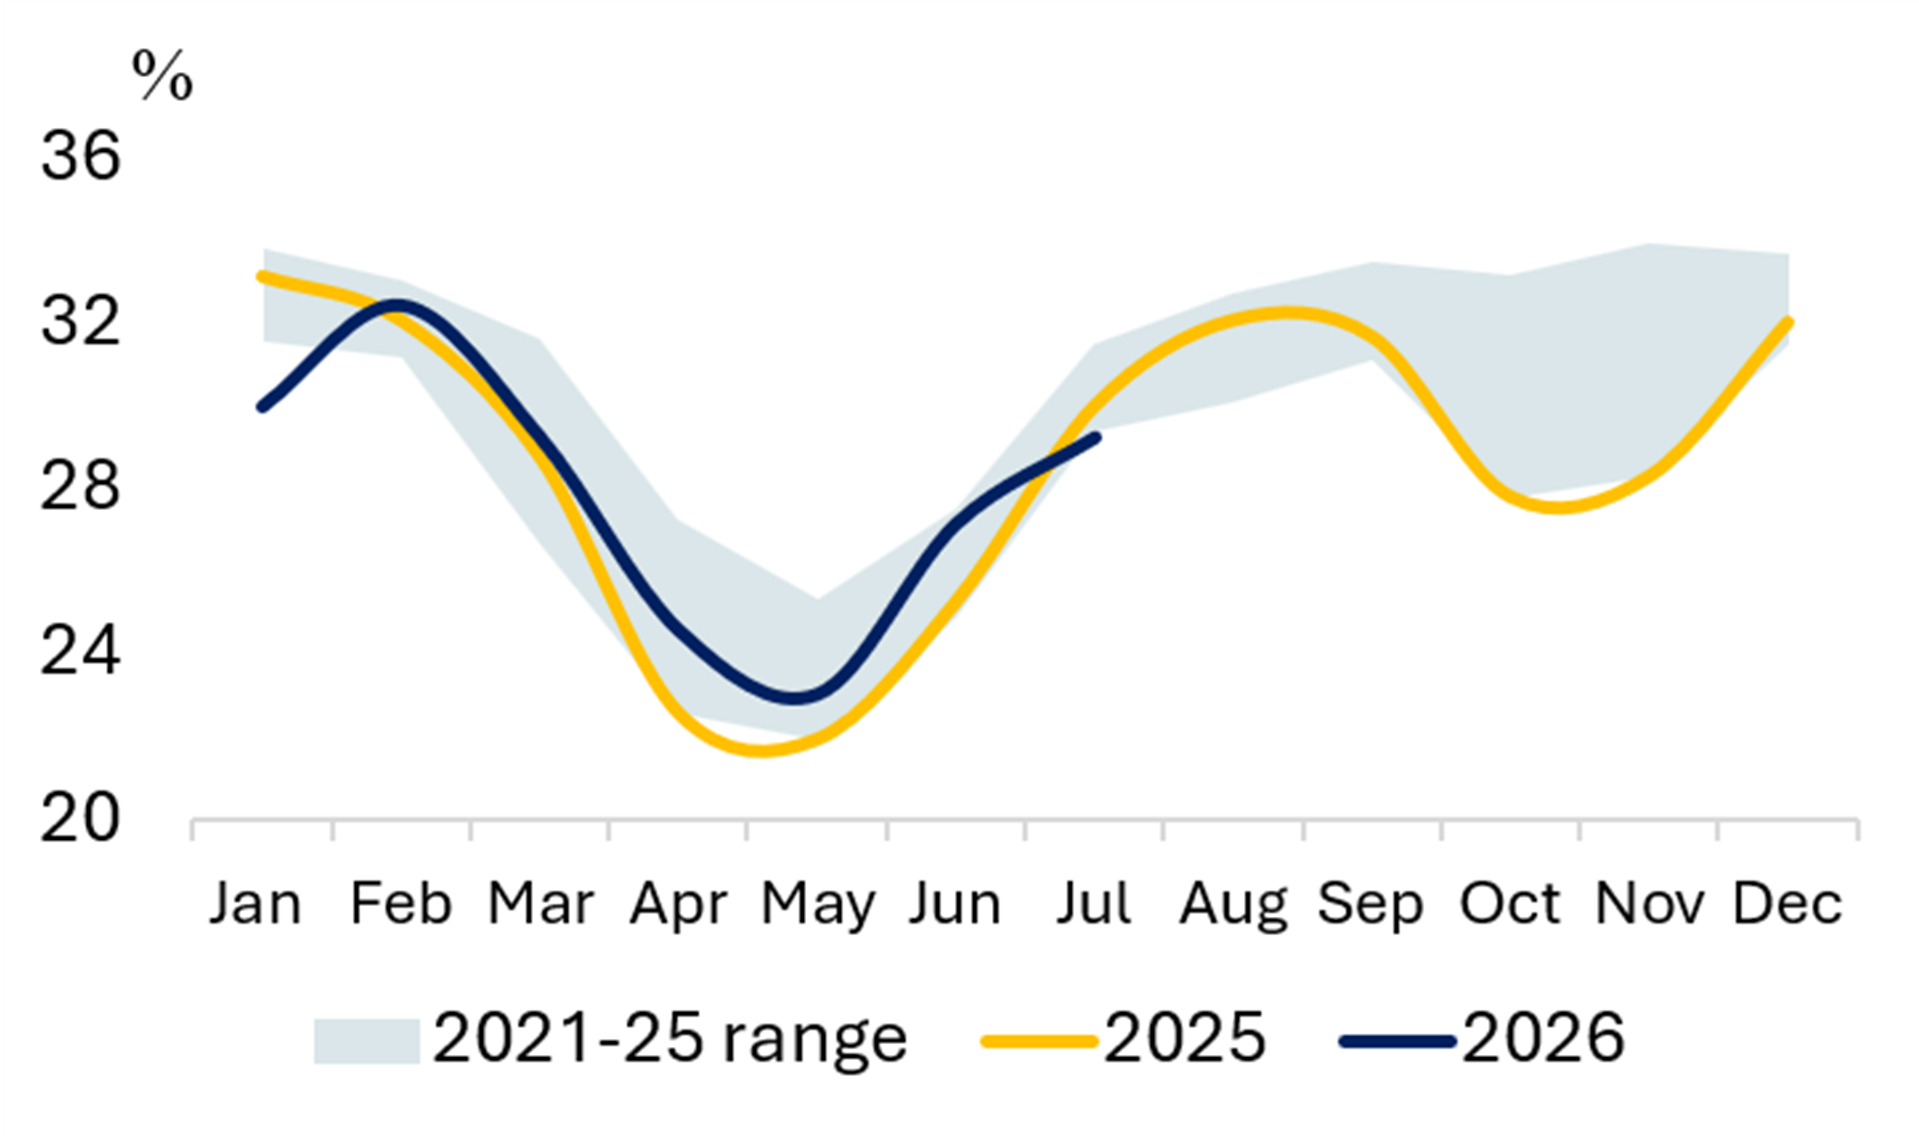
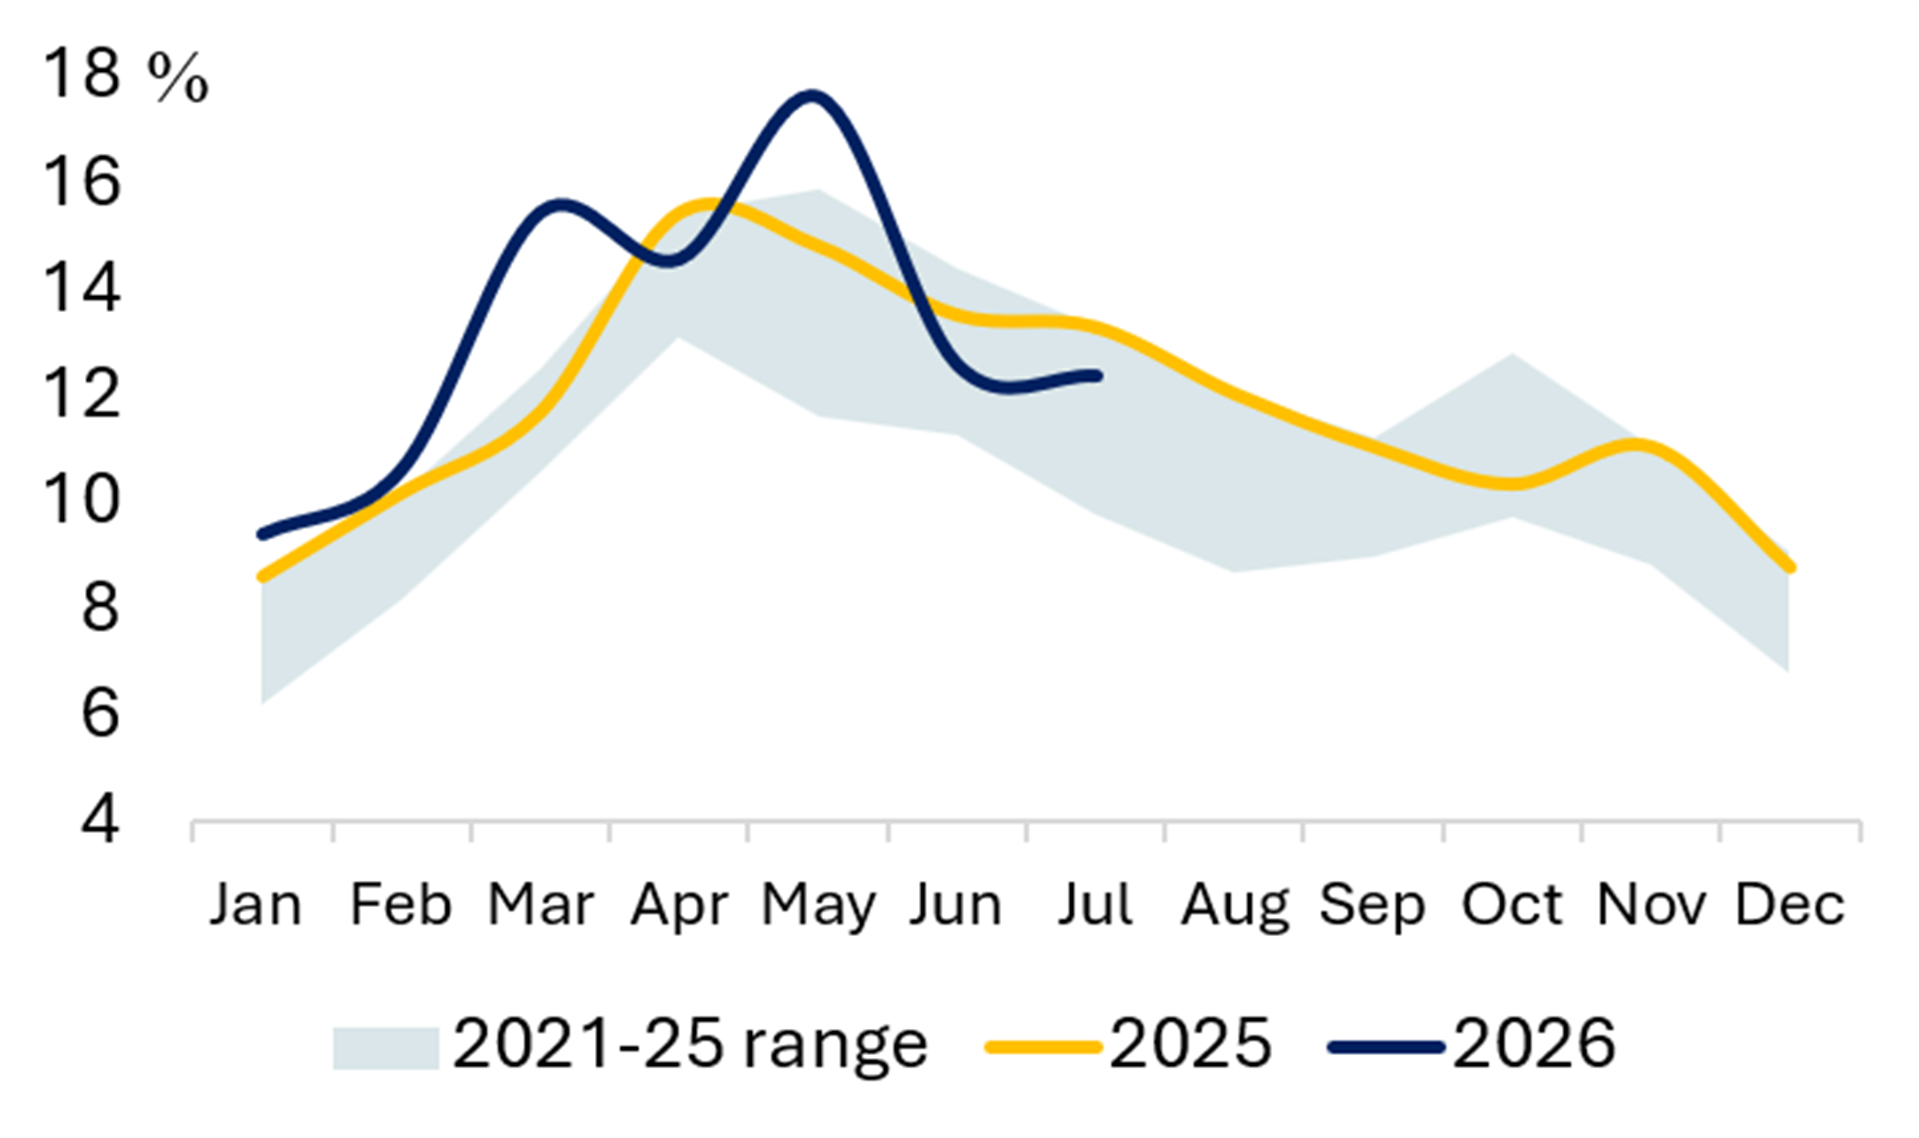

Source: Ember
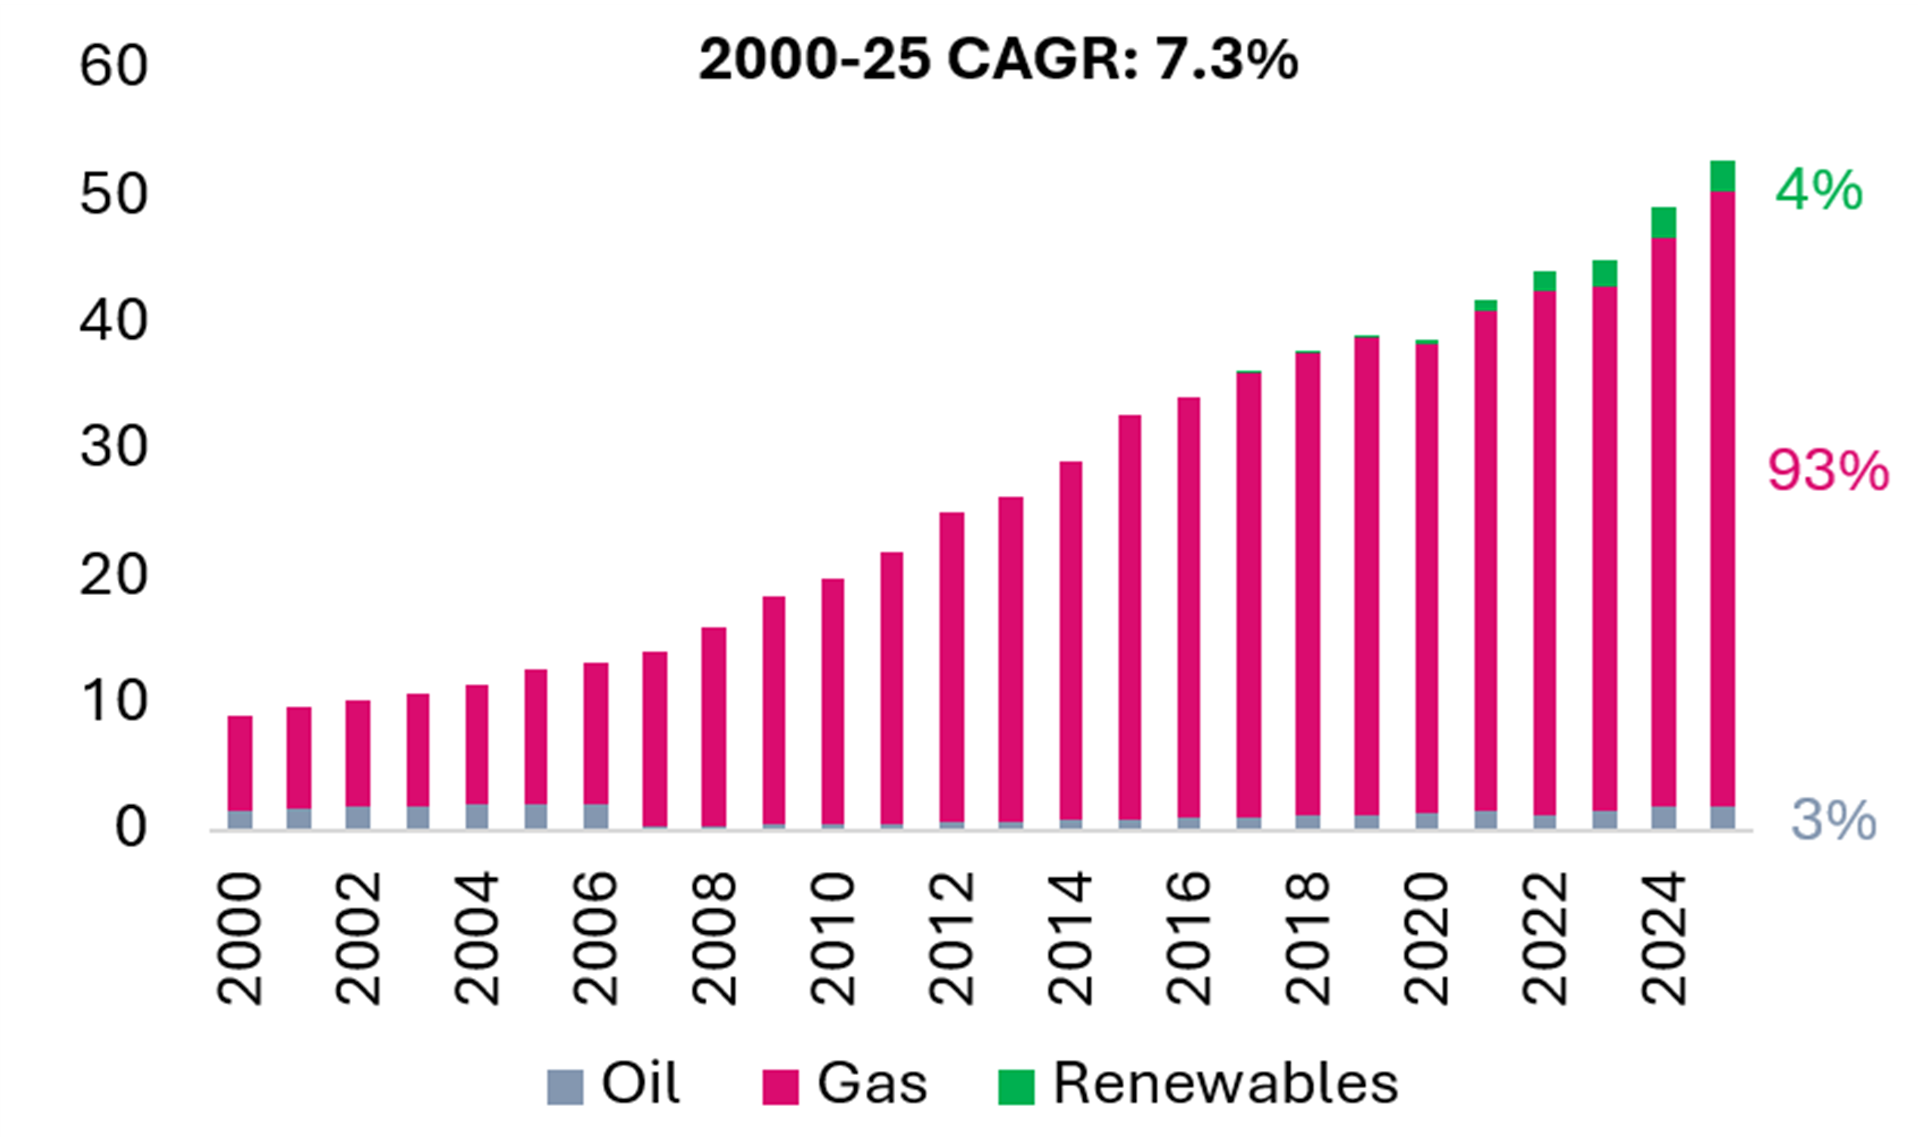
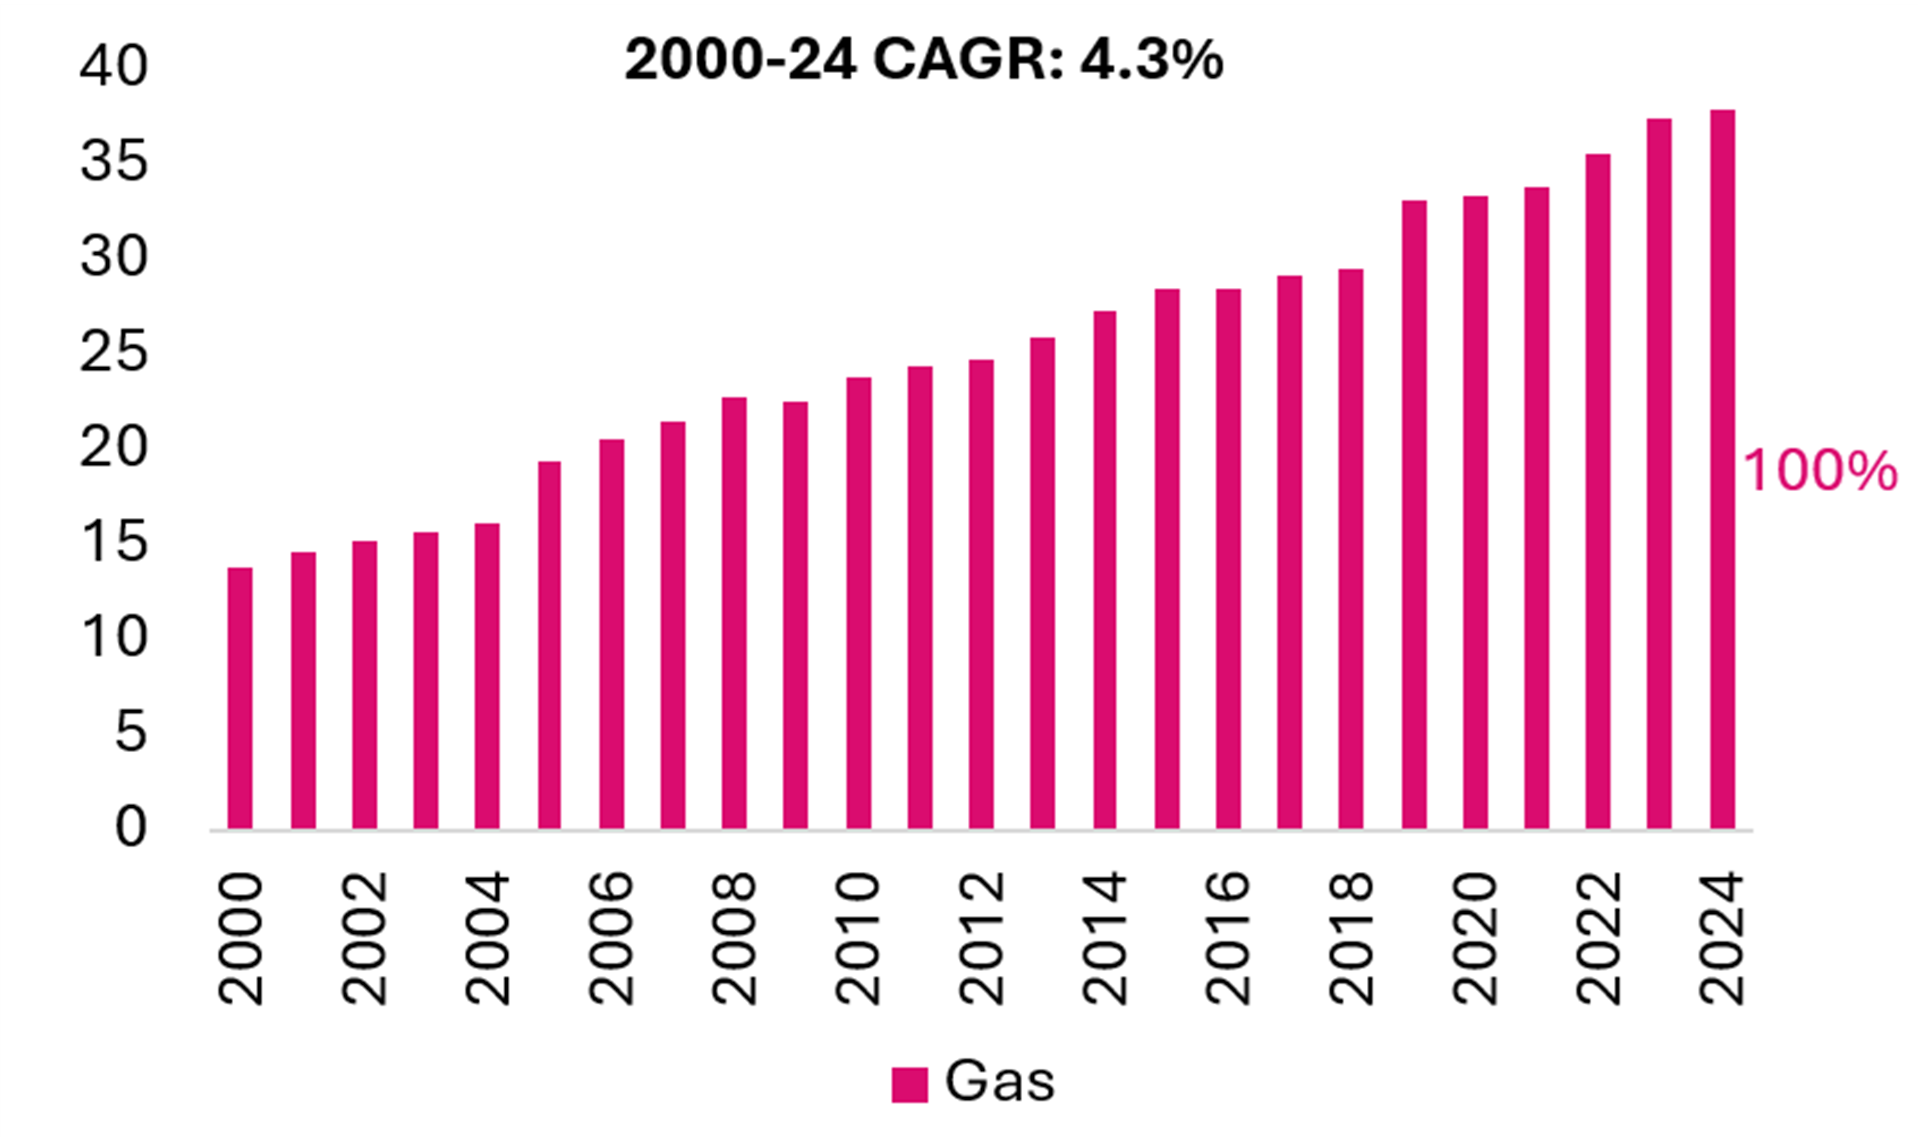
MIDDLE EAST – Energy Mix in Six Gulf Cooperation Council (GCC) Countries
Exhibit 46 Power Demand per Capita
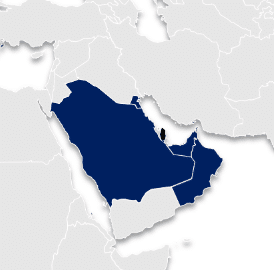
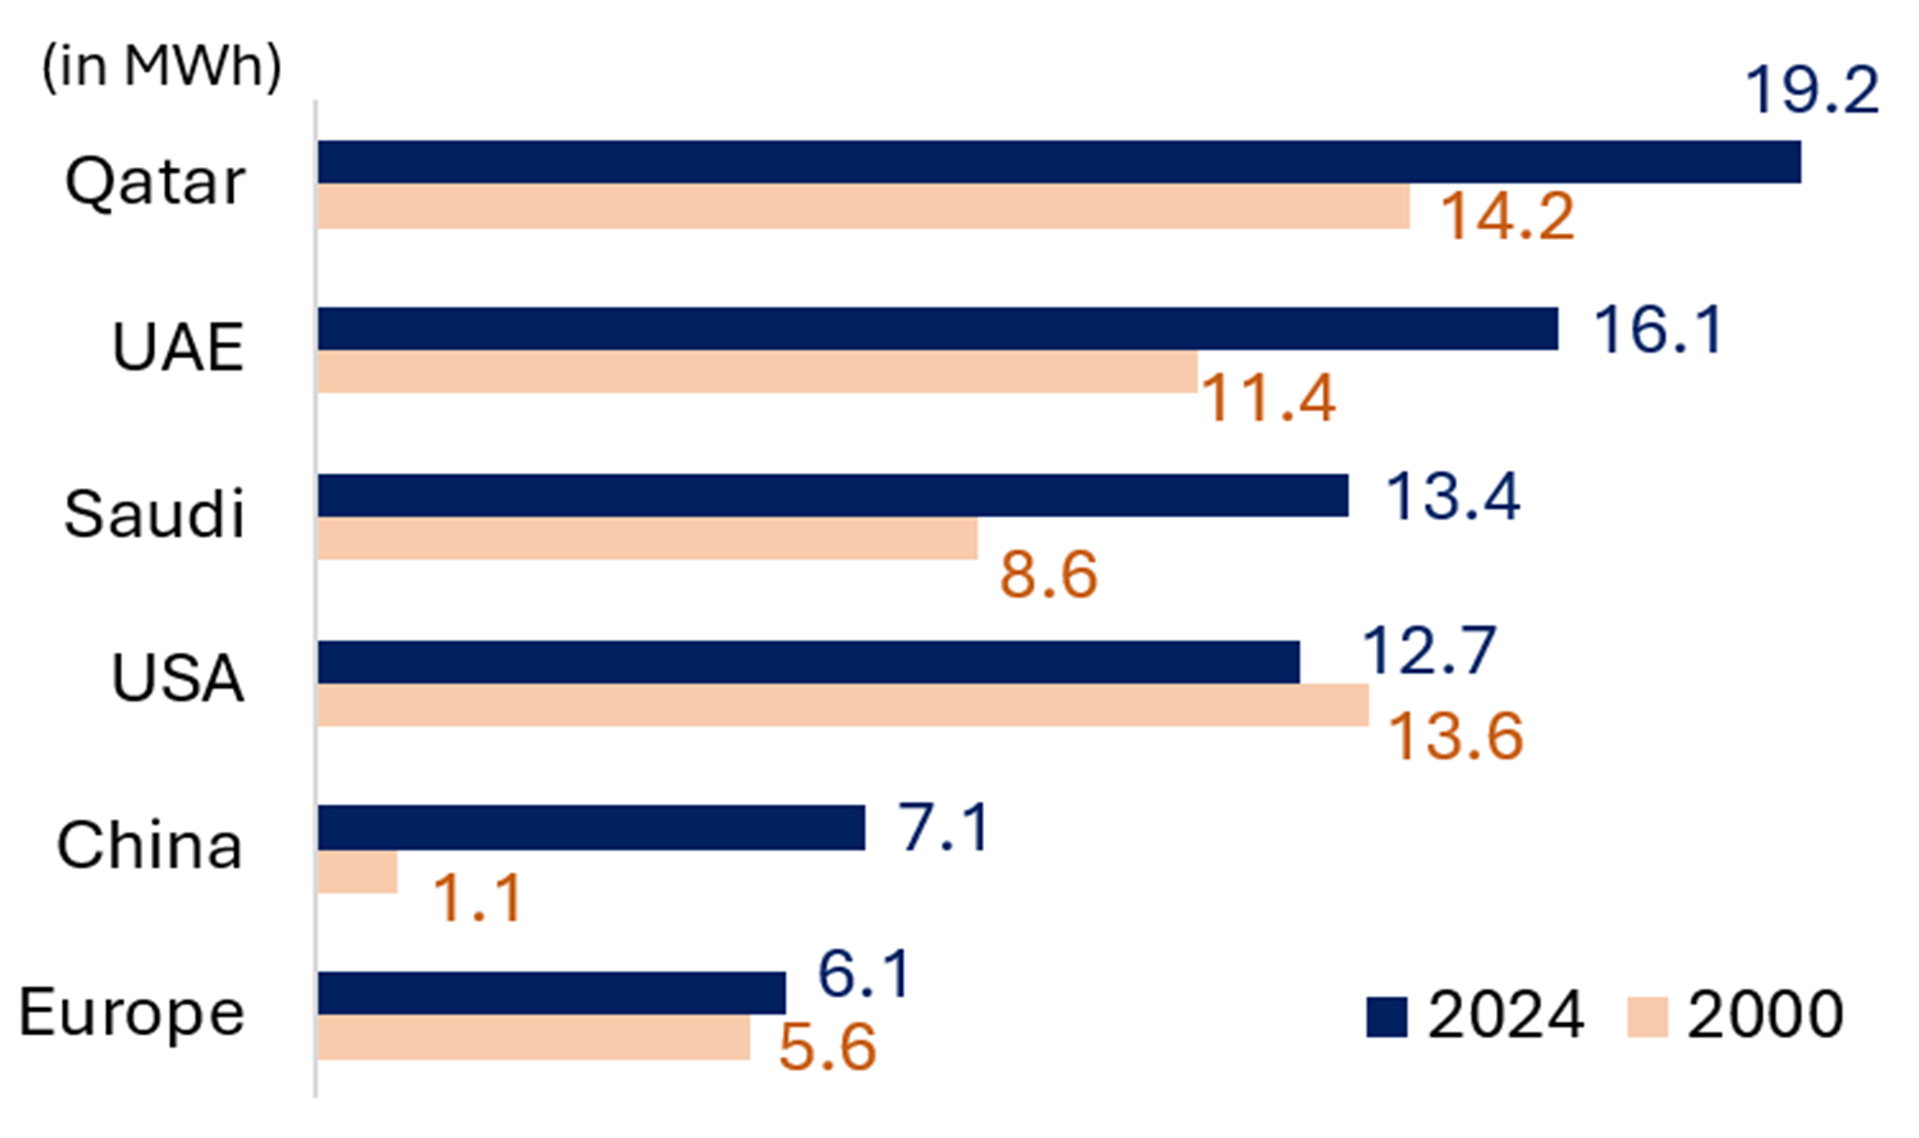

Exhibit 47 Saudi Arabia Power Gen (TWh) Exhibit 48 UAE Power Gen (TWh) 

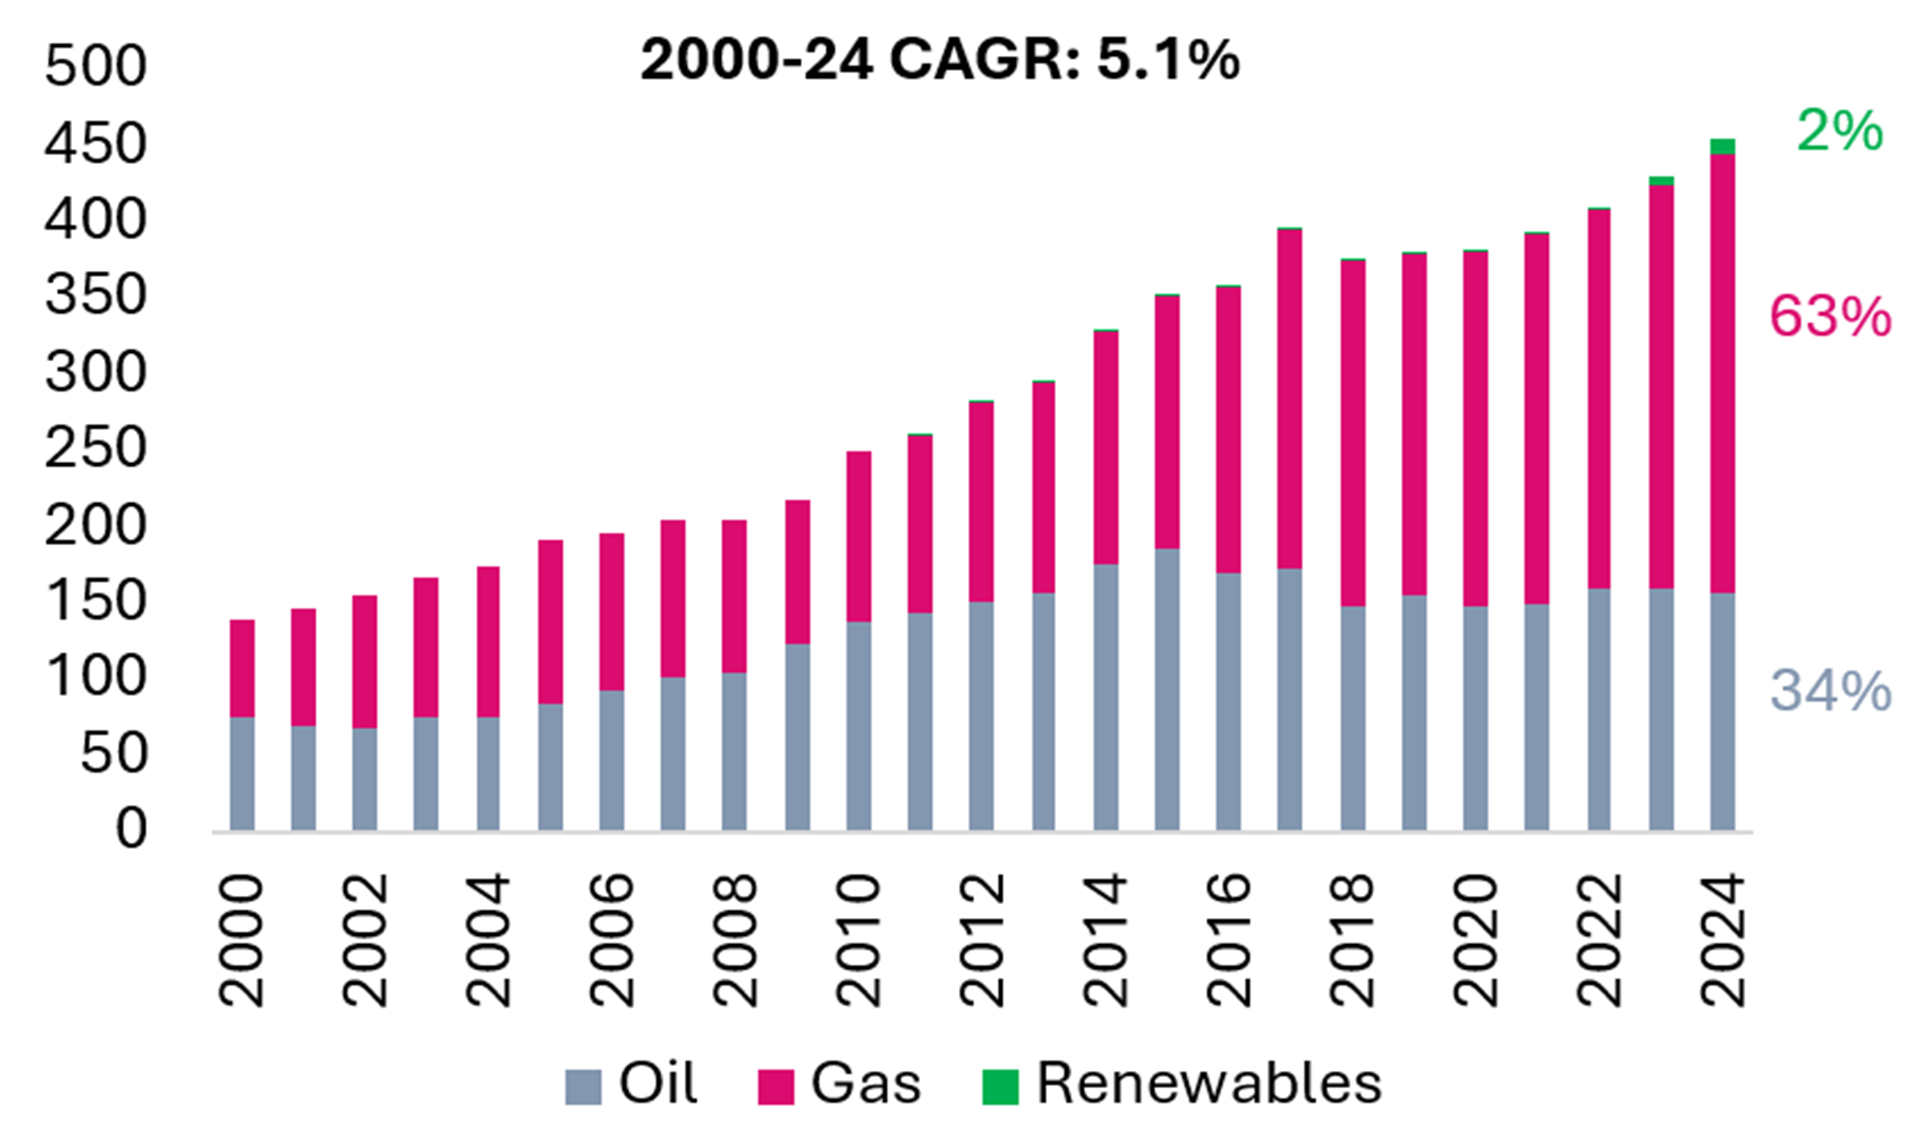
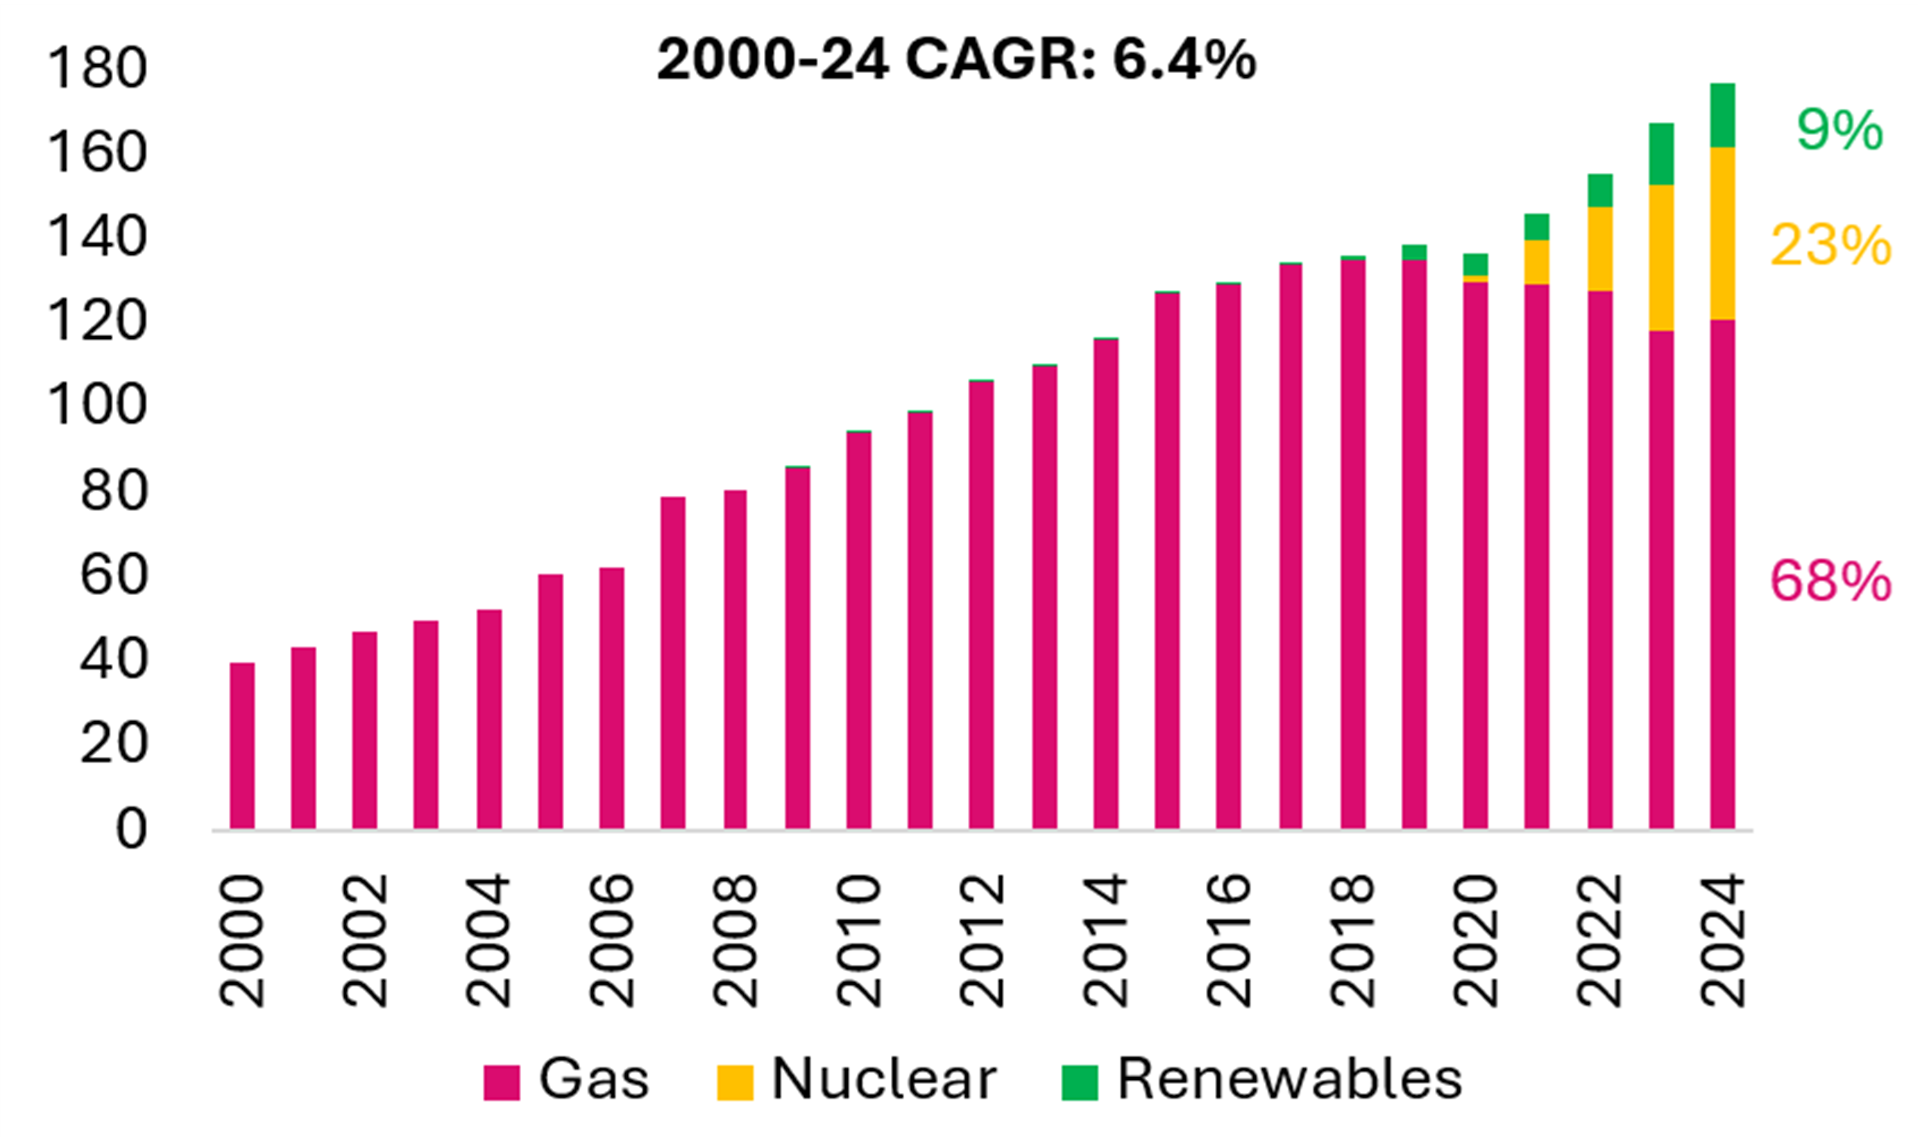
Exhibit 49 Qatar Power Gen (TWh) Exhibit 50 Kuwait Power Gen (TWh) 

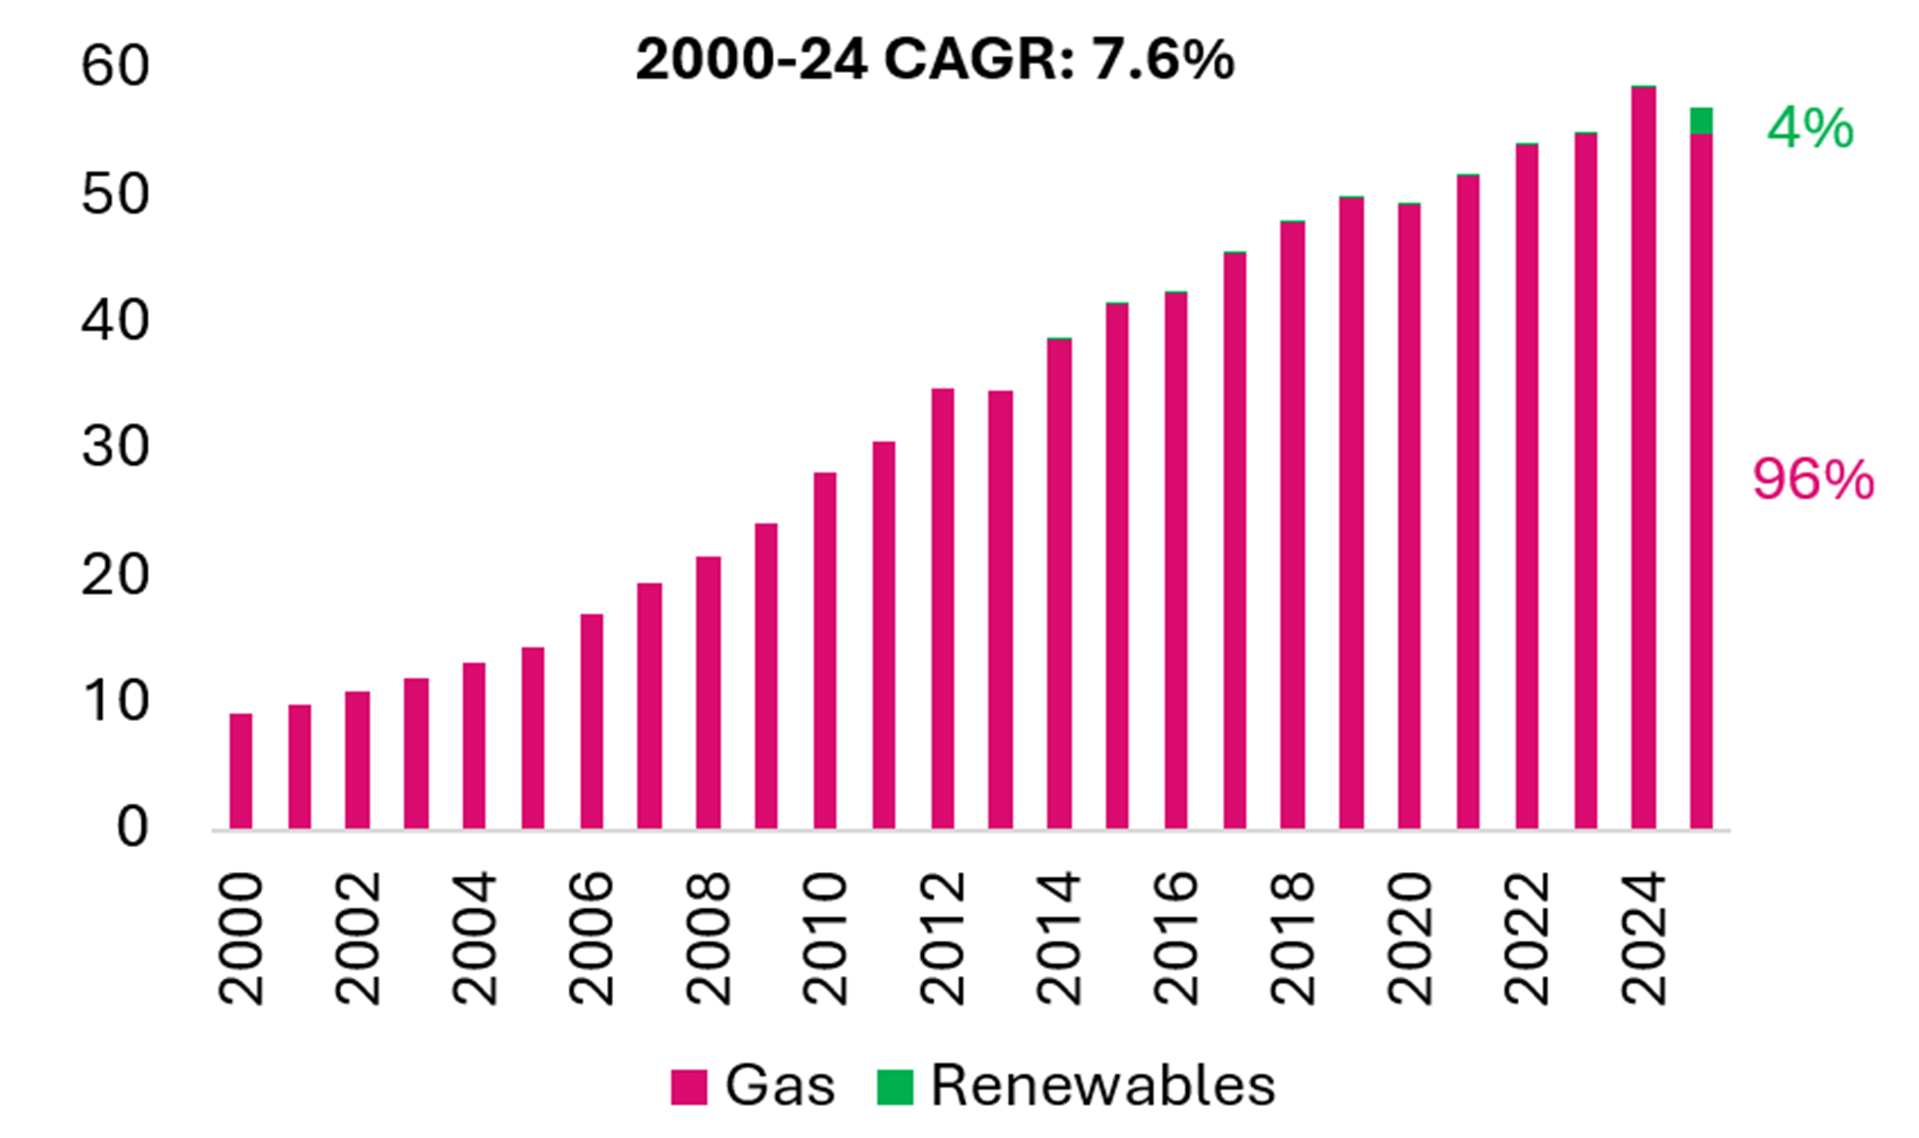
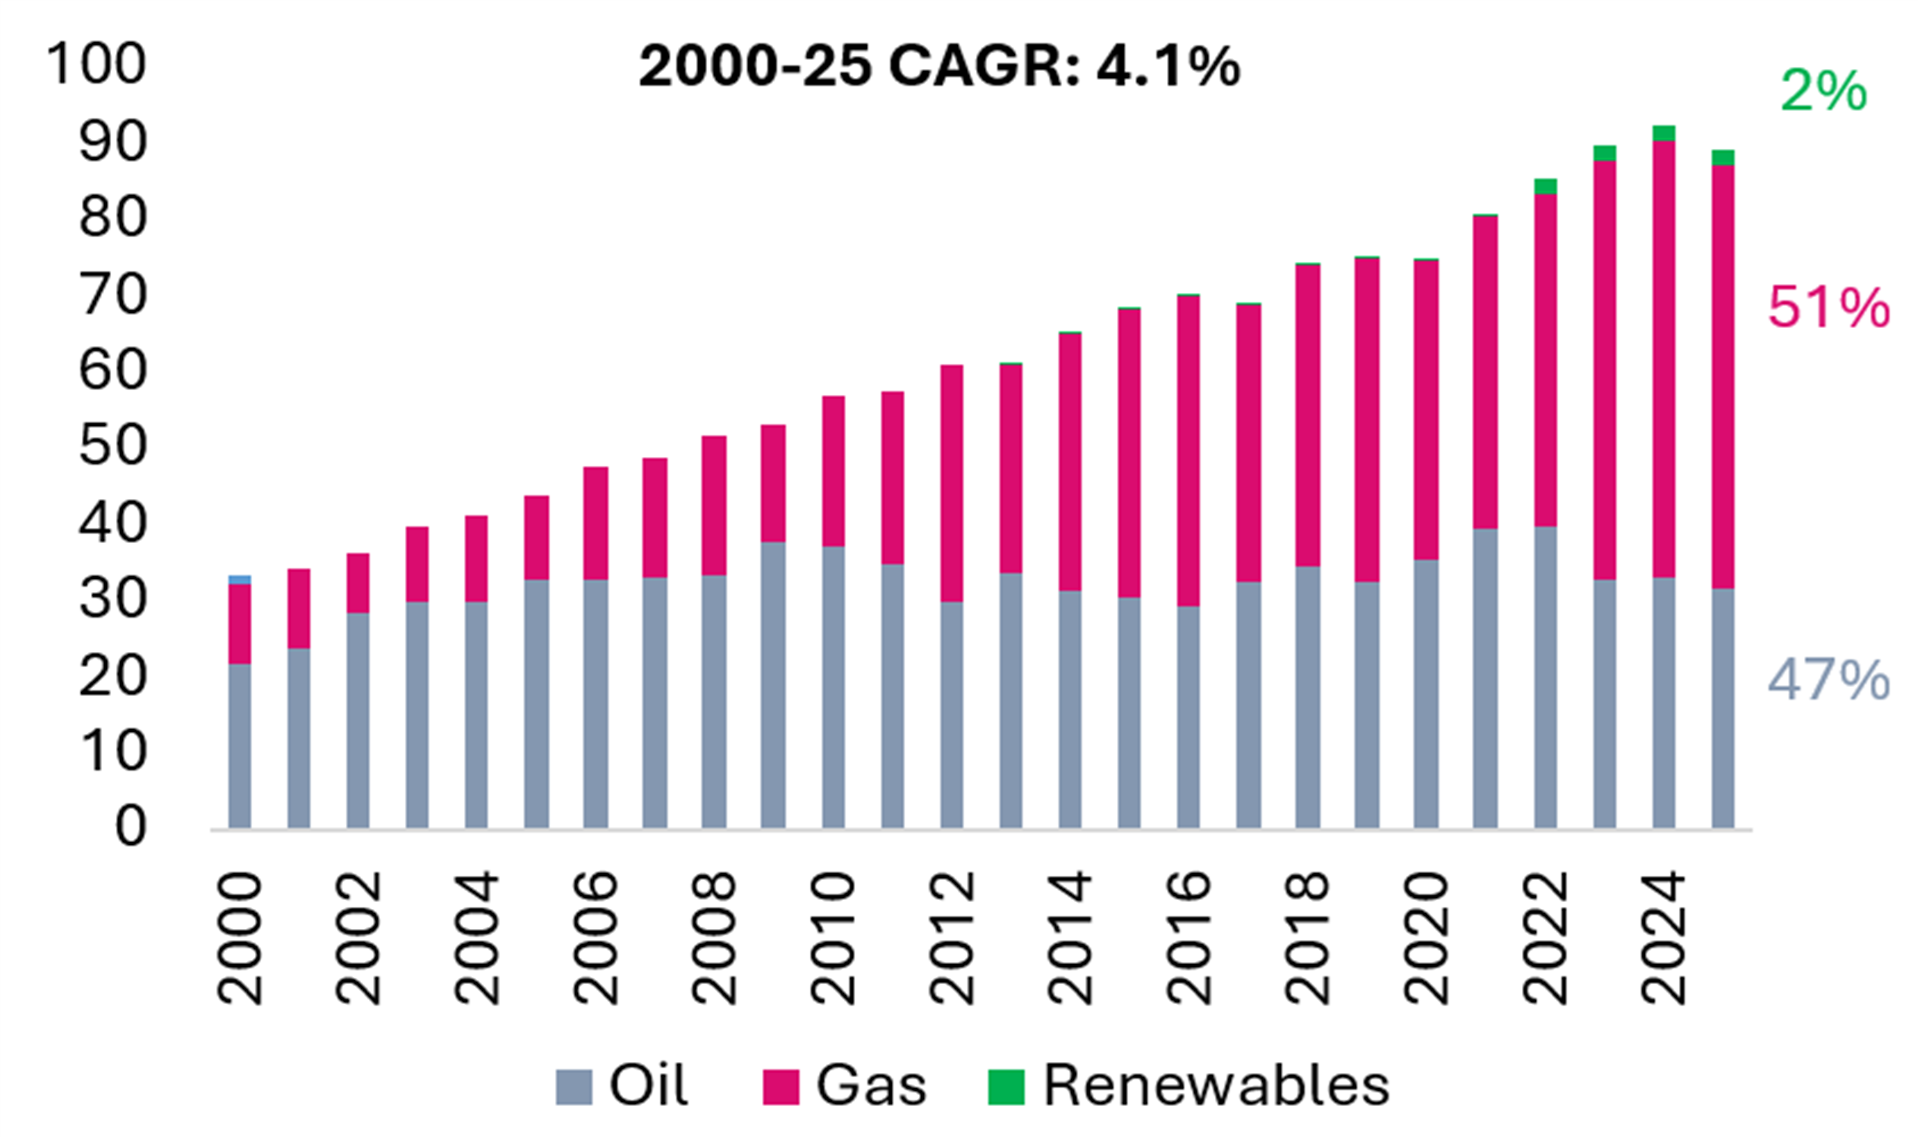
Exhibit 51 Oman Power Gen (TWh) Exhibit 52 Bahrain Power Gen (TWh) 

Source: Ember
Table 5 Non-US Utilities – Performance & Comparative Valuation


©Gabelli Funds 2026
249 Royal Palm Way, Palm Beach, FL 33480 Gabelli Funds TEL (561) 671–2100
This whitepaper was prepared by Jens Zimmermann, CFA, by Ashish Sinah, CFA, by Chong-Min Kang, and by Mitsuyoshi Kikuchi. The examples cited herein are based on public information and we make no representations regarding their accuracy or usefulness as precedent. The Research Analysts’ views are subject to change at any time based on market and other conditions. The information in this report represent the opinions of the individual Research Analysts’ as of the date hereof and is not intended to be a forecast of future events, a guarantee of future results, or investments advice. The views expressed may differ from other Research Analyst or of the Firm as a whole.
As of June 30, 2026, affiliates of GAMCO Investors, Inc. beneficially owned less than 1% of all companies mentioned.
Funds investing in a single sector, such as utilities, may be subject to more volatility than funds that invest more broadly. The utilities industry can be significantly affected by government regulation, financing difficulties, supply or demand of services or fuel and natural resources conservation. The value of utility stocks changes as long-term interest rates change.
Investors should carefully consider the investment objectives, risks, charges and expenses of the Fund before investing. The prospectus, which contains more complete information about this and other matters, should be read carefully before investing. To obtain a prospectus, please call 800 GABELLI or visit www.gabelli.com
Returns represent past performance and do not guarantee future results. Current performance may be lower or higher than the performance data quoted. Investment return and principal value will fluctuate so, upon redemption, shares may be worth more or less than their original cost. To obtain the most recent month end performance information and a prospectus, please call 800-GABELLI or visit www.gabelli.com
Distributed by G.distributors, LLC., a registered broker dealer and member of FINRA.
This whitepaper is not an offer to sell any security nor is it a solicitation of an offer to buy any security.
For more information, visit our website at: www.gabelli.com or call: 800-GABELLI
800-422-3554 • 914-921-5000 • Fax 914-921-5098 • info@gabelli.com
Gabelli Funds, LLC is a registered investment adviser with the Securities and Exchange Commission and is a wholly owned subsidiary of GAMCO Investors, Inc. (OTCQX: GAMI).