The Storm Before the Calm?
Todays Headwinds–Tomorrows Tailwinds?
EPS Growth Remains Strong Despite Higher Interest Rates
US Utilities- Today’s Headwinds Could Become Tomorrow’s Tailwinds
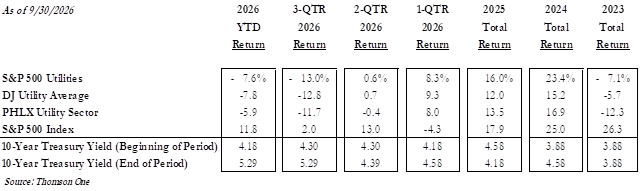
Utilities were hit hard in the third quarter, declining 13% versus a 2.0% gain for the S&P 500, leaving the S&P Utilities Index (SPSU) down 7.6% year-to-date. After rallying 12% to a record high in late February, utilities gave back those gains and more as the Iran conflict drove oil prices higher, increased inflation concerns and pushed the 10-year Treasury yield above 5.3% for the first time since 2002. The US interest-rate outlook reversed quickly, as expectations for Fed easing gave way to higher-for-longer rates amid resilient economic growth and accelerating AI investment. Political and regulatory pressures have added to the weakness as the November elections intensify the focus on utility affordability and opposition to data-center development.
Table 1 First Nine-Months 2026 Performance
We attribute the third-quarter selloff primarily to higher interest rates rather than deteriorating fundamentals. Higher borrowing costs and lower stock valuations make financing less attractive, but authorized ROEs generally adjust to higher rates with a regulatory lag. Despite these pressures, many utilities continue to target 6–8% or better annual EPS growth as data centers, manufacturing and electrification accelerate demand. Electric utilities plan to invest nearly $1 trillion over the next three years, supporting strong rate base growth and one of the largest infrastructure investment cycles in decades.
While proposed data-center capacity far exceeds what will ultimately be built, projects backed by well-capitalized hyperscalers should provide substantial support for utility earnings growth. Growing opposition over affordability, water consumption, land use and reliability is delaying some projects, but large-load tariffs and electric service agreements increasingly require developers to fund infrastructure costs and protect existing customers. Growth will be uneven across regions and utilities, favoring those with available power, constructive regulation, efficient permitting and the ability to rapidly expand generation and transmission. Texas, Virginia, Louisiana, Ohio, Iowa, Missouri and much of the Midwest and Southeast remain important development markets despite increasing scrutiny.
Scale and access to capital have also become even more important. Larger utilities with the financial resources, generation portfolios and speed-to-market capabilities to serve rapidly growing loads are increasingly targeting high-single-digit EPS growth versus mid-single-digit growth for more traditional utilities. The proposed NextEra Energy-Dominion Energy (announced 5/18/2026) combination highlights the importance of scale, while private infrastructure capital continues to pursue power assets, supporting additional transactions and consolidation.
We expect third quarter earnings season to refocus investors on accelerating power demand, record capital investment and strong rate base growth. Despite higher interest rates and affordability pressures, we expect utilities to grow EPS at historically high rates through 2032. Regulation remains broadly constructive, supporting increased capital investment that requires strong balance sheets and balanced financing. We view growing equity needs as accretive to earnings. At 16.5x 2027 earnings and a relative P/E discount to the S&P 500, valuations appear attractive. We see potential annual total returns of 9–11%, including a 3.5% dividend yield and ~7% EPS growth. We believe recent weakness reflects macroeconomic and political headwinds rather than deteriorating fundamentals, creating attractive long-term opportunities across electric and gas utilities and select midstream companies.
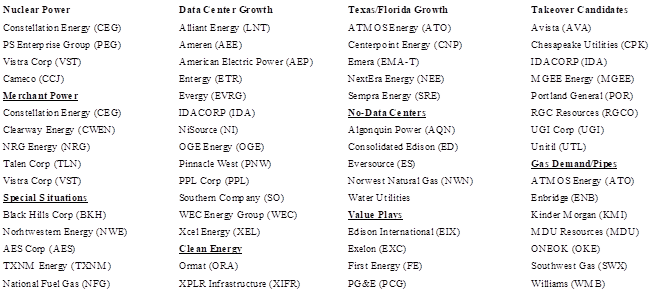
Exhibit 1 Stocks to Capitalize on By Theme
INTEREST RATES HIGHEST IN 25 YEARS
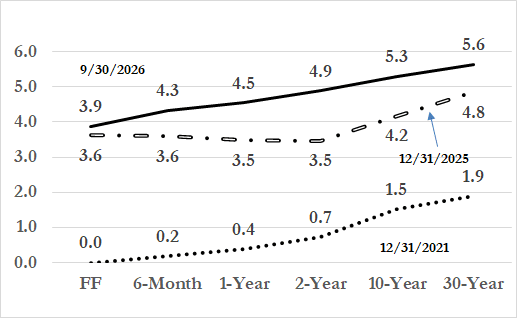
Since year-end 2025, the US Treasury yield curve has risen materially, including the 10-year yield to 5.29%, from 4.18%, and the 6-month to 4.33%, from 3.99% (see Exhibit 2). Over the past several months, the interest-rate outlook reversed as expectations for Fed easing gave way to higher-for-longer rates amid resilient economic growth and accelerating AI investment. On September 16, the Federal Reserve raised the federal funds rate 25 basis points to 3.75–4.00%, reversing course after six rate cuts since September 2024. The Fed also raised its projected year-end policy rate to 4.1% for both 2026 and 2027, from June estimates of 3.8% and 3.6%, respectively. Below we show 3 yield curves (1) at year-end 2021, (2) year-end 2025, and (3) as of September 30, 2026. Utility stocks (and most investments) benefit from a lower yield curve.
Exhibit 2 Ten-Year Treasury Yield at 5.29% (was 4.18% at 12/31/2025)
Source: US Dept of the Treasury
Utility stocks are not bond proxies; share prices ultimately reflect earnings and dividend growth. However, higher (lower) interest rates are a meaningful headwind (tailwind) for three reasons.
- Higher (lower) discount rates reduce (increase) the present value of utilities’ future cash flows.
- Utilities are capital-intensive businesses that rely heavily on debt and equity to finance investment, and higher (lower) rates increase (lower) the cost of capital, particularly as lower-cost debt matures and must be refinanced.
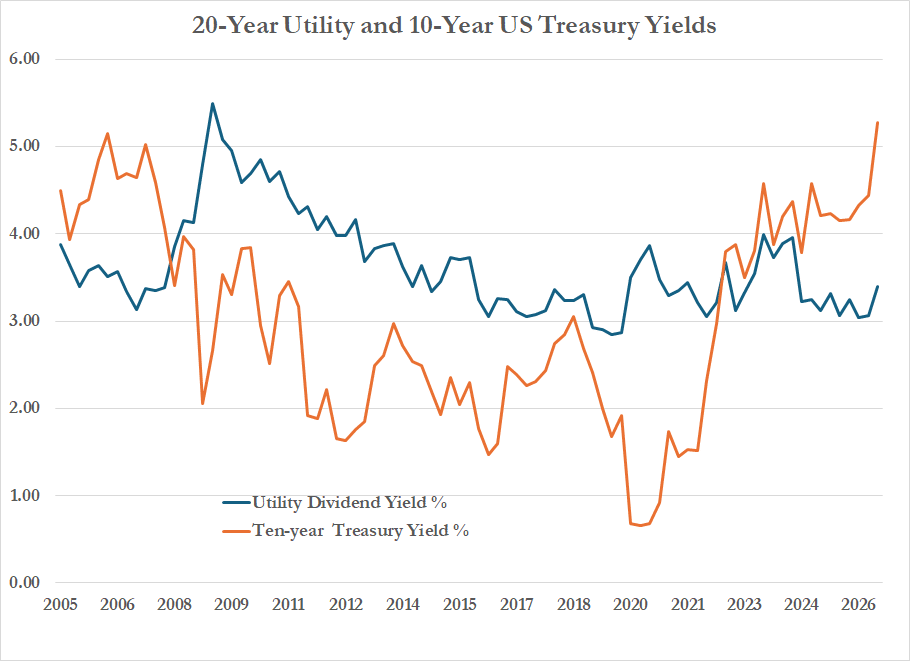
- Higher Treasury yields create greater competition for income-oriented investors. Six-month Treasuries now yield 4.3%, compared with an average utility dividend yield of roughly 3.5.
Exhibit 3 Ten–Year Treasury Yield Higher Than Utility Yields
Source: FACTSET
Over time, several factors mitigate these pressures. Unlike Treasuries, utilities offer growing rate base, earnings and dividends, with electric utility dividends increasing a median 5.4% and EPS 7.0% in 2025. Regulatory mechanisms, including riders and more frequent rate adjustments, can also help mitigate higher financing costs.
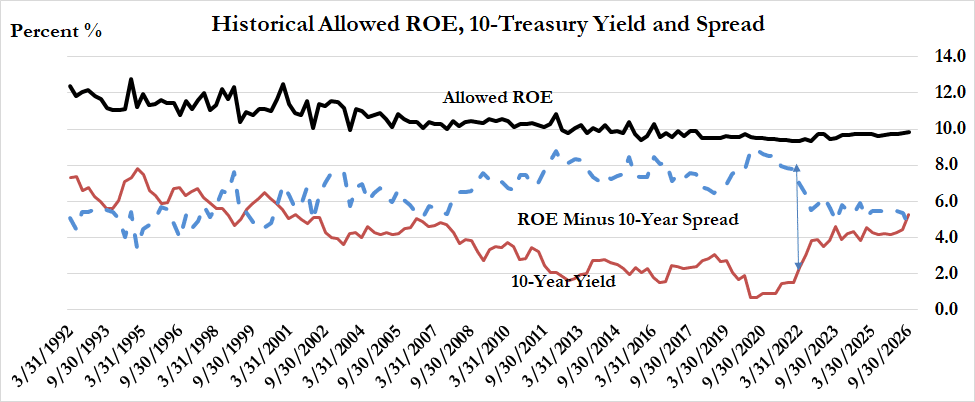
Under the regulatory compact, utilities have an obligation to provide safe and reliable service in exchange for the opportunity to recover prudent investment and earn a fair return on capital. Regulated utility earnings power is largely determined through the rate-setting process, which establishes rate base and authorized returns. Authorized ROEs generally reflect prevailing capital-market conditions and historically have moved in the same direction as interest rates and financing costs. However, ROEs do not automatically reset and typically require a rate case, which can take 6–11 months. Regulators may also be reluctant to materially increase ROEs when customers already face affordability pressures. As a result, authorized ROEs generally adjust to changes in the cost of capital with a lag.
Exhibit 4 PUC’s Reluctant to Raise Profits Despite Higher Treasury Yields
Source: S&P Global; RRA; US Treasury
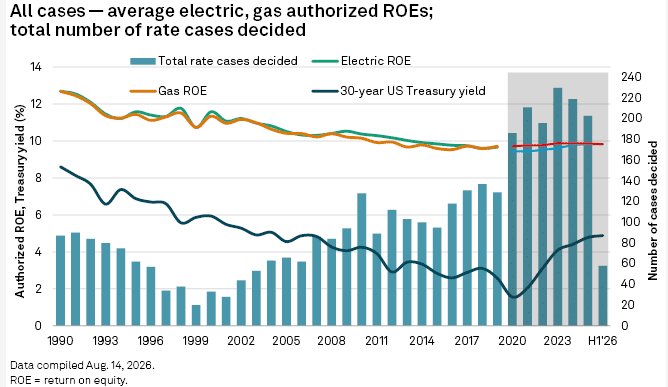
According to RRA, the average authorized electric utility ROE was 9.84% in the first half of 2026, essentially unchanged from 2025 and only about 30 basis points above the roughly 9.5% average in 2022. By comparison, the 10-year Treasury yield has increased roughly 230 basis points, from an average of 3.0% in 2022 to 5.29%. Over the 30-year interest rate decline, ROE’s also adjusted much slower on the way down (see Exhibit 4). RRA reported 25 electric ROE authorizations in the first half of 2026, compared with 86 in full-year 2025. Gas utility ROEs averaged 9.83%, versus 9.87% in 2025.
The relationship between authorized returns and the cost of capital is important as electric utilities undertake a massive capital investment cycle that requires substantial external debt and equity financing. The wider the spread between authorized returns and a utility’s cost of capital, the greater earnings accretion and economic value created by incremental regulated investment. Similarly, higher utility valuations reduce the effective cost of issuing equity, improving the economics of financing new rate-base investment. Higher Treasury yields do not diminish the industry’s underlying growth opportunity. Strong electricity demand and unprecedented infrastructure investment should continue to support attractive rate-base, EPS, and dividend growth.
Looking ahead, the interest-rate headwind could ultimately become a meaningful tailwind. The Fed expects PCE inflation to decline from 3.7% in 2026 to 2.3% in 2027 and move toward its 2% target thereafter. Moderating inflation and energy prices could ease pressure on long-term interest rates, reducing financing costs and supporting a recovery in utility valuations.
The S&P Utility Sector – First Nine Months 2026 Performance
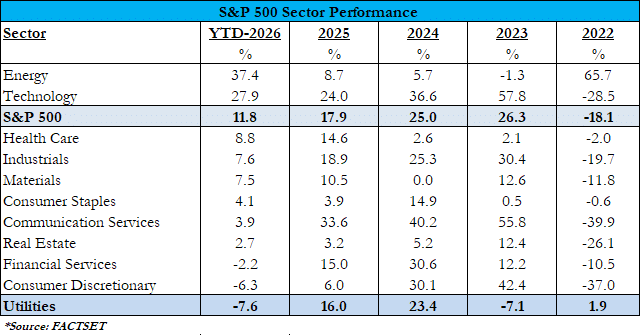
Utilities ranked last among the 11 S&P 500 sectors through September 2026, following double-digit returns in both 2024 and 2025. Despite the selloff, projected annual EPS growth of 6–8% or better remains among the strongest in decades. Utilities also demonstrated resilience during the inflationary, rising-rate environment of 2022–2024, continuing to grow EPS and dividends (see Table 2).
Table 2 Utilities Were Last of Eleven S&P Sectors Year-to-Date 2026
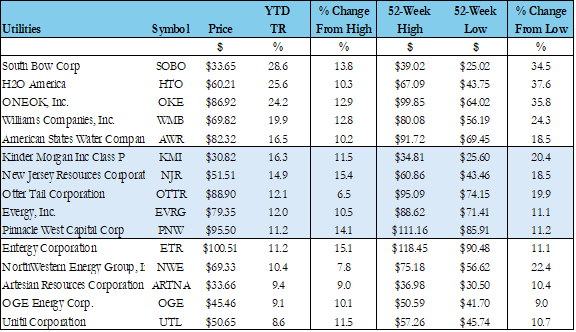
Among the better-performing stocks, South Bow (SOBO), ONEOK (OKE), Kinder Morgan (KMI), Williams (WMB) and New Jersey Resources (NJR) benefited from renewed investor interest in natural gas, expanding behind-the-meter data-center opportunities and improving prospects for pipeline development. Water utilities rebounded following two years of underperformance, while Otter Tail (OTTR) benefited from its strong balance sheet, approximately $7 per share in cash and limited external financing needs. Meanwhile, utilities including Entergy (ETR) and Evergy (EVRG) have raised long-term EPS growth targets to reflect accelerating large-load demand, while Pinnacle West (PNW) has highlighted potential upside. We believe EPS growth expectations will remain a key driver of relative utility stock performance.
Table 3 Best Performing Utility Stocks Year-to-Date
Source: FACTSET
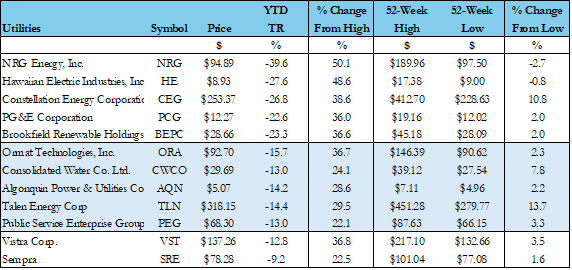
During the first nine months of 2026, many regulated utilities and power companies posted negative returns and traded to new 52-week lows. Among the weaker performers were independent power producers NRG Energy (NRG), Constellation (CEG), Talen (TLN) and Vistra (VST), along with renewable producers Ormat (ORA) and Brookfield Renewable (BEP), following strong performance in 2024–2025 (Table 4). Investors grew cautious that government intervention, new generation capacity and alternative data-center power solutions could constrain elevated profit margins. Wide trading ranges also highlighted the group’s volatility. Utilities with limited data-center exposure generally lagged, while California utilities Edison International (EIX), PG&E (PCG) and Sempra (SRE) faced additional pressure from the lack of meaningful wildfire liability reform.
Table 4 Worst Performing Utility Stocks Year-to-Date
Source: FACTSET
FIRST NINE MONTHS’ DEVELOPMENTS AND NEAR-TERM WATCH ISSUES
Developments during the first nine months of 2026 reinforced the magnitude of the power investment cycle, while shifting attention from enormous data-center interconnection queues to projects with binding electric service agreements (ESAs) and utilities capable of delivering power. Companies positioned to serve massive 1–5+ GW data centers are increasingly distinguishing themselves, with some targeting EPS growth above 8%. Meanwhile, PJM’s supply shortages and rising electricity prices have intensified and arguably mislead to national concerns about affordability. In many regulated states, new large loads benefit existing customers when appropriately structured and supported by adequate generation. Nonetheless, higher interest rates, customer bills and data-center opposition have increased regulatory scrutiny and accelerated adoption of large-load tariffs designed to protect ratepayers. The growing value of existing infrastructure and importance of financial scale are also encouraging consolidation, highlighted by Constellation/Calpine, NextEra/Dominion and GIP/AES
- NextEra/Dominion ($420B EV) — Largest Utility Merger in History: On May 18, NextEra agreed to acquire Dominion for approximately $76 per share, creating an 80% regulated utility powerhouse with substantial data-center exposure. The combination is expected to support NEE’s long-term EPS growth of 9%+. Closing targeted for 2H 2027.
- AES Acquisition ($33.4B EV): On March 2, Global Infrastructure Partners (Blackrock) and EQT agreed to acquire AES for $15 per share, highlighting growing private infrastructure capital interest in large-scale power generation.
- Constellation/Calpine ($29.1B EV): On January 7, CEG completed the acquisition of Calpine, adding 27 GW of gas generation and creating one of the nation’s largest competitive power producers.
- National Fuel Gas ($10.1B EV) On September 17, NFG announced plans to complete its evaluation of a potential separation into two publicly traded companies: a fully regulated natural gas utility, pipeline and storage business with nearly $5 billion in rate base, and an Appalachian exploration, production and gathering company producing 1.1 Bcf/day. The proposed tax-free spinoff is intended to unlock shareholder value through more focused operations, capital allocation and potentially higher valuations, with a board decision expected by October 15, 2026
Texas Hits the Brakes on Its Enormous Data-Center Queue. Governor Abbott directed ERCOT to pause advancement of proposed data-center interconnections while auditing its 474-GW large-load queue, more than five times Texas’ approximately 91-GW summer peak demand. The review will assess project financing, readiness, power and water requirements, and community impacts, with findings expected December 10. Abbott also directed a pause in new state-issued data-center permits pending the review.
While the announcement raised investor concerns that even high-growth Texas was restricting data-center development, we view the review as a long-term positive. Eliminating speculative projects should free up resources and accelerate viable developments backed by committed customers. We expect Texas to remain one of the nation’s strongest markets for data-center growth and associated power infrastructure investment.
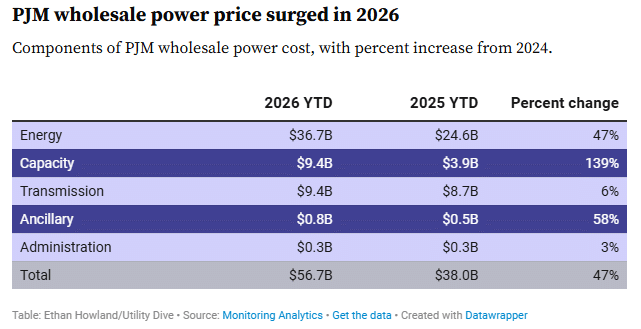
PJM Capacity Shortages Drive Record Prices and Market Reforms. After years of surplus generation and low prices, PJM faces tightening supply as more than 50 GW of generation retired over two decades, while environmental restrictions, opposition to new gas plants and pipelines, permitting delays and lengthy interconnection timelines slowed replacement capacity. Surging data-center demand compounded the imbalance, driving capacity auction prices nearly tenfold in July 2024, from $28.92/MW-day to $269.92/MW-day. The next three auctions cleared at $329, $333 and $325/MW-day, respectively, with the latest falling 6.8 GW short of reliability requirements. PJM’s Market Monitor estimates data centers increased capacity-market revenues by $29.4 billion over four auctions, while wholesale power costs rose 46% through July 2026.
Table 5
FERC’s September 29 order raised concerns over PJM’s proposed Reliability Backstop Procurement, delaying implementation. PJM’s affordability challenges have become a national narrative, although data-center economics vary considerably: new large loads can help spread fixed costs in regulated markets, while constrained competitive markets face higher wholesale prices until new supply arrives. We believe the affordability and politicial environment are less attractive in many of PJM’s states (IL, MD, NJ).
California Wildfire Reform Falls Short: Investors had expected more constructive CA wildfire legislation in 2026, but the August 31 legislative session ended without addressing key shortcomings in the state’s wildfire liability framework, including a more durable Wildfire Fund, reduced insurer subrogation exposure and greater certainty around catastrophic utility liability. Investors now consider a special legislative session by Governor Newsom to address these issues unlikely and hope for a better outcome in the next session. The outcome is particularly important for PG&E (PCG) and Edison International (EIX), where catastrophic wildfire liability remains a significant financial tail risk despite substantial mitigation investment; Sempra (SRE) has less exposure through SDG&E. The continued uncertainty around wildfire liability and the cost of capital contributed to PG&E deferring approximately $2 billion of planned 2027 capital spending and initiating a strategic review.
November 3 Midterm Elections and Affordability Watch: Rising electricity bills and data-center opposition have elevated utility affordability as a political issue, prompting proposed moratoriums, permitting reviews and greater scrutiny of utility returns. However, the regulatory response increasingly emphasizes requiring developers to fund infrastructure rather than prohibiting projects. According to SEPA, 104 approved or proposed large-load tariffs and service rules now span 37 states, up from 41 in July 2025. Political pressure may ease following the elections, particularly as the potential economic benefits of large-load growth—including lower costs for existing customers, job creation and infrastructure investment—become better understood.
HISTORICALLY HIGH EPS CAGR’S; CAN THEY KEEP GOING HIGHER ?
Over the past several years, utilities have steadily raised long-term EPS growth targets to historically high levels. This trend has accelerated over the past two years, with successive earnings seasons bringing higher growth expectations, larger capital investment plans and faster rate-base growth as utilities secure data-center and other large-load customers.
Leading companies, including ETR, NI, NEE, CNP and AEP, now target or anticipate 8–10% or better annual EPS growth. Ironically, this strong fundamental momentum has created a concern among shorter-term investors that the pace of upward revisions may be peaking, even as underlying growth remains exceptionally strong. Management teams also tend to provide conservative guidance, recognizing that growth substantially above historical levels may be difficult to sustain indefinitely.
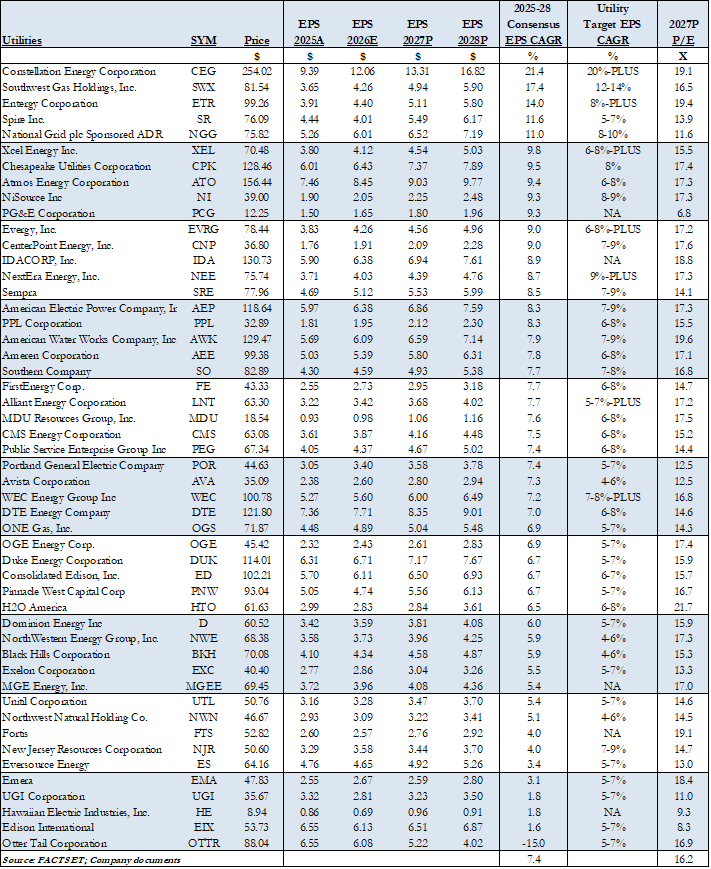
Table 6 compares management’s long-term EPS growth targets with consensus estimates. Utilities continue to convert substantial large-load pipelines into binding electric service agreements (ESAs), providing visibility into additional investment and earnings growth. Rate-base growth among faster-growing utilities now approaches 10% annually, with individual forecasts ranging from approximately 7% to 16%. In 2025, electric and gas utilities delivered strong results, with median EPS increasing more than 7%. We believe the industry is undergoing a sustained step-up in earnings growth, with consensus EPS growth potential of 7% annually and investment visibility extending into 2030–2032, subject to execution, financing and regulatory risks.
Table 6 Utility EPS Growth Rates At Historical Highs
US ELECTRIC DEMAND SURGE IS REAL AND ACCELERATING
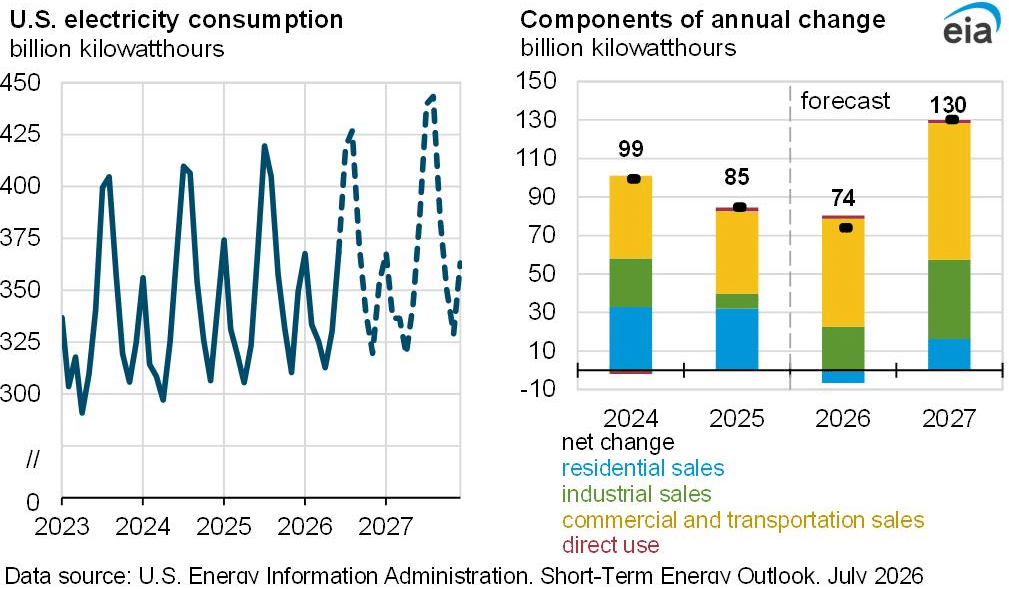
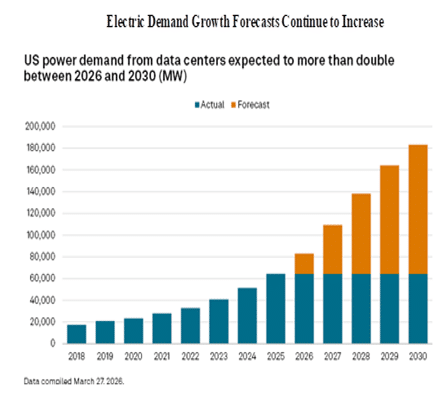
What emerged just a few years ago as the potential for a major increase in electricity demand is rapidly becoming reality, driven primarily by AI data centers, along with manufacturing reshoring, electrification and economic growth. After nearly two decades of flat consumption, the EIA’s September 2026 outlook projects electricity sales growth of nearly 2% annually in 2026 and 2027, reaching a record 4,211 TWh. Importantly, the demand surge is still in its early stages, as increasingly large data-center campuses are developed and brought online in phases, supporting the potential for even stronger long-term electricity growth. Growth will be uneven across regions and individual utilities, with the greatest opportunities in Texas, PJM, the Midwest and Southeast. Utilities with available power, constructive regulation, transmission capacity and the ability to execute quickly should capture a disproportionate share of investment, supporting stronger rate base and earnings growth. Several utilities are forecasting 5%-12% annual retail sales growth over the 2027-2031 period (See Bottoms Up section; pages 13-17).
Exhibit 5 EIA Projects National Electric Demand Growth To Grow 2%, But Many Regions Higher
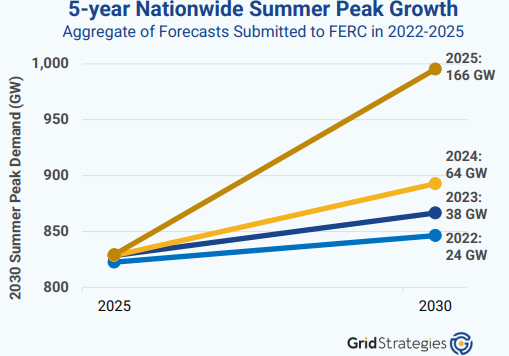
Grid Strategies projects 166 GW of additional peak demand by 2030, approximately 20% above 2025 levels, with data centers accounting for roughly 55% of the increase. McKinsey estimates data centers could drive approximately 75% of U.S. electricity demand growth over the next decade. Importantly, this is no longer simply a story of speculative interconnection queues, as hyperscalers increasingly commit capital, sign electric service agreements and advance projects into construction.
Exhibit 6 Electric Demand Growth Projections Raised Annually Since 2023
HYPERSCALERS (MSFT, META, GOOG, AMZN) SPENDING MORE & MORE
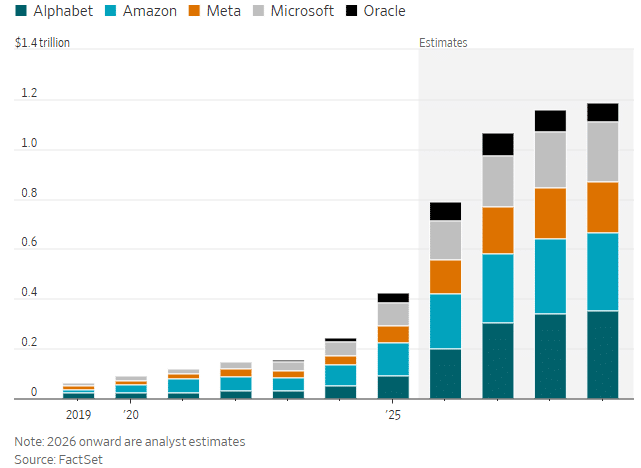
Hyperscaler capital spending continues to accelerate as AI and cloud demand drive unprecedented investment in data centers, computing capacity and supporting infrastructure. Amazon now expects ~$220 billion of 2026 capex, Alphabet $195–205 billion, Meta $130–145 billion and Microsoft approximately $175 billion, while Oracle expects $90–95 billion in FY27. Collectively, these plans imply more than $800 billion of annual capital investment. Several companies report that AI and cloud demand exceeds available capacity, suggesting the infrastructure buildout should extend for several years. See Exhibit 7.
Exhibit 7 Significant and Growing Hyperscaler Investment
DATA CENTERS GETTING BIGGER AND BIGGER (ETR-META Hyperion – 5 GWs)
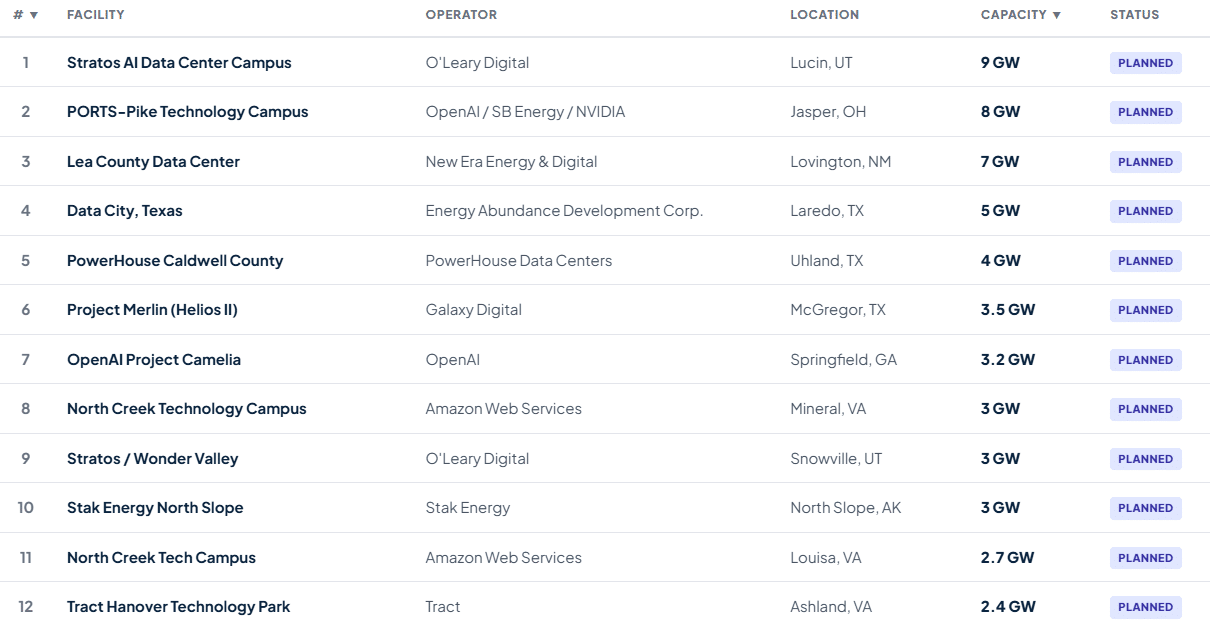
AI data centers are rapidly evolving from hundreds of megawatts to massive 1–5+ GW campuses, with electricity requirements comparable to those of small cities. Table 7 is not intended to be exhaustive, but rather to illustrate the unprecedented scale,
Table 7 Selected Under Construction Mega Data Centers
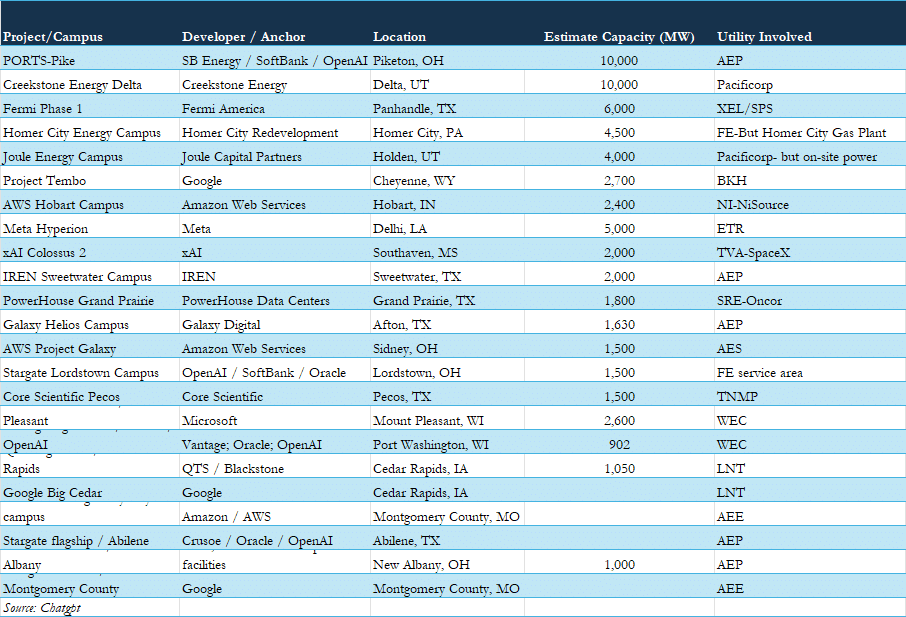
number and geographic reach of these developments. Table 8 is not meant to be exhaustive but simply illustrate the magnitude of the proposed size. Many campuses are being built in phases, with power requirements expected to increase substantially over time. This fundamental shift in data-center scale is driving enormous investment in new generation, transmission, substations and behind-the-meter power infrastructure, creating significant long-term growth opportunities across the sector.
Table 8 Selected Mega-Data Centers Being Planned
Source: Electric Choice website
LIKE IT OR NOT: DATA CENTERS ARE COMING! MORE AND MORE!
Data centers already account for an estimated 4–5% of U.S. electricity consumption, exceeding 10% in several states and 25% in Virginia, the nation’s largest data-center market. According to the DOE’s June 2026 Data Center Usage Report, data centers could consume 11.8% of U.S. electricity by 2030, with estimates ranging from 9.5% to 15.3%. This represents a substantial increase from the DOE’s 2024 report, which projected a 6.7–12.0% share by 2028.
Exhibit 8 Exhibit 9
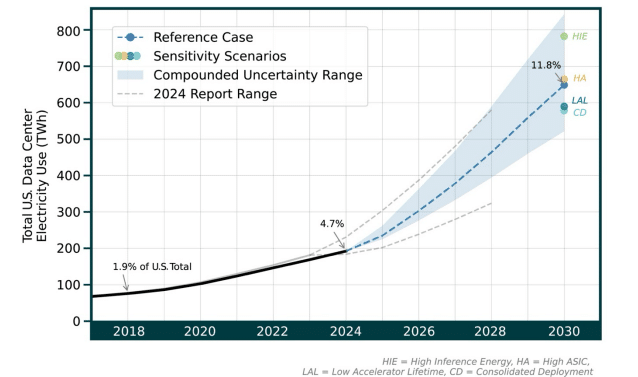
US DOE Data Center Usage Report: 2025 Update (June 2026)
DATA CENTER BACKLASH IS SLOWING—BUT NOT STOPPING—DEVELOPMENT
Growing Public Opposition Creates New Challenges for Data-Center Development. Concerns over electricity affordability, water consumption, land use and grid reliability are intensifying. A September 2026 Pew Research survey found that 60% of Americans would be uncomfortable with a data center nearby, while 50% believe data centers negatively affect household electricity costs, up from 38% in January. Separately, a University of Massachusetts Amherst poll found 65% oppose data-center construction in their communities.
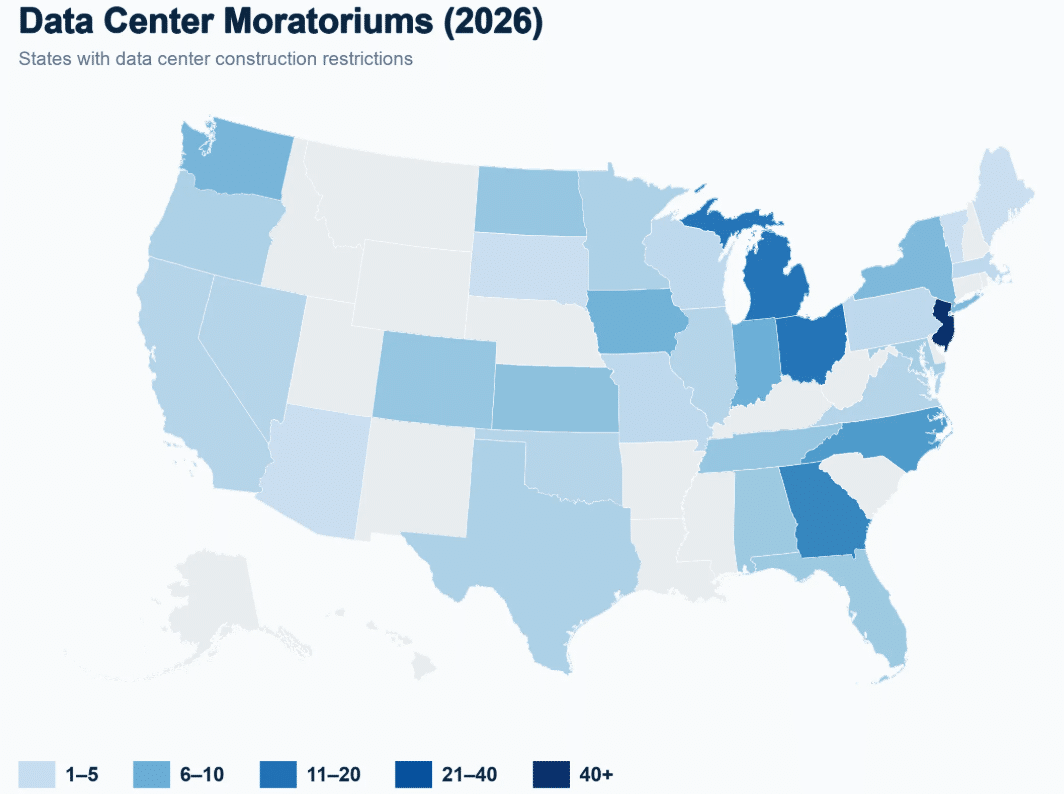
Opposition is increasingly translating into project delays, moratoriums and stricter permitting requirements. According to Data Center Watch, at least 120 projects representing $198 billion in investment were blocked or delayed during the first half of 2026. More than 300 data-center bills were introduced during the first six weeks of the year, including proposed statewide moratoriums in 14 states. Importantly, data-center development is fundamentally a local issue: even in supportive states, individual municipalities can restrict or block projects. New York imposed a statewide moratorium on new hyperscale developments in July, Pennsylvania is pursuing stronger permitting and infrastructure-funding requirements, and Texas is reviewing its enormous, largely speculative interconnection queue.
While these obstacles may delay individual projects, we do not believe they will derail the broader investment cycle. Greater awareness of closed-loop cooling, developer-funded infrastructure and local economic benefits could help ease opposition. Ultimately, we expect development to concentrate in receptive communities and states, favoring well-capitalized projects with firm commitments and clear economic benefits.
Exhibit 10 Data Center Backlash (Number of localities by state with restrictions)
Source: Electric Choice website
Large Load Tariffs Designed to Protect Customers
Utilities and regulators are already addressing many of these concerns through large-load tariffs designed to protect existing customers from infrastructure costs, require hyperscalers to pay their fair share, and potential stranded investments. Definitions of “large load” have increased, from around 5–25 MW a few years ago to 50 MW or more today, reflecting the much larger scale of modern data centers. These tariffs have a few key characteristics:
- Higher upfront costs: Large users pay for the grid upgrades (new transmission or substations) needed to serve them.
- Long-term commitments: Contract lengths and guarantees that the customer will pay for the power even if not used.
- Risk protection: If the project is delayed, scaled back, or canceled, the customer may owe fees or penalties.
- Operational requirements: Some include ramp-up schedules or incentives to reduce usage during peak times.
According to SEPA, 104 tariffs and service rules are approved or proposed across 37 states, up from 77 earlier this year. These increasingly require long-term contracts, minimum payments, upfront infrastructure funding, collateral and exit fees. While additional political scrutiny may delay projects, many of the financial protections being demanded are already incorporated into utility tariffs.
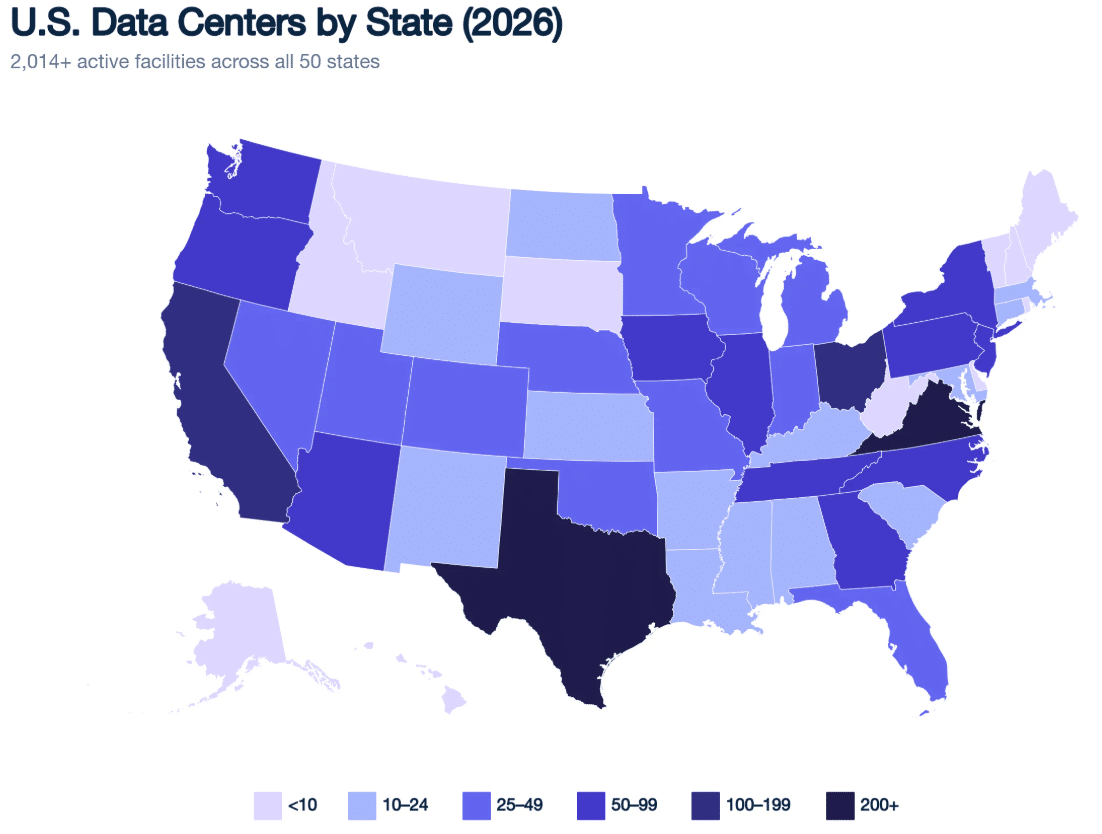
Importantly, the backlash has not stopped development. CBRE reports a record 7.5 GW of data-center capacity under construction across the eight largest North American markets in 1H26, up 25% year-over-year, with more than 80% already preleased. Thus, speculative projects are increasingly being filtered from development queues while well-capitalized hyperscaler-backed projects continue to move forward. We expect development to concentrate in states with available power, constructive regulation and efficient permitting. Utilities capable of delivering power quickly while protecting existing customers should capture a disproportionate share of future investment.
Exhibit 11 Huge Data Centers Scheduled for 2026-2027
Source: Electric Choice website
BOTTOMS UP-UPDATE: DATA CENTER/LOAD GROWTH UTILITIES
The following company updates illustrate how utilities are converting large-load demand into electric service agreements, capital investment and higher earnings growth targets. Importantly, the opportunities vary significantly by company, depending on contracted demand, available generation, regulatory support and financing requirements.
ENTERGY (ETR)- Outlines “13% EPS Growth” (2025-30)-Mega-Data Centers (META, GOOG, AMZN)
Entergy targets greater than 8% annual EPS growth through 2035, supported by substantial industrial and data-center investment across Louisiana, Arkansas, Mississippi and Texas. Its 2030 EPS midpoint of $7.20 implies approximately 13% annual growth from the 2025 base. The company expects roughly 16% annual rate-base growth through 2030, with rate base increasing from approximately $46 billion in 2025 to $97 billion. Entergy forecasts approximately 9% annual retail sales growth, including 16% industrial growth.
Entergy has 6 GW under electric service agreements, with another 7–12 GW of potential demand. Its largest development is Meta’s Hyperion campus in Richland Parish, Louisiana, which could require up to 5 GW of power and approximately $27 billion of data-center investment. The associated infrastructure program includes approximately 5.2 GW of gas generation, 240 miles of transmission, battery storage, nuclear upgrades and renewable generation. Under the announced arrangements, Meta is expected to fund the infrastructure costs attributable to its project. Additional developments involving Amazon in Mississippi and Google in Arkansas reinforce Entergy’s position as a major beneficiary of the power investment cycle.
AMERICAN ELECTRIC POWER (AEP) – Greater Than 9%- EPS CAGR Through 2030; More on 3Q Call?
AEP’s official long-term EPS target is 7-9% annually but expects to deliver greater than 9% through 2030 driven by a $78 billion capital program (potentially $10 billion more), which results in 11% rate base CAGR. AEP’s pipeline of large load opportunities totals an enormous ~190 GWs (current peak demand is 37 GWs) with ~63 GWs of contracted load in its plan by 2030. AEP’s core growth states are TX, IN, OH, and OK where it expects growth to ramp higher beginning in 2028. Contracted customers include GOOG (IN, WV), Amazon (LA, OH), MSFT (IN), META (OK), Stargate (TX), SB Energy (OH), Cheniere (TX) and NUCOR (WV). AEP is the nation’s largest transmission owner (44,000miles) with significant 765kV buildout and has secured over 10 GWs of gas fired turbine capacity from major manufacturers. AEP more focused on transmission interconnections forecasts $16 billion in cost offsets for existing customers over the life of its contracted large load contracts.
NEXTERA ENERGY (NEE) – Mega-Merger Leads to 9%-Plus EPS CAGR;
NextEra’s proposed acquisition of Dominion Energy is expected to increase its long-term adjusted EPS growth target from 8%+ standalone to 9%+ for the combined company through 2035, with closing anticipated in 2H27. The merger would significantly expand NextEra’s regulated utility operations and data-center exposure, particularly in Northern Virginia and PJM. NextEra also has a substantial independent generation development pipeline spanning renewables, battery storage, natural gas and nuclear power. Its data-center hub strategy seeks to pair large customers with dedicated generation and supporting infrastructure. NEE’s October 1 presentation highlighted more than 20 GW of recently advanced power projects. On September 30, the U.S. and South Korea announced Project Star, a $22.3 billion development in Texas featuring 6.47 GW of gas generation supporting an adjacent 5-GW data-center campus, with surplus power available to ERCOT. Initial operations could begin in 2029. The announcement follows two U.S.–Japan-backed gas projects totaling up to 10 GW in Texas and Pennsylvania, supported by an initial $3.3 billion funding commitment. NextEra is also advancing its 4.6-GW Paducah Energy Hub, including 2 GW of gas generation and 2.6 GW of battery storage. NEE recontracted 1 GW at Point Beach, contributing an estimated $0.21 in average annual adjusted EPS, secured up to $1.9 billion in DOE loan support for restarting the Duane Arnold nuclear plant, and formed a 49%-owned joint venture with Chesapeake Utilities to develop a $1.2 billion Florida gas pipeline. Combined with Dominion’s regulated utility platform, these developments could significantly expand NextEra’s long-term investment and earnings opportunities.
DOMINION ENERGY (D) D targets 5-7% EPS CAGR from 2025-2030 (with a bias to upper half 2028-30) and is currently the largest data center provider in the US (with ~7 GW in service). Data centers represented 28% of D’s Virginia electric sales in 2025, and its pipeline totals 51 GW, including 10.4 GW under electric service agreements, 11.1 GW under signed construction agreements, and 29.5 GW in substation engineering studies. It emphasized that data center-driven load growth in Northern Virginia shows no signs of slowing with over 11-GW’s contracted and 51 GW’s in queue. Dominion 5-year capital plan to $64.7 billion.
AMEREN (AEE) Third Quarter Guide Up Coming? (Amazon & Google = $25 billion)
On its upcoming October 2026 third quarter call, we expect AEE to raises/extend its EPS outlook. Recent electric service agreements (ESA’s) represent tailwinds to AEE’s to nearly 8% EPS CAGR. AEE’s 2026 EPS guidance is $5.25-5.45 and long-term growth is driven by the $60 billion (5-year) capital program and 10.6% rate base CAGR. AEE has added to its potential rate base growth further supporting long-term EPS growth at the upper end of its 6-8% CAGR target. In 2026, AEE has executed 2.8 GWs (600-MWs since February) of large load electric service agreements (ESAs) in MO, signed an additional 2.2 GW of large-load customers and secured $700 million of new MISO transmission projects.
On June 15, 2026, Amazon announced plans to develop a $10 billion data center campus in Montgomery County, MO Amazon and will pay for 100% of the costs to provide electric service, including all costs with connecting to the energy grid. On May 20, 2026, the MO Governor’s office announced that Google plans to build a $15 billion data center campus in Montgomery County, MO under an ESA with AEE. Under Missouri SB 4, Google will fund 100% of power and incremental infrastructure costs tied to its operations. Google has contracted for over 1 GW of new generation in MO, while AEE is developing an additional 500 MW. AEE’s guidance assumes 1.2 GW of new MO demand by 2030 and annual MO sales growth CAGR of 6.2%. The 2.8 GWs of executed ESAs represents upside to current sales and earnings forecasts. Beyond signed ESAs, the company maintains a strong pipeline of large-load opportunities. AEE-MO has 3.4 GW of construction agreements (including ESAs), while Ameren Illinois has 850 MW.
WEC ENERGY GROUP (WEC)-Third Quarter Guide Up Coming–
WEC targets an above-average long-term EPS CAGR of 7-8% (upper half 2028-2030) with 2028-2030 annual electric demand growth forecast to 6.0-8.0%, from 0.7% in 2025. Over 2026-2030, WEC expects to add 3.9 GW (45% of current peak load) of electric demand resulting in 2028-30 sales growth of 6-8% per annum (retail electric sales grew 1.1% in 2025. The April PSCW approval of large-load tariffs allows WEC to earn a 10.48-10.98% ROE (57% equity) on data center infrastructure investment. WEC plans to serve the $20 billion MSFT data center (2.6 GW) on 2.5 acres in Mt Pleasant, WI (Phase one $3.3 billion-early 2026/Phase 2-$4 billion scheduled for 2027) and the $8 billion Vantage Data Centers (1.3 GW) data center (Oracle) on 1,900 acres in Port Washington, WI. The Port Washington data center could reach full capacity of 3.5 GW, but 1.3 GW is planned for 2029 with the first phase 1 on-line in 2027. By 2030, 15% of asset base will be to serve large-load customers. On its upcoming third quarter 2026 call, WEC expects more announcements and noted that the existing “data-center-approved” acreage could be expanded by another 4-5 GW (1 GW is $2.0-2.5 billion).
PINNACLE WEST (PNW) – More than Data Centers in the “Silicon Desert”; TMSC $165 billion Fab Facilities
PNW targets 5-7% annual EPS CAGR driven by 1.5-2.5% customer growth, and 5-7% long-term sales growth (4-6% is C&I customers). The Phoenix AZ metropolitan area continues to attract semiconductor manufacturing, data centers, and other advanced industries. The AZ utility plans to add 4.5 GW of large-load capacity by 2030, with an additional 20 GW of projects in the interconnection queue. Taiwan Semiconductor Manufacturing Company (TSMC) is investing $165 billion across six fabrication plants, two packaging facilities, and an R&D center, supporting an estimated 70,000 jobs. The region—often referred to as the “Silicon Desert”—is also emerging as a major data center hub, with projects including Meta’s Mesa campus, Google’s new Mesa facility, 5C Data Centers’ 140,000-square-foot Phoenix site (2025), a $20 billion campus in Buckeye, and Vermaland’s planned $33 billion data center park along the Phoenix–Tucson corridor. By 2028, APS plans to add nearly 7.3 GW of new resources to support rapid demand growth. This includes development of the 2 GW Desert Sun gas generation plant in Gila Bend, AZ, with Phase 1 targeted for late 2030. Energy Transfer’s Transwestern Desert Southwest gas pipeline expansion is expected to enter service in 2029, with Desert Sun serving as an anchor shipper.
CENTERPOINT ENERGY (CNP) – Texas Continues to Grow Gangbusters
CNP targets 7-9% EPS CAGR through 2035 (high-end over 2026-28) driven primarily by Houston load growth and higher capital investment (11% rate base CAGR). Houston Electric has secured 12.2 GW of committed industrial load and expects 8 GW of data center demand (including 3.5 GW under construction) to be energized by 2029. Peak load in the Houston service territory is projected to increase 50% to ~31 GW by 2029 and reach 42 GW by 2035. Growth is driven by diversified demand across residential (~2% annual growth), data centers, advanced manufacturing, life sciences, logistics, energy exports, and electrification of the Port of Houston (more than a dozen customers and nearly 20 projects). The company estimates $4 billion of customer savings over the next decade from scale benefits associated with load growth. Additional investment opportunities, including downtown Houston redevelopment, are not yet included in the current capital plan. In Indiana, CNP expects a single large-load project in its Southern Indiana service territory that would represent the largest customer in that region and could generate incremental growth while providing approximately $250 million in customer savings.
SOUTHERN COMPANY (SO) Georgia On My Mind; 10% Sales CAGR; 75-GW Large-Load Pipeline;
SO targets long-term EPS growth of 7-8% (8-9% EPS growth through 2028). Strong growth is driven by 9% rate base growth from its $81 billion 5-yearcapital plan and strong load growth. Over 11 GW of contracted large load customers and is finalizing another 6 GW of additional agreements (and another 6 GW in late stages) in near term across eight projects in Alabama and Georgia. Over 75 GW of prospective large load pipeline provides robust opportunity for continued progress. The utility forecasts 10% sales growth in 2026-30 and 13% in GA over same period. In addition, SO expects to add at least 10 GW of new generation. SO has rate freezes (AL 2026-27) and GA (2026-28).
NISOURCE (NI) 9-10% annual EPS CAGR over 2026-2033; AMZN Provides Big Cost Savings
NI targets 9-10% annual EPS CAGR over 2026-2033 (6-8% annual EPS CAGR over 2026-2030) based on 9-11% annual rate base CAGR over 2026-2033 (8-10% annual rate base CAGR over 2026-2030). NI ‘s 2026-2030 capital plan totals $28.6 billion capital, including $7.6 billion at the non-regulated Genco (generation company). NI formed a non-regulated GENCO designed to serve mega-load customers, including a mega Amazon data center. NiSource begins serving Amazon on Jan. 1, 2027, with load ramping to nearly 3 GW by the end of 2032. GenCo will build two 1,300-MW, combined-cycle gas plants and 400 MW of battery storage.
In addition, AMZN will pay a system charge under the special contract which will return $1.4 billion (raised from $1.25 billion/$124 per annum) to existing customers. NIPSCO residential customers are expected to receive a monthly bill credit beginning in 2027, reaching $7-9 per month in 2033. On the first quarter call, NI added a 300-MW GOOG contract (commences will in the summer of 2026 and ramps to full demand by 2030). NI (via GENCO) has signed ~4 GW of large load capacity, actively negotiating another 3 GW and is in discussion with 2 GW of opportunities in its pipeline by 2035.
XCEL Energy (XEL) – Winning in the Midwest; More to Come
XEL remains confident in its ability to deliver 6% to 8-plus percent long-term EPS growth and expects to deliver 9% EPS growth on average through 2030. XEL raised its target to “6-8%-Plus” EPS, from “6-8%” to reflect 11% rate base growth driven by a $60 billion 2026-30 capital plan (with $10 billion upside) to support 20 GWs of data center pipeline, including 2 GW under construction and 6 expected by 2027. XEL highlights that 1 GW datacenter is equal to 1 million customers, ~ 3 GWs of renewable and firm dispatchable energy, $6-8 billion of investment requirement, $0.9-1.0 billion of incremental revenues and 10% customer savings.
IDACORP (IDA) – Boom Town Boise
IDA does not provide EPS growth targets but expects an industry-leading 16.7% rate base CAGR 2026-30. The most recent integrated resource plan (IRP) affirmed a 5-year retail sales CAGR of +8.3% (annual peak +5.1%), but growth will likely be higher. IDA management explained that the pipeline of prospective customers (incremental to the IRP) exceeds IDA’s record peak load of 3,800 MW’s. Micron is undergoing a major expansion of its Boise HQ’s and new $15 billion microchip fab facility and has plans for a second fab facility of equal size. Other new customers include a Meta data center, $415 million Lamb Weston potato processing facility, Chobani expansion and $225 million Tractor Supply facility. In 2026-27, IDA benefits from capacity ramps at Micron and Meta. Management also noted that its ability/capacity to serve is maxed out and customer requests exceed the current 3,800 MW system peak. The 2026-30 capital budget totals $7.1 billion (2025-29 was $5.8 billion), exclusive of resources to be procured through upcoming 2028–2029 request-for-proposals process. The company’s regulated rate base is projected to more than double from $5.3 billion in 2025 to $11.3 billion by 2030, supported by annual capital outlays of roughly $1.4 billion. The current plan excludes 2032 RFP wins and some later-stage pipeline projects.
PPL CORP (PPL) –High-end of 6-8%, but could go higher
PPL targets 6–8% annual EPS growth through at least 2029, with performance expected near the upper end during 2027–2029. Its $23 billion 2026–2029 capital program supports approximately 10% annual rate-base growth, driven by infrastructure investment and increasing large-load demand in Pennsylvania and Kentucky. PPL Electric has identified an advanced Pennsylvania data-center pipeline exceeding 30 GW, including more than 11 GW under electric service agreements and approximately 6.5 GW associated with projects under construction. Kentucky’s development pipeline totals approximately 13.7 GW, including 11.6 GW of data-center opportunities. PPL also owns 51% of Invitium Energy, its joint venture with Blackstone Infrastructure, which is developing long-term contracted generation opportunities in Pennsylvania. Invitium has identified sites capable of supporting 8–14 GW of generation, secured positions in PJM’s interconnection queue and reserved substantial gas turbine capacity. Management expects to pursue commercial agreements before committing to construction. Additional regulated generation and Invitium investment could extend PPL’s growth beyond its existing plan, while the company seeks to preserve credit quality and maintain its financing targets.
EVERGY (EVRG) – Kansas City’s Chief Customers Include GOOG, META & Panasonic Evergy targets 6–8%+ annual EPS growth from its 2026 guidance midpoint, with annual growth expected to exceed 8% during 2028–2030. The company has signed approximately 2.5 GW of large-load agreements involving customers including Google, Meta and other major developers. Its broader prospective pipeline extends beyond 11 GW, providing substantial opportunities for additional generation and transmission investment. Evergy expects large-load demand to ramp significantly through 2030, supporting accelerated electricity sales and rate-base growth. The company’s $21.6 billion 2026–2030 capital plan supports approximately 11.5% annual rate-base growth. Planned resources include new gas-fired generation and renewable projects, with further capacity under evaluation. Additional customer agreements and investment could extend Evergy’s elevated growth trajectory beyond the current forecast.
ALLIANT ENERGY (LNT) ) Iowa is proving to be data center hub Alliant maintains its 5–7%+ long-term EPS growth target and expects annual growth of at least 7% during 2027–2029. The company is advancing approximately 3 GW of contracted data-center demand across Iowa and Wisconsin, representing a substantial increase relative to its existing peak load. Major projects include developments associated with Google and QTS in Cedar Rapids and Meta in Wisconsin. Construction is underway on several projects, with demand expected to ramp through 2030. Additional prospective demand could provide further investment opportunities. Alliant’s $13.4 billion 2026–2029 capital plan includes gas generation, renewable energy, battery storage and distribution infrastructure. Management anticipates annual rate-base growth above 12%, reflecting the scale of investment required to serve new customers.
DTE ENERGY (DTE)
DTE targets 6–8% annual EPS growth through 2030 and expects performance toward the upper end of that range. Large data-center developments, including projects associated with Oracle and Google, provide opportunities to increase electricity sales and infrastructure investment. Management anticipates approximately 8% or better rate-base growth, with incremental demand potentially supporting earnings growth above its current target. The extent of that upside will depend on final customer commitments, infrastructure requirements and regulatory approvals. DTEexpects the top-end of the 6-8% EPS growth target through 2030 and rate base growth of ~8%+, Anchor data center customers include ORCL (1.4 GWs) and GOOGL (1.0 GWs)
BLACK HILL CORP (BKH) Wyoming is also a data center region
Black Hills targets 4–6% standalone EPS growth, while its proposed combination with NorthWestern Energy is expected to support a 5–7% long-term growth framework after closing. Management anticipates first-year earnings accretion from the transaction. Wyoming, particularly the Cheyenne area, is emerging as a potential data-center development market. Black Hills is advancing a hyperscale project of approximately 1.8 GW and pursuing additional large-load opportunities, including developments associated with Microsoft and Meta. Customer-funded equipment deposits and large-load tariff protections could help reduce financial exposure during development. The broader Wyoming pipeline offers potential earnings upside, although project commitments, power supply arrangements and construction schedules remain important uncertainties.
SEMPRA (SRE) — Texas Drives Growth as the Portfolio Simplifies
Sempra targets 7–9% annual EPS growth and approximately 11% rate-base growth, supported by a record $65 billion 2026–2030 capital plan. More than 95% of planned investment is regulated, with nearly 60% directed toward Texas. Sempra is also simplifying its portfolio through the proposed sale of an additional interest in Sempra Infrastructure Partners to a KKR-led consortium. The transaction would reduce exposure to nonregulated infrastructure and allow capital to be redeployed toward its U.S. utilities. Oncor is Sempra’s principal growth engine. Its $47.5 billion 2026–2030 capital plan includes substantial transmission and distribution investment, with approximately $10 billion of additional identified opportunities. ERCOT transmission expansion and large-load development could support further growth. Oncor has identified approximately 44 GW of large-load requests potentially qualifying for ERCOT’s Batch Zero process, although the eventual pace of development remains uncertain. Texas’ growing demand for electricity, combined with the need for major transmission investment, provides Sempra with substantial long-term investment opportunities.
RECORD INVESTMENT (RATE BASE GROWTH) LEADS TO EPS GROWTH UPDATED
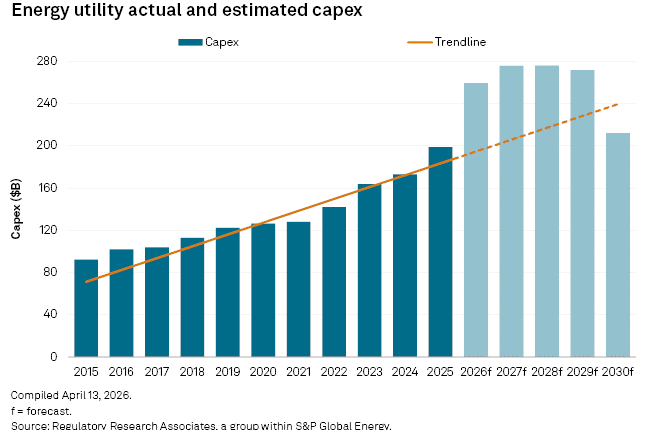
Over 2026–2030 period, electric and gas utility capital expenditures will likely continue to rise at near double-digit rates driven by a significant build-out of new generation and transmission capacity to meet continuing data center growth as well as grid reliability and resiliency and the need to connect to new resources. For the 2026–2030 period, aggregate energy utility spending for 46 companies tracked by Regulatory Research Associates (RRA) is forecast at a record $1.295 trillion, versus $1.169 trillion in its December 2025 forecast.
In 2026 and 2027, S&P Global Market Intelligence projects utility capital expenditures will rise 30% to $259.1 billion ($227.8 billion) and another 6% to $275.6 billion ($233 billion), respectively, with continued growth over the next decade driven by rising demand and the need for new baseload generation. Capital spending for this peer group of 44 North American electric utilities increased 15% nominally in 2025 compared with the same period in 2024. Please note that this capital investment does not reflect hyperscalers paying their fair share, municipal and co-op spending and behind-the-meter spending.
Full-year 2025 capex is projected to rise 19% year over year (16% real) to $215 billion, up from $173 billion in 2024, $164 billion in 2023, and $146 billion in 2022, implying a 10.5% three-year CAGR. This represents a sharp acceleration from the 7% nominal (4% real) CAGR of the prior decade, which was driven by climate policy, net-zero targets, fossil-fuel retirements, renewable development, infrastructure replacement, disaster recovery, and grid hardening. More recently, utilities have pushed capital budgets and rate base growth to historic highs to meet surging demand, including long-term power contracts with mega-cap technology companies for AI data centers that can consume energy at the scale of small cities.
Nearly 70% of North America’s grid infrastructure is more than 25 years old (DOE), driving investment in system replacement, renewable mandates, modernization, and weather resilience. Investment spans all major areas of the system, including distribution (33%), generation (24%), transmission (20%), gas-related infrastructure (14%), and other (8%).
Exhibit 12 Record Capital Investment
US POWER EQUATION – CAN SUPPLY KEEP UP WITH DEMAND?
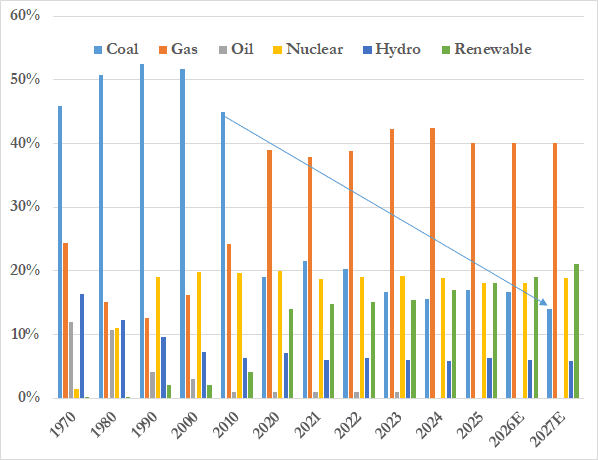
As December of 2025, U.S. power capacity totaled ~1,353 GW: 571 GW gas, 161 GW wind, 165 GWs of solar, 19 GW of geothermal/biomass, 193 GW coal, 102 GW hydro, 105 GW nuclear and 40 GW’s of other. (See Exhibit 13) In 2024, natural gas represented 42% of output, nuclear 19%, coal 16%, wind 11%, hydro 6% and solar 7%. In 1985, coal accounted for over 50% of U.S. electricity generation. Since 2010, the U.S. has retired approximately 105 GW of coal-fired power generation capacity with another 80 GW more to retire by 2030 (~10 GW being converted to natural gas). Over the past few years, new capacity additions have been dominated by renewables.
Exhibit 13 US Power Generation Fuel Mix-Coal Declines
Source: EIA Energy Outlook
New Power Generation: Navigating a Changing Energy Landscape
The U.S. is entering a major power-generation investment cycle as electricity demand accelerates after nearly two decades of limited growth. Near-term capacity additions remain dominated by solar, wind and battery storage, supported by state mandates, corporate clean-energy commitments, tax incentives and relatively short construction timelines. However, growing demand for reliable, around-the-clock electricity, particularly from AI data centers, is accelerating investment in natural gas generation and interest in nuclear power. We expect U.S. power development to unfold in three overlapping phases:
- 2024–2030: Solar, wind and battery storage dominate new capacity additions, benefiting from shorter development timelines and existing tax incentives.
- 2028–early 2030s: Natural gas generation accelerates as turbine manufacturing capacity expands and projects currently in development enter service.
- Early–mid 2030s: Nuclear development gains momentum through reactor restarts, uprates, small modular reactors and potentially new large-scale plants.
Near-Term Capacity Additions Remain Dominated by Renewables
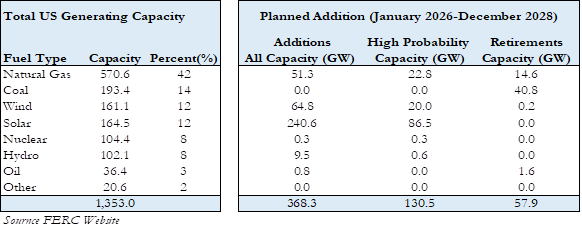
FERC identifies approximately 130.5 GW of high-probability generating capacity additions through December 2028, led by solar (87 GW), natural gas (23 GW) and wind (20 GW). These additions would be partially offset by approximately 58 GW of retirements, primarily coal (41 GW), older natural gas plants (15 GW) and oil-fired generation (2 GW). The figures exclude battery storage and behind-the-meter generation, both increasingly important sources of capacity for data centers. Although renewable capacity will dominate near-term additions, natural gas remains essential to reliability. The EIA projects that gas will maintain approximately 40% of U.S. electricity generation through 2027, with actual gas-fired generation increasing approximately 2% in 2026 and 1% in 2027. Solar generation continues growing rapidly, but its intermittent output reinforces the need for dispatchable resources and energy storage.
Table 9 US Plans to Add 131 GW’s of Primarily Solar to Existing 1,350 GWs (Installed)
Natural Gas Development Pipeline Expands Dramatically
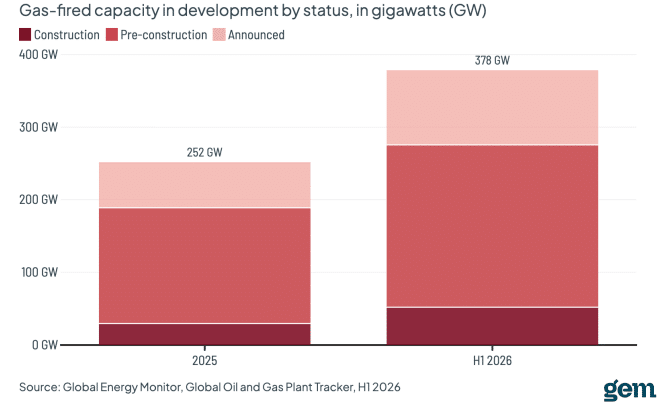
After years of limited investment, natural gas generation is experiencing a resurgence. According to Global Energy Monitor (GEM), the U.S. pipeline of announced and developing gas-fired projects increased approximately 50% in six months, from 252 GW to 378 GW. Texas accounts for nearly one-third of the total, with 122 GW in development, including approximately 77 GW intended to serve data centers directly.
Importantly, actual construction activity is also accelerating. GEM reports that U.S. gas-fired capacity under construction increased 76% during the first half of 2026 to approximately 52 GW, including 16.9 GW intended to power data centers. This represents more than twice the capacity reportedly under construction in China. However, the enormous development pipeline should not be confused with capacity certain to enter service. The costs of new highly efficient (low heat rate -6500/BTU) combined cycle generation has risen from $2,000 kw to over $3,500/kw and the demand for turbines has created a long waitlist. Turbine manufacturing constraints, multiyear equipment lead times, financing requirements, permitting delays and local opposition will prevent many announced projects from advancing on their original schedules.
These constraints are also changing technology choices. Developers increasingly favor reciprocating engines and smaller aeroderivative turbines that can be manufactured and installed more quickly than large combined-cycle plants. GEM estimates that planned engine capacity more than doubled in six months, from 31 GW to 67 GW, including approximately 45 GW associated with data-center developments. While these alternatives can provide faster access to power, they generally sacrifice some efficiency compared with modern combined-cycle generation.
Exhibit 14 U.S. Natural Gas Generation Development Pipeline
Policy Changes Favor Reliability and Dispatchable Generation
Recent federal policies supporting coal-plant extensions, natural gas infrastructure and nuclear development are slowing the transition toward net-zero emissions while placing greater emphasis on reliability and affordability. Offshore wind faces particularly significant regulatory and permitting challenges, although several advanced projects, including Vineyard Wind 1, Revolution Wind, Coastal Virginia Offshore Wind, Sunrise Wind and Empire Wind, still proceed toward completion.
Nuclear power provides 24/7 zero-carbon generation, increasingly valued by policymakers and hyperscalers. While new large-scale reactors are unlikely before 2035, momentum is building through restarts, life extensions, and small modular reactors (SMRs). Near-term restarts include Palisades, MI (800 MW, restarted 2025). Policy support—including NRC permitting streamlining, domestic fuel supply measures, and international partnerships—is accelerating long-term capacity growth. Corporate demand is reshaping the market: Amazon, Microsoft, Google, and Meta are pursuing PPAs to meet 24/7 carbon-free targets. Landmark deals include:
- Amazon & Talen Susquehanna (PA): 1,920 MW through 2042, transitioned to front-of-the-meter for PJM delivery.
- Microsoft & CEG Three Mile Island (PA): 20-year PPA for the 820 MW Crane Clean Energy Center restart by 2028.
- Meta & Clinton Nuclear (IL): 1,092 MW PPA starting 2027, a 30 MW uprate, and SMR potential.
- Amazon & CEG (MD): 190-MW uprate of Calvert Cliffs with AMZN contract for 690- MW
- Google & NEE: Duane Arnold, IA (615 MW, slated restart by 2029);
Most U.S. nuclear plants (94) are regulated, limiting hyperscaler procurement to 23 merchant reactors in deregulated markets like PJM. Rising demand and limited unregulated supply are increasing their strategic value.
Government and Foreign Investment Accelerate U.S. Power Generation
The White House and DOE are making expanded power generation a national priority, promoting natural gas, nuclear and energy storage through federal initiatives, permitting reforms and strategic investment agreements with Japan and South Korea. These efforts are increasingly focused on meeting AI data-center demand, improving grid reliability and attracting private and foreign capital. NextEra Energy’s rapidly expanding federal development pipeline illustrates how government-backed investment could create significant growth opportunities beyond traditional regulated utility capital programs.
- PJM Reliability Backstop Procurement: Following PJM’s July capacity auction, which fell 6.8 GW short of reliability requirements, PJM proposed a one-time procurement offering contracts of up to 15 years to accelerate new generation. On September 29, FERC accepted the proposal subject to further proceedings but suspended implementation for five months, until February 28, 2027, citing concerns including cost allocation and protecting existing ratepayers.
- U.S./Japan Back Nearly 19 GW of Gas Generation: Japan’s investment framework includes approximately $66 billion of proposed generation projects: SB Energy’s $33 billion, 9.2-GW Ohio development and two projects operated by NextEra Energy Resources—Project South Mon, a $17 billion, 4.3-GW development in Pennsylvania, and Project Anderson, a $16 billion, 5.2-GW development in Texas. The two NextEra projects represent approximately 9.5 GW of the company’s Japanese-backed federal opportunities
- NextEra Advances 16 GW of Federally Backed Power Projects: On October 1, NEE highlighted 16 GW of opportunities involving Japan and South Korea, including Project Star in Texas, a proposed $22.3 billion development combining a 5 GW data-center campus with 6.47 GW of gas-fired generation. NextEra cited $3.3 billion in initial Japanese capital commitments and $2.4 billion associated with South Korean projects. The company also identified a 4.6 GW opportunity in Paducah, Kentucky, split between gas generation and battery storage. The projects a fee-based development structures under which government or partner-country entities own the projects.
- U.S./Japan Propose $40 Billion for SMRs: The investment framework includes up to $40 billion for approximately 3 GW of GE Vernova Hitachi BWRX-300 small modular reactors in Tennessee and Alabama. Financing and nuclear-liability arrangements remain under negotiation.
- Federal Policy and Financing Support Nuclear Expansion: The Administration targets increasing U.S. nuclear capacity to 400 GW by 2050, with 10 new large reactors under construction by 2030. DOE initiatives include $17.5 billion in conditional nuclear supply-chain financing, up to $800 million for TVA and Holtec SMR development, $94 million for additional advanced-reactor support and $2.7 billion for domestic uranium enrichment. Separately, DOE financing supports NextEra’s Duane Arnold nuclear restart in Iowa, while TerraPower has received an NRC construction permit for its Natrium project in Wyoming.
Federal policy, foreign investment and hyperscaler demand are creating significant power infrastructure opportunities beyond traditional regulated utility capital programs. NextEra’s expanding federal development pipeline illustrates how companies can benefit through ownership, construction, development fees and long-term operating agreements. While not all announced projects will materialize, the growing pipeline underscores the scale of the investment opportunity. Can power supply keep pace with accelerating demand? That remains uncertain, but utilities will invest heavily in generation and grid infrastructure to meet the challenge, driving substantial rate-base and earnings growth for years to come.
RATE CASES TO SUPPORT HIGHER CAPEX-MEDIAN ROE 9.7%
With record investment, a utility’s ability to grow earnings increasingly depends on how its state’s Public Utility Commission (PUC) regulates rates—and whether the utility is given a fair opportunity to earn its authorized return on equity (ROE). With mid-term elections coming later this year, 36 states and the District of Columbia will be conducting gubernatorial elections in 2026, while legislative elections will be held in 46 states and Washington, DC.
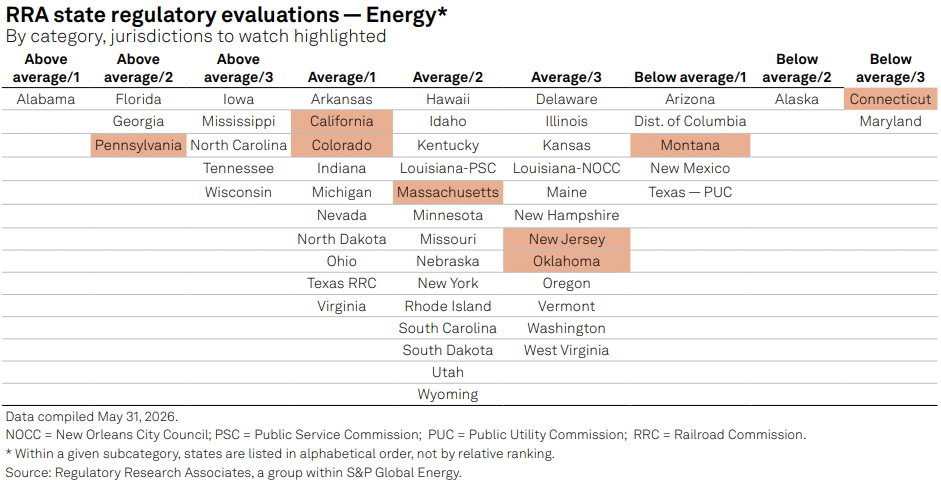
PUCs are political bodies and rate decisions are shaped not only by financial metrics but also by public pressure to keep customer bills affordable. To help evaluate this dynamic, we provide a Regulatory Research Associates (RRA’s) ranking of electric and gas rates across utilities (Appendix and Exhibit 15), along with an assessment of how constructive each state’s regulatory environment is—specifically, how effectively it supports utilities in earning their allowed ROE.
Exhibit 15 State PUC Rankings – AL, FL, GA, PA Constructive; CT, MD Not So Much
In recent years, rate case activity for investor-owned electric and gas utilities has been elevated. RRA anticipates this surge in rate case activity will continue, as elevated interest and inflation rates and the need for significant capital expenditures show no signs of abating. Moreover, additional expansion is expected to come from rising data center demand. Together, these factors will likely heighten pressure around growing affordability concern
Exhibit 16 In 2026, Allowed ROE’s Averaged 9.84% Compared to 9.84% in 2025
Affordability Becomes a Political Issue But More So in Some States Than Others
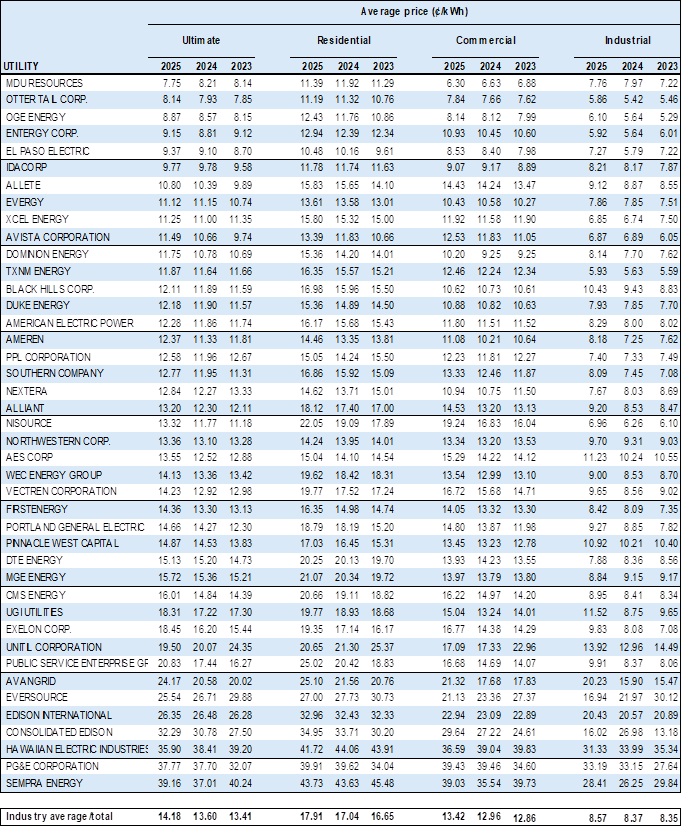
In Table 10, RRA ranks the publicly-traded electric utilities from lowest ultimate (or average retail) rate per kWh. MDU Resources is the lowest cost retail provider and Otter Tail is the lowest-cost residential provider followed by OGE, ETR, AVA, IDA, and EVRG. All tend to serve rural population centers and benefit from low-cost hydro or gas generation
Table 10 Ranking Electric Utilities by Affordability
Source: S&P Global; RRA
UTILITY AND ENERGY INFRASTRUCTURE MORE VALUABLE!
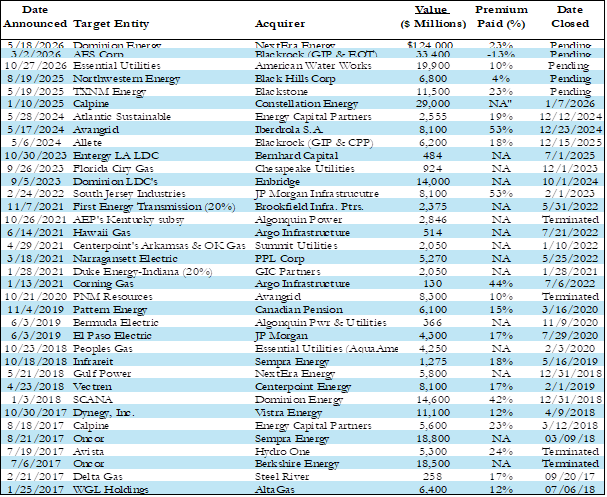
We believe the utility and energy infrastructure sectors are entering a new period of consolidation as existing assets become more valuable. Accelerating electricity demand, energy security and reshoring are attracting strategic buyers and major infrastructure investors seeking exposure to power generation, transmission, utilities and natural gas infrastructure. Larger utilities benefit from economies of scale and greater financing flexibility, while private capital provides additional funding for growth. Recent transactions involving NextEra, AES, ALLETE (BlackRock/Global Infrastructure Partners) and TXNM Energy (Blackstone), along with growing investments by KKR, Energy Capital Partners, LS Power, Apollo and EQT, highlight this trend. We expect further consolidation and private investment to unlock shareholder value beyond traditional earnings and dividend growth. Recent transactions include:
- Largest Merger Ever: On May 18, 2026, NextEra Energy (NEE-88.27) agreed to acquire Dominion Energy (D-67.73) in an all-stock transaction valued at ~$76 per D share (0.8138 NEE shares per D share). Richmond-based Dominion serves 4.1 million electric customers in VA, SC and NC and owns 30 GW of regulated generation, including 3.5 GW of nuclear, the 2 GW Millstone nuclear plant and 10,800 miles of transmission. The combination creates a ~$420 billion enterprise with an 80% regulated business mix and 131 GW data-center pipeline. Approvals are required from VA, NC, SC, FERC and the NRC, with closing targeted for second half of 2027. The transaction is expected to be immediately accretive and increase NEE’s long-term EPS growth to 9%+.
- Dominion provides significant exposure to Northern Virginia, where data centers represent 28% of electricity sales, and strengthens NEE’s position in PJM, where demand is expected to grow more than 5% annually. On September 14, NEE/D enhanced its Virginia benefits package, doubling residential bill credits from two to four years by redirecting credits from large data centers and adding shareholder funding. The package also includes $100 million each for low-income assistance and workforce development, up to $1 billion annually of Virginia supplier spending for five years, 1,000 new jobs, five-year employment protections and a new Richmond office tower. The changes address affordability, data-center cost allocation and employment concerns ahead of Virginia SCC hearings beginning November 17.
- On March 2, 2026, AES Corporation agreed to be acquired for $15 per share in an all-cash deal led by Global Infrastructure Partners and EQT Infrastructure, alongside CalPERS and Qatar Investment Authority. AES Corporation is a large global power company operating utilities and power plants in 14 countries, serving customers across the Americas, with about 32 gigawatts of generation capacity and a strong focus on expanding renewable energy, battery storage and long-term data center partnerships. The transaction implies an enterprise value of $33.4 billion and a valuation of roughly 12.0x EV/EBITDA based on forward estimates. The transaction highlights increasing interest from large infrastructure investors in power and utility infrastructure and platforms.
- On January 7, 2026, Constellation Energy (CEG) closed on the acquisition of Calpine (27 GW gas-fired capacity) for $29.1 billion ($4.5 billion cash, $16.4 billion stock, $12.7 billion assumed debt). Adjusted multiple: 7.9x 2026 EV/EBITDA. Calpine was previously taken private in 2017 by Energy Capital Partners for $17 billlion (9.1x EV/2017 EBITDA).
- On August 19, 2025, Black Hills Corp. (BKH) and NorthWestern Energy (NWE) announced an all-stock merger of equals (0.98x exchange, 4% premium). The combined utility will serve 2.1M customers across eight contiguous states, double rate base to $11.4B ($7.0B electric, $4.4B gas), and target 5–7% long-term EPS growth. The deal, expected to close in 12–15 months pending shareholder and regulatory approvals, highlights renewed sector consolidation after slowing during COVID and rising interest rates.
We expect consolidation to accelerate, particularly among smaller utilities, where greater scale and access to capital could enhance long-term growth prospects. Potential strategic candidates worth monitoring include IDA, POR, OGE, AVA, MDU, OTTR, AQN, UTL, PNW, MGEE and SWX.
Table 11 Utility Consolidation Over the Past 10-Years
Source: Company reports, Gabelli Funds
Utility Stocks Trade at Reasonable Valuations
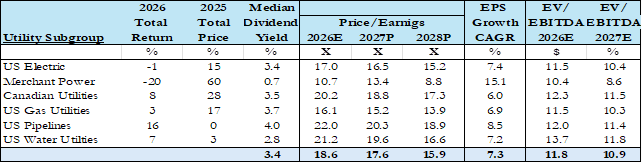
We believe the utility EPS growth supported by capital investment in utility infrastructure (rate base) thesis has considerable runway given electric demand growth through at least 2030 and the challenges bringing new supply on-line. We also believe many electric and gas utility stocks will benefit from the infrastructure build out with above historical average EPS and dividend growth. In addition, their defensive characteristics could appeal in the event of an economic slow-down. Please see Table 13 for Utility Subgroup Metrics and appendix for more utility stock financials.
- Electric utility valuation multiples have declined from 23x forward earnings in early 2020 and trade at 16.5X 2027 earnings estimates. Over the past twenty-five years, utility forward multiples have ranged between 10x and 23x earnings with a median of 17.1x.
- Independent Power Producers (IPPs), or merchant power companies, are highly leveraged to potential supply shortages. IPPs/merchants own power plants in non-regulated power markets, including PJM (Northeast/MidAtlantic), ERCOT (Electric Reliability Council of Texas), and CA, and provide marketing/power management services to customers. In 2023-25, the share prices of CEG, NRG, VST and TLN rose dramatically and driven by electric power demand and power shortages. After roughly 30% pull-backs from extraordinary stock price and EBITDA/EPS growth in 2024-2025, the sector trades at ore reasonable EV/EBITDA multiples of ~9.0X 2027P.
- Gas utility performance reflects improved investor sentiment and ongoing consolidation but likely does not reflect potential increased gas demand. Gas utilities currently trade at 15.2x 2027 earnings estimates.
- Water utility two-year under-performance reflects the impact of higher interest rates on higher multiple stocks. Water utilities trade no longer trade at the highest multiples and are more attractively valued than they have been in recent years. They are unique investments due to their scarcity, small size, takeover premium, ESG value, and long-term growth potential through consolidation and privatization.
- Canadian electric and gas utilities have lower growth rates and higher current returns, but Fortis, Emera and Algonquin have more assets and earnings power in the US than Canada. Canadian provincial regulatory environments are more challenging (lower allowed ROEs and equity ratios) than many US utility jurisdictions.
Table 12 Utility Subgroup Statistics
Valuation
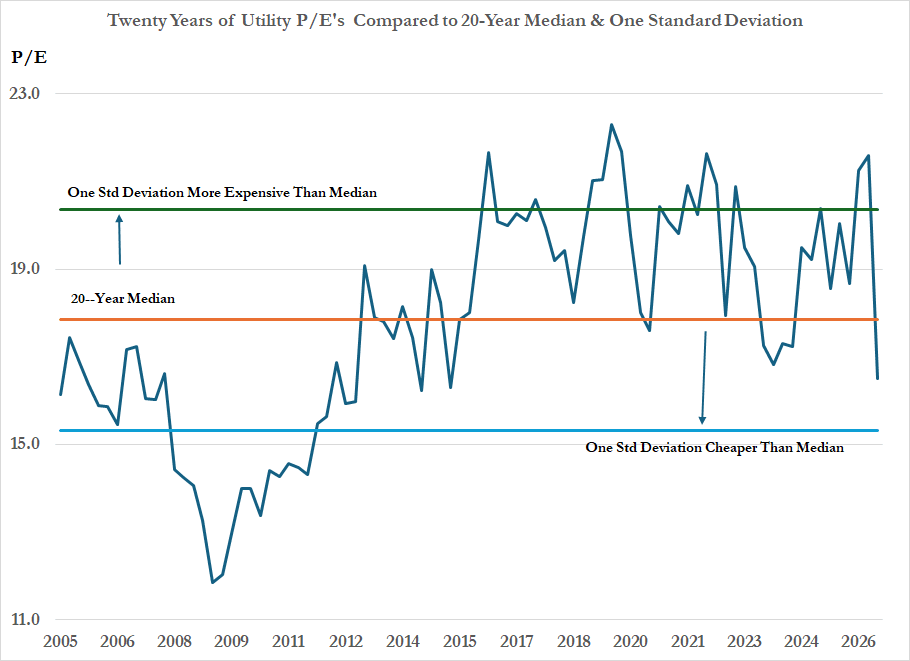
Over the past twenty years, electric utility multiples climbed from roughly 10x forward earnings to over 23x, driven by improving fundamentals, higher growth rates and lower interest rates from 2000-2022 (Exhibit 17). Electric utilities trade at ~16.5x consensus forward earnings estimates which is below (but near) the historical median (17.1x).
Exhibit 17 Absolute P/E Multiple Range Below Historical Median Despite Stronger EPS CAGR
Source: Thomson One, Company documents
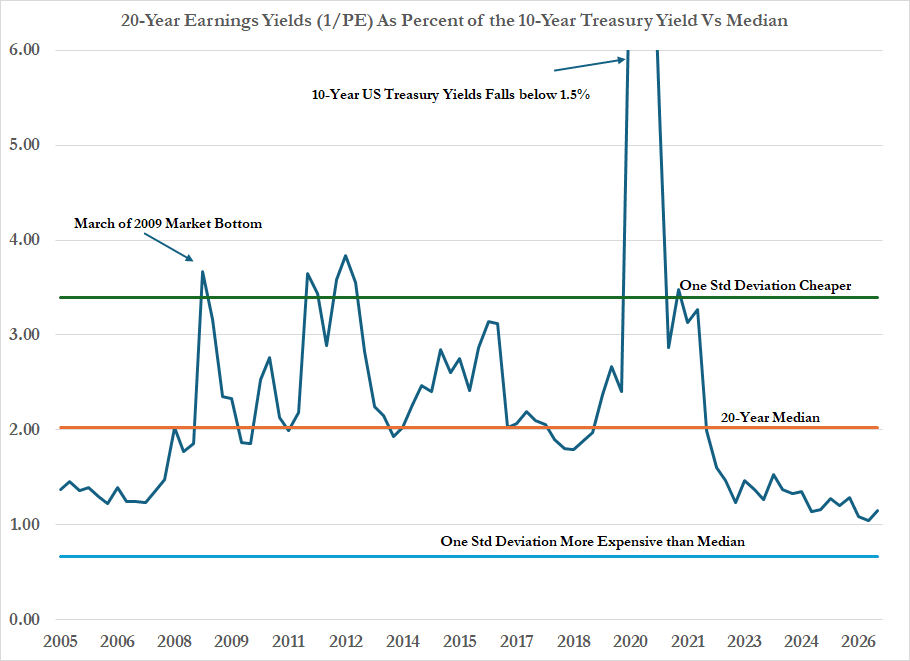
We consider the multiple attractive given higher utility earning growth rates and strong fundamentals. Given that long-term interest rates (specifically the 10-year Treasury yields) have risen to 5.29% following a long-term secular decline since the late 1980’s, we measure the earnings yield (1/P/E) as a percentage of the 10-Year T- Bond Yield to gauge interest rate adjusted valuations. As can be seen in Exhibit 18 the current ratio of 115% indicates the sector P/E is lower than its historical median relationship (200%) with the 10-Year T-Bond Yield, which indicates the sector is trading at a historically higher multiple when adjusted for interest rates. Again, utilities offer historically high EPS growth rates.
Exhibit 18 Utility Earnings Yield as a Percent of 10-Year T-Bond Yield (near Historical Median)
Source: Thomson One, Company documents
UTILITY OUTLOOK AND APPRAISAL:
We believe the recent weakness in utility stocks reflects macroeconomic and political headwinds rather than deteriorating fundamentals. Higher interest rates, electricity affordability concerns and opposition to data centers have pressured valuations, but the underlying investment outlook remains strong. After nearly two decades of limited electricity demand growth, AI data centers, manufacturing and electrification are driving a historic expansion in power infrastructure investment. Utilities are responding with record capital programs, accelerating rate-base growth and annual EPS growth targets of 6–8% or better, with several companies targeting 9–10% or more.
Not every proposed data center will be built, and growth will vary significantly by region and utility. Nevertheless, committed hyperscaler projects should provide substantial investment opportunities well into the next decade. We expect consolidation and growing private infrastructure investment to create additional shareholder value. Political pressures could moderate following the November elections, while any easing in inflation and interest rates would improve financing costs and support valuations. At approximately 16.5 times 2027 earnings, we believe utility stocks offer attractive long-term opportunities, with potential annual total returns of 9–11% from earnings growth, dividends and possible valuation recovery. Today’s headwinds could become tomorrow’s tailwinds, while the fundamental drivers of the power investment cycle remain firmly in place.
Appendix 1 Electric Utilities Selected Statistics
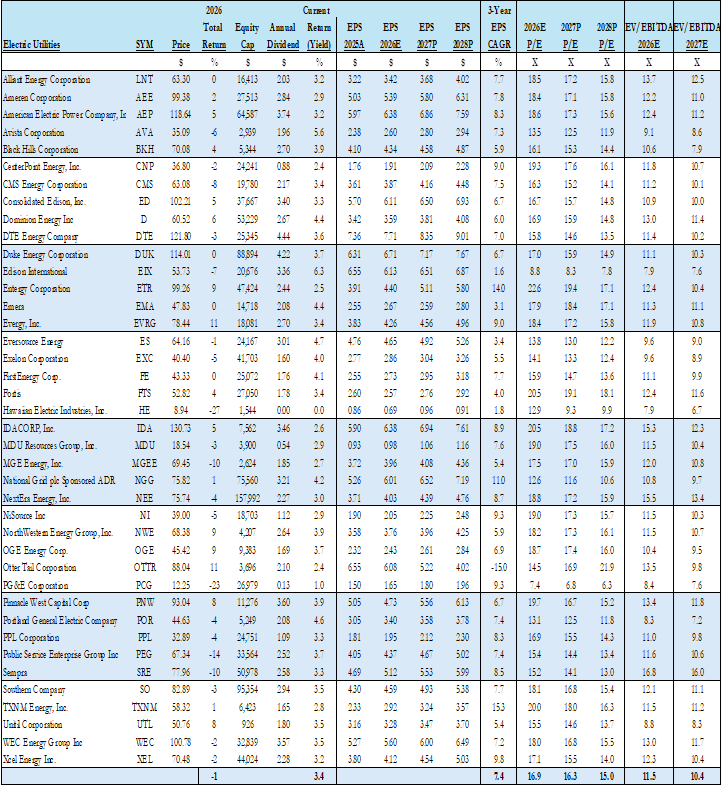
Source: Public data, Gabelli Funds estimates
Appendix 2 Gas & Water Utilities & Merchant Power Selected Statistics
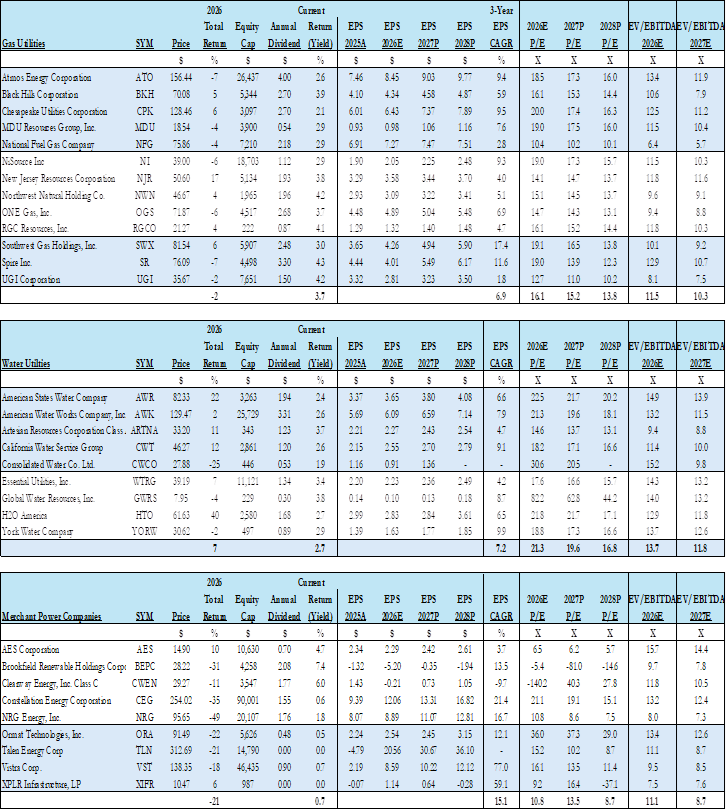
Source: Public data, Gabelli Funds estimates
Appendix 3 Canadian, Midstream & Gas Producers Selected Statistics
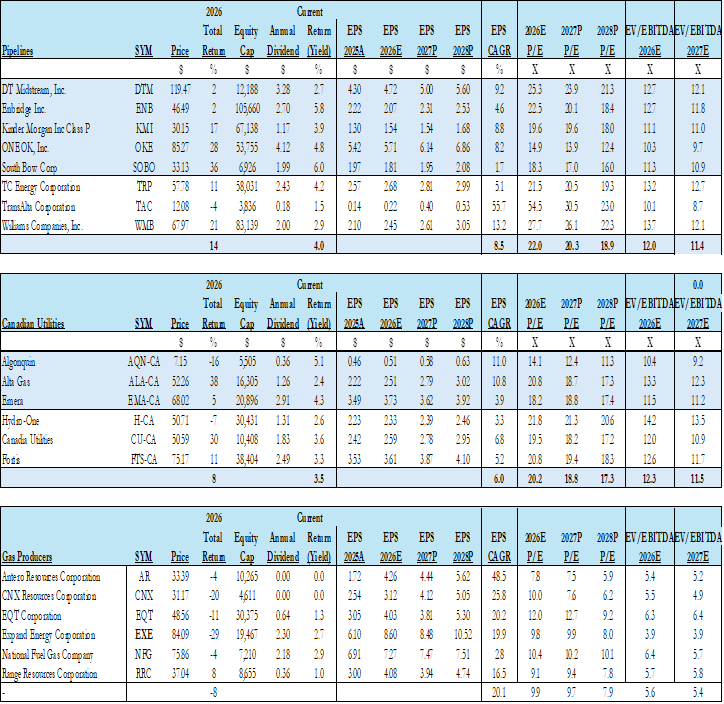
Source: Thomson One
©Gabelli Funds 2026
249 ROYAL PALM WAY, PALM BEACH, FL 33480 Gabelli Funds TEL (561) 671-2100
This whitepaper was prepared by Timothy M. Winter, CFA. The examples cited herein are based on public information and we make no representations regarding their accuracy or usefulness as precedent. The Research Analysts’ views are subject to change at any time based on market and other conditions. The information in this report represent the opinions of the individual Research Analysts’ as of the date hereof and is not intended to be a forecast of future events, a guarantee of future results, or investments advice. The views expressed may differ from other Research Analyst or of the Firm as a whole.
As of June 30, 2026, affiliates of GAMCO Investors, Inc. beneficially owned 7.13% of RGC Resources, 4.04% of National Fuel Gas, 2.43% of Southwest Gas, 2.10% of Northwest Natural, 1.92% of TXNM Energy, 1.56% of York Water, and less than 1% of all other companies mentioned.
Funds investing in a single sector, such as utilities, may be subject to more volatility than funds that invest more broadly. The utilities industry can be significantly affected by government regulation, financing difficulties, supply or demand of services or fuel and natural resources conservation. The value of utility stocks changes as long-term interest rates change
Investors should carefully consider the investment objectives, risks, charges and expenses of the Fund before investing. The prospectus, which contains more complete information about this and other matters, should be read carefully before investing. To obtain a prospectus, please call 800 GABELLI or visit www.gabelli.com
Returns represent past performance and do not guarantee future results. Current performance may be lower or higher than the performance data quoted. Investment return and principal value will fluctuate so, upon redemption, shares may be worth more or less than their original cost. To obtain the most recent month end performance information and a prospectus, please call 800-GABELLI or visit www.gabelli.com
Distributed by G.distributors, LLC., a registered broker dealer and member of FINRA.
This whitepaper is not an offer to sell any security nor is it a solicitation of an offer to buy any security.
For more information, visit our website at: www.gabelli.com or call: 800-GABELLI
914-921-5000 • Fax 914-921-5098 • info@gabelli.com
Gabelli Funds, LLC is a registered investment adviser with the Securities and Exchange Commission and is a wholly owned subsidiary of GAMCO Investors, Inc. (OTCQX: GAMI).