Wired For Growth – How Bond Proxies Become Growth Engines in Europe’s Electrification Drive
Critical Grid Infrastructure For Europe’s Electricity Flows
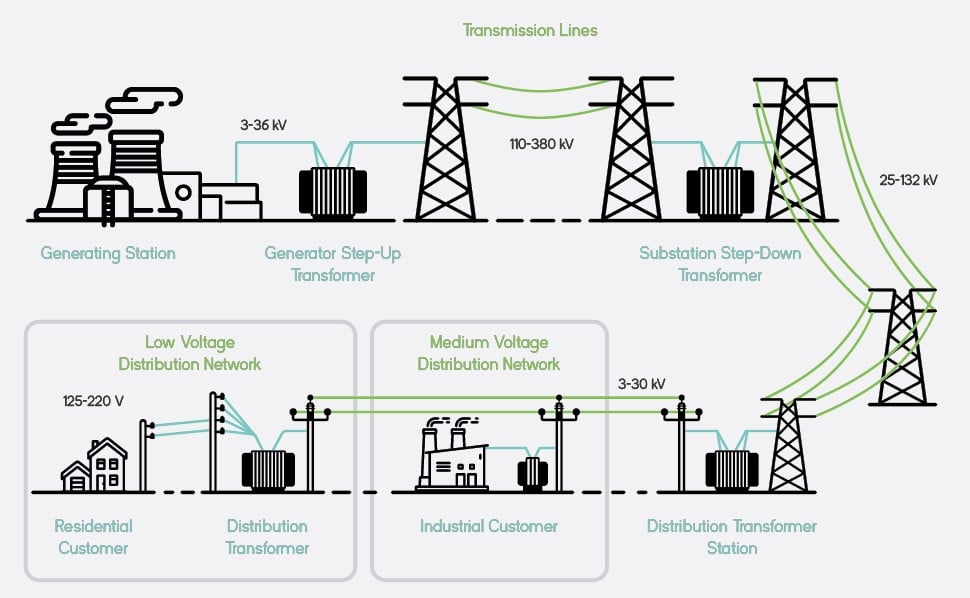
Electricity begins its journey to end customers at power plants, where it is generated from a variety of sources such as coal, gas, nuclear, wind, or solar. At this stage it is produced at a relatively low voltage, not yet suitable for efficient transport over long distances.
The electricity therefore first passes through a step-up transformer, which raises its voltage substantially. This step is essential: transmitting at higher voltages significantly reduces energy losses over distance, making the process far more efficient than moving power at its original, lower voltage.
Once stepped up, the electricity enters the transmission network, where high-voltage lines – typically ranging from 110 to 765 kilovolts (kV) – carry it across long distances, often spanning entire regions or countries. The companies that own and operate these lines are the Transmission System Operators (TSOs). As the electricity approaches its destination, it passes through a step-down transformer, or substation, which lowers the voltage again in preparation for local distribution (see Exhibit 1).
From there the electricity moves into the distribution network, where Distribution System Operators (DSOs) run the medium- and low-voltage grids that carry it through neighborhoods and communities. It finally reaches end customers – homes, businesses, and industrial facilities – at a voltage that is safe and usable for everyday appliances and equipment: in Europe, 230V for single household outlets and 400V for industrial users and larger buildings.
Exhibit 1 Electricity Supply from Power Stations to End Customers
Source: cinergia
North American distribution networks, by contrast, are built around lines of roughly 12.5 kV and small transformers of 15 to 75 kVA (kilovolt-amperes), each serving a limited number of customers over short distances. European systems operate at similar medium-voltage levels of 11–12 kV but rely on much larger transformers — often 1,000 kVA or more — so that each unit supplies, on average, six times as many customers as its North American counterpart. The two systems also deliver power to end customers at different voltages: roughly 230V in Europe versus about 120V in North America.
EU Power Demand Expected to Grow: Mostly from Electrification, Less from Data Centers
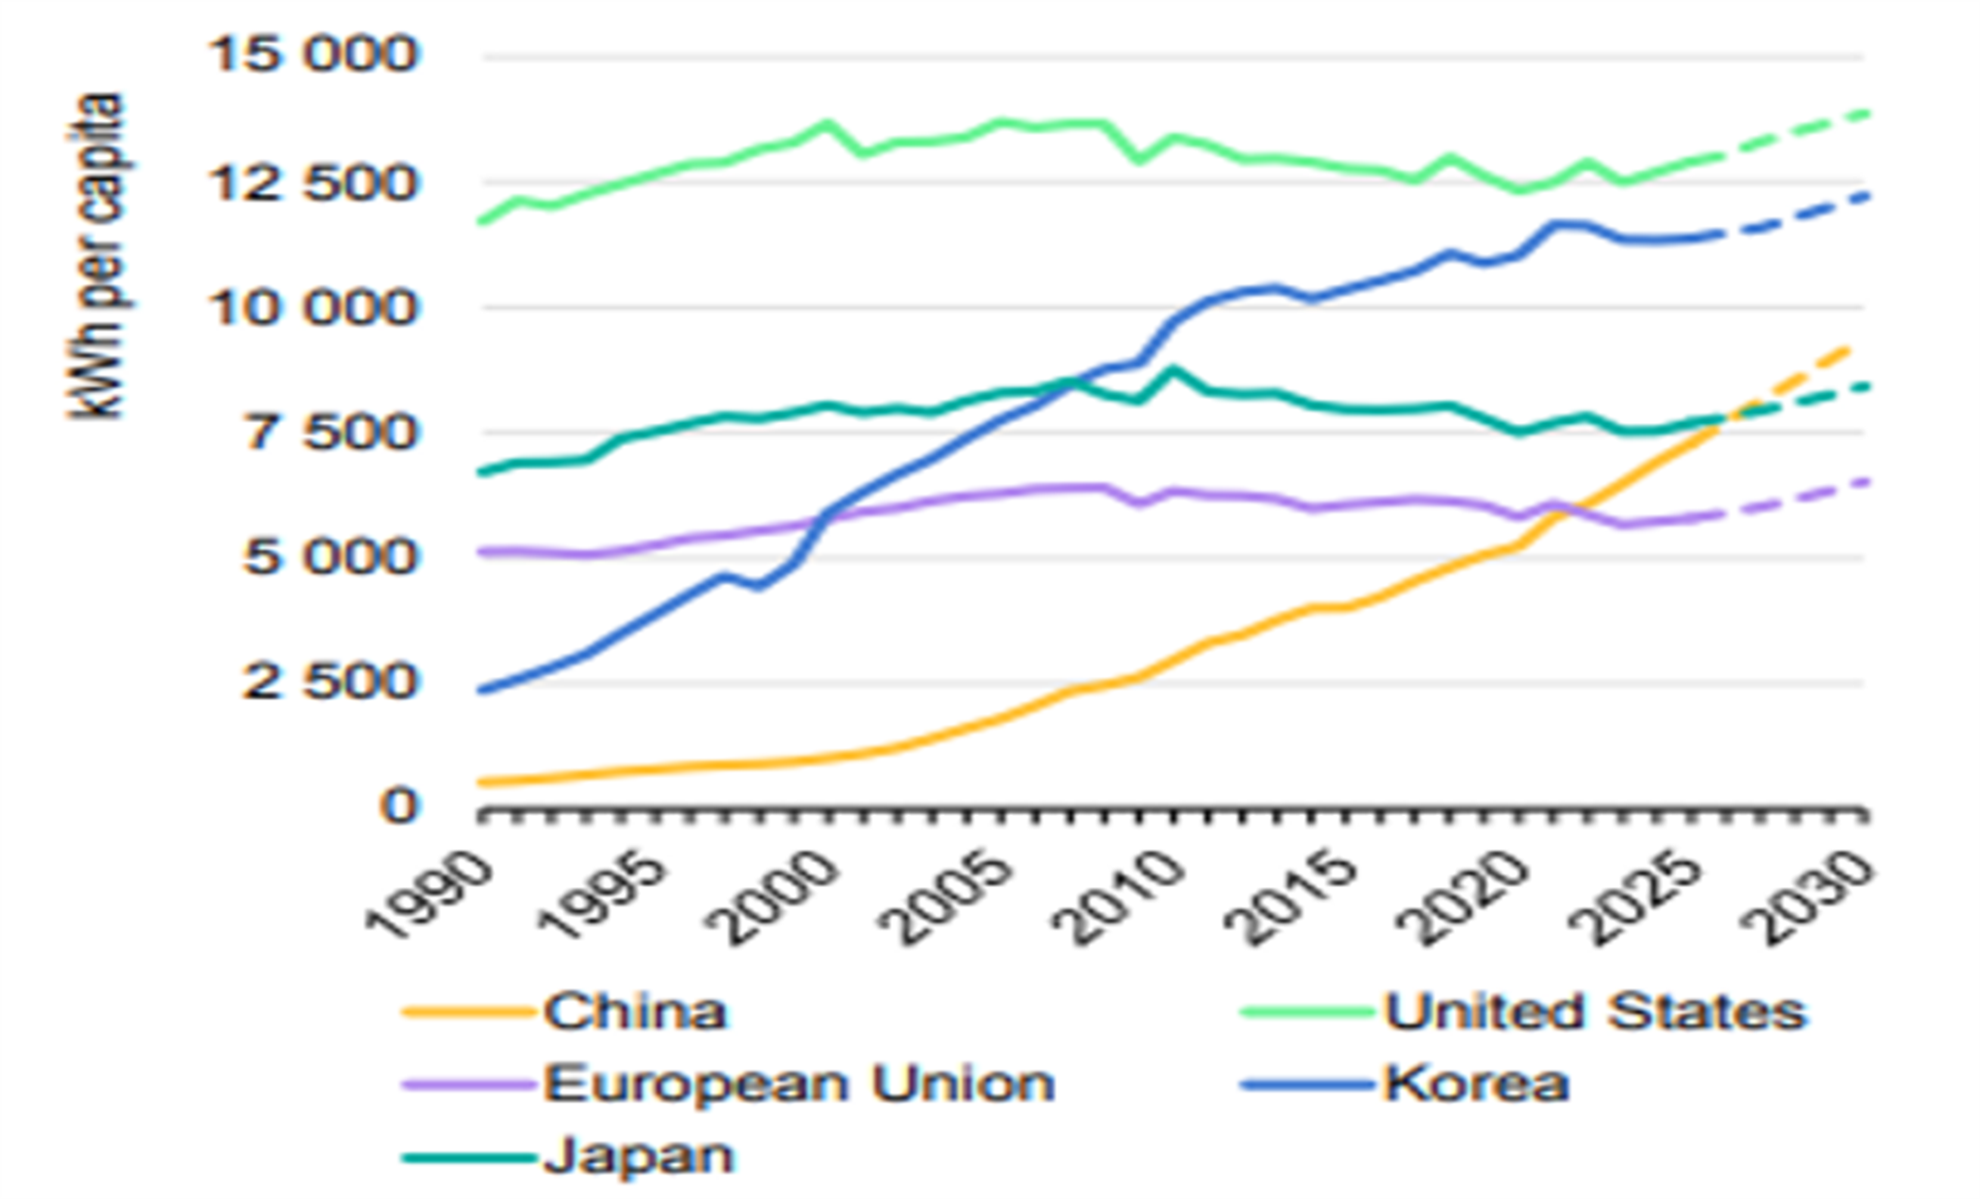
After 15 years of stagnating per-capita power consumption across developed economies (the USA, the European Union and Japan), demand in these regions is now projected to grow again, while emerging economies continue to post the strongest per-capita growth rates. In the European Union, electricity consumption rose steadily between 1990 and 2010 before levelling off, held back by slower GDP growth (the 2008 financial crisis, the 2012 eurozone sovereign debt crisis and the 2020 COVID recession) and by efficiency gains that made economic growth less electricity-intensive. Per-capita consumption in Europe has nonetheless remained well below levels in the USA and Japan throughout (see Exhibit 2).
ENTSO-E, the European Network of Transmission System Operators for Electricity, publishes a Ten-Year Network Development Plan (TYNDP) that guides energy infrastructure planning across Europe’s electricity system. As part of the plan, ENTSO-E has also developed long-term electricity demand forecasts out to 2050 in order to identify infrastructure and investment gaps in the EU’s power grids.
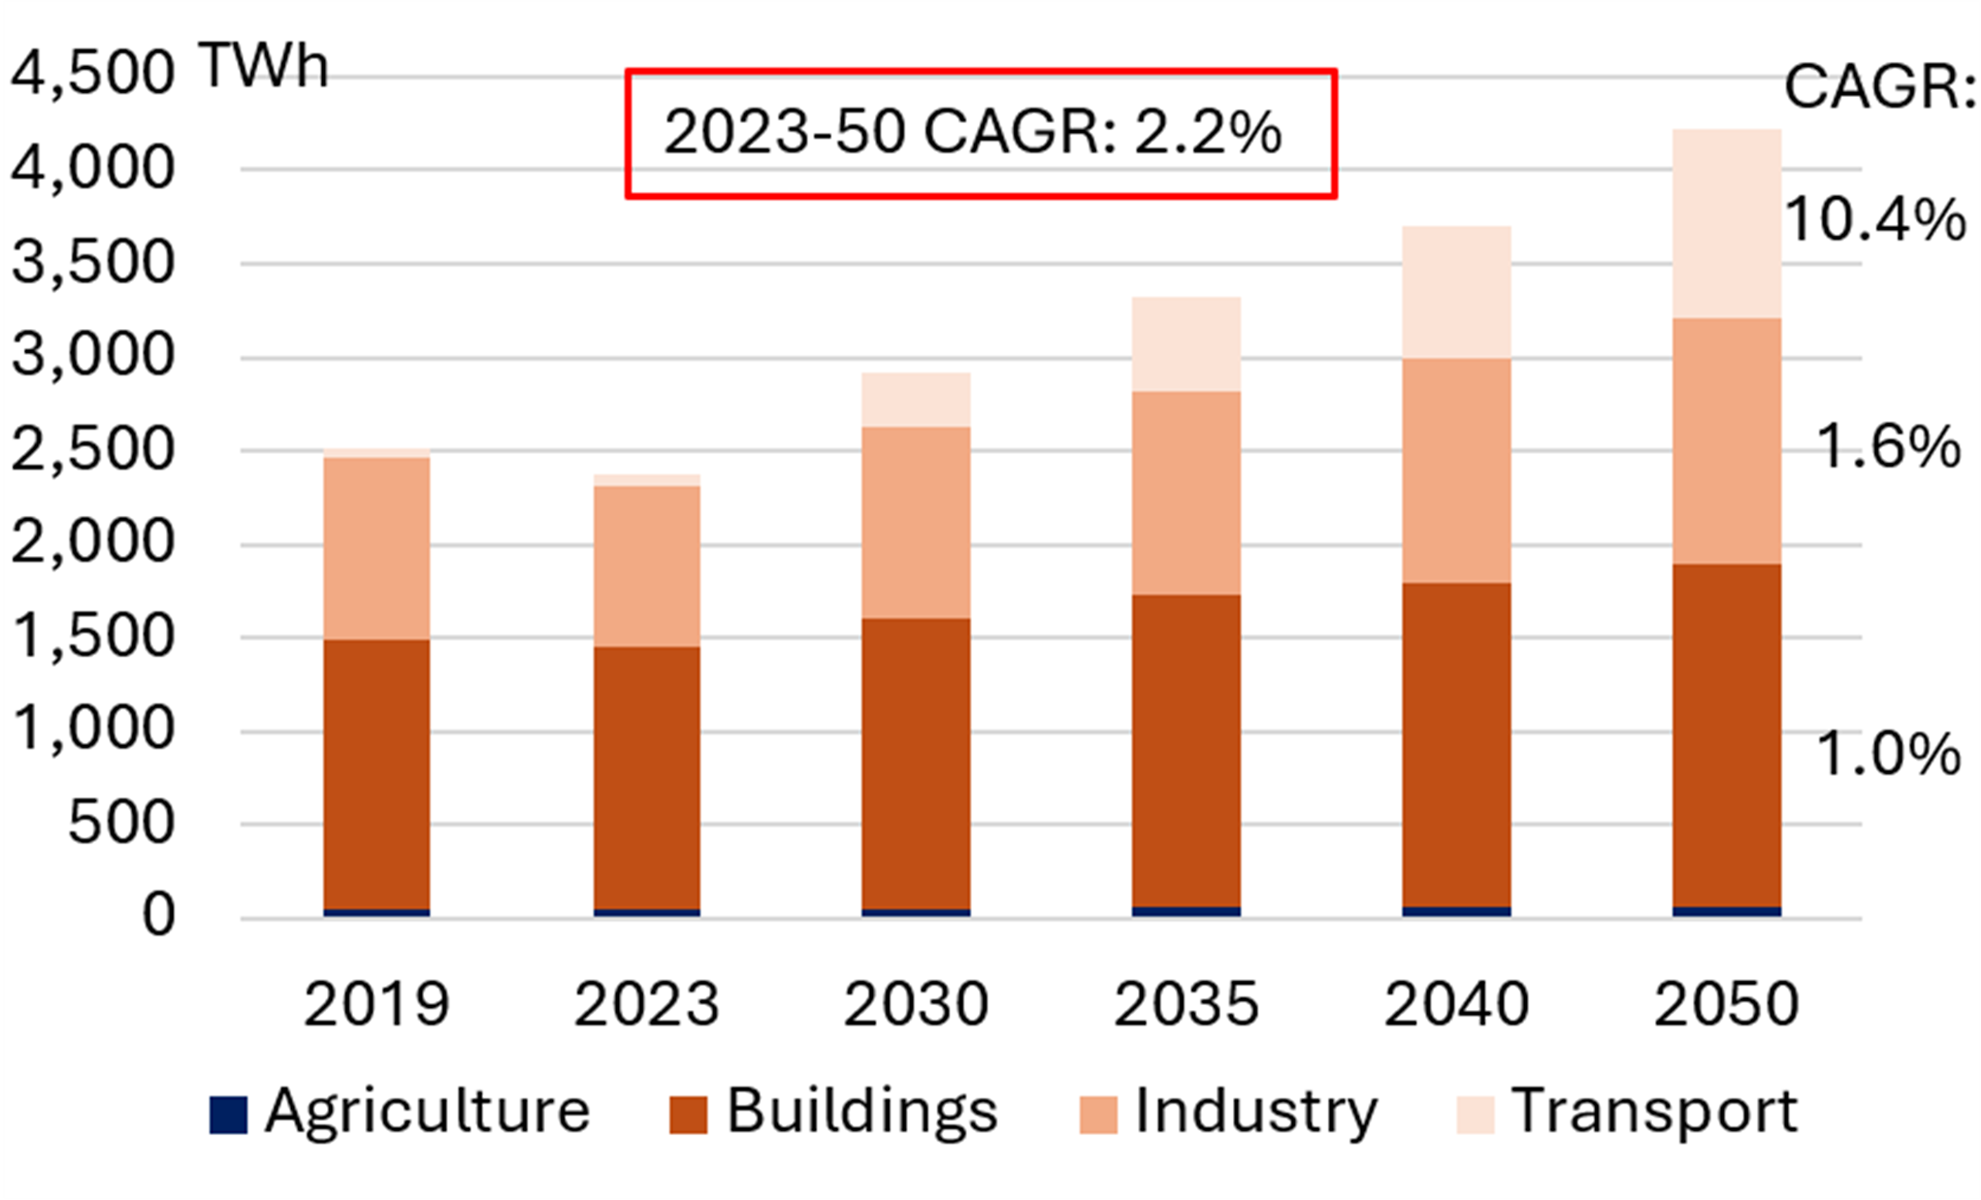
On ENTSO-E’s projections, final electricity consumption across the EU27 grows continuously through to 2050. From 2,380 TWh in 2023, demand is projected to reach roughly 2,920 TWh by 2030 (a CAGR of 3.0%), 3,710 TWh by 2040, and 4,220 TWh by 2050 – reflecting a 2023-50 CAGR of 2.2% (see Exhibit 3). The growth is driven fundamentally by Europe’s anticipated shift away from fossil fuels, with electrification across all end-use sectors partly offset by continued efficiency improvements. Comparable US forecasts range from 2% to 5.5% a year, coming primarily from higher data center-driven power demand growth.
Exhibit 2 EU27 Per-Capita Power Consumption Exhibit 3 EU27 Power Demand by Sector


Source: Int’l Energy Agency Source: ENTSO-E
The buildings sector is projected to retain the largest share of total electricity demand, growing at a CAGR of 1% to 2050. The main driver is the widespread rollout of heat pumps (HPs), which efficiently supply both heating and cooling in residential and commercial buildings. The market share of HPs (electric and hybrid) in households is expected to rise to around 45% by 2040 and 57% by 2050, while conventional gas boilers fall from 41% today to roughly 10%. As a result, electricity’s share of the buildings sector’s total energy demand climbs from 37% in 2023 to 59% by 2050. Rising consumption from data centers (DC) and other information and communication technology, which is accounted for within the buildings sector, adds further to the sector’s demand.
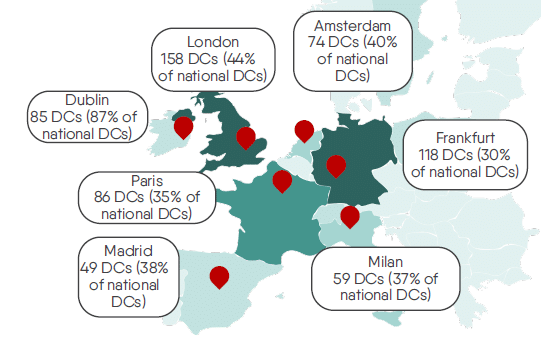
According to the European Data Centre Association (EUDCA), Europe currently hosts more than 10,500 data center facilities with a combined capacity of about 12.7 GW, of which roughly 9.9 GW sits in the EU27. That capacity is projected to double by 2030, driven largely by colocation facilities. Deployment speed varies widely across countries, and Europe’s major hubs – the FLAPD markets of Frankfurt, London, Amsterdam, Paris and Dublin – each account for at least a third of their home country’s total data center capacity (see Exhibit 4). Power demand is correspondingly concentrated in these locations, placing significant stress on their regional grids and making strategic planning for future capacity expansion essential.
Exhibit 4 Europe’s Main Data Center Hubs
Source: Eurelectric (Power Barometer 2025)
Forecasts of data center-driven demand growth vary widely in both magnitude and horizon. ENTSO-E projects that total electricity demand from data centers in Europe rises by more than 50%, from 87 TWh in 2024 to above 134 TWh by 2030, and then nearly triples to 254 TWh by 2035. The projected share of total electricity consumption from data centers varies just as much: ENTSO-E puts it at 6-7% for Europe by 2035, while other forecasts have data centers passing 10% as early as 2030. Whichever path holds, Europe faces several structural disadvantages relative to the USA that may slow the buildout: longer grid connection queues, higher wholesale power prices, and greater demand elasticity to those prices.
Industrial power demand is driven primarily by the electrification of industrial processes outside the hard-to-electrify, high-temperature applications found in steel, cement, aluminum and petrochemicals. Electricity demand in industry is projected to grow at a 2023-50 CAGR of 1.6%, taking electricity from around one-third of total industrial energy consumption in 2023 to more than half by 2050.
Transportation is the sector where electricity demand grows fastest, at a 2023-50 CAGR of 10%, as it continues to shift from oil-based fuels to electric mobility. ENTSO-E projects that transport electricity demand rises by a further factor of 3.5 between 2030 and 2050, the strongest growth of any sector. That pace reflects rapid EV penetration in passenger cars and vans, alongside a slower but growing role for electricity in buses and short- and medium-haul trucking. Maritime shipping and aviation remain far harder to electrify and are expected to depend mainly on hydrogen-based fuels and sustainable aviation fuels rather than on direct electrification.
Mind The Gap: More Power Grid Investment Needed in Europe
Reliable electricity supply will only become more important to the European economy, yet around 30% of Europe’s power grid is on average more than 40 years old. Modernizing and digitalizing these networks comes at a price: investment spending on power grids is expected to rise significantly over the next five to ten years to meet Europe’s future demand and electrification targets.
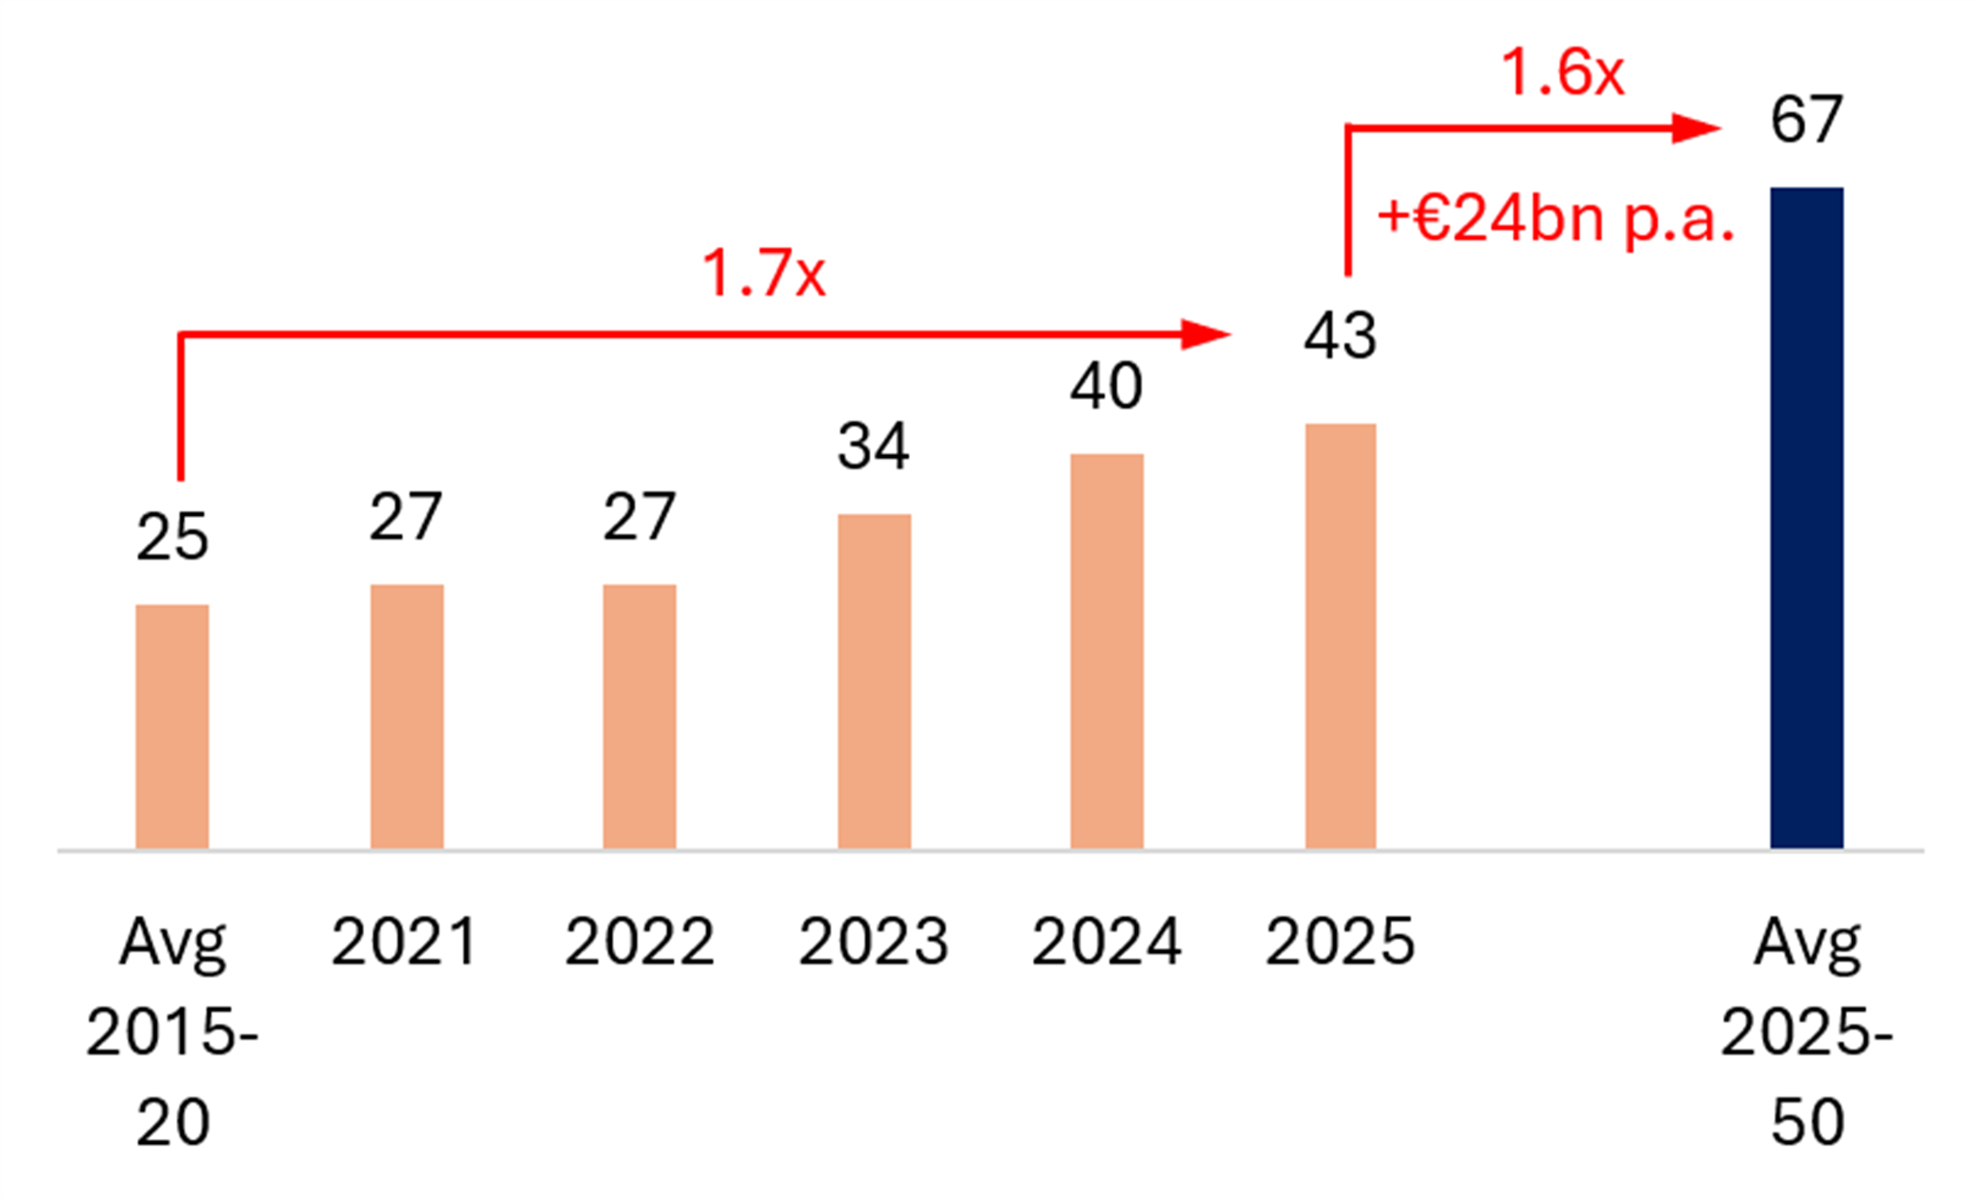
Total annual investment in European power distribution networks has climbed from an average of €25 billion in 2015-20 to €43 billion in 2025, an increase of 70%. In several countries – Denmark, Germany, Italy and Poland among them – annual grid capex has more than doubled over the past four years, underscoring the urgency of the upgrade. Even so, investment still falls short by some €24 billion a year: it needs to grow by a further 56%, to an average of €67 billion annually over the next 25 years (see Exhibit 5).
This investment gap is a major barrier to power system flexibility in Europe. Without modernized and better interconnected grids, the EU cannot absorb the rising share of intermittent solar and wind generation. The number of so-called prosumers – residential customers who generate and sell their own electricity – has nearly tripled between 2021 and 2024 to almost 7 million, which further underlines the need for smart grids capable of harnessing that capacity.
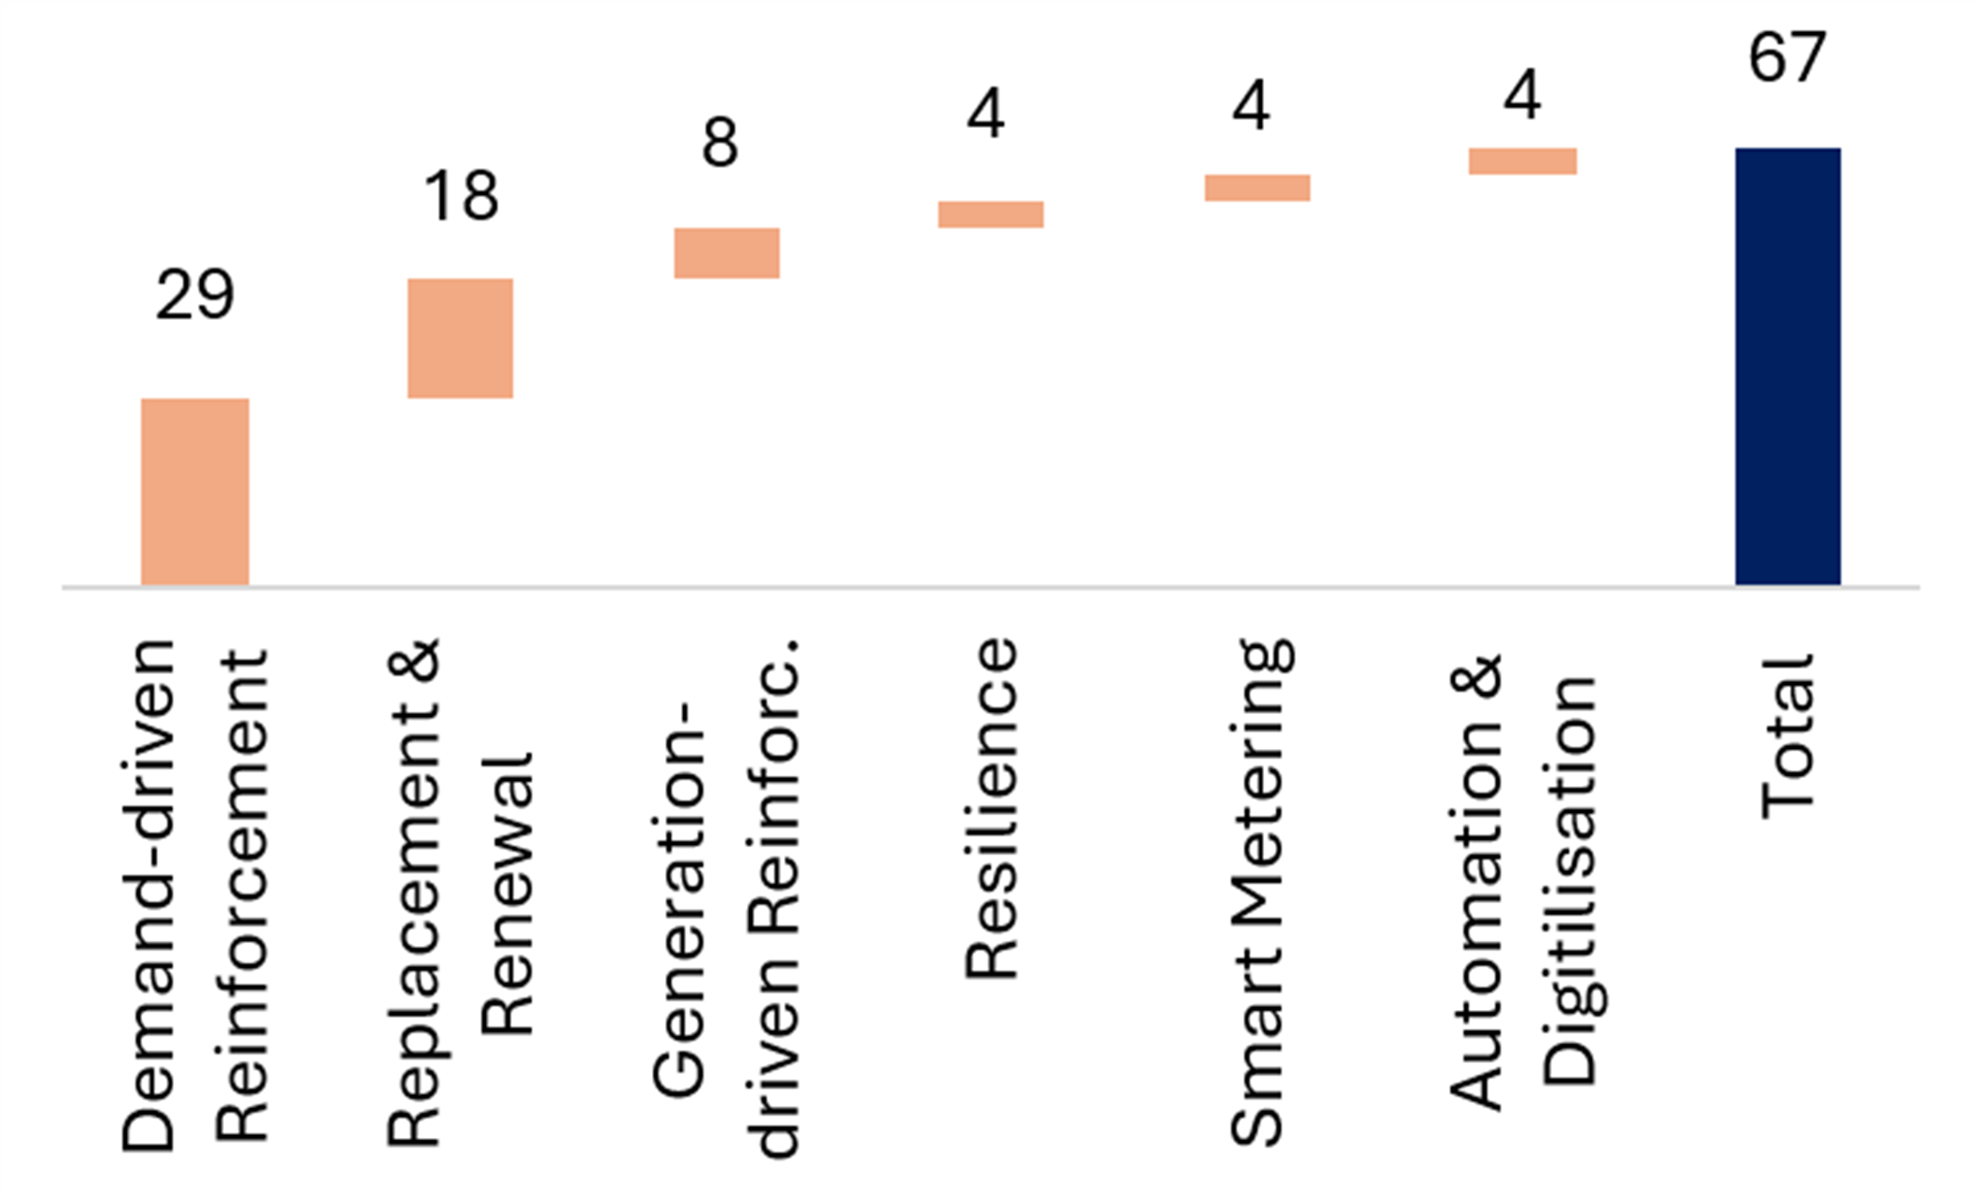
Getting Europe’s electricity distribution grid ready for the energy transition requires an average of €67 billion a year across the EU27 plus Norway between 2025 and 2050 – roughly 0.4% of EU27 GDP in 2024, or €150 per person per year. The largest share goes to demand-driven reinforcement, at €29 billion or 43% of total investment, supporting the electrification of buildings (heating) and transportation as an expected 237 million EVs and 251 million heat pumps connect to the grid by 2050. Replacement and renewal accounts for a further €18 billion (27%), modernizing ageing grids and equipment for reliability and resilience. Generation-driven reinforcement takes €8 billion (12%), enabling surplus renewable electricity to be moved to where it is needed (see Exhibit 6).
Exhibit 5 EU Annual Grid Investments (€bn) Exhibit 6 EU Annual 2025-50 Capex (€bn)


Source: Eurelectric Source: Eurelectric
By voltage level, low voltage (LV) accounts for 44% of the €67 billion annual investment, medium voltage (MV) for 41% and high voltage (HV) for the remaining 15% – a modest share despite HV’s much higher unit costs, which reflect its technical complexity and scale. The LV grid looks like the binding constraint on Europe’s electrification drive over the next 25 years: it already makes up 60% of total grid length, and by 2050 it will have to serve some 250 million homes together with a comparable number of heat pumps and EVs.
Investment needs diverge sharply across Europe, shaped by population density, peak demand growth and the pace of each country’s energy transition. France, Germany and Italy together account for around half of the €67 billion required annually to 2050, while Norway, Denmark and the Netherlands lead on a per-capita basis. Countries with highly fragmented DSO landscapes also tend to face higher investment requirements, as the smaller operators cannot spread engineering, procurement and digitalization costs across a large asset base. The composition of spending differs too: Italy, Germany and Denmark need a greater share of demand-driven reinforcement, while Norway, France and the rest of Europe must invest more heavily in replacement and renewal.
Capex Growth Drives Earnings Growth For Network Companies
As described above, the expected increase in power demand, together with Europe’s planned electrification of several economic sectors, requires significant grid investment over the next 10 to 20 years. How can regulated electricity network operators benefit from this growth in power demand and investment?
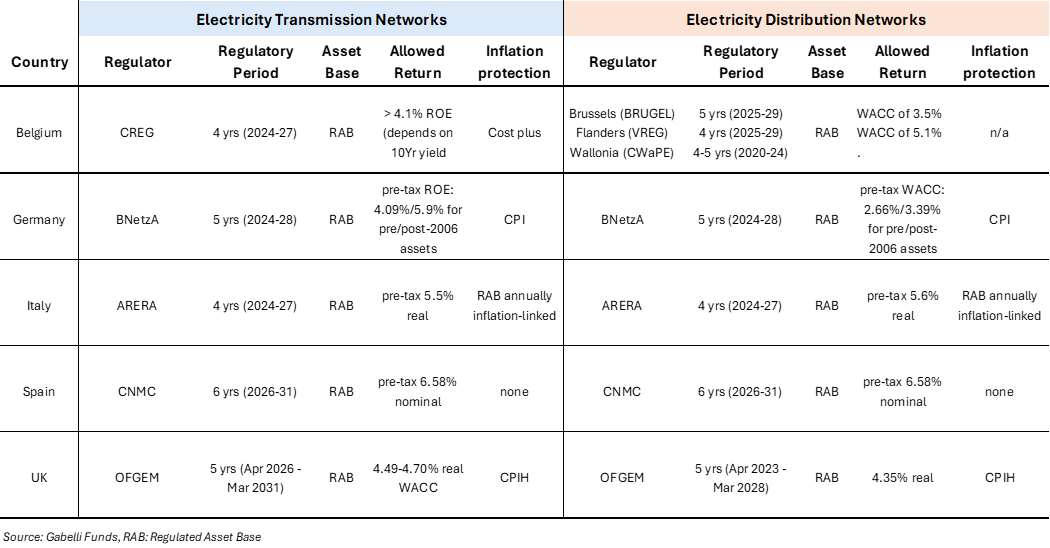
As regulated entities, network operators do not benefit directly from higher electricity volumes flowing through their networks: they earn an “allowed return” on their regulated asset base (RAB), and their capped revenue is decoupled from transported volumes. They do, however, benefit indirectly, because growing power demand – including from data centers (DCs) – requires more capital investment in new networks, substations, transformers and cables, all of which increases the RAB.
A second indirect benefit is that unit costs fall as fixed network costs are spread over a larger TWh base. This lowers the unit tariffs an operator passes on to customers, which creates political headroom vis-à-vis the regulator to approve additional capex without raising customer bills, all else equal – again lifting the RAB and, with it, the operator’s earnings.
Who gains more? TSOs and DSOs both benefit from rising power demand, but at opposite ends of the demand spectrum. Transmission System Operators benefit more from data center growth, as hyperscalers and large colocation sites require new high-voltage lines, substations and cross-border capacity – transmission capex that lifts the TSO’s RAB. Growing demand for electric vehicles, heat pumps and distributed solar, by contrast, requires investment in low-voltage grids, the domain of Distribution System Operators.
DSOs therefore benefit more from the electrification of the buildings and transport sectors, where consumer demand for EVs and heat pumps becomes an engine of steady RAB growth. TSOs, meanwhile, capture data center-driven transmission growth, which depends heavily on hyperscalers’ investment timelines. Transmission capex linked to data center demand thus tends to be larger, but also lumpier.
Table 1 summarizes the regulatory frameworks of the countries relevant to the electricity network companies analyzed in this report:
Table 1 Selected Country Regulations for European Electricity Network Companies
Upward Revisions of Business Plan Targets
The projected increase in grid investments at the sector level is reflected in higher capex for transmission and distribution networks at the company level. As capex spending rises, the regulated asset base of electricity network operators increases as well, which translates directly into higher earnings growth for a given allowed return. Thus, while regulated power network companies were in the past considered a defensive sector with little or no earnings growth prospects, the expected secular power demand growth translates now into unprecedented earnings growth for this industry. As such, defensive network operators now also offer sustainable and visible earnings growth for investors.
Accordingly, based on growing grid investment needs, network companies have consistently raised their capex plans along with their guidance for projected RAB growth in their respective multi-year business plans. The following charts summarize how the respective capex and RAB growth outlooks have evolved in consecutive business plans of the companies in this sector report. The left panel shows for each company the guided average annual capex in each year of the announced business plan and the right panel summarizes the projected CAGR of the RAB over the course of the plan period. Most companies have consistently raised their guidance for annual capex and for the expected RAB CAGR during the same plan period and between consecutive business plans.
Exhibit 7 E.ON – Annual Network Capex (€bn) | Exhibit 8 E.ON – Guided RAB CAGR (%)

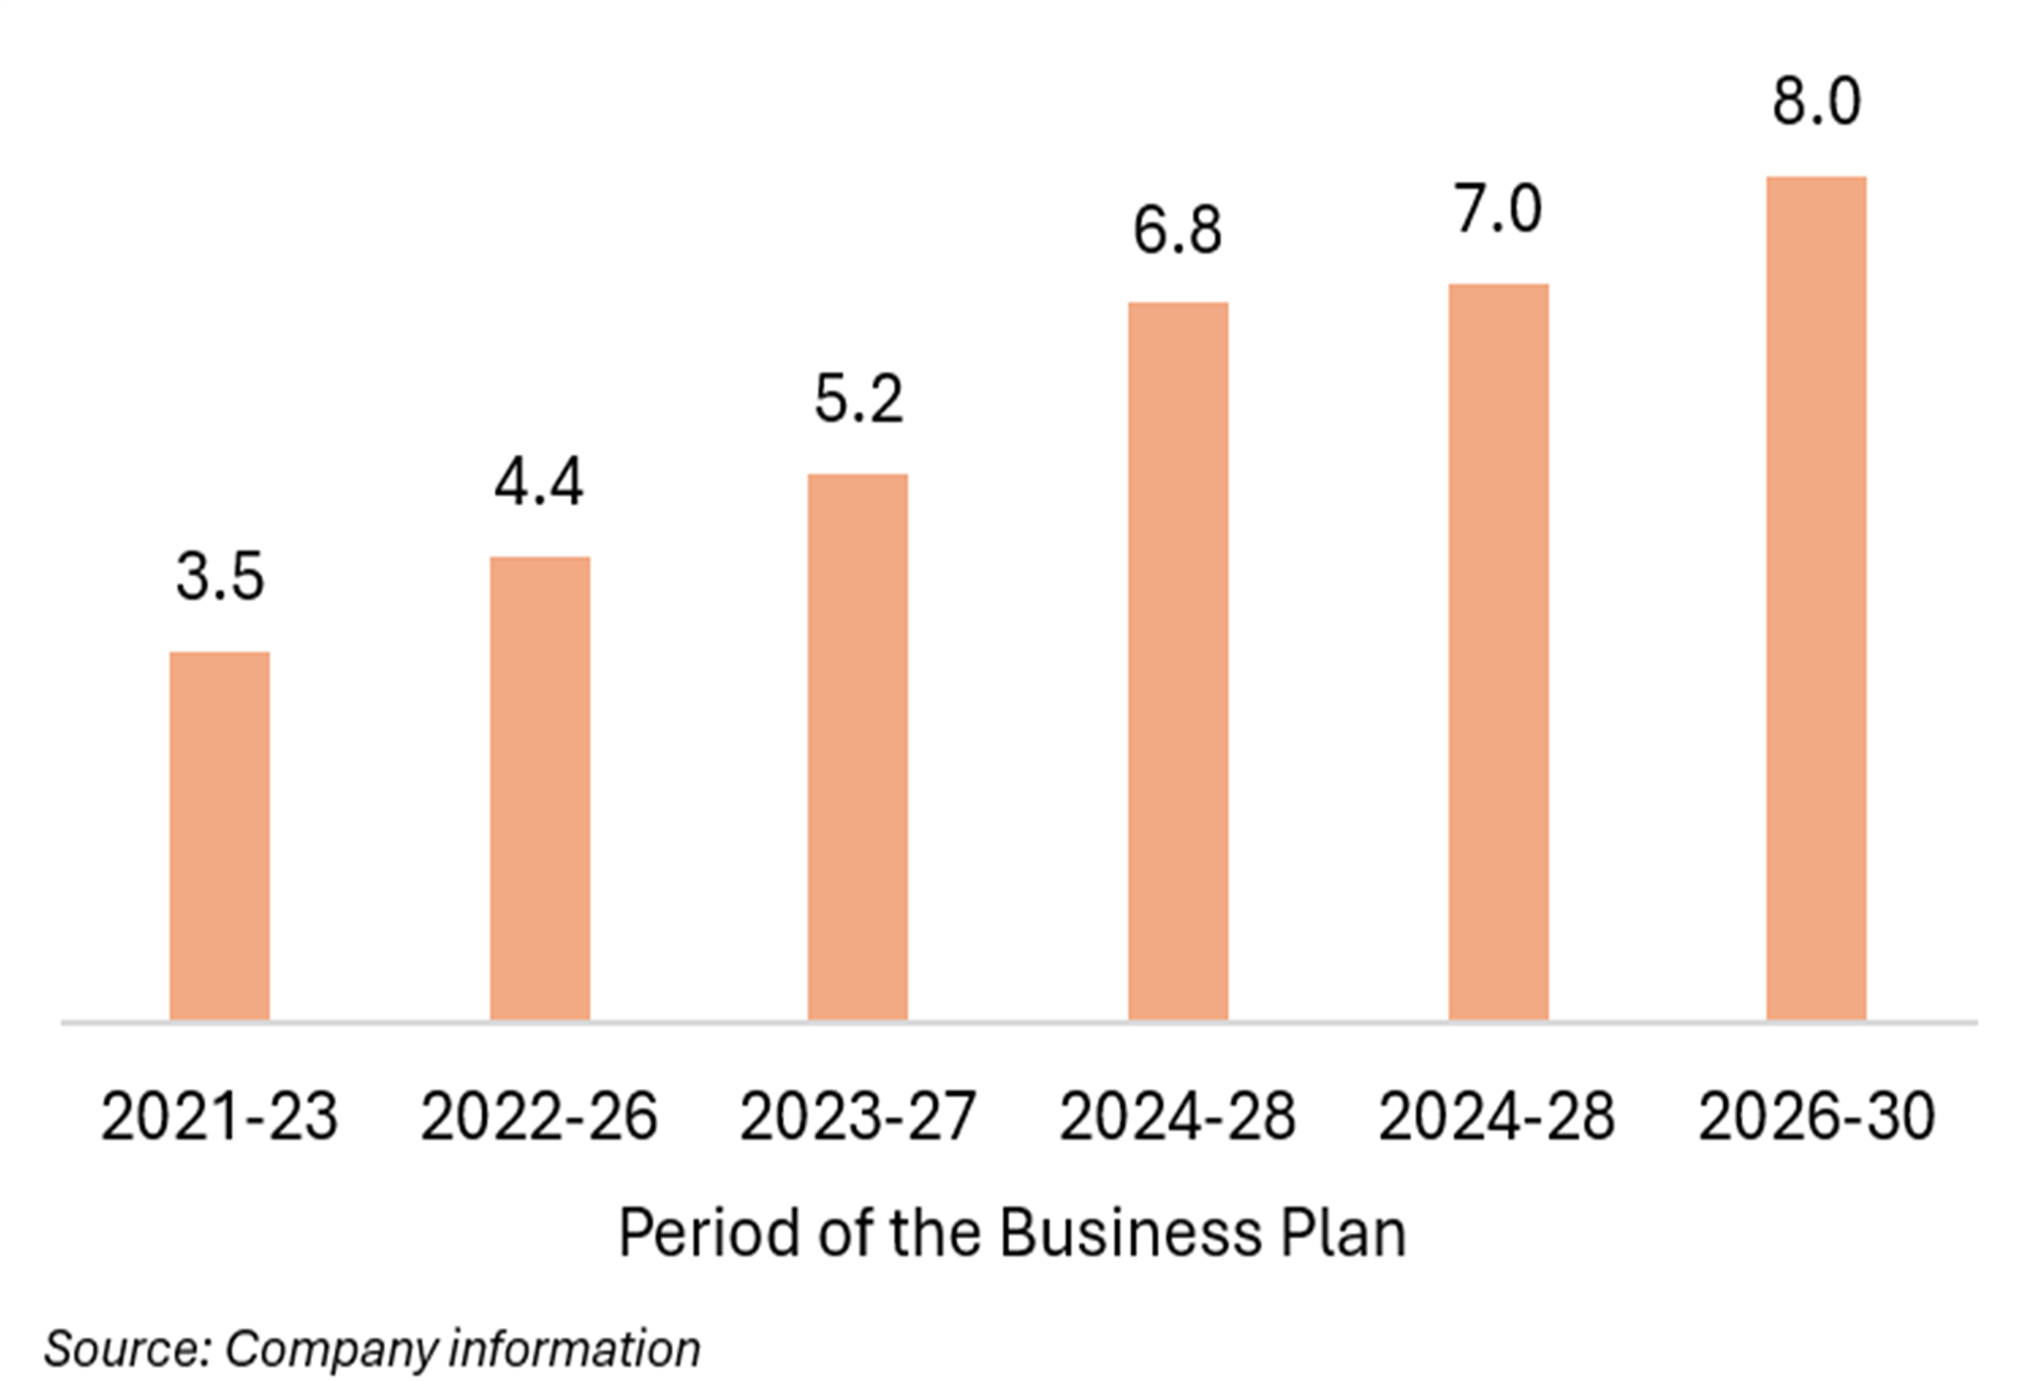
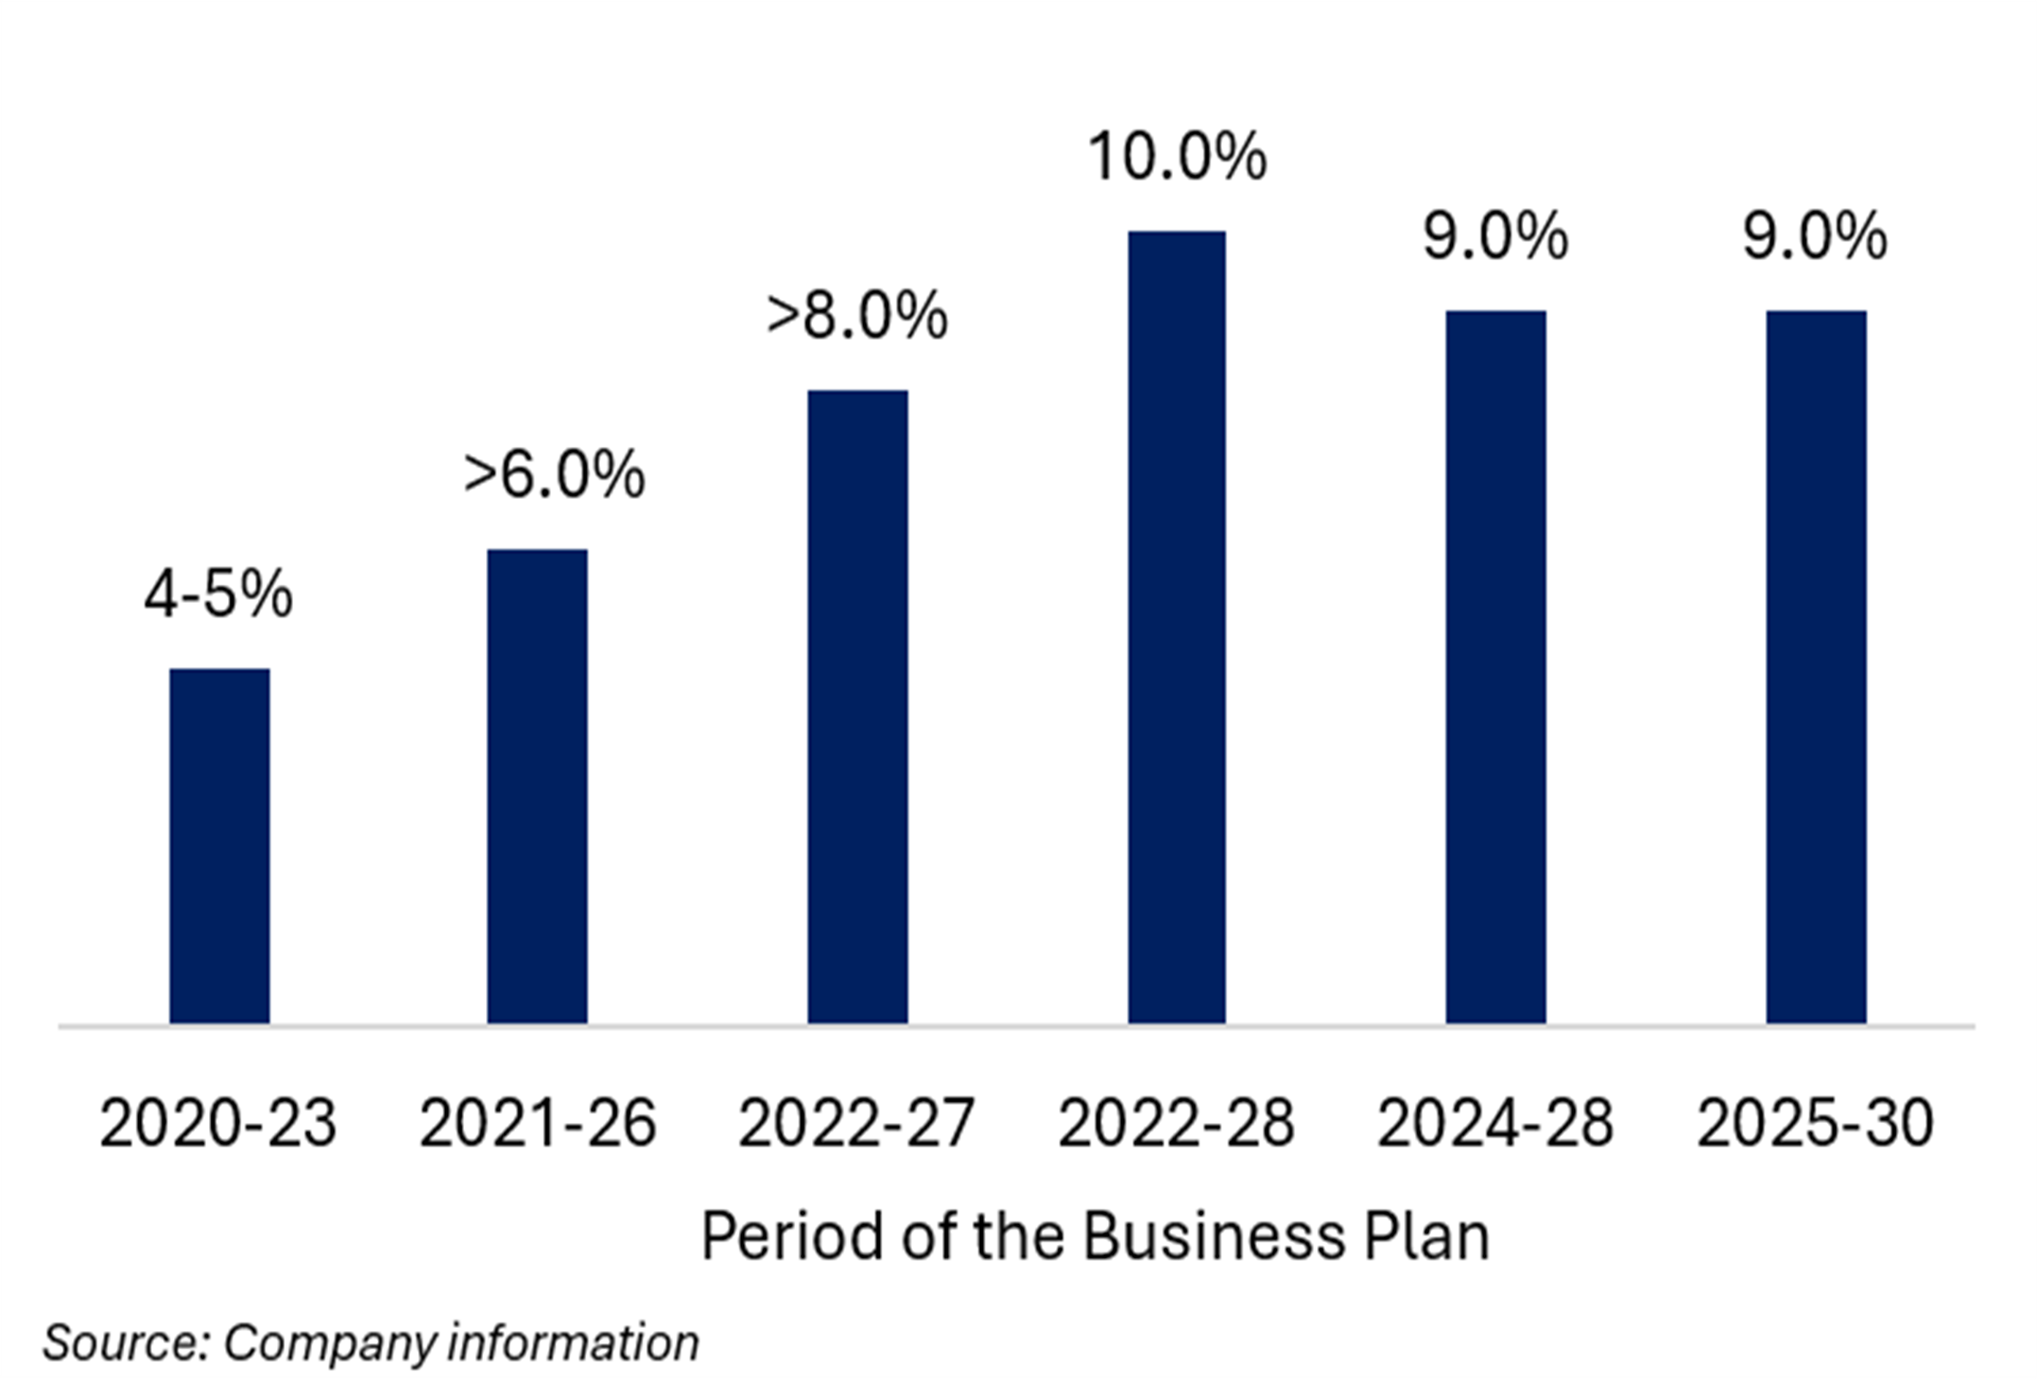

Exhibit 9 Elia – Annual Capex (€bn) | Exhibit 10 Elia – Guided RAB CAGR (%)

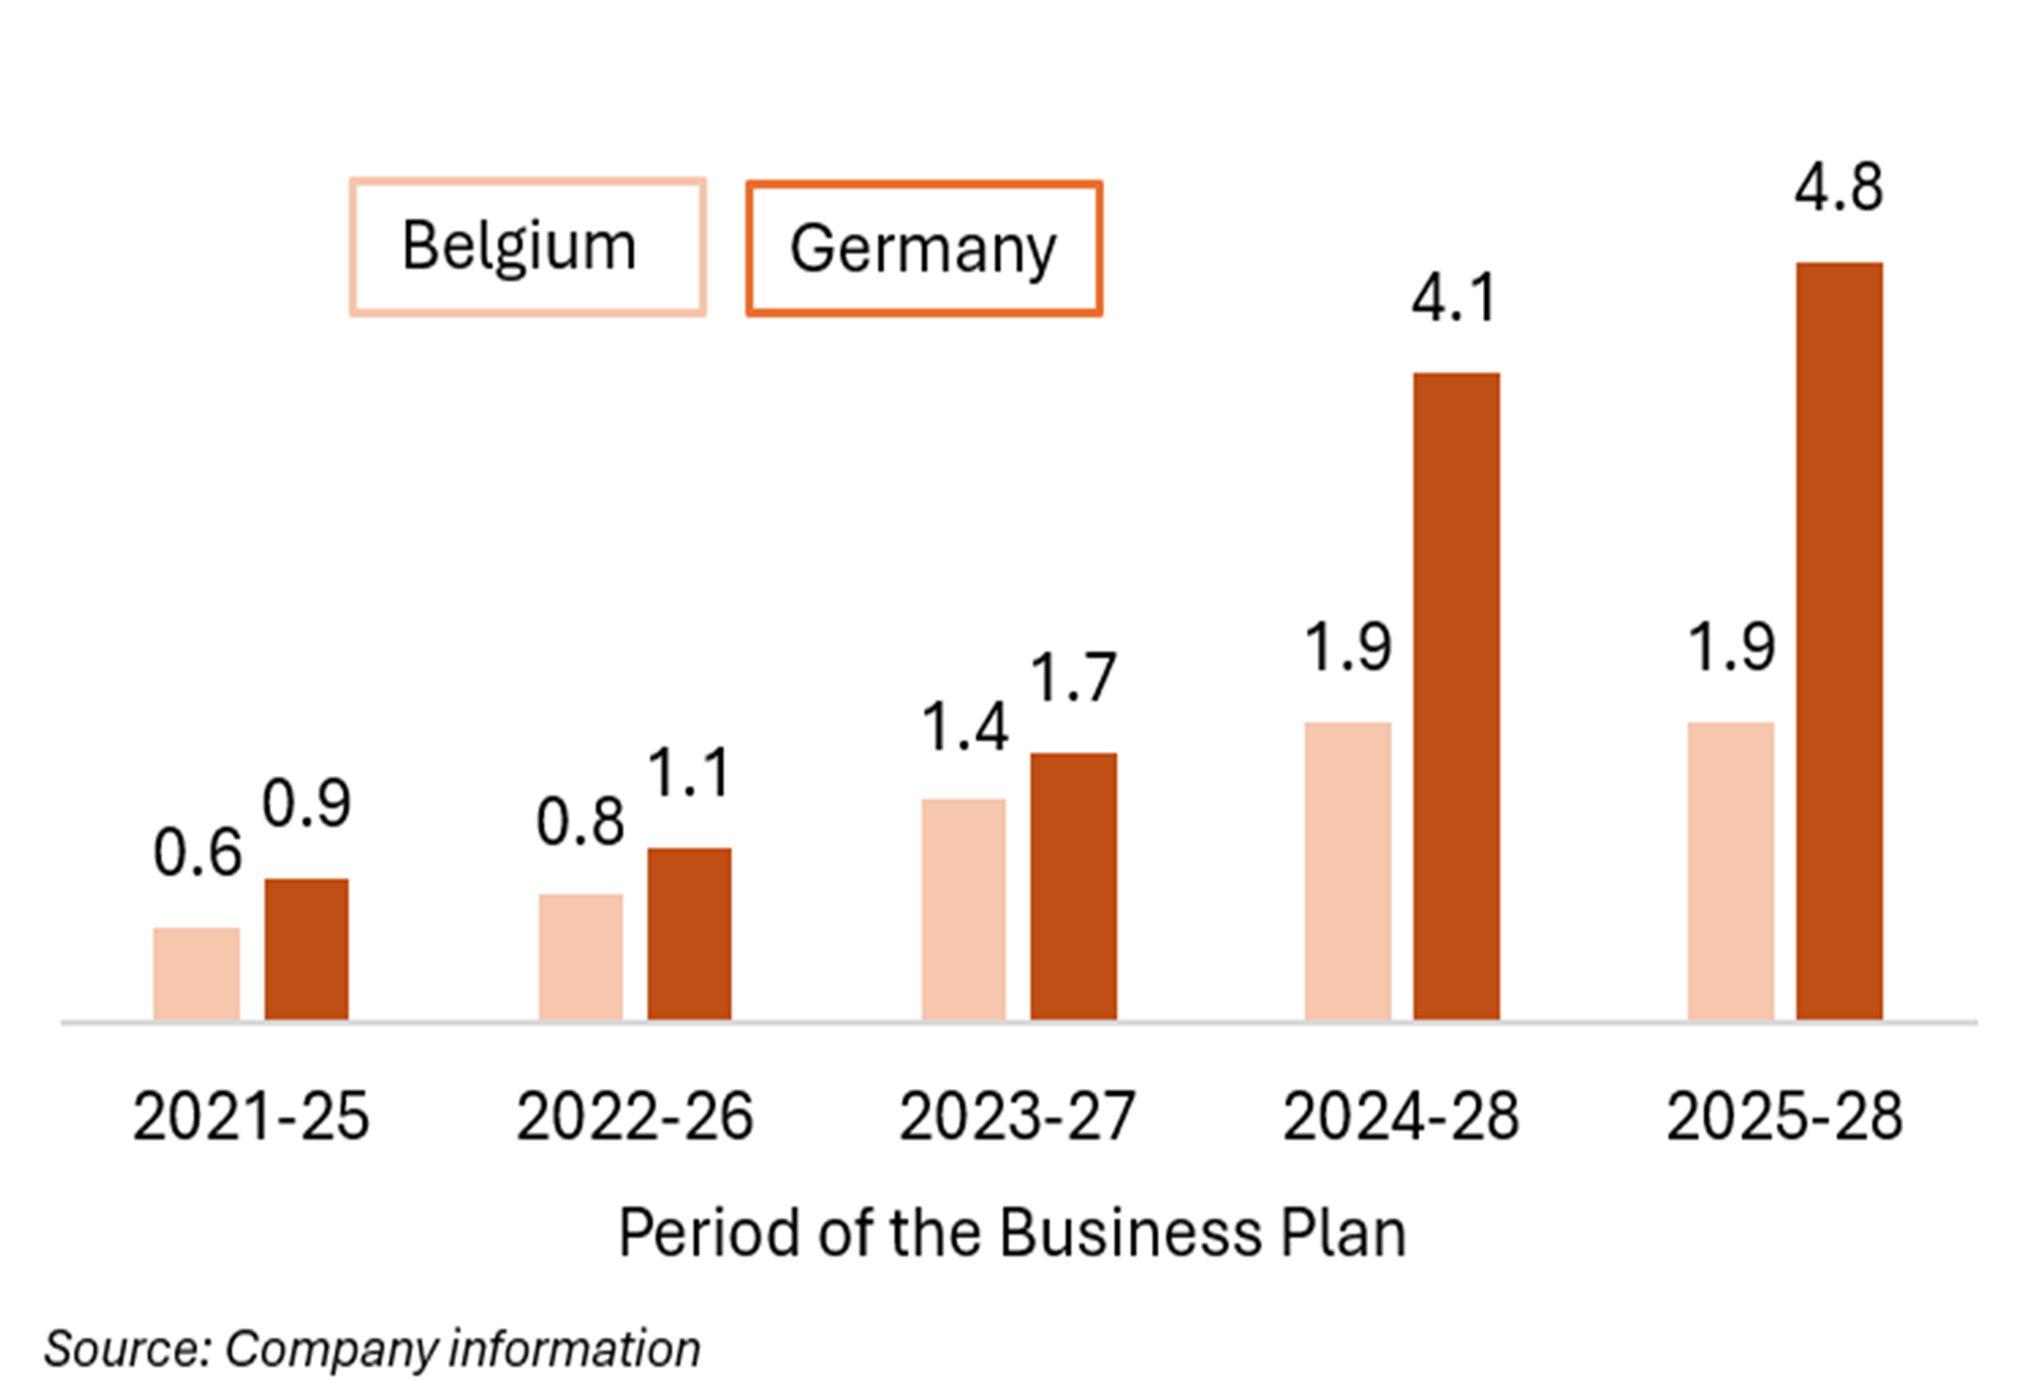
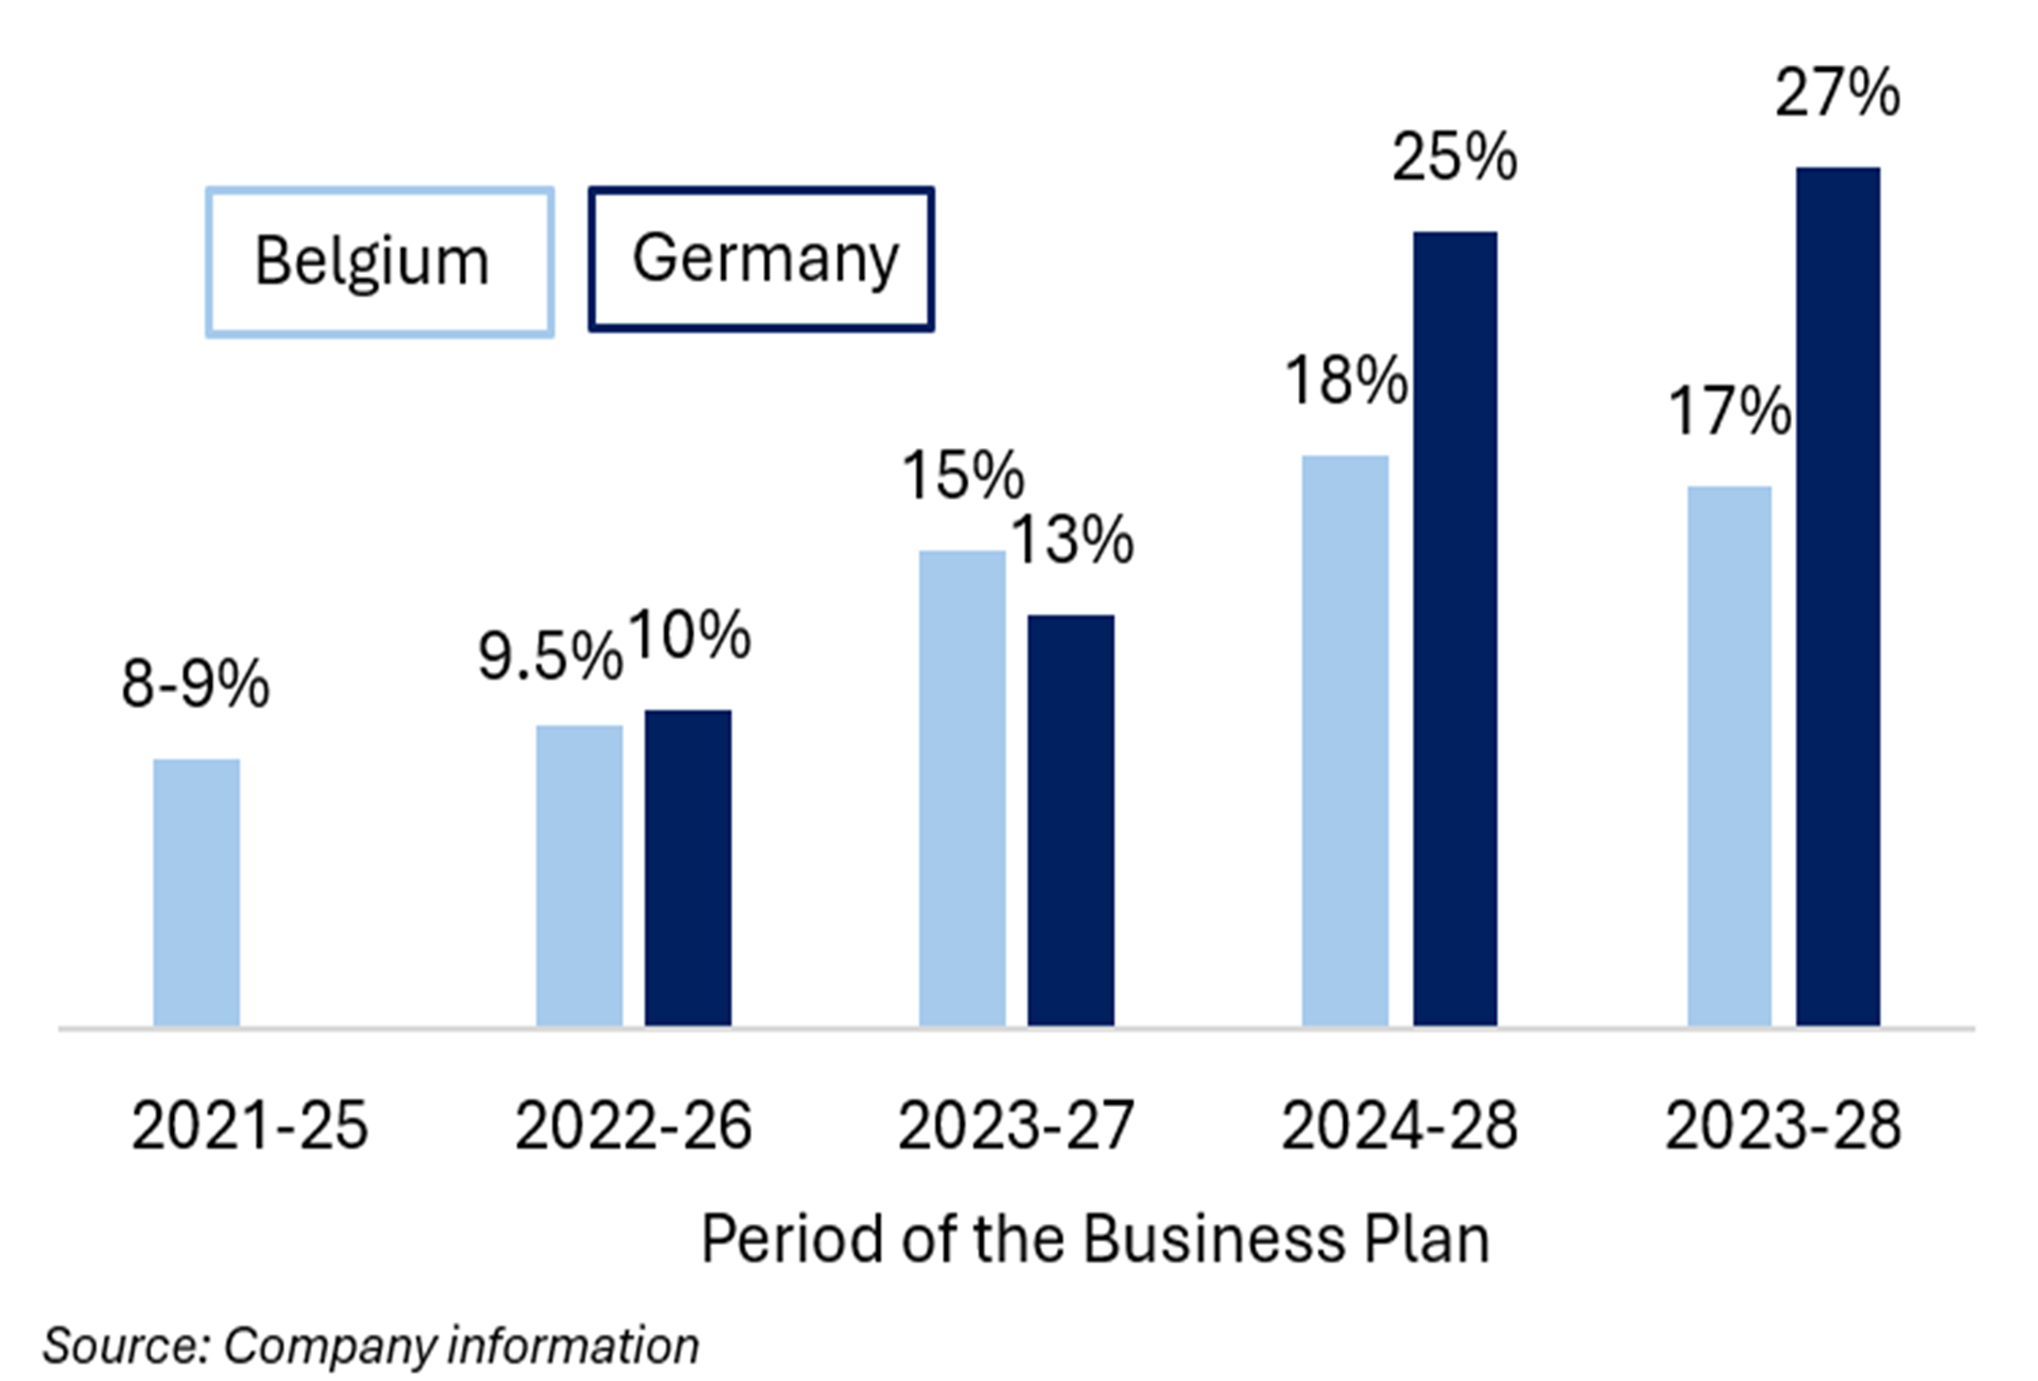

Exhibit 11 Nat. Grid – Annual Capex (£bn) | Exhibit 12 Nat. Grid – Guided RAB CAGR (%)

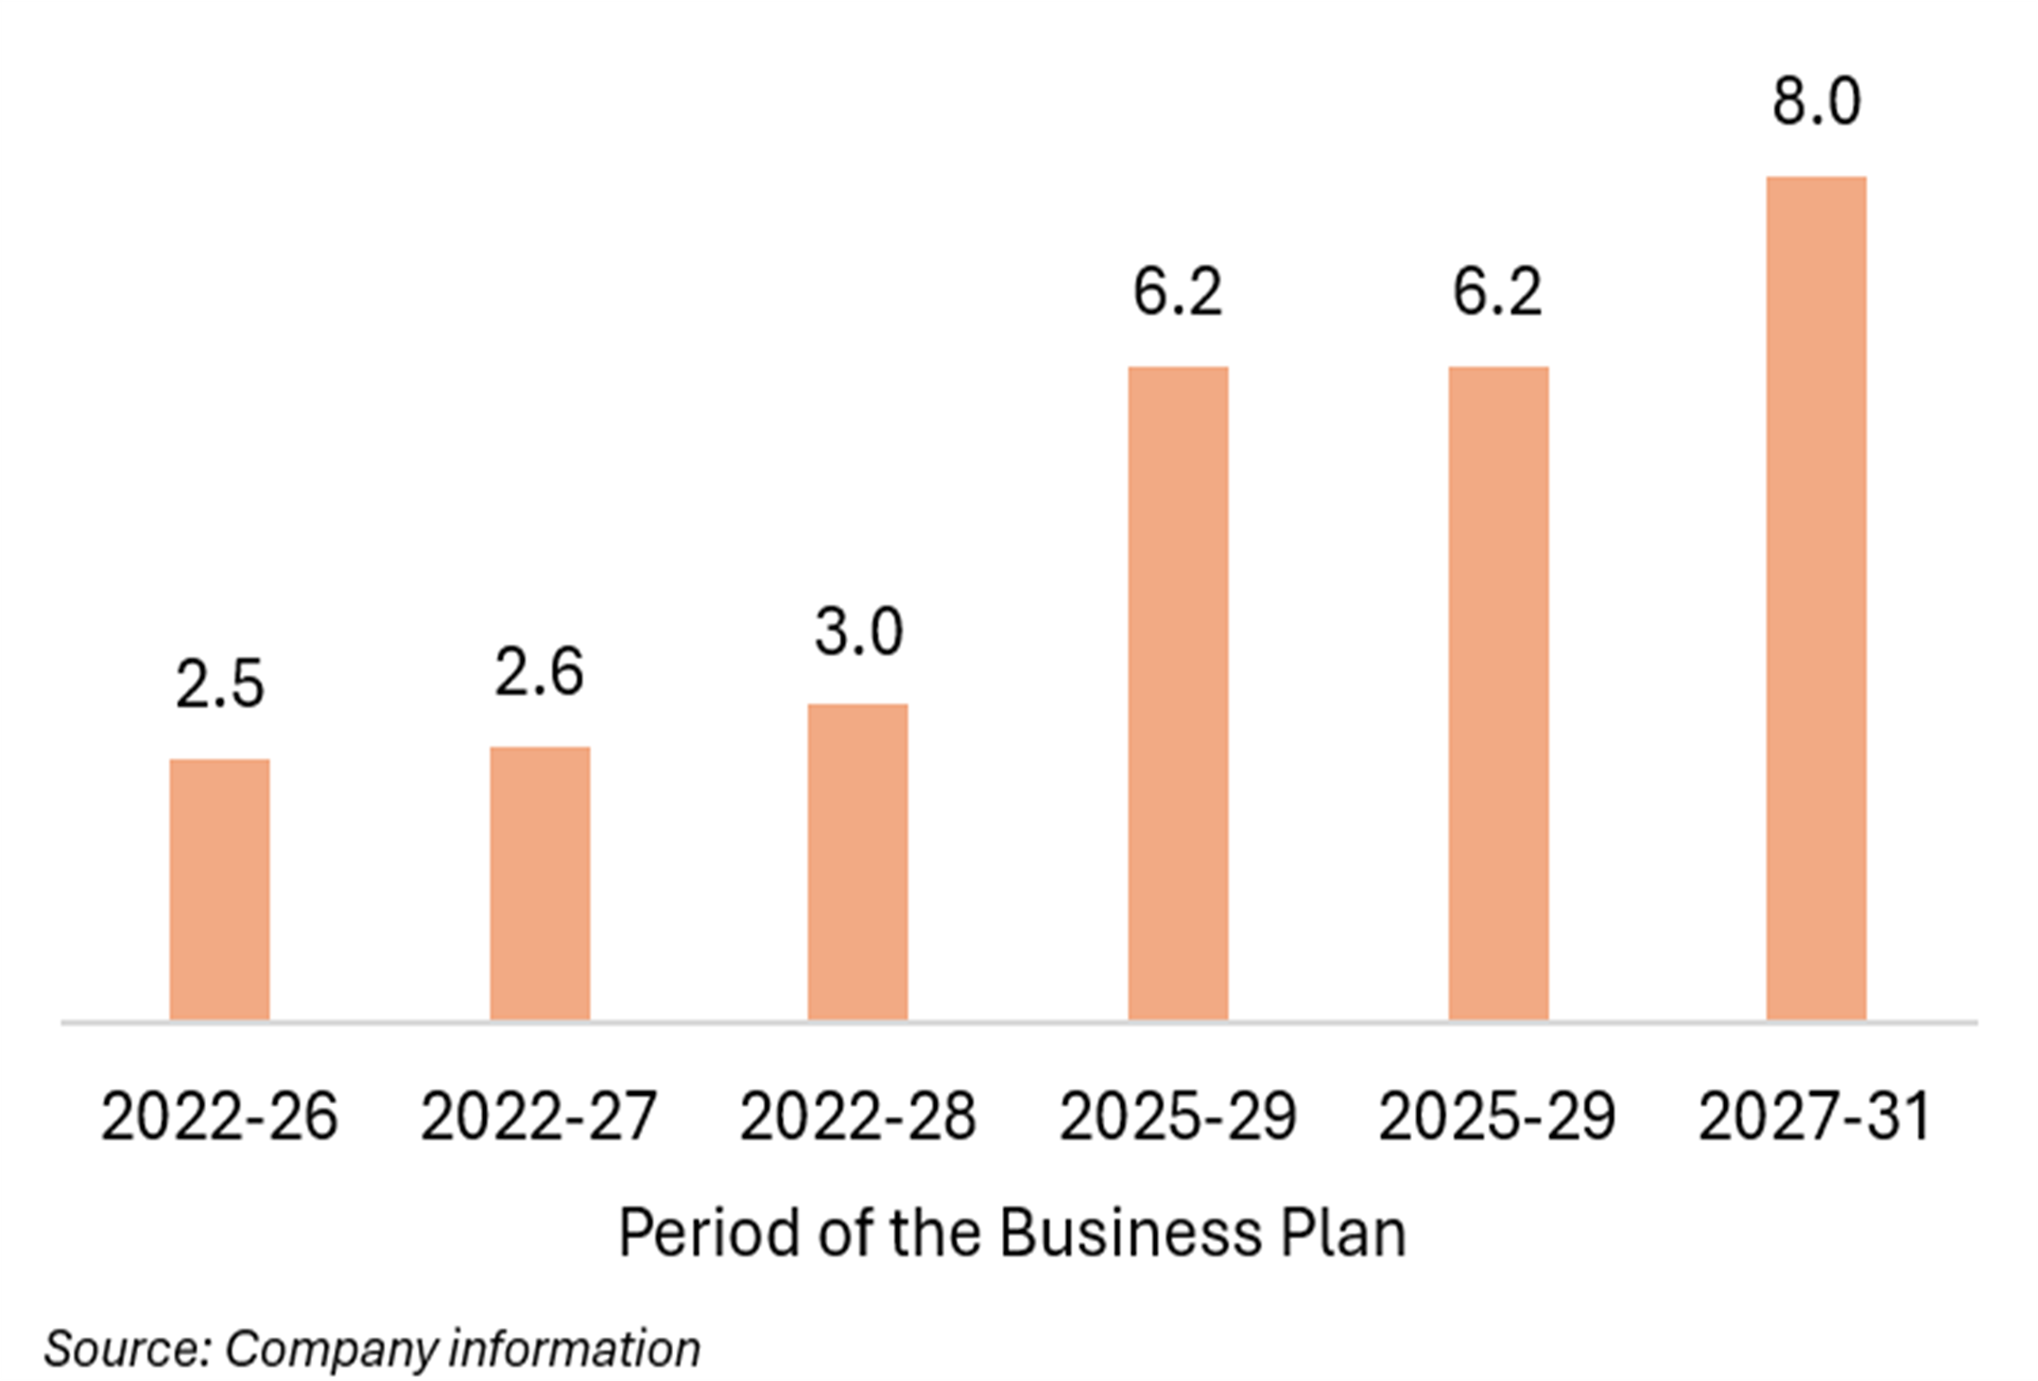
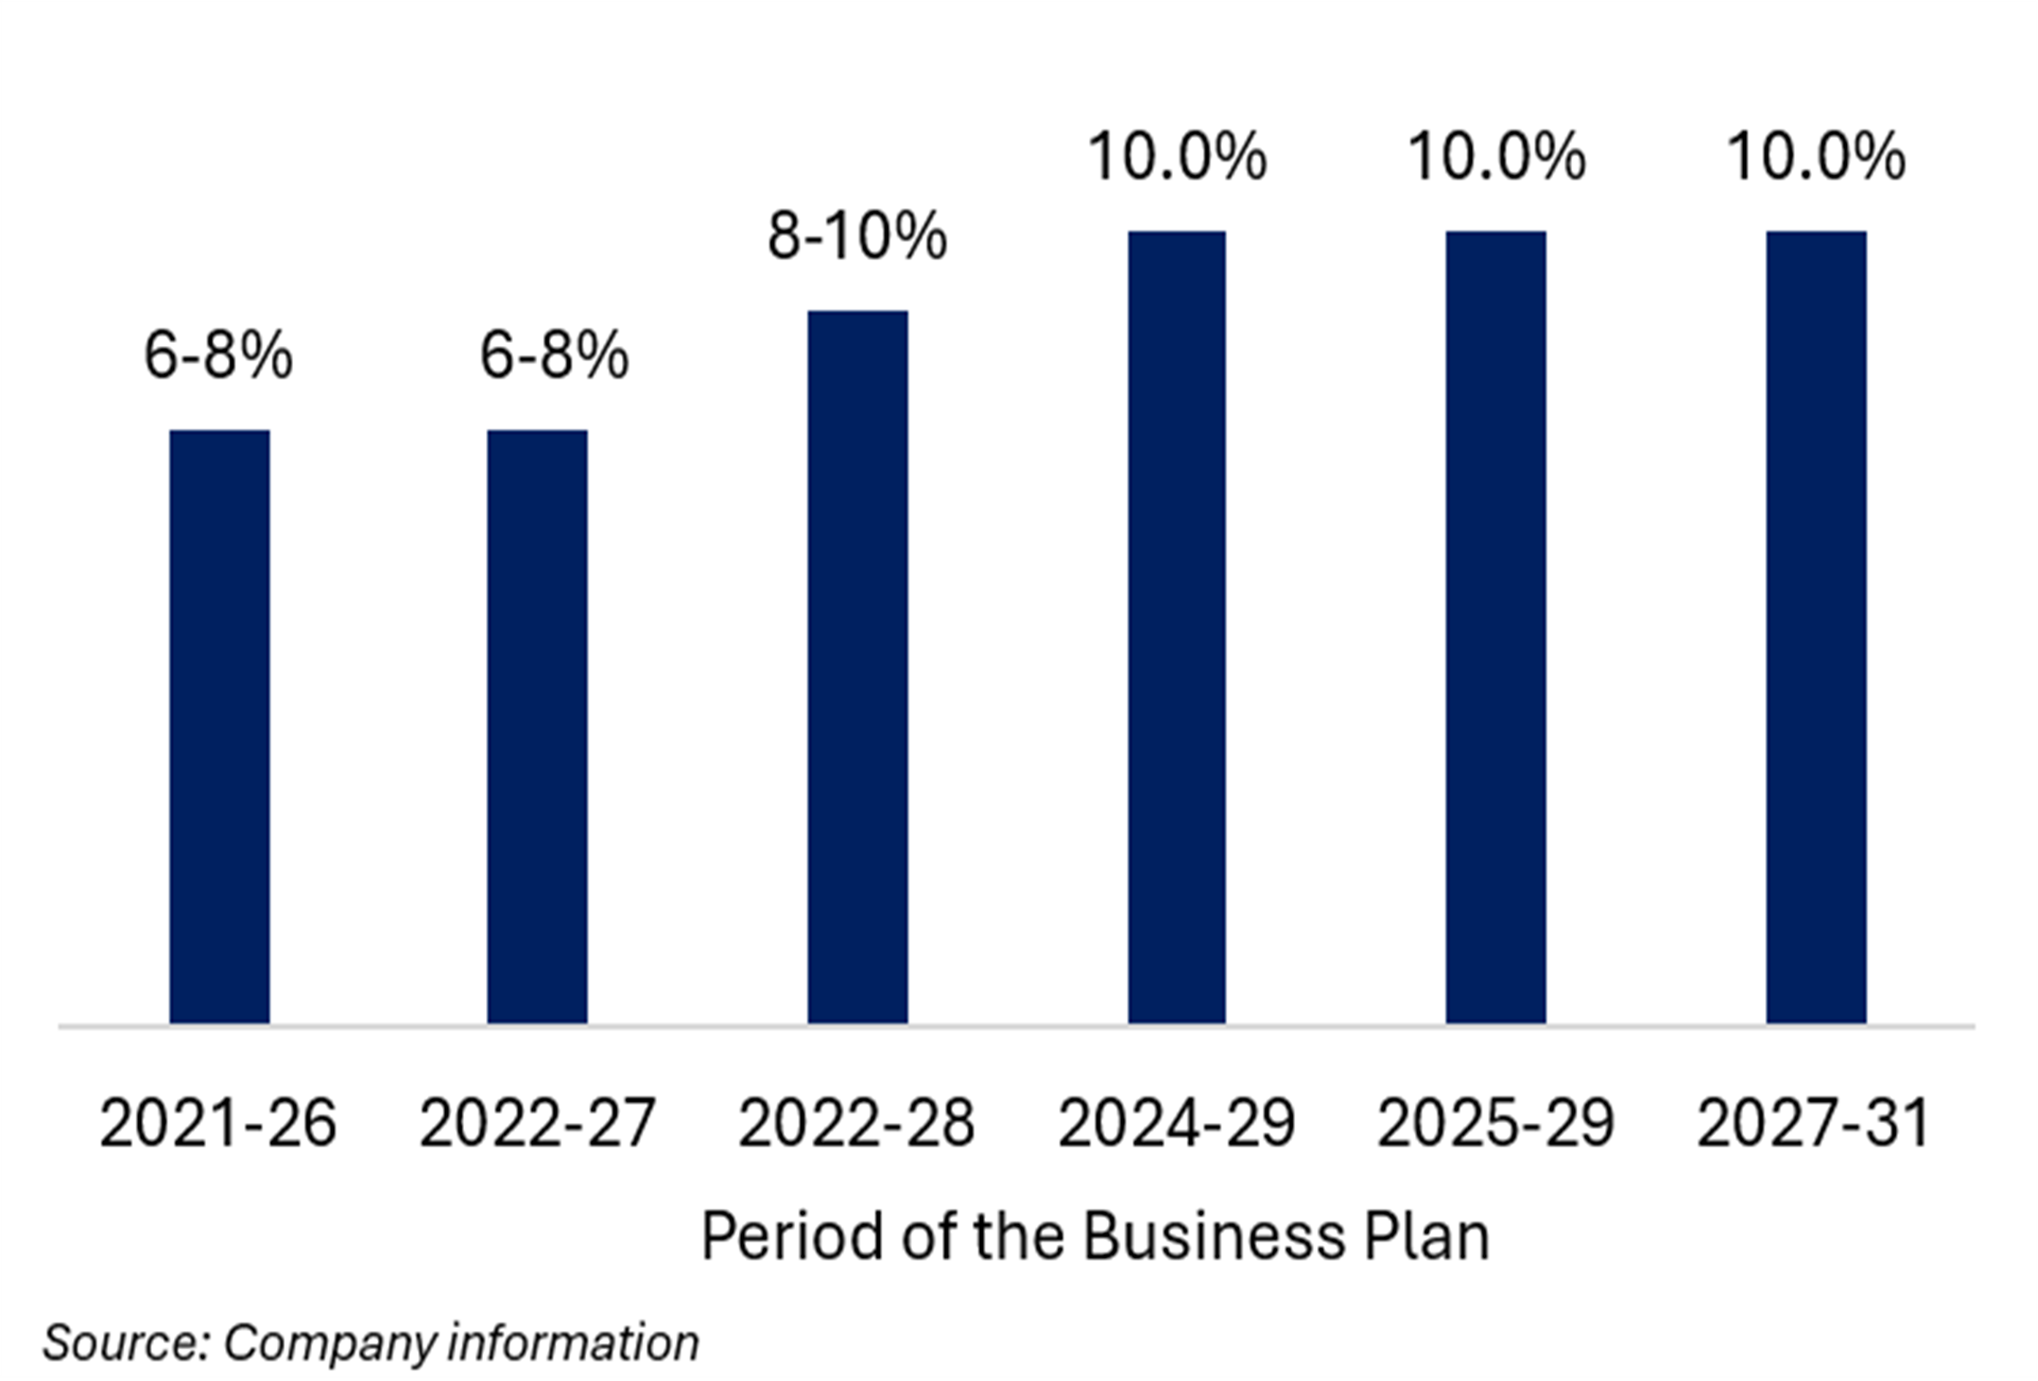

Exhibit 13 Terna – Annual Capex (£bn) | Exhibit 14 Terna – Guided RAB CAGR (%)

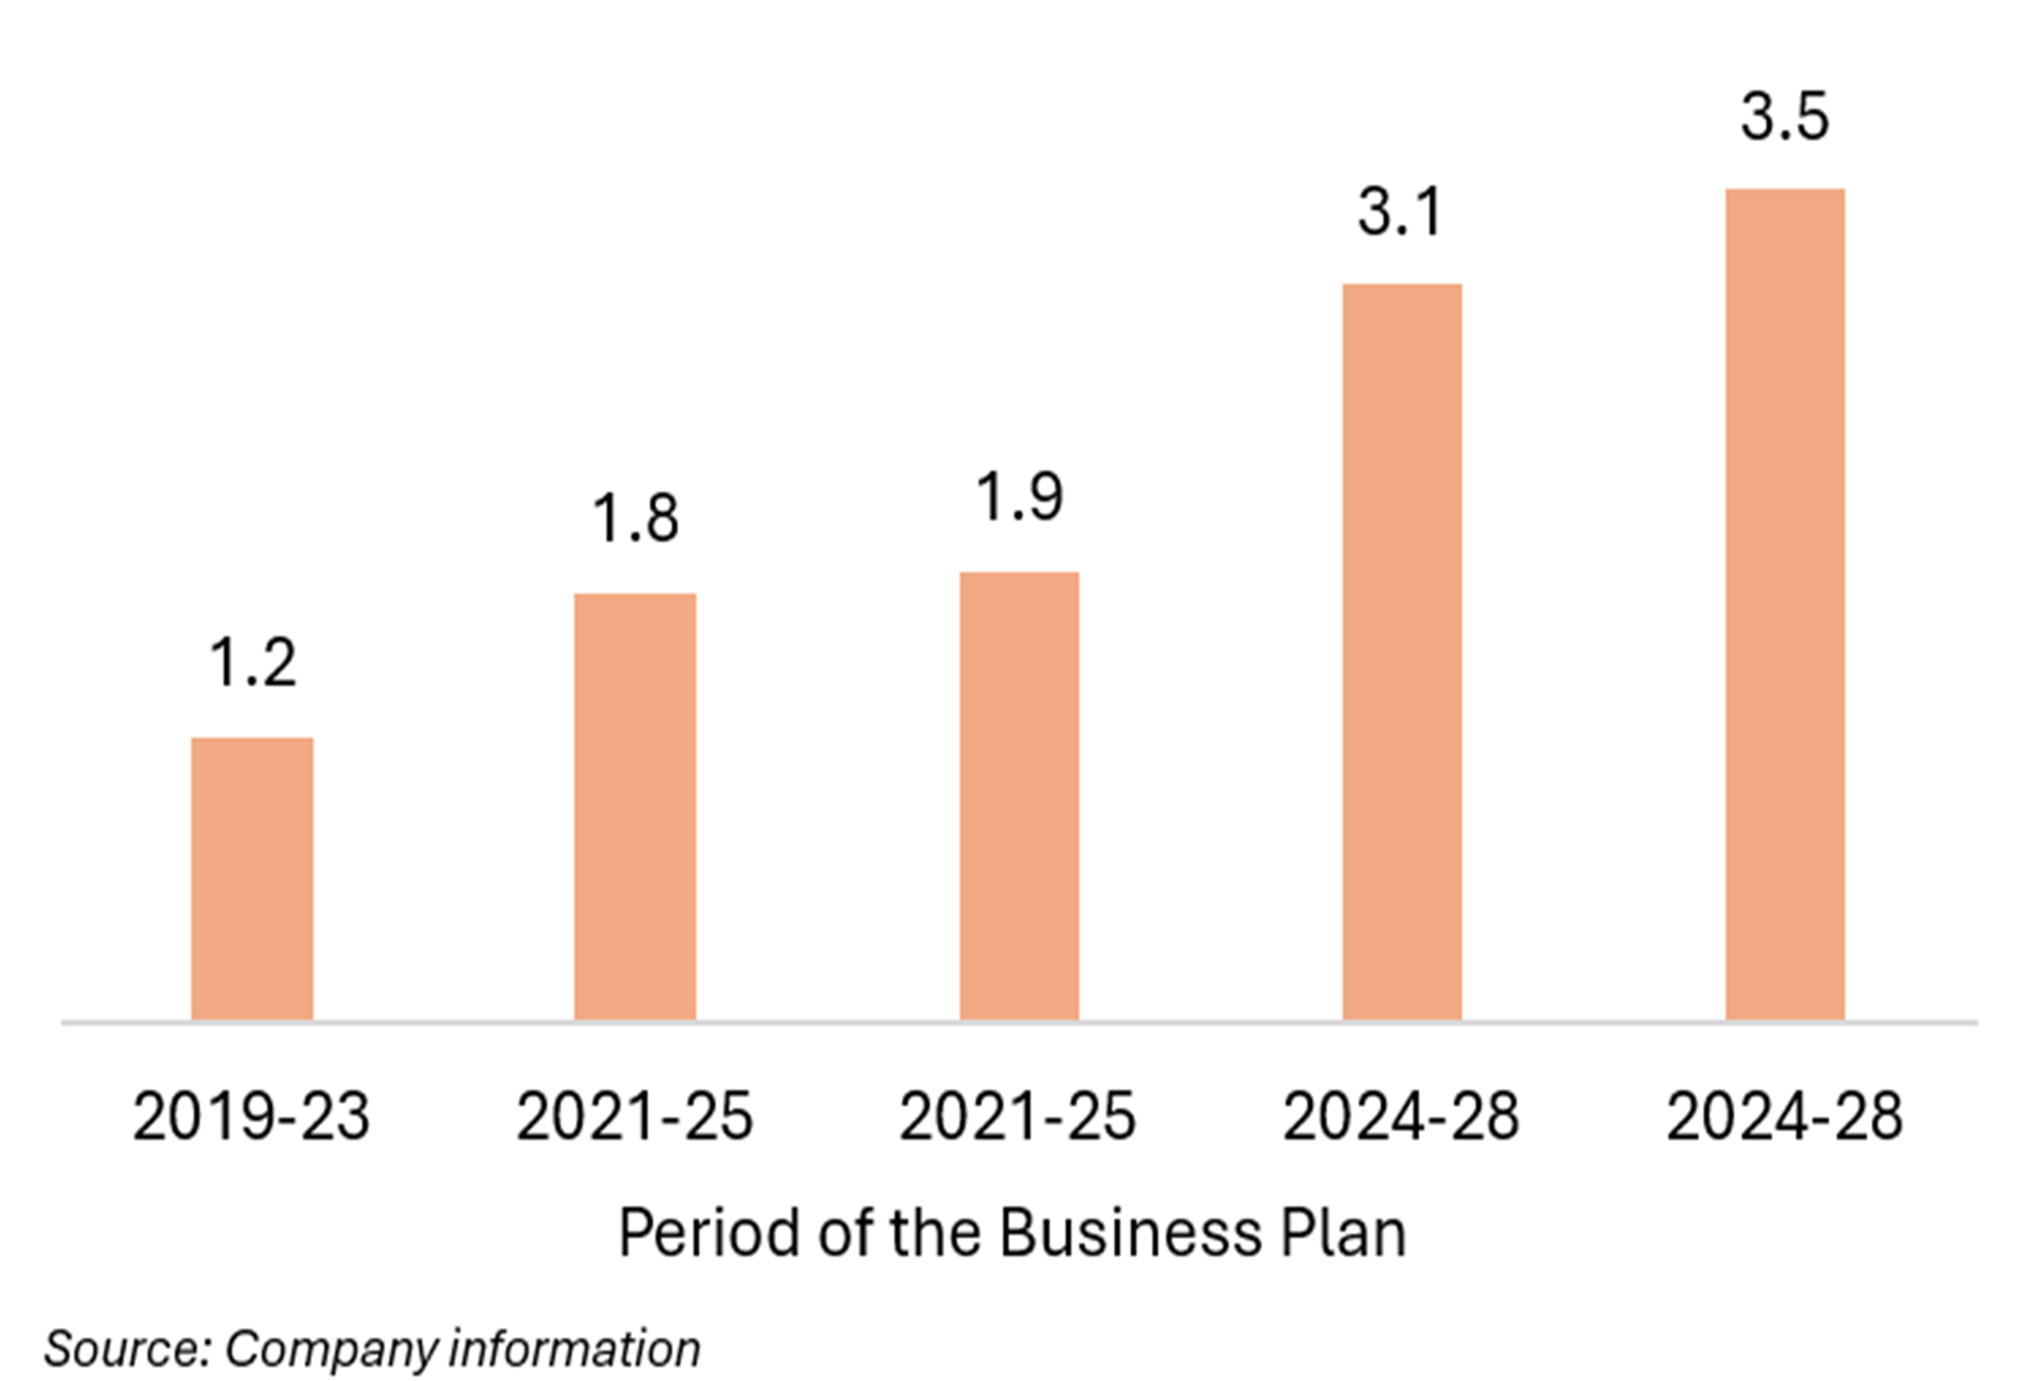
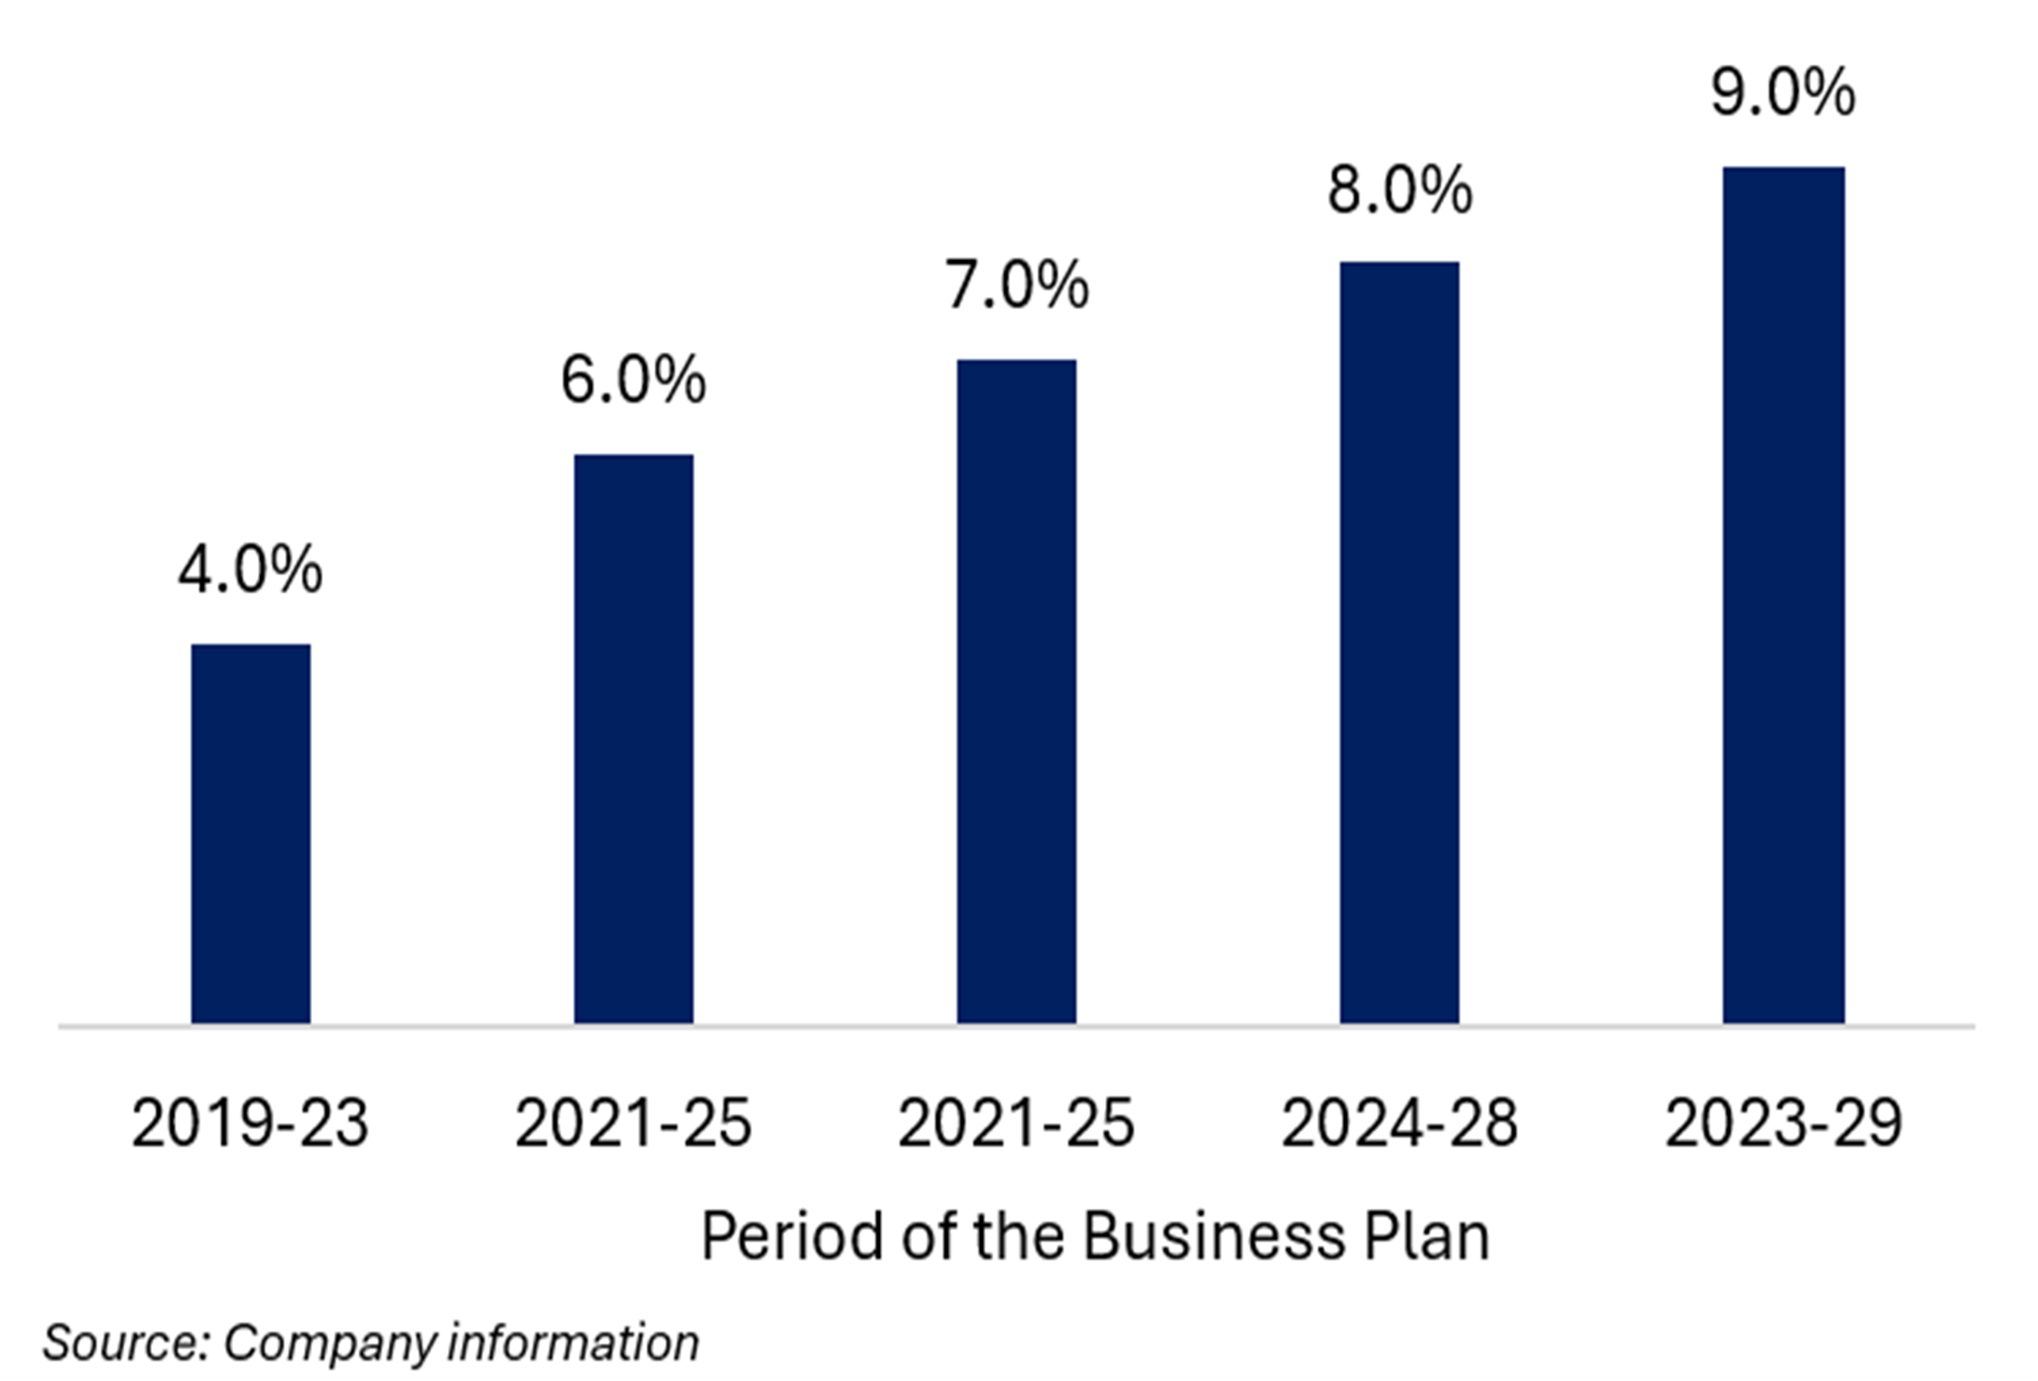

Exhibit 15 Redeia – Annual Capex (£bn) | Exhibit 16 Redeia – Guided RAB CAGR (%)

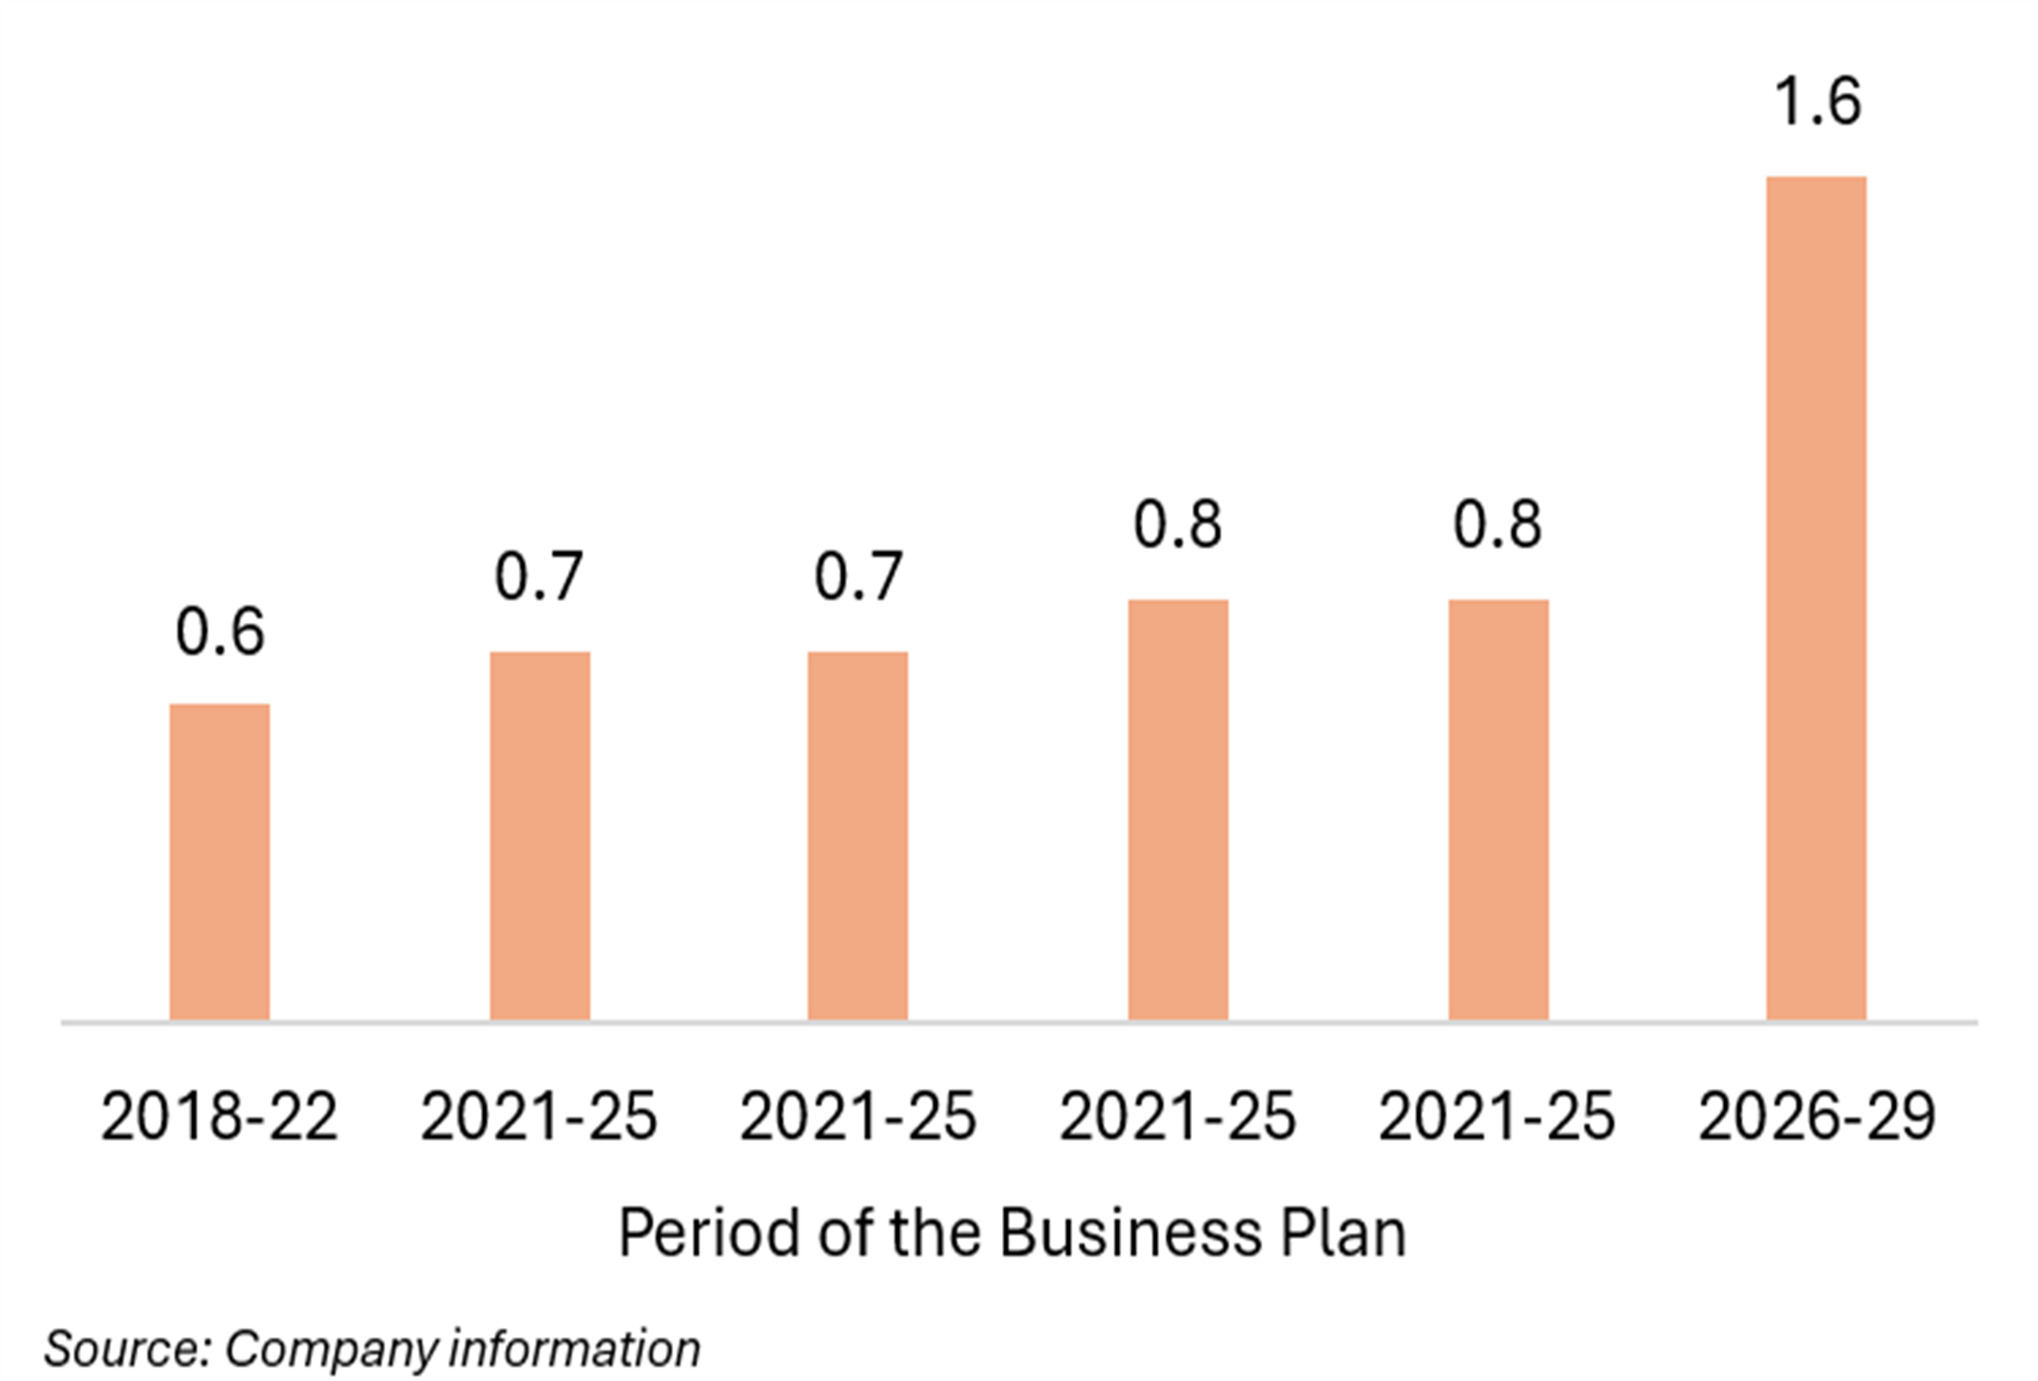
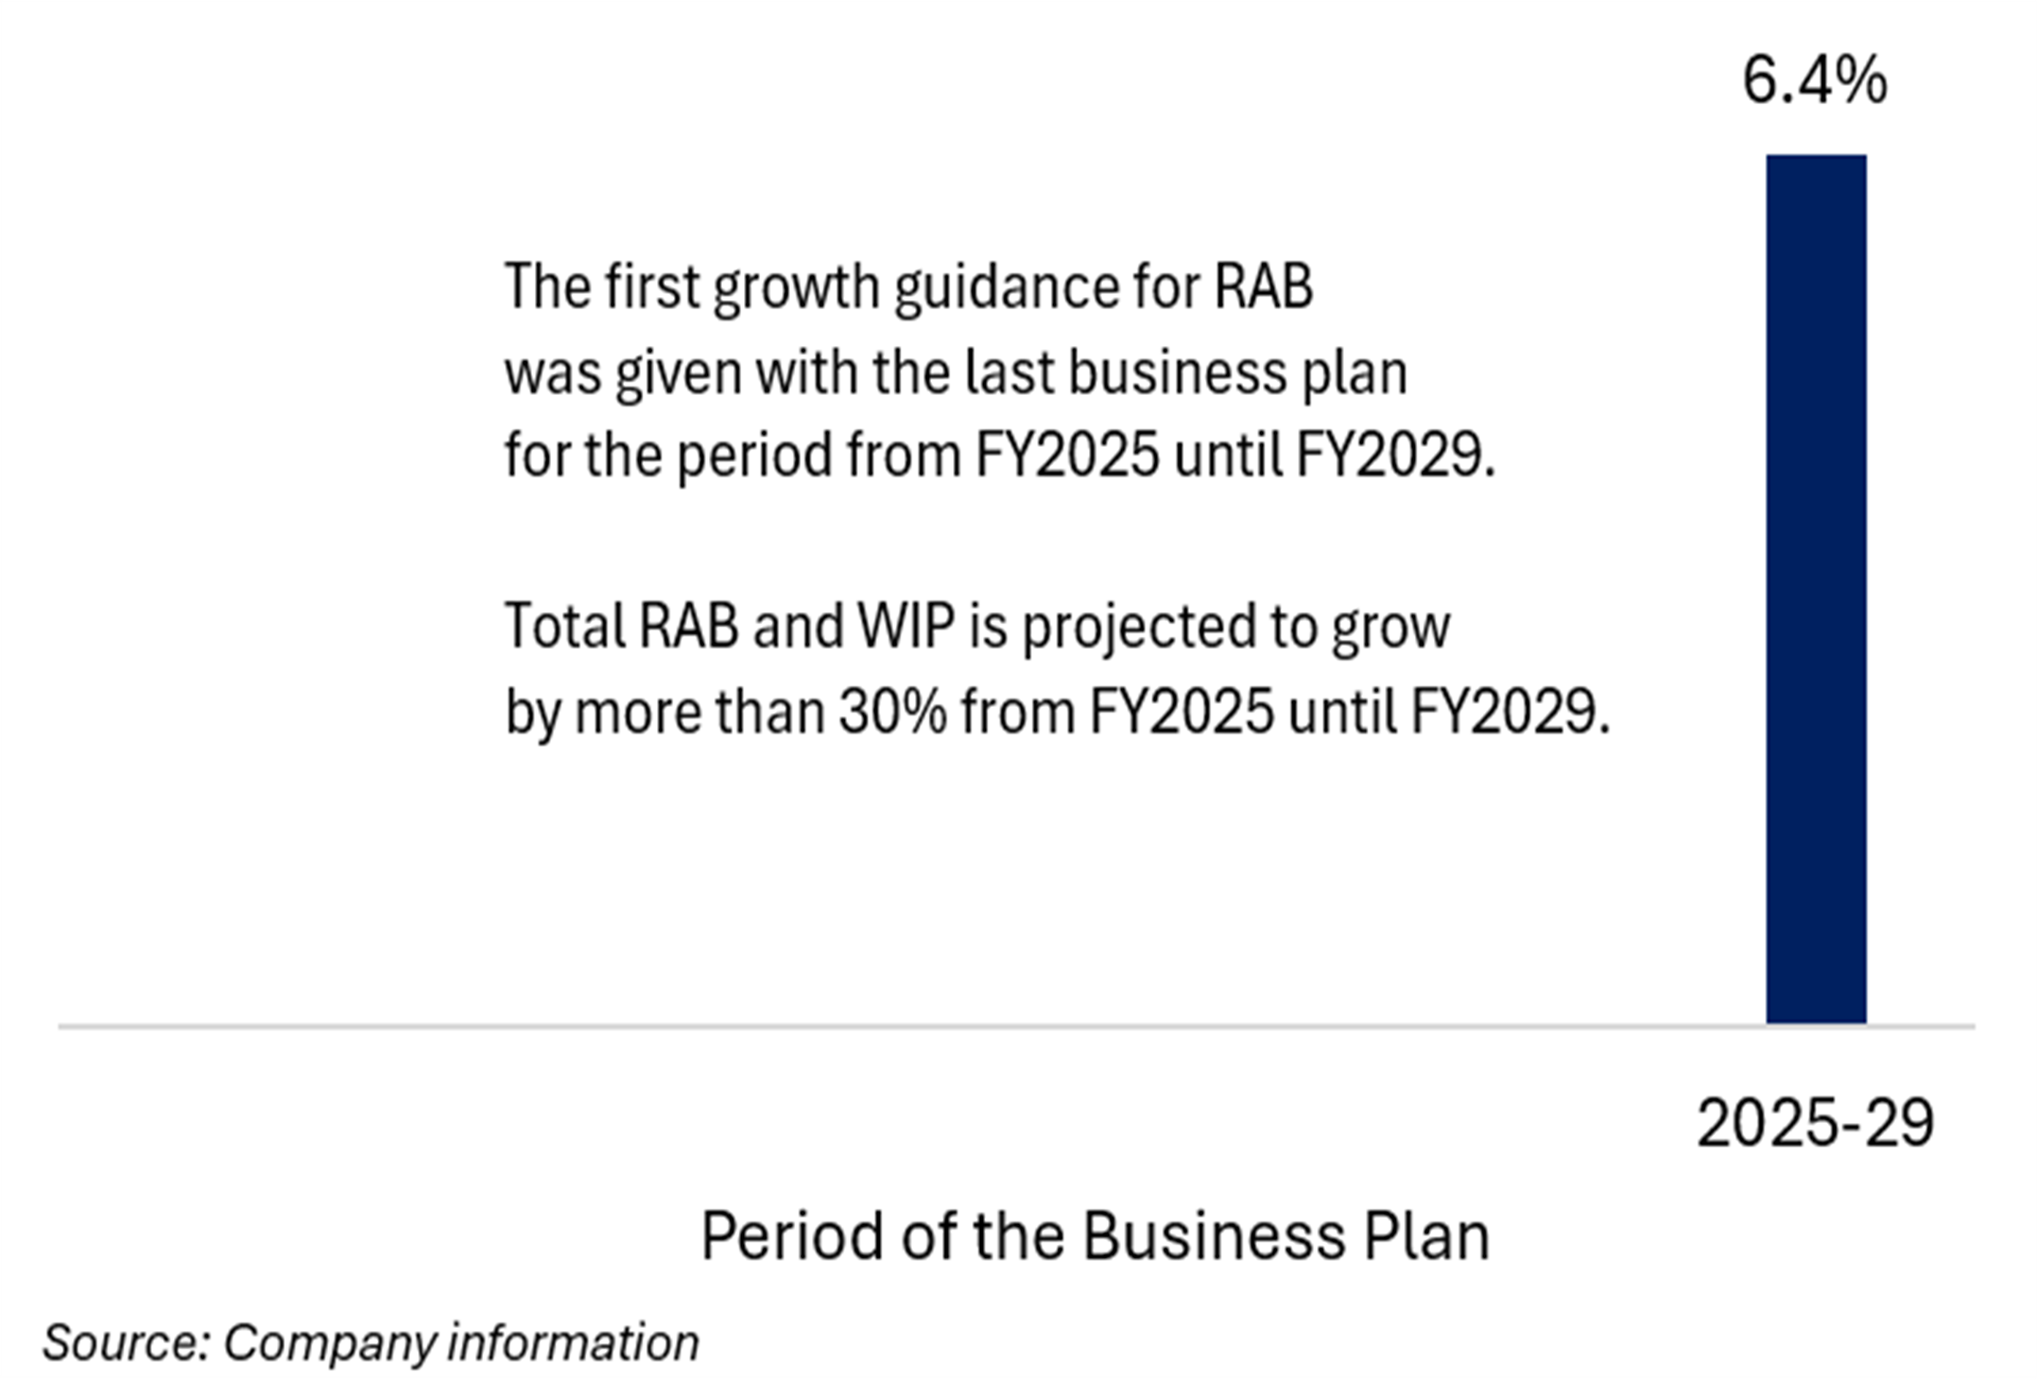

What Are The Risks For European Network Companies?
First, financing the projected growth puts pressure on balance sheets
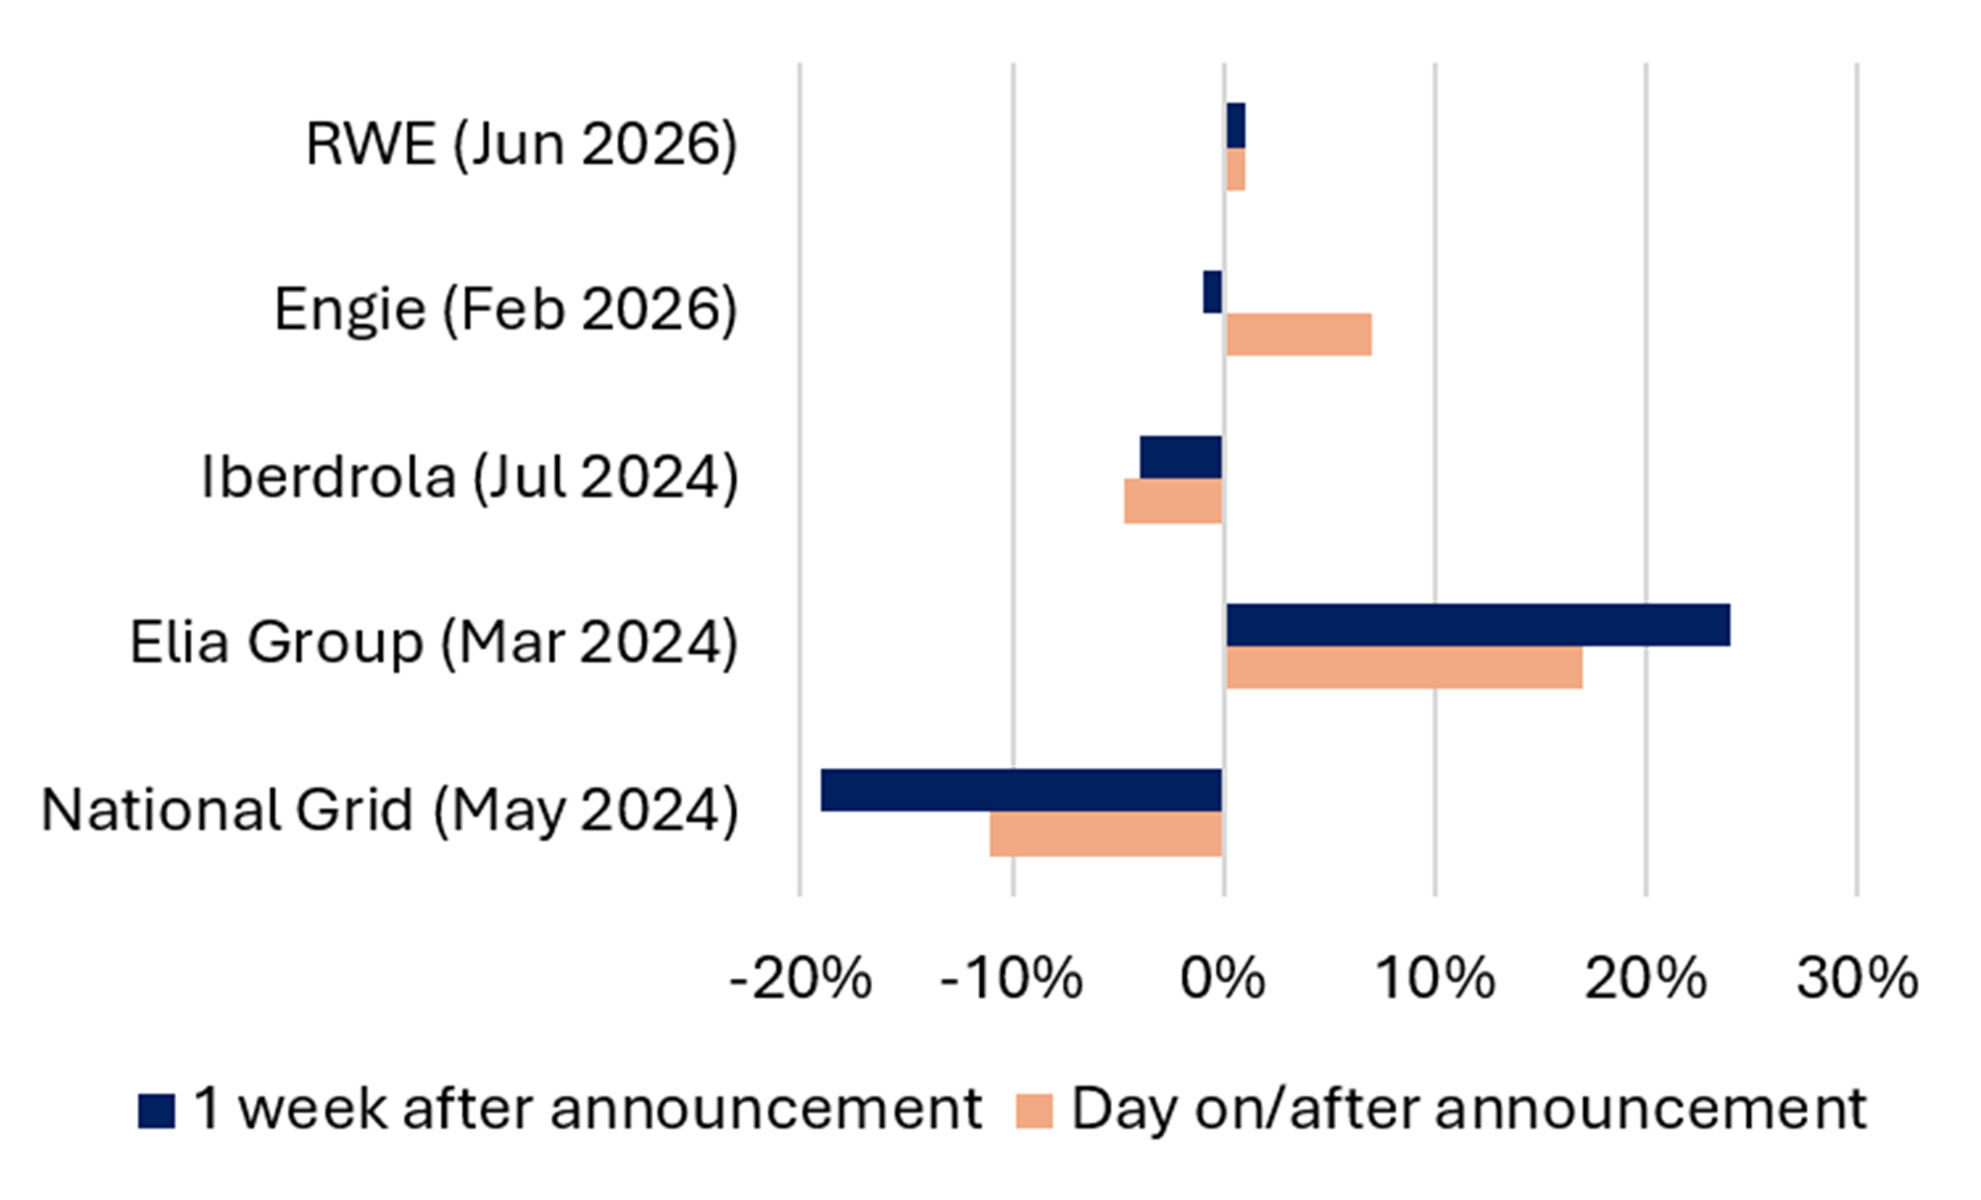
Several network companies have already raised new equity alongside debt to finance the unprecedented capex and RAB growth expected over the next five to ten years. National Grid, Elia and Iberdrola all raised substantial equity earmarked specifically for network capex. National Grid issued £7bn of new equity in May 2024 to help fund its £31 billion five-year UK/US transmission and distribution investment program. Elia Group followed in the first half of 2025 with a €2.2 billion equity raise supporting its €31.6 billion 2024-2028 capex plan for its Belgian and German power grids. Iberdrola then completed an accelerated capital increase of roughly €5 billion in July 2025 to fund its ramped-up UK and US network investment plan of €55 billion through 2031.
By contrast, the equity raises of Engie and RWE were acquisition-driven rather than organic capex-driven. In February 2026, Engie acquired UK Power Networks for an equity value of £10.5 billion, financed through roughly €5 billion of debt and hybrid issuance, €4 billion of planned asset disposals by 2028, and up to €3 billion of new equity via an accelerated bookbuilding. Similarly, in June 2026, RWE increased its indirect stake in Amprion from 25.1% to 55%, funded by a €4 billion equity raise.
After the sharply negative share price reaction to National Grid’s capital increase more than two years ago, subsequent raises have triggered significantly less volatility – particularly where the new equity funds an earnings-accretive acquisition (see RWE and Engie in Exhibit 17). Investors therefore appear to be warming to the view that new equity can be money well spent if it finances future RAB and earnings growth. That shift matters, because further equity raises remain highly likely: the alternative is more debt on already stretched balance sheets, which risks jeopardizing credit ratings.
Exhibit 17 Share Price Moves Post Equity Raise


Source: Company information, LSEG
Exhibit 18 10yr Bund vs. Power Network index
Source: Gabelli Funds, LSEG
Second, rising inflation and higher interest rates could weigh on investor sentiment
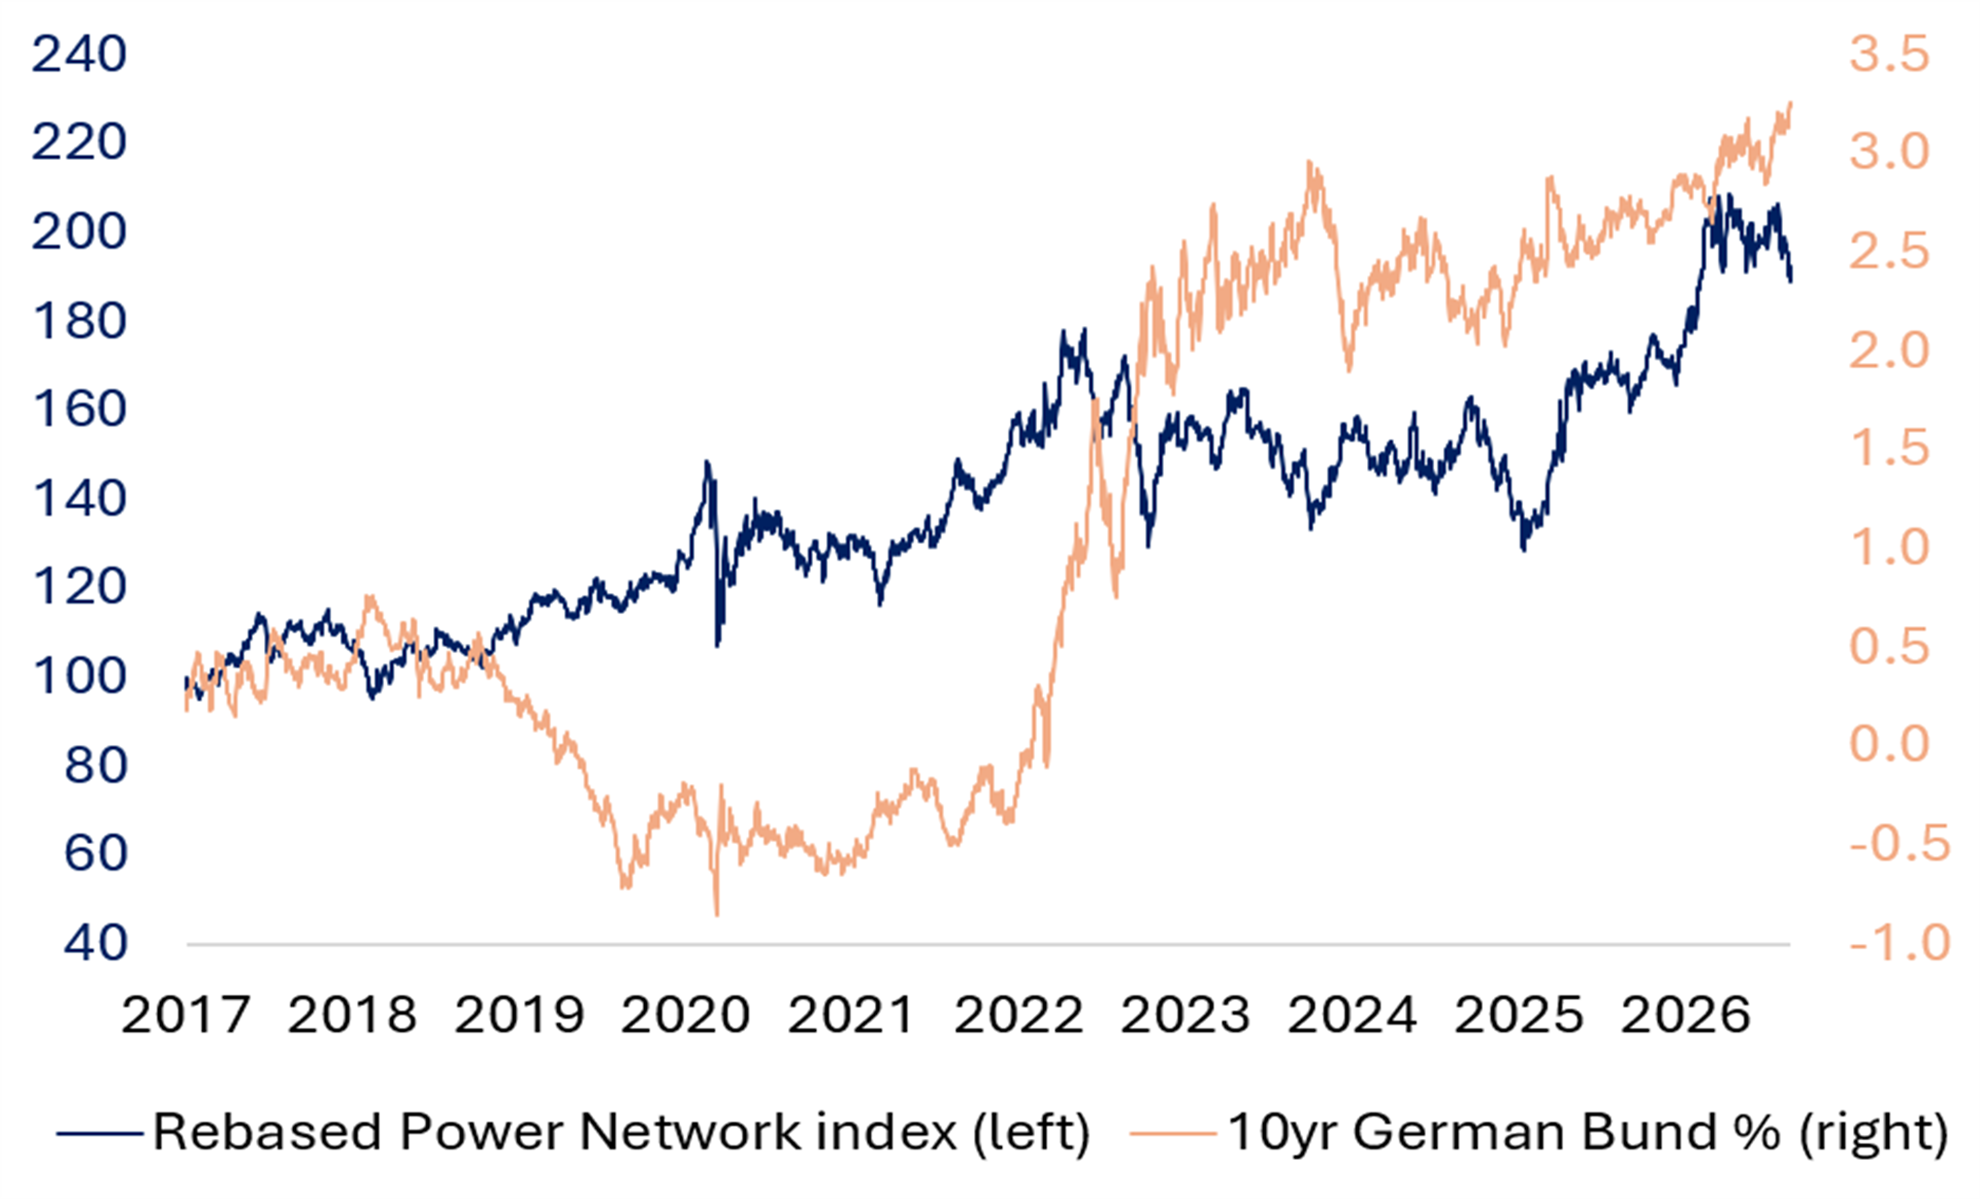
Regulated electricity network operators are highly sensitive to changes in inflation and real interest rates, which has become a growing concern since the outbreak of the war in Iran. Regulators in several European countries do, however, offer inflation protection, with RAB values adjusted annually in line with national inflation (full protection in the UK and Italy, partial in Germany, and none in Spain).
Utilities stocks in general are highly sensitive to interest rates, as they are widely regarded as “bond proxies.” Network stocks, however, appear less exposed than renewable power generation companies, because they benefit from periodic allowed return adjustments that reflect changes in risk-free rates. Our equal-weighted Power Network index in Exhibit 18 rose while the 10-year German Bund yield was negative in 2019-2022 and corrected when German rates climbed to 3% in 2023-24, before easing back to 2% over the course of 2024. Since the start of 2025, by contrast, network stocks have posted solid gains even as German rates rebounded from 2% to above 3% on the back of rising inflation expectations following the outbreak of the war in Iran (see Exhibit 18).
A Vibrant Market for Private Transactions in European Power Network Operators
The following section analyses the deal multiples for which Electricity Network Operators were recently sold in private market transactions to so-called “informed industrial buyers” – large private equity infrastructure investors, sovereign wealth funds, pension funds, or another electricity network company. The market for private transactions in European grid companies is currently vibrant: operators either sell minority stakes to finance their capex growth, or they acquire smaller peers to consolidate Europe’s highly fragmented DSO markets (TSO markets are more concentrated, with fewer players in each country).
Transmission System Operators command a valuation premium to their RAB because they operate as regulated monopolies within their control areas – only a handful exist per country – and because transmission networks are now regarded as critical infrastructure for national and regional energy security and for the energy transition, connecting intermittent renewables to the grid and providing cross-border interconnection.
In June 2026, RWE increased its stake in the German TSO Amprion from 25.1% (held via a joint venture with private equity firm Apollo) to 55%, acquiring the additional shares from the private investment vehicle M31 Beteiligungsgesellschaft mbH & Co. Energie KG. Amprion is one of Germany’s four TSOs, and the deal was struck at a 2025 EV/RAB of €1.25 million, equivalent to 13.4x Amprion’s FY2025 EBITDA and implying an EBITDA/RAB return of 9.3% for FY2025, based on our calculations. On RWE’s own estimates at the time of the transaction, the multiple falls to €1.07 million for the projected 2027 RAB as the asset base is expected to grow. Given that RWE had already held 25.1% of Amprion, we regard it as a well-informed industrial buyer, and the price it was willing to pay for the incremental stake as a reliable reference multiple for transmission assets in the private market.
Similarly, in September 2025, TenneT Holding BV (fully owned by the Dutch state) placed a 46% minority stake in its German subsidiary TenneT Germany with a consortium of Norges Bank Investment Management (21.8%), Singapore’s GIC (13.2%) and a Dutch pension investor (11.0%) for $11.3 billion (or € 9.6 billion). The transaction valued TenneT Germany at an announced EV of €40bn, which on a FY2025 RAB of €36.8bn implies a 2025 EV/RAB of €1.09m. With underlying FY2025 EBITDA of €2.74bn, the EBITDA/RAB return was a comparatively low 7.4%, and the consortium negotiated a correspondingly lower EV/RAB than RWE paid for Amprion. On an earnings basis, however, they paid more – 14.6x FY2025 EBITDA versus 13.4x – precisely because the same RAB generates less EBITDA.
Distribution System Operators (DSOs) can also command a valuation premium to RAB when they are sold in whole or in part in the private market. Recent transactions point to an EV/RAB range of €1.7-2.5 million for DSOs, above the multiples paid for TSOs. Two factors plausibly explain the gap: distribution networks stand to benefit more from rising electricity demand, as explained above, and DSOs in our coverage universe generate higher EBITDA/RAB returns – in the mid-to high-teens – than TSOs.
In August 2024, Iberdrola acquired an 88% stake in Electricity North West (ENW), a UK DSO, through a competitive auction that valued the whole company at an EV of £4.2 billion against a full company RAB of £2.9 billion. We assume that Iberdrola, as a well-informed buyer, already had visibility on ENW’s 1H 2024/25 results (to September 2024), which were only published in December 2024, and we therefore take trailing 12-month EBITDA to September 2024 (£407 million) as the basis for our multiple analysis.
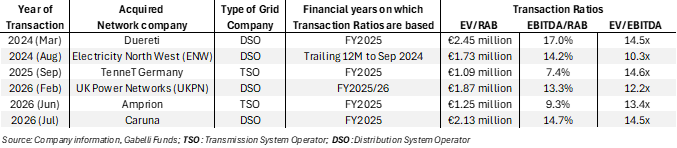
On that basis, Iberdrola paid an EV/RAB of £1.46 million (or €1.73 million at August 2024 exchange rates), well above the TSO multiples cited above. The premium reflects the competitive auction process, but also the asset’s stronger earnings power: ENW’s EBITDA/RAB return was 14.2%, and the transaction priced at 10.3x EBITDA (see Table 2).
Table 2 Private Market Transactions for European Electricity Networks

Engie, which had lost the competitive auction for ENW to Iberdrola in 2024, took its second opportunity to acquire a UK distribution network and close a strategic gap in its business portfolio. In February 2026, it paid an EV of £15.8 billion for 100% of UK Power Networks (UKPN), a DSO operating in South East England, the East of England and London. UKPN was not up for sale: Engie approached the consortium of infrastructure investors led by CK Infrastructure Holdings directly and persuaded them to sell. The absence of a competitive process did not translate into a lower price – Engie paid an even higher premium to RAB than Iberdrola did, in effect the cost of pre-empting an auction that never took place.
We base our UKPN deal multiples on the FY2025/26 annual report, published in May 2026 shortly after the February announcement, on the assumption that Engie – again a well-informed buyer with full due diligence access – had good visibility on the near-complete FY2025/26 year when it negotiated in early 2026. On that basis, Engie paid an EV/RAB of £1.63 million, or €1.87 million at February 2026 exchange rates, against a slightly lower EBITDA/RAB return of 13.3% (FY2025/26). The transaction accordingly priced at 12.2x FY2025/26 EBITDA, against 10.3x that Iberdrola paid for ENW.
In July 2026, Iberdrola acquired an 80% stake in Caruna, Finland’s largest electricity DSO, for an equity consideration of €2 billion, implying an EV of €5.0 billion for the whole company including net debt of €2.47 billion. Caruna’s last annual report before the acquisition (FY2025) disclosed EBITDA of €344 million but no RAB for its network business. At the time of the transaction, however, Iberdrola projected a Caruna RAB of €2.54 billion in FY2027, growing to €3.0 billion by 2031, which implies a 2027-31 CAGR of 4%, alongside FY2027 EBITDA of €369 million.
Applying that same 4% rate backwards from Iberdrola’s FY2027 projection, we estimate a FY2025 RAB of €2.35 billion as a proxy for the asset base at the time of the deal. However, this might be a conservative assumption, as the RAB growth is probably front-loaded and the 2025-27 growth rate was most likely above 4%, which would imply a FY2025 RAB below €2.35 billion.
On our RAB estimate of €2.5 billion, Iberdrola paid an EV/RAB of €2.1 million on our estimated FY2025 RAB and €2.0 million on Iberdrola’s FY2027 estimate, for an EBITDA/RAB return of around 14.7% in both years. The corresponding EV/EBITDA multiple ranges from 14.5x in FY2025 to 13.6x in FY2027. Iberdrola justifies the premium by pointing to Finland’s data center pipeline, with the national power system operator projecting electricity demand growth of 22% to 45% by 2030.
The highest multiple in our sample predates all of these. In March 2024, the Italian utility A2A acquired a 90% stake in Duereti, the DSO for the Milan and Brescia provinces, from Enel for €1.2 billion, valuing the whole company at an EV of €1.35 billion. A2A’s FY2025 annual report shows the acquisition contributing €93 million of EBITDA to its “Smart Infrastructure Business Unit” and a RAB addition of roughly €550 million, both on a fully consolidated basis. That implies an EV/RAB of €2.45 million on an EBITDA/RAB return of 17%, and an EV/EBITDA of 14.5x for Duereti.
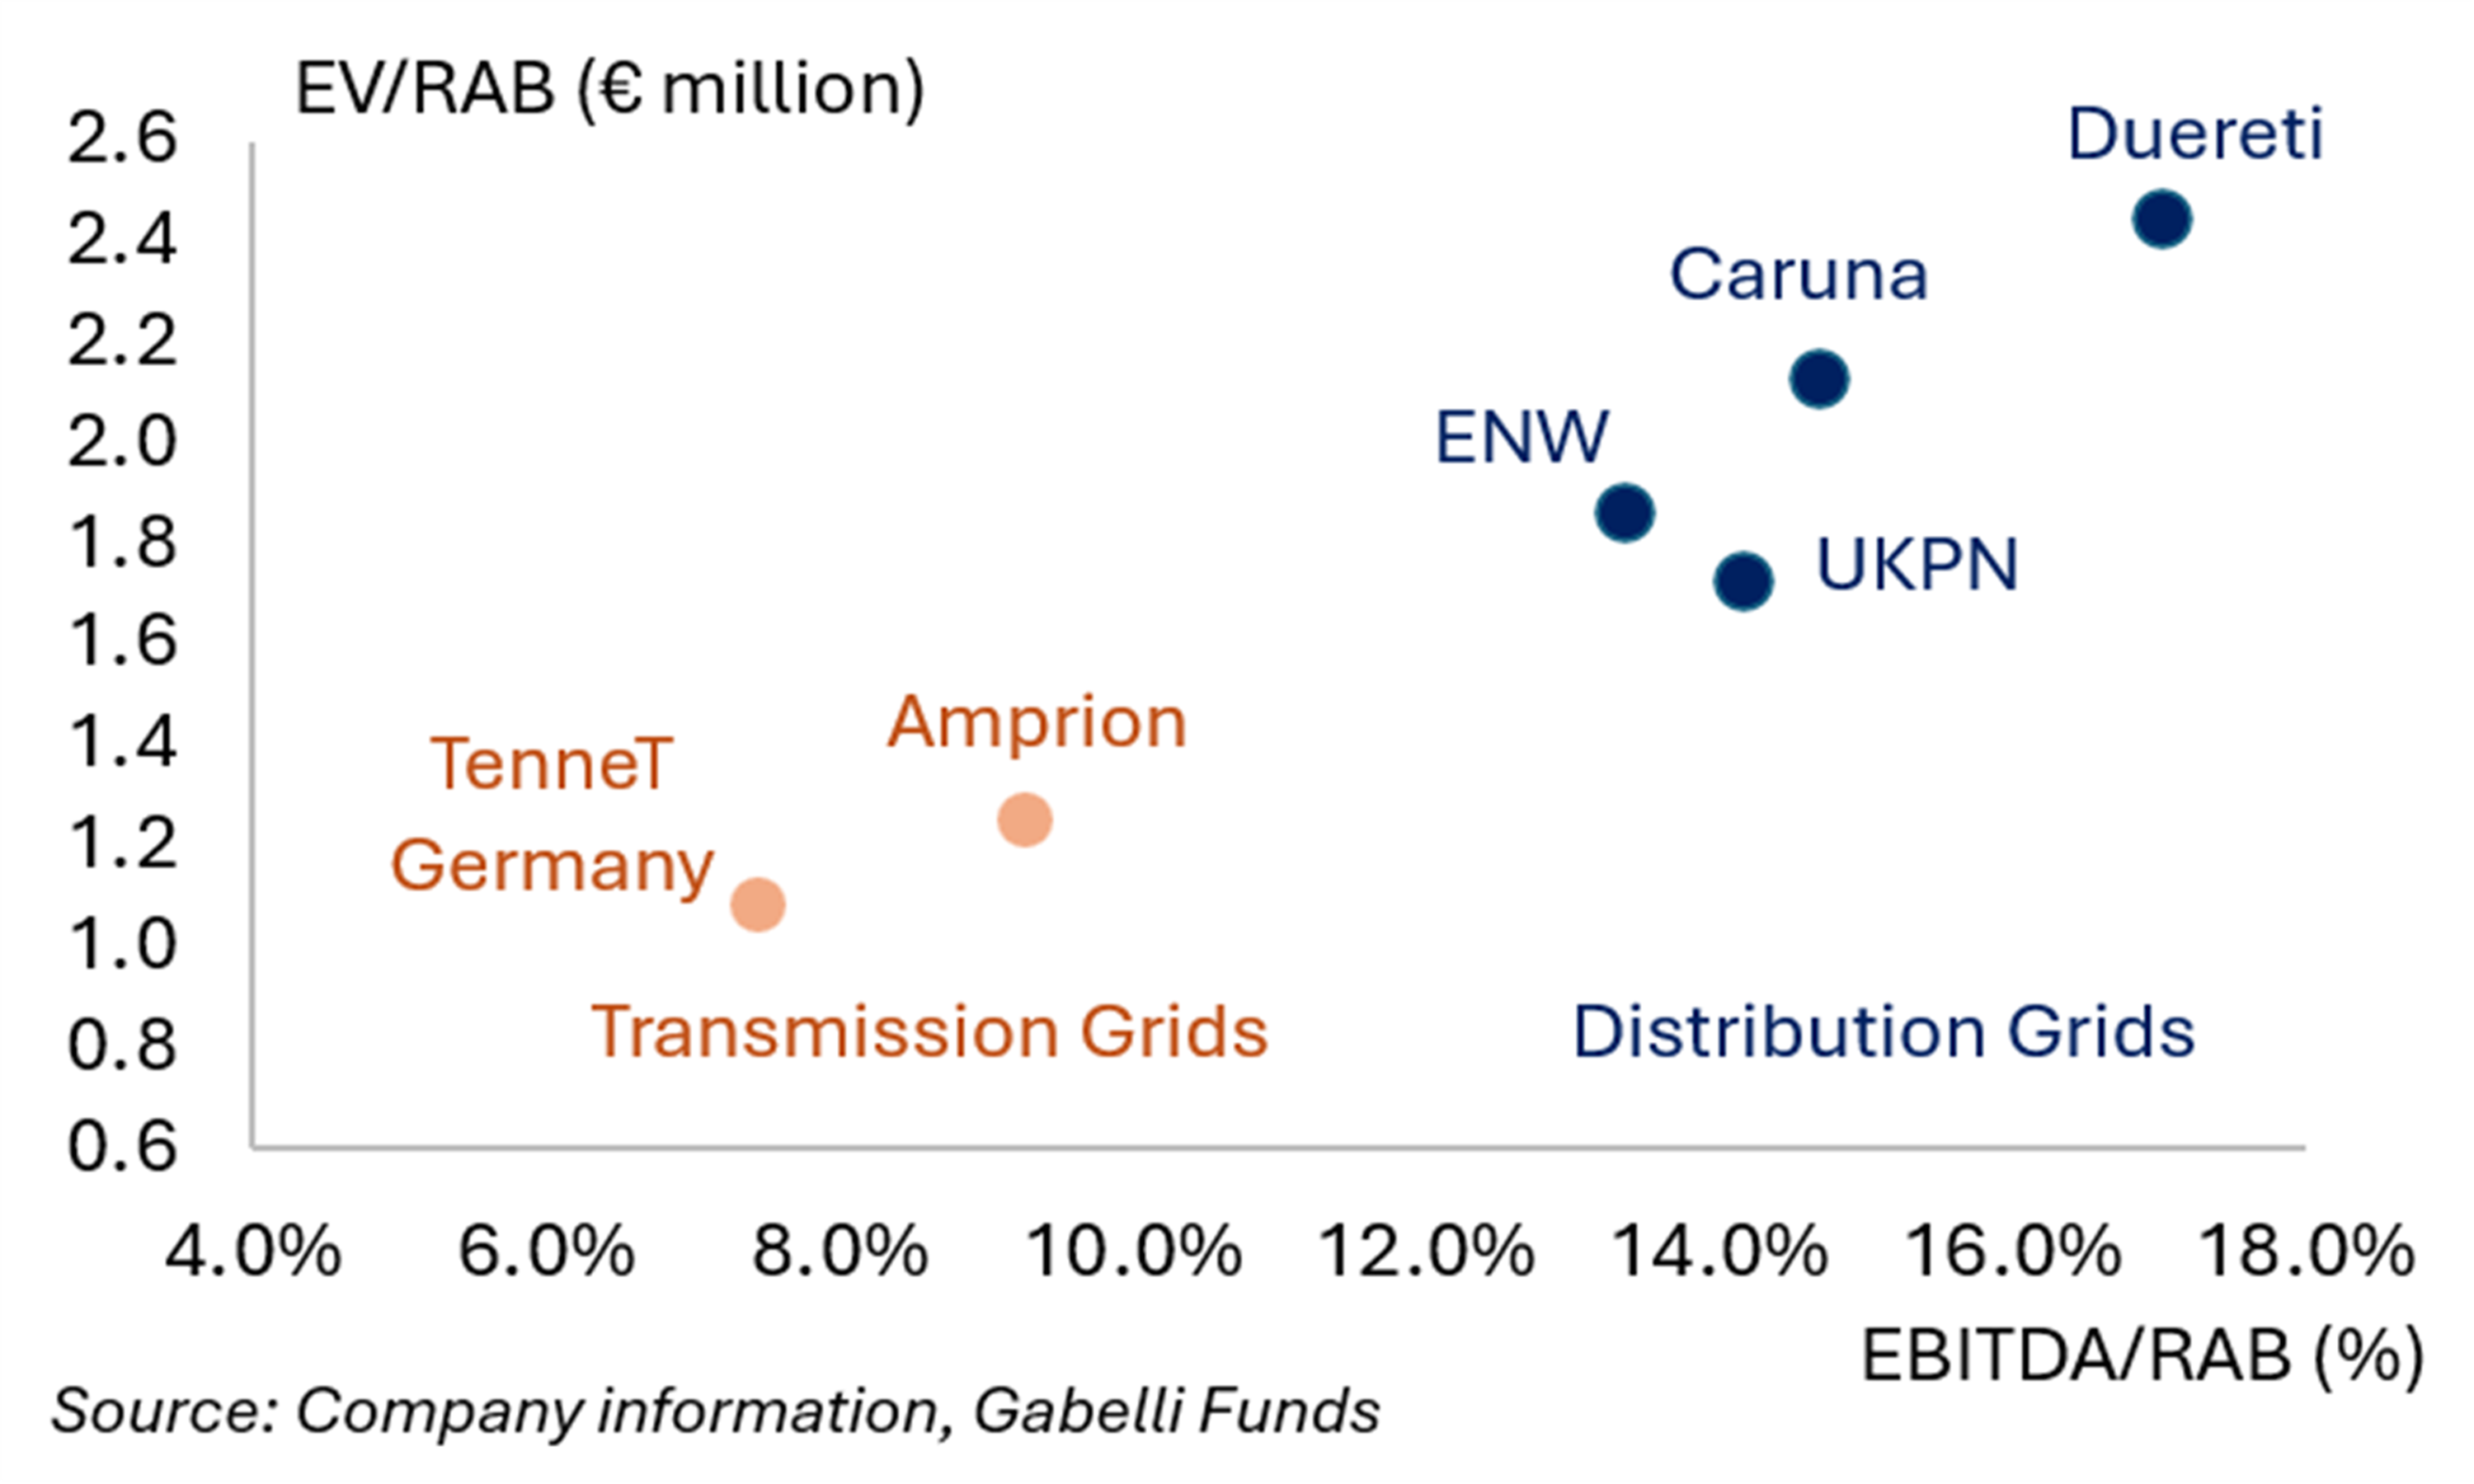
Exhibit 19 plots the EV/RAB transaction multiples discussed above for Transmission and Distribution System Operators (which are also summarized in Table 2) against the EBITDA/RAB returns of the acquired networks. For consistency, we use only multiples calculated on the last financials reported before the transaction was announced, or on financial figures reported for the fiscal year in which the transaction was announced.
This avoids relying on the RAB and EBITDA projections the parties published at the time of announcement, which tends to flatter forward-looking multiples and makes them look cheaper. The one exception is Caruna, where no RAB was disclosed and we estimated the FY2025 figure from Iberdrola’s own FY2027 estimate. Overall, there appears to be a fairly good correlation between transaction multiples paid and EBITDA returns received, which helps to explain why distribution grids capture higher transaction multiples than transmission grids.
Exhibit 19 Power Network Transactions: Multiples vs. Returns

E.ON: Germany’s Leading Electricity Distribution System Operator
Headquartered in Essen, Germany, E.ON operates electricity and natural gas distribution networks across Europe and supplies power and gas to small and medium sized enterprises as well as to residential, commercial and industrial customers. E.ON operates along three business segments: “Energy Networks”, “Energy Infrastructure Solutions”, and “Energy Retail”.
As a regulated Distribution System Operator (DSO), the “Energy Networks” segment operates electricity and gas distribution networks in Germany, Sweden, Czech Republic, Poland, Slovakia, Hungary, Croatia, Romania, and Türkiye. The segment’s Regulated Asset Base (RAB) was valued at €48 billion at the end of FY 2025, of which €43 billion represented the electricity network RAB and €5 billion the gas network RAB. This regulated business generated the largest share of group EBITDA (77%) in 2025, but only about 30% of group revenues.
The “Energy Infrastructure Solutions” segment builds sustainable energy infrastructure for district heating and cooling systems in city districts and for commercial as well as industrial customers. The business segment also develops products and services for a more efficient use of electricity as well as battery storage systems. Although Energy Infrastructure is E.ON’s smallest business segment in terms of revenue and EBITDA contribution (only 3% and 6%, respectively in 2025), this business generated an attractive EBITDA margin of about 21% in 2025.
The “Energy Retail” business supplies electricity and gas to residential, commercial and industrial customers across Europe (mostly in Germany, the United Kingdom and the Netherlands). As a high volume, but low margin business, this business segment generated the largest share of group revenues (67%) in 2025 but contributed only 17% of group EBITDA and reported the lowest EBITDA margin of only 3.2% among E.ON’s businesses in 2025. However, as a cash cow, it helps financing E.ON’s capital-intensive “Energy Networks” business.
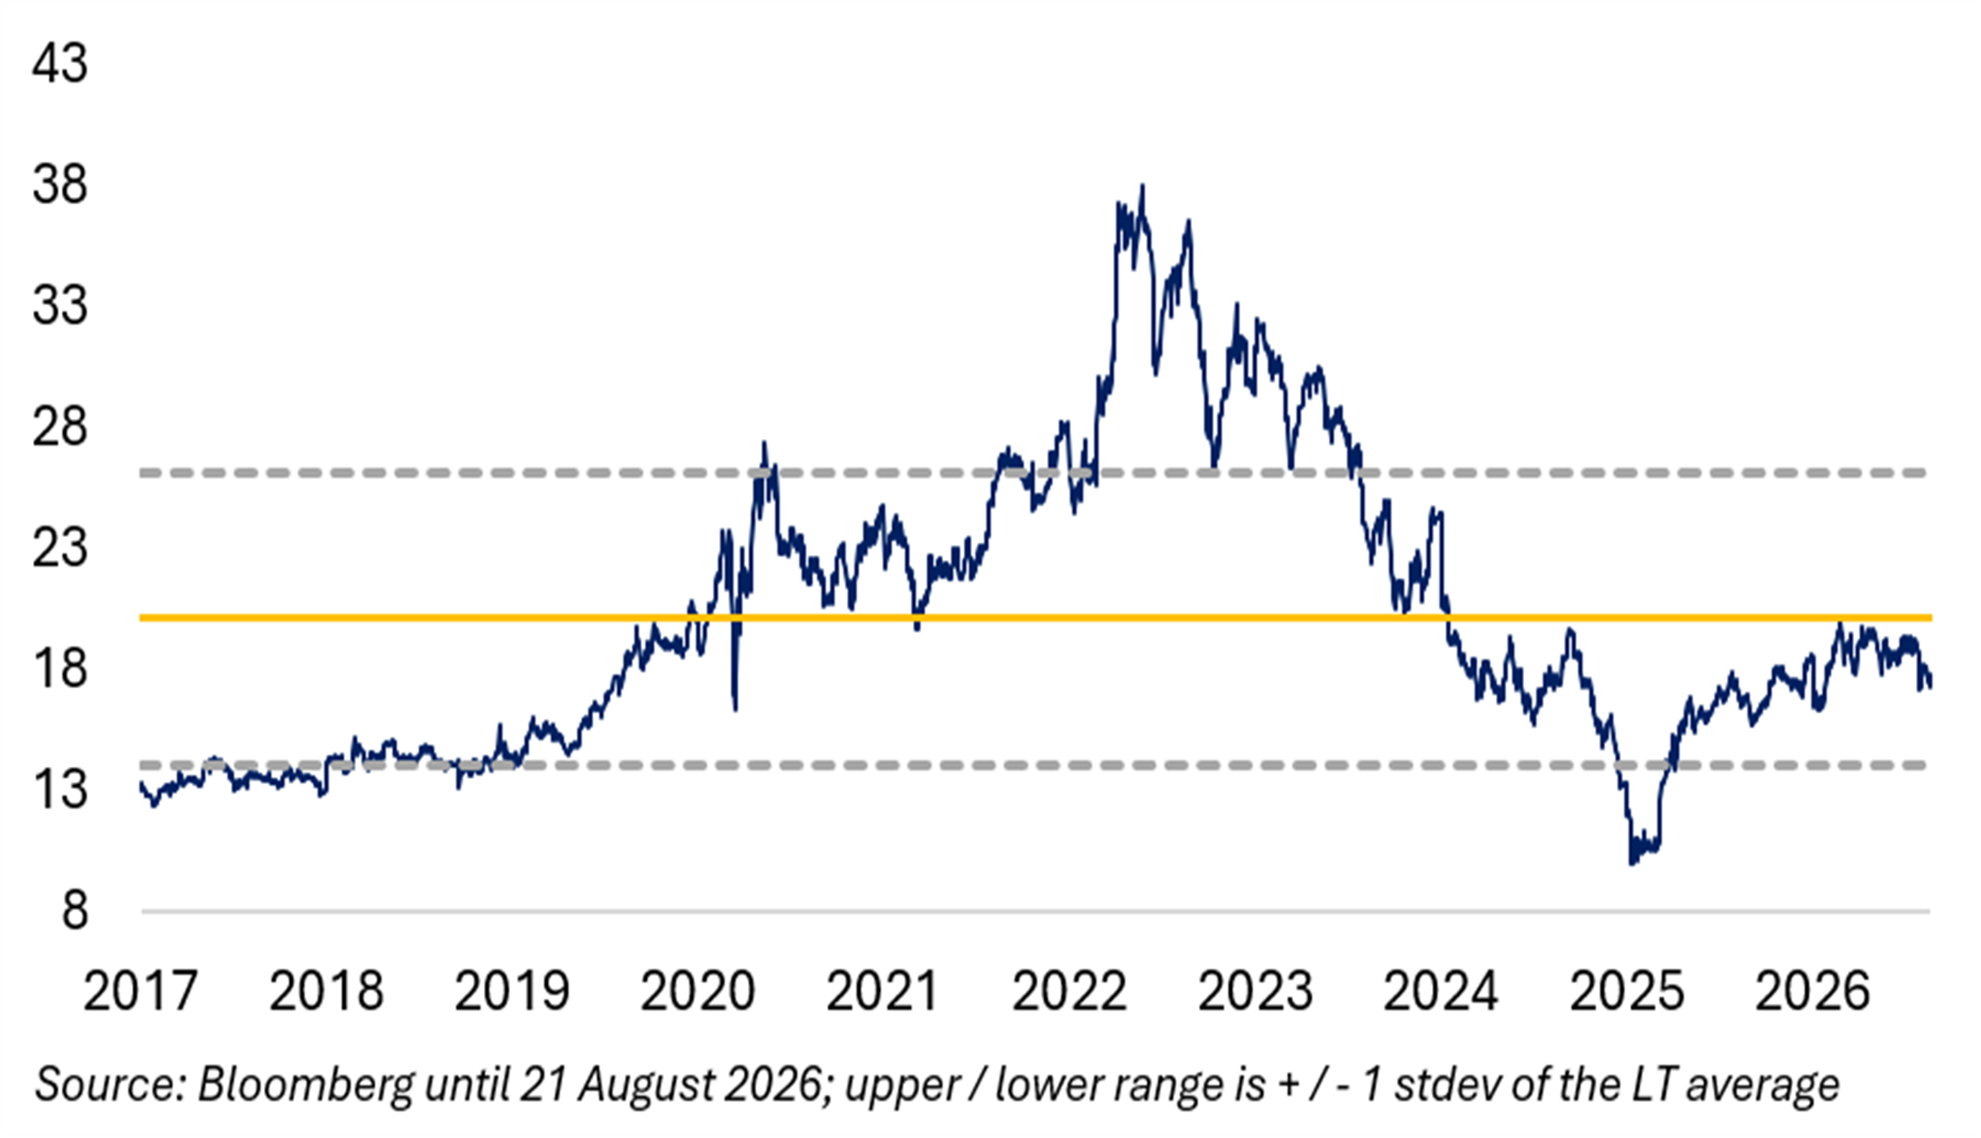
Exhibit 20 Share Price Performance (€) Exhibit 21 1-yr Forward EV/EBITDA 
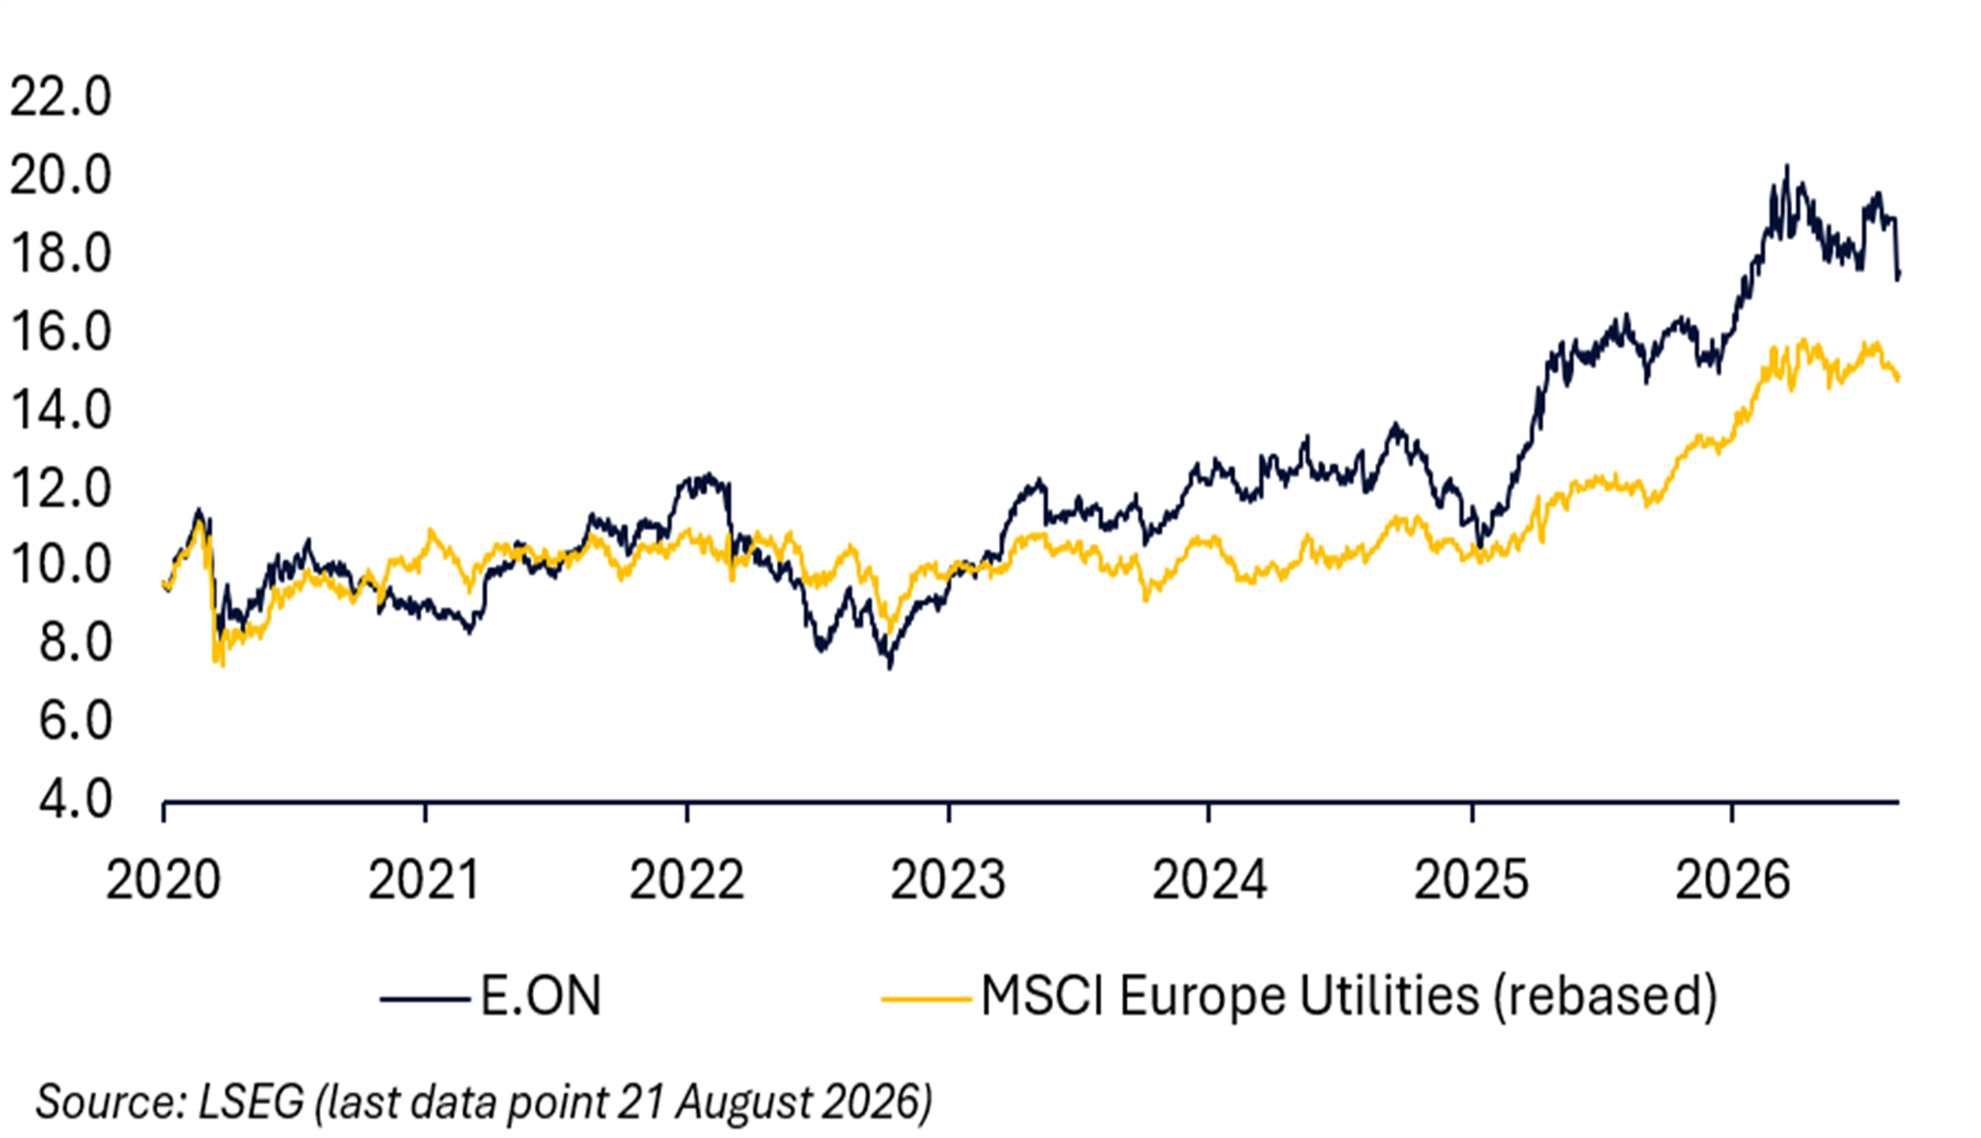
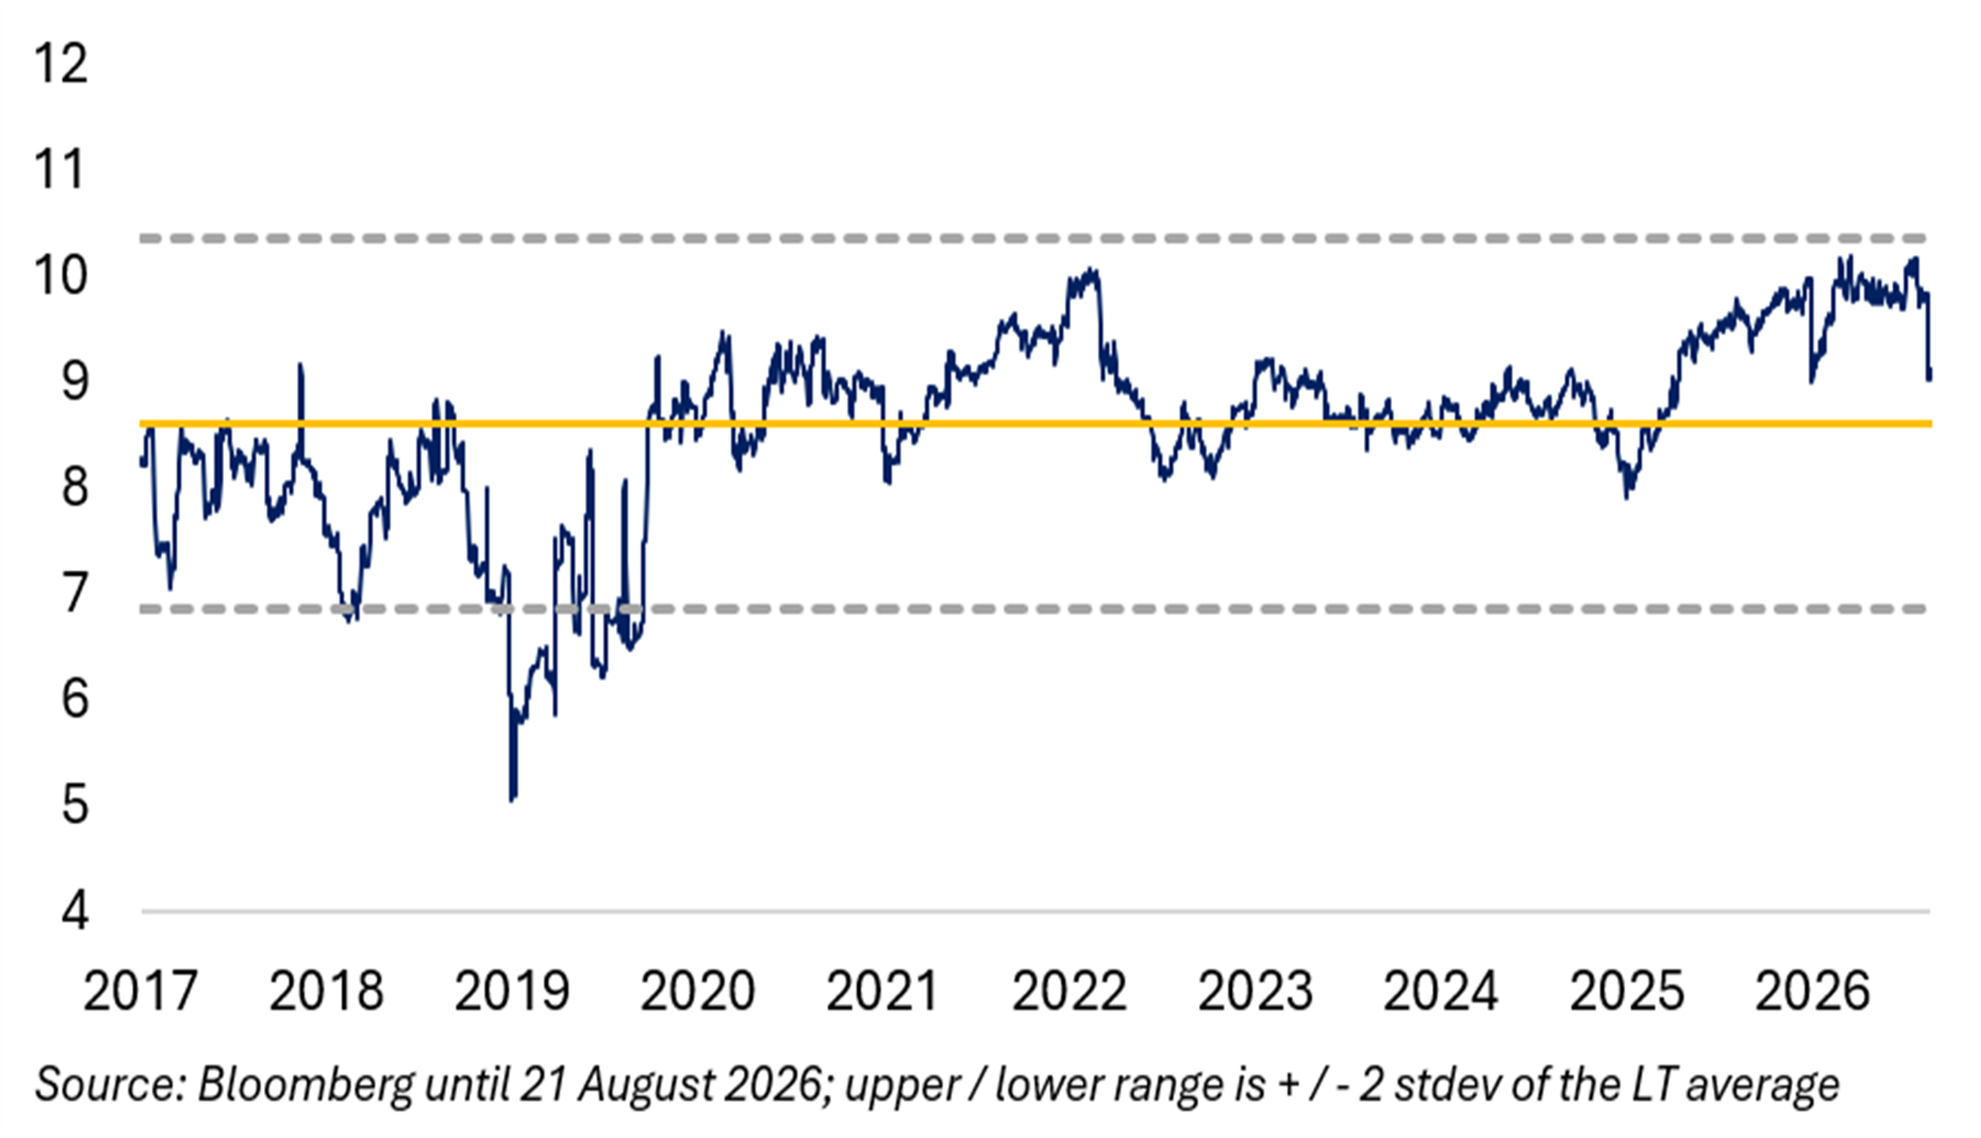

Exhibit 22 1-yr Forward P/E (x) Exhibit 23 EPS € (2025–28 CAGR: 4.2%) 
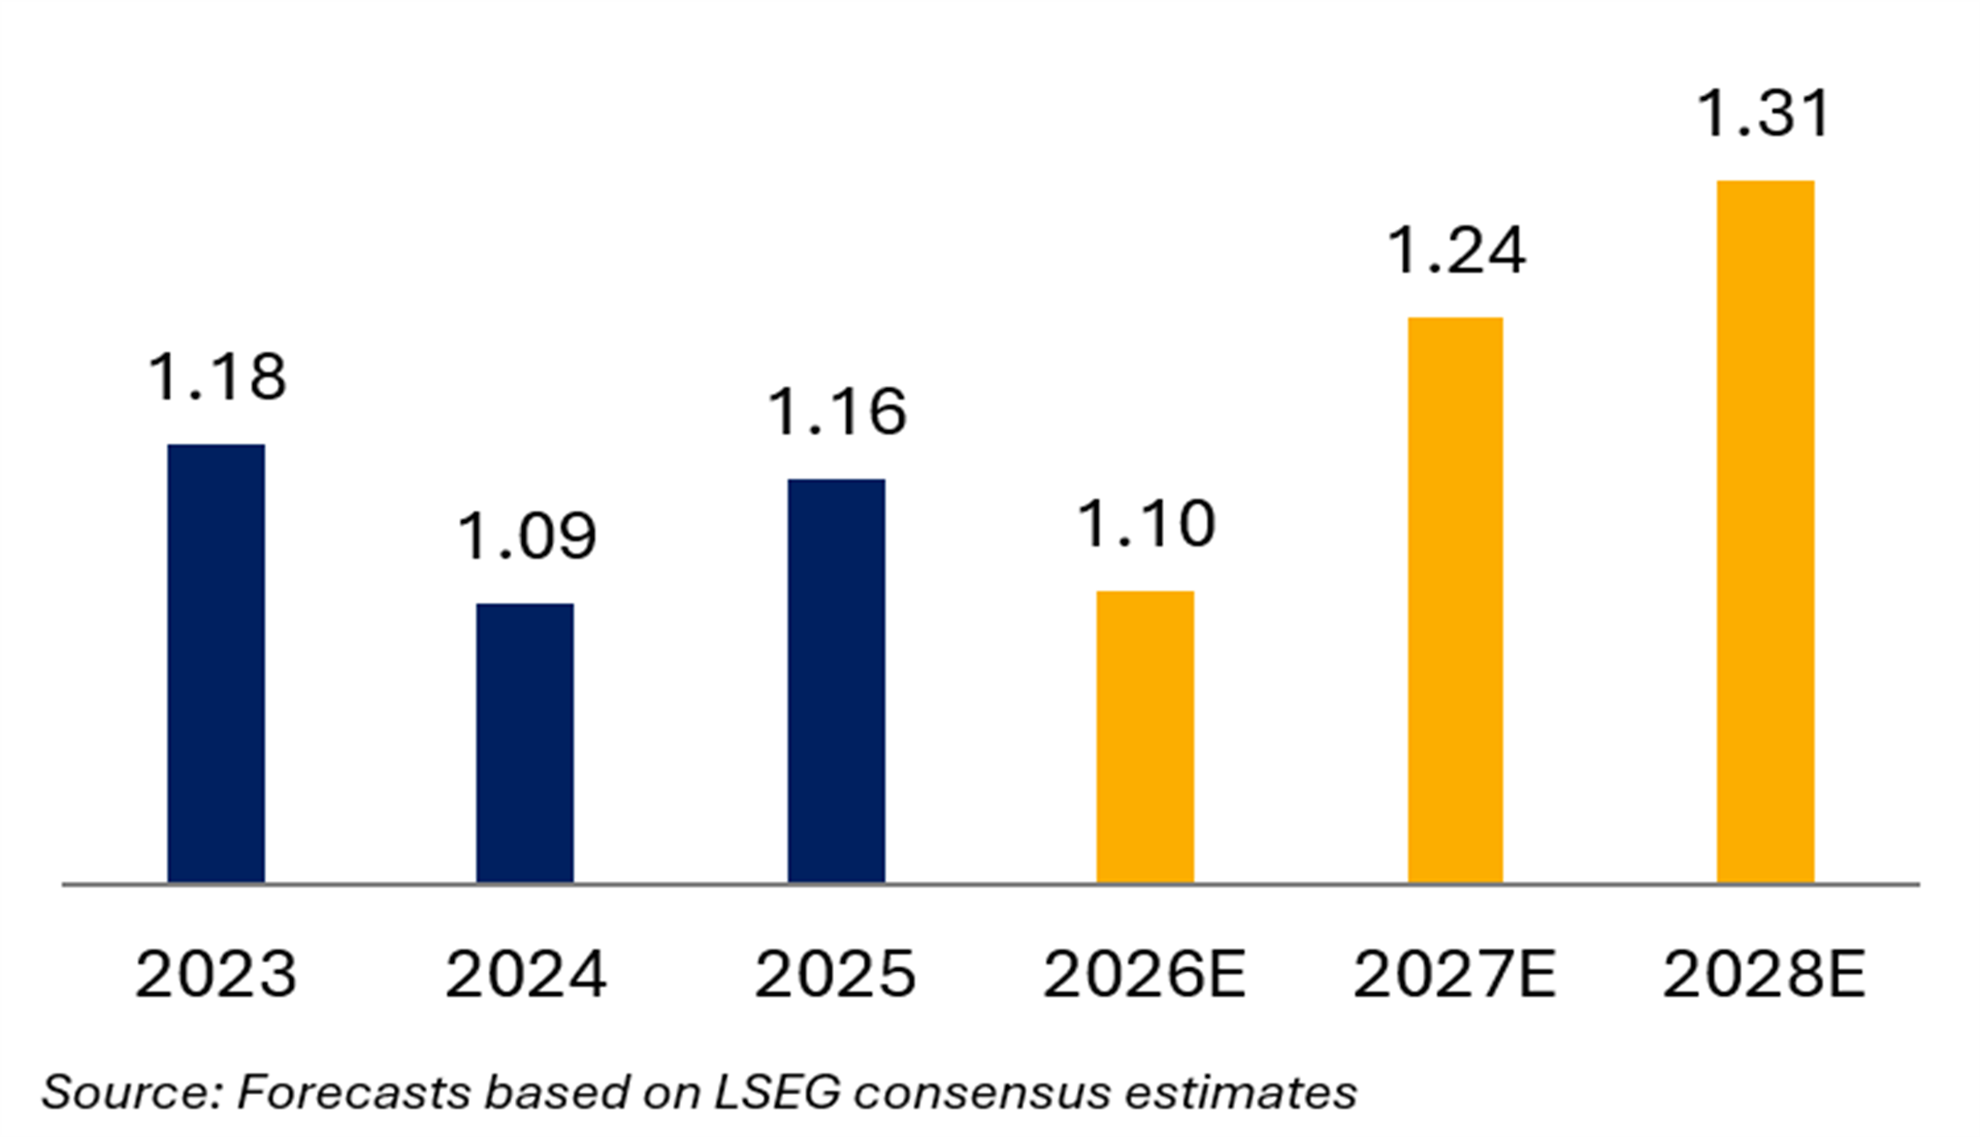

Elia Group: Operates Electricity Transmission Systems in Belgium and Germany
Headquartered in Brussels, Belgium, Elia Group is a high-voltage Electricity Transmission Systems Operator (TSO) with businesses in Belgium and Germany. Elia is organized and reports its financials along three business segments, “Elia Transmission – Belgium”, “50Hertz Transmission – Germany” and “Non-Regulated and Nemo Link”.
The “Elia Transmission – Belgium (ETB)” segment is Belgium’s sole TSO for high and extra-high voltage electricity transmission, driving the country’s energy transition with a highly interconnected grid. At the end of 2024, almost 60% of the installed power generation capacity in its controlled grid area came from connected renewable energy sources and ETB targets to meet a 50% increase in power demand by 2032. ETB generated around 36% of group revenues and 38% of group EBITDA in 2025.
The “50Hertz Transmission – Germany” business is one of four TSOs in Germany, which operates an extra-high-voltage grid in northern and eastern Germany (including Berlin, Brandenburg, Saxony, Saxony-Anhalt, and Thuringia) with the objective to cover 100% of the annual electricity consumption in its control area with renewable energy by 2032 (compared to around 69% of installed power generation capacity coming from renewables in its grid area in 2024). 50Hertz accounted for about 63% of group revenues and 64% of group EBITDA in 2025.
The “Non-Regulated and Nemo Link” division comprises Elia’s international businesses, such as WindGrid, which develops international electricity transmission solutions (including a stake in “energyRe Giga” in the USA) and Elia Grid International, which is a global engineering consultancy for offshore power transmission. The Nemo Link is a high-voltage direct current (HVDC) subsea interconnector, jointly operated by ETB and National Grid for the electricity transmission between Belgium and the United Kingdom. This small division is insignificant in the group context as it accounted for only 1% of group revenues and it reported an EBITDA loss of €38 million in 2025.
Exhibit 24 Share Price Performance (€) Exhibit 25 1-yr Forward EV/EBITDA 
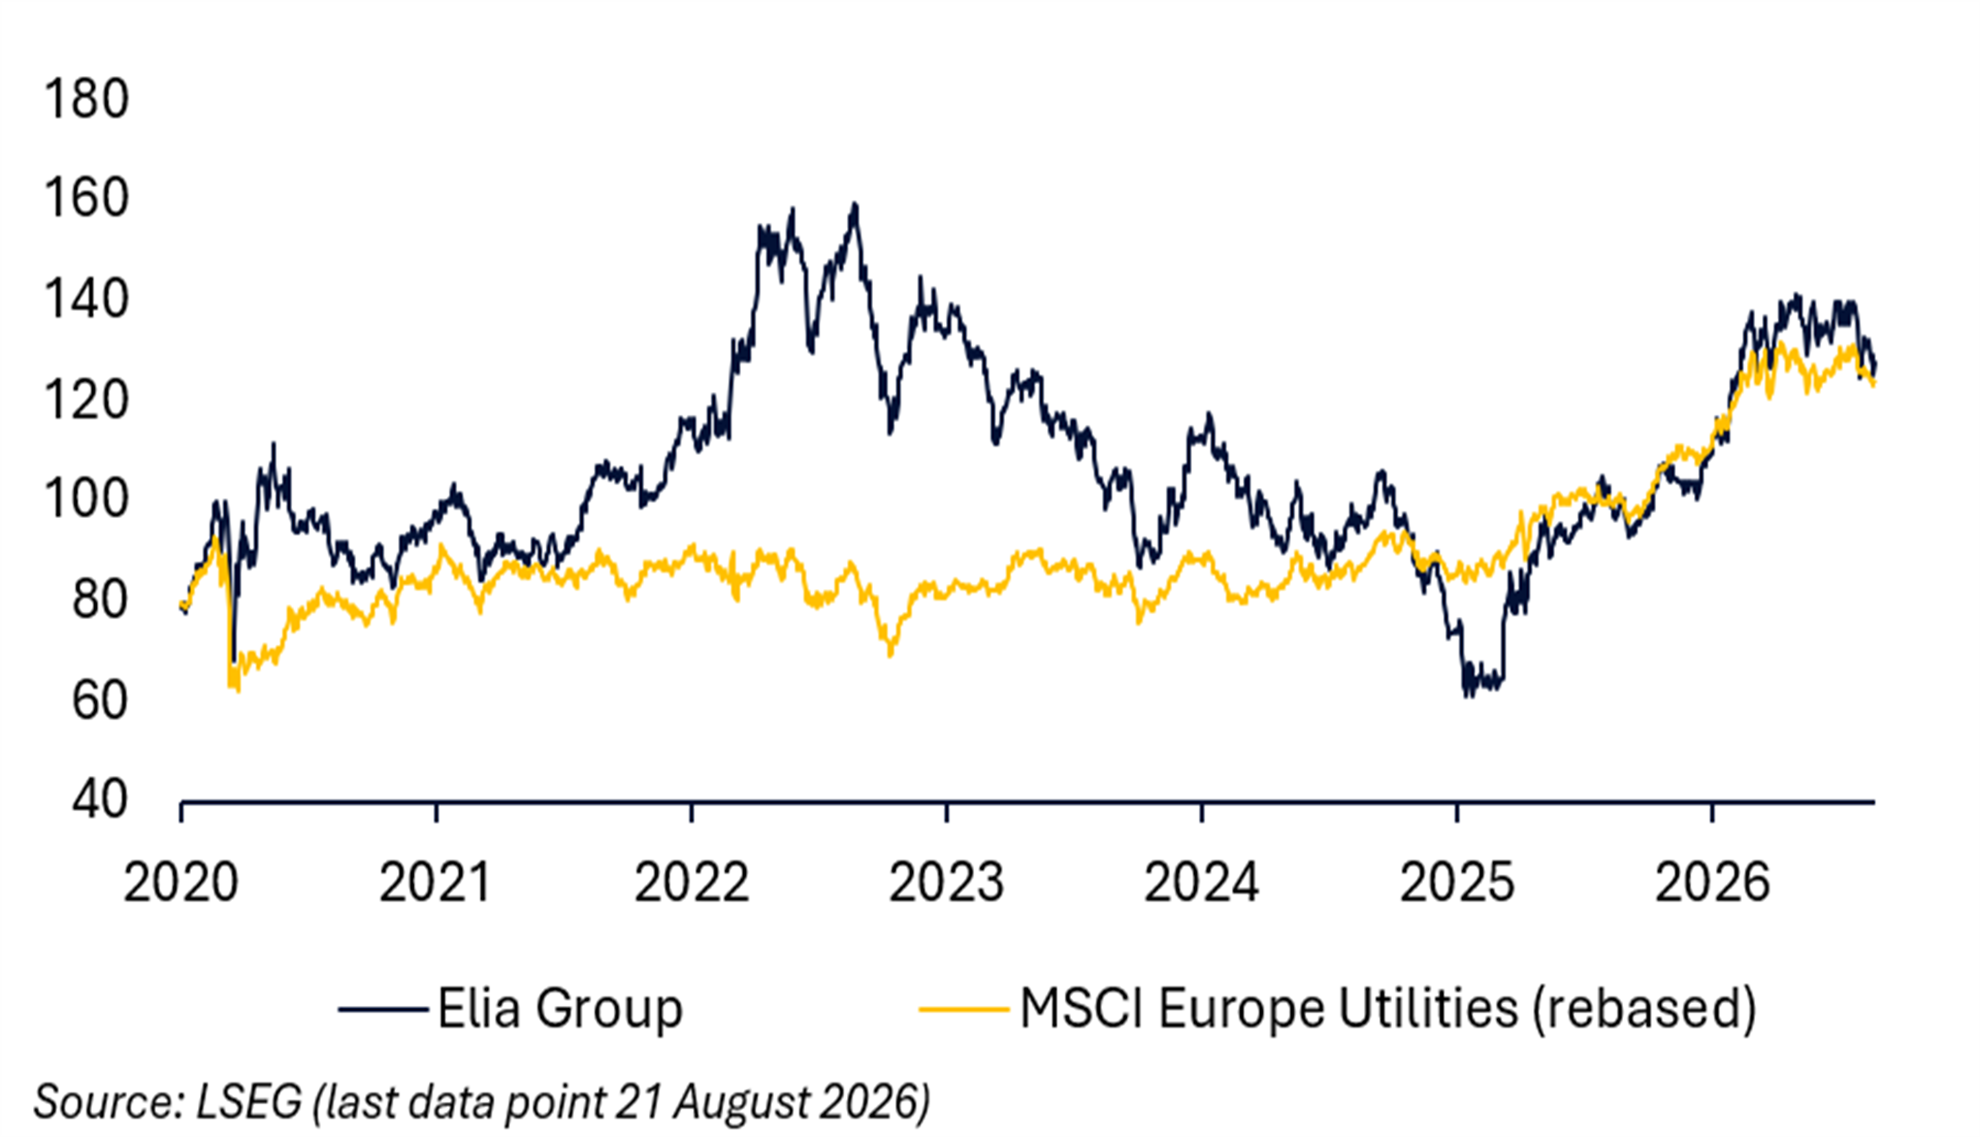
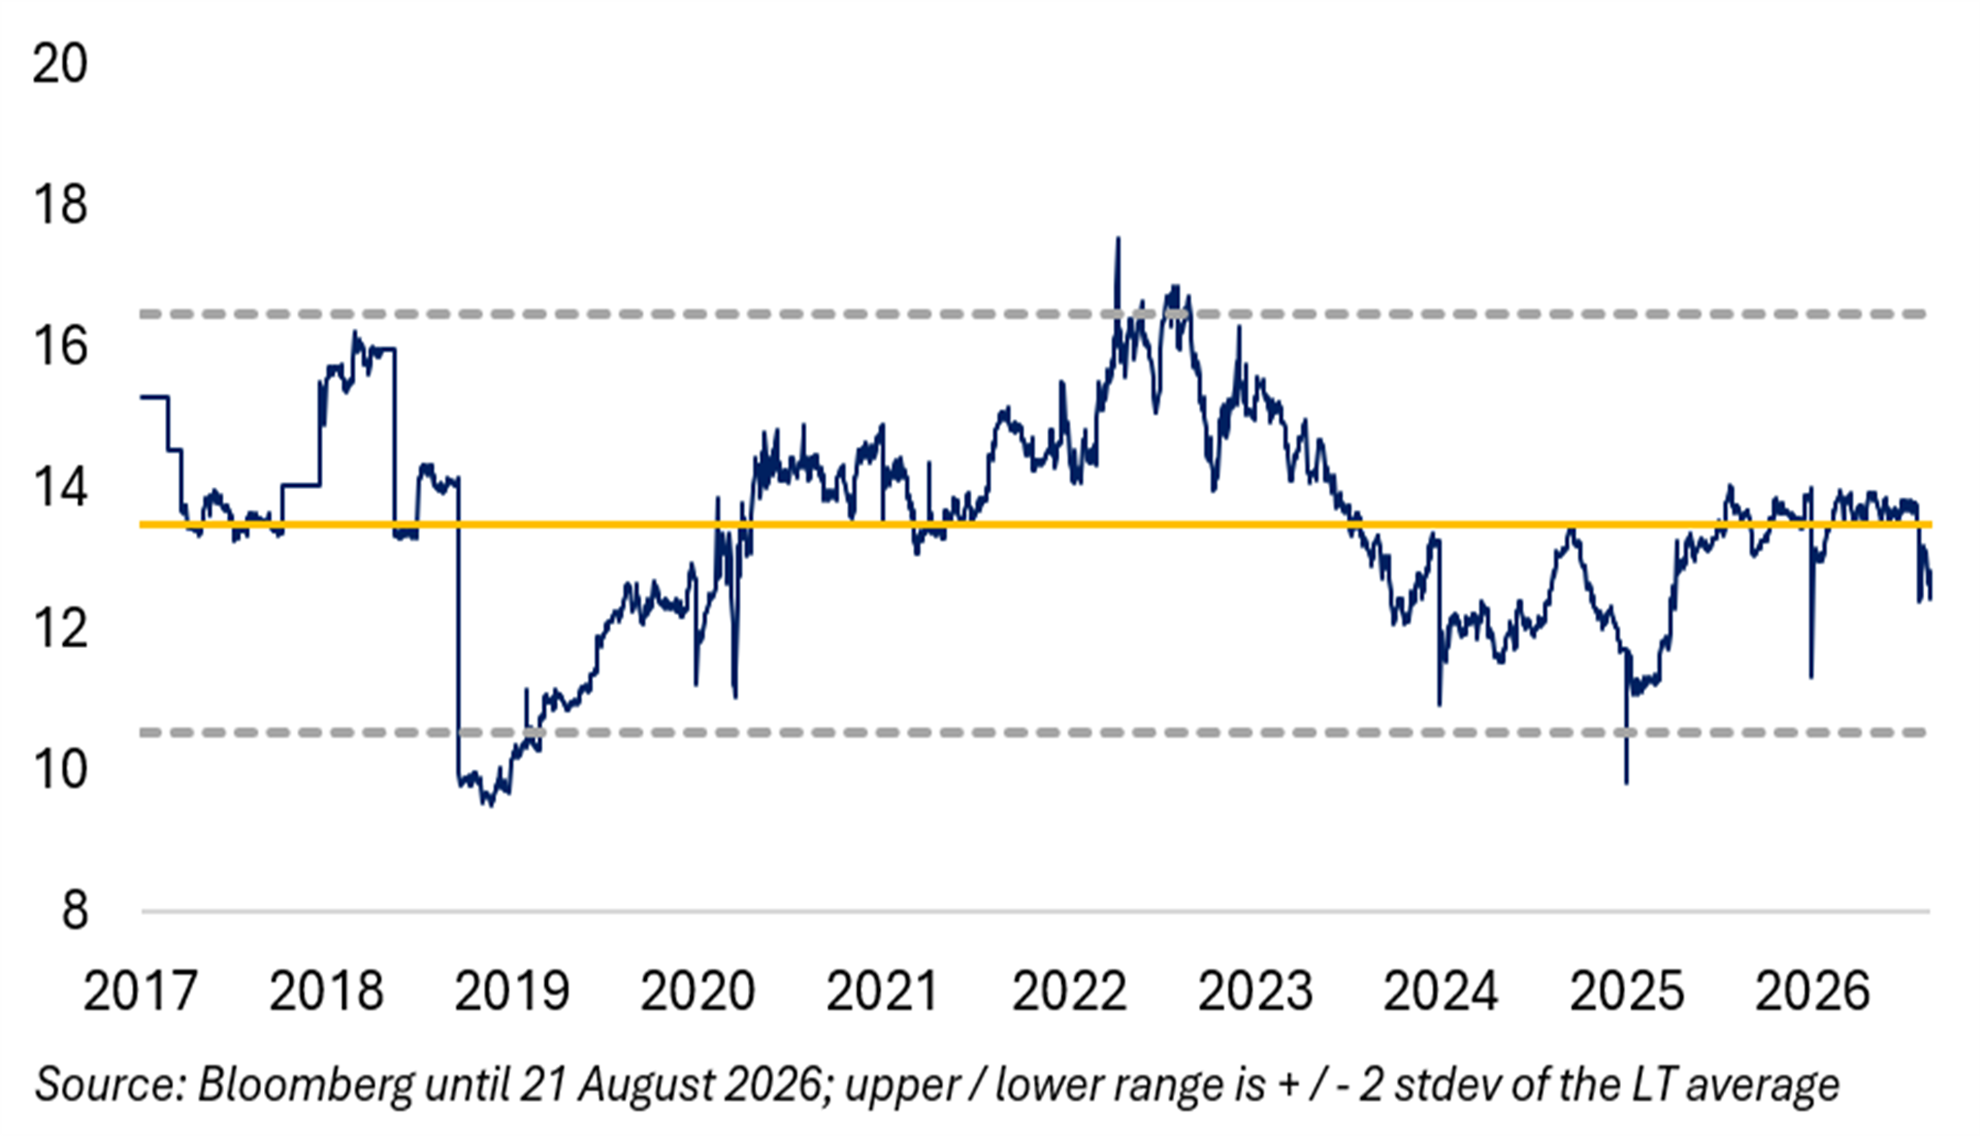

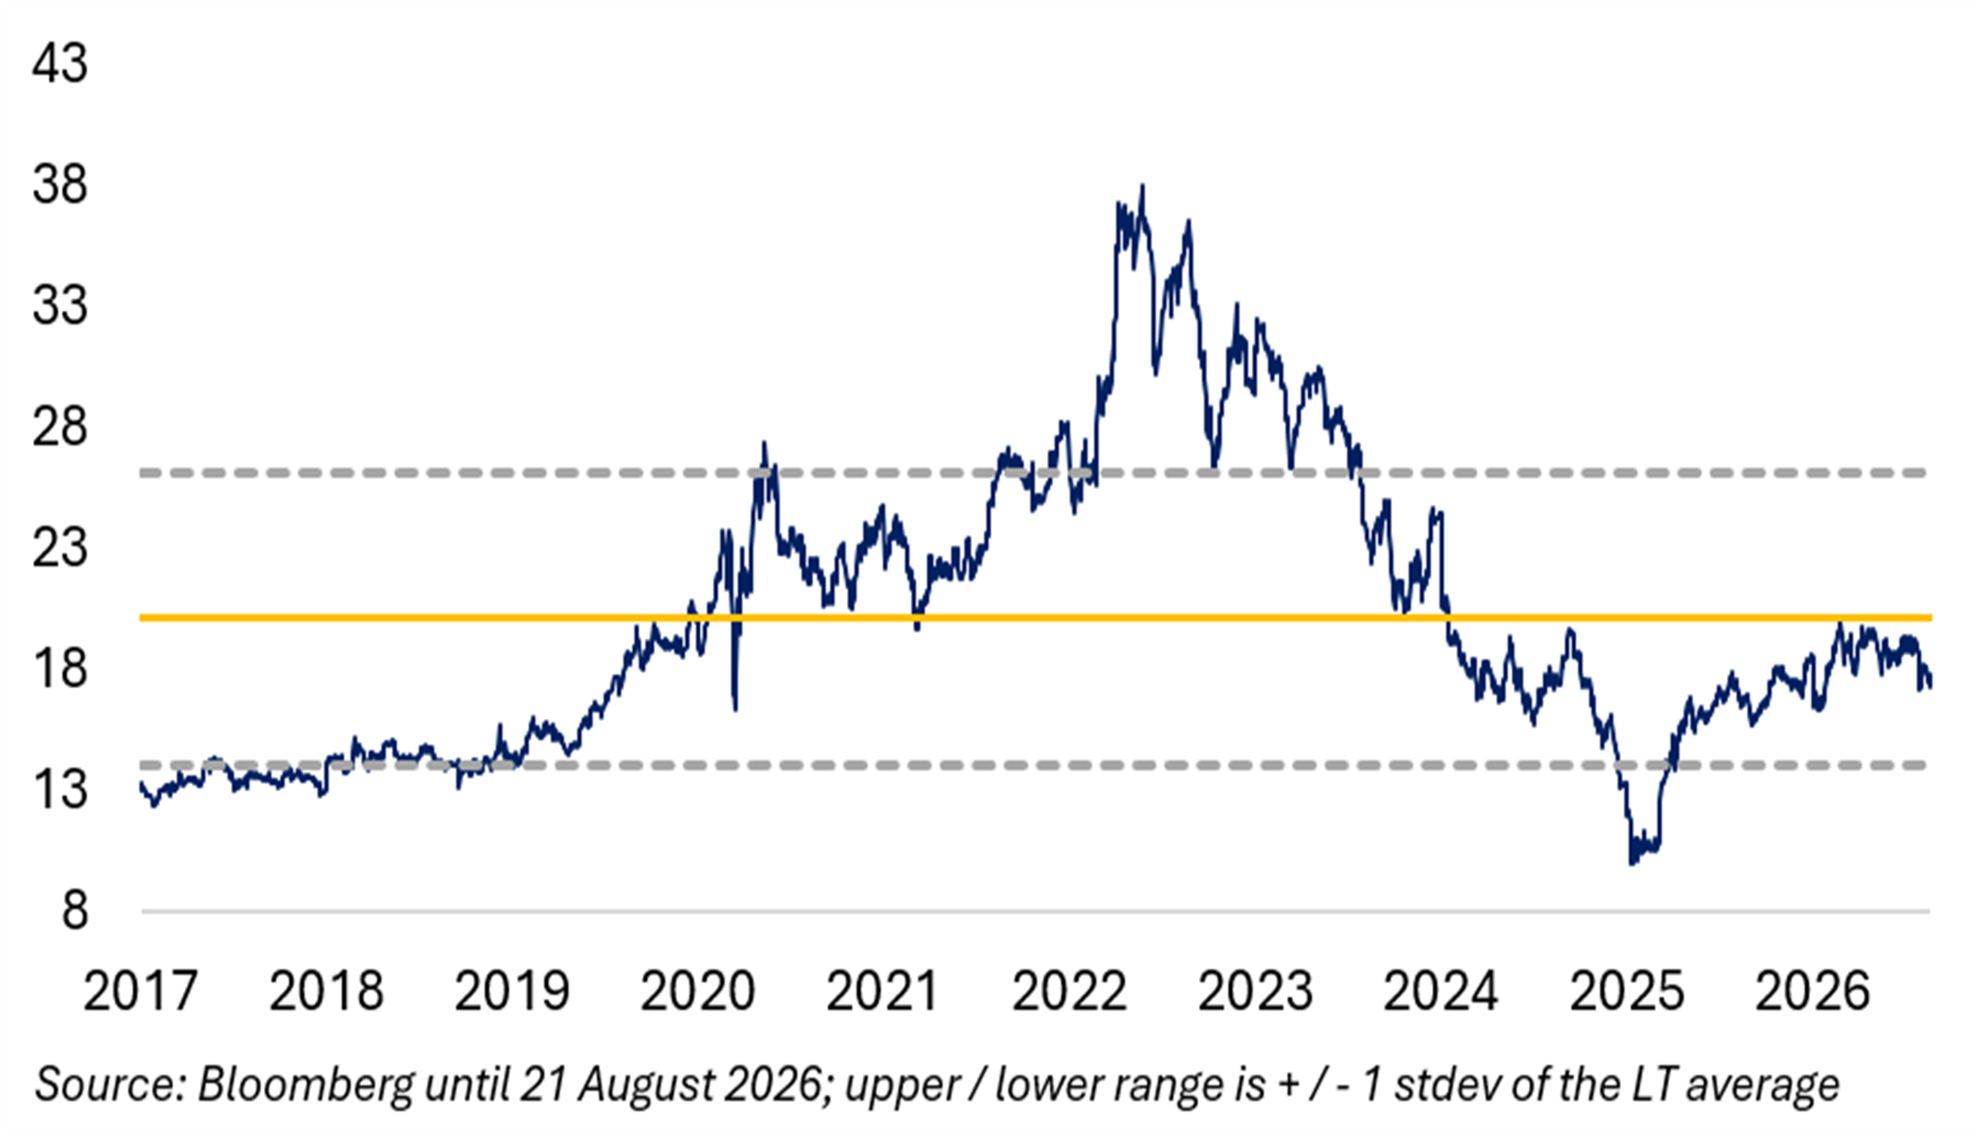
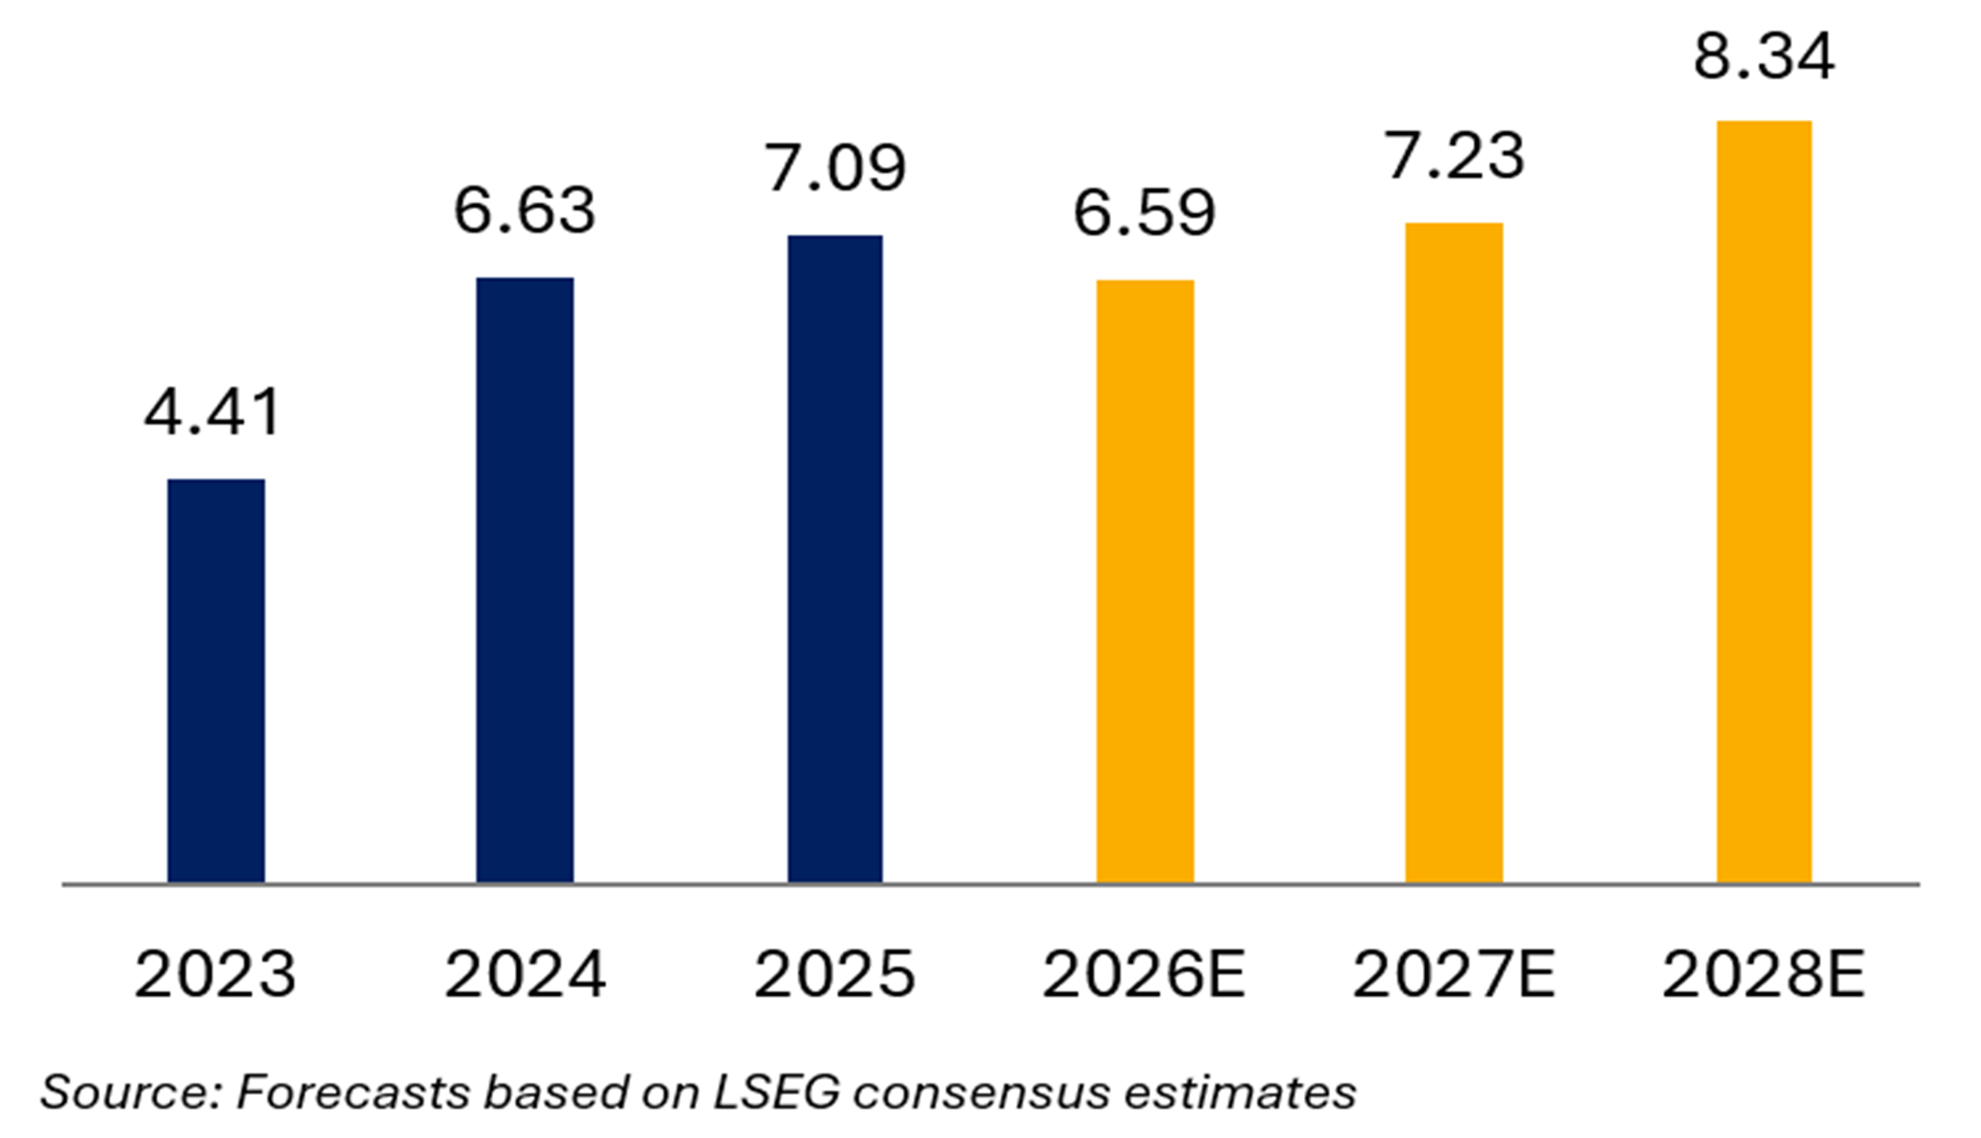
Exhibit 26 1-yr Forward P/E (x) Exhibit 27 EPS € (2025-28 CAGR: 5.6%)

National Grid: UK Transmission & Distribution Operator with Large US Exposure
Headquartered in London, United Kingdom, National Grid’s business involves the transmission and distribution of electricity in the United Kingdom and of electricity as well as gas in the United States. National Grid is organized and reports its financials along five business segments: “UK-Electricity Transmission”, UK-Electricity Distribution”, “US-New England”, “US-New York” and “National Grid Ventures”.
The “UK-Electricity Transmission” segment is a UK Transmission Systems Operator (TSO), which owns and operates the high-voltage electricity transmission grid in England and Wales. The UK TSO accounted for 16% of group revenues and 28% of group EBITDA in 2025. The “UK Electricity Distribution” business is a UK Distribution Network Operator (DNO), which manages the largest electricity distribution network in the UK after acquiring Western Power Distribution company in 2021. The UK DNO generated 11% of group revenues and 19% of group EBITDA in 2025.
The “US New England” business operates and owns electricity and gas distribution networks (as a DSO) in Massachusetts as well as electricity transmission networks across Massachusetts, New Hampshire and Vermont. This New England segment is mostly a TSO and generated around 24% of group revenues and 17% of group EBITDA in 2025. The “US-New York” segment owns and operates electricity transmission networks (as a TSO) as well as electricity and gas distribution networks (as a DSO) in Upstate and Downstate New York. The New York business is primarily a DSO, which generated around 43% of group revenues and 31% of group EBITDA in 2025.
The “National Grid Venture” business develops and operates large-scale energy projects across the UK and the USA (electricity interconnectors, power generation and battery storage). This segment is relatively small and generated only about 7% of group revenues and 4% of group EBITDA in 2025.
Exhibit 28 Share Price Performance (€) Exhibit 29 1-yr Forward EV/EBITDA 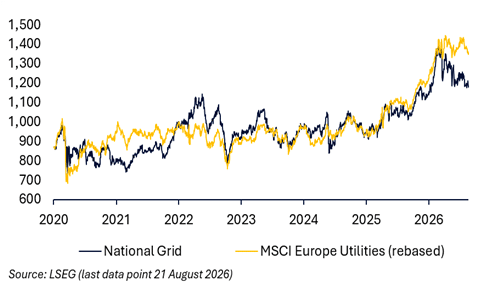
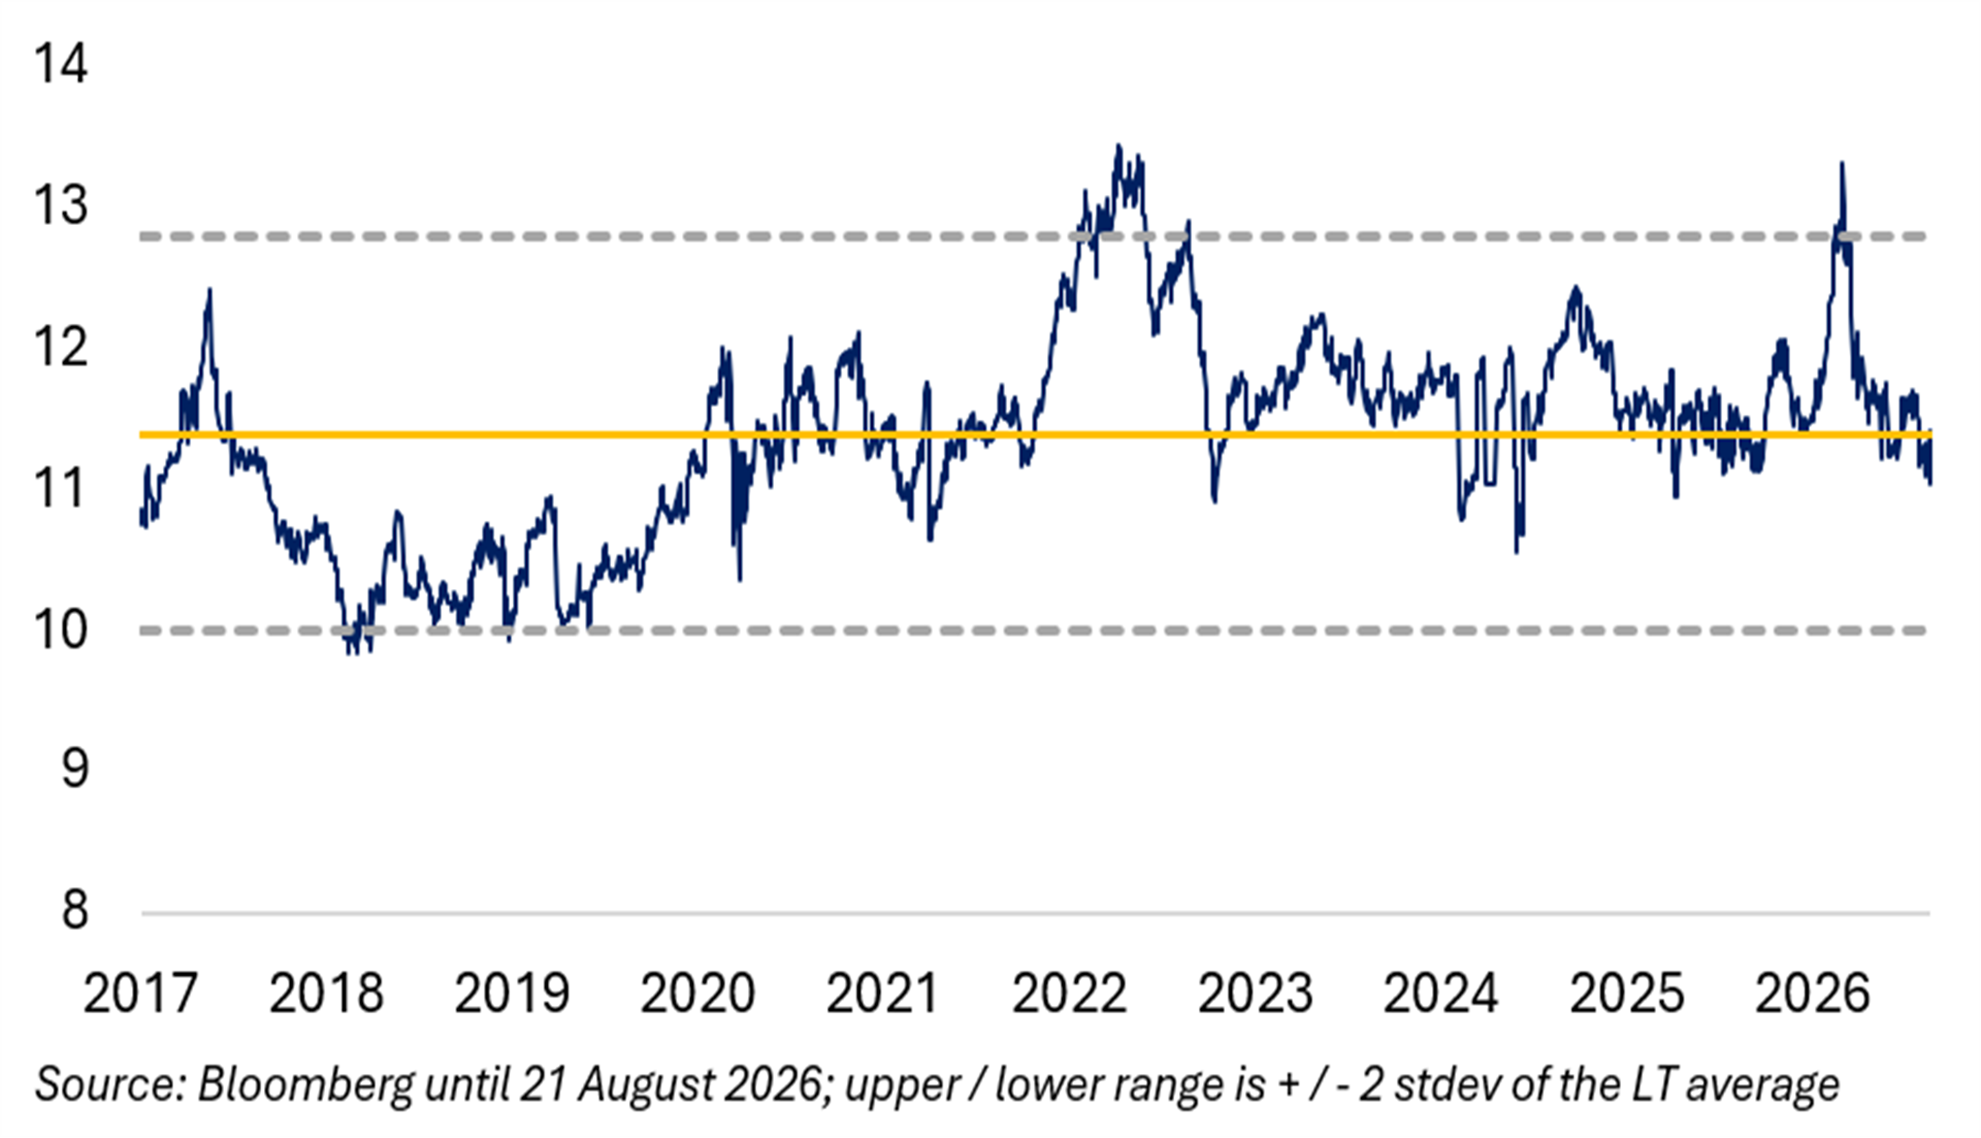

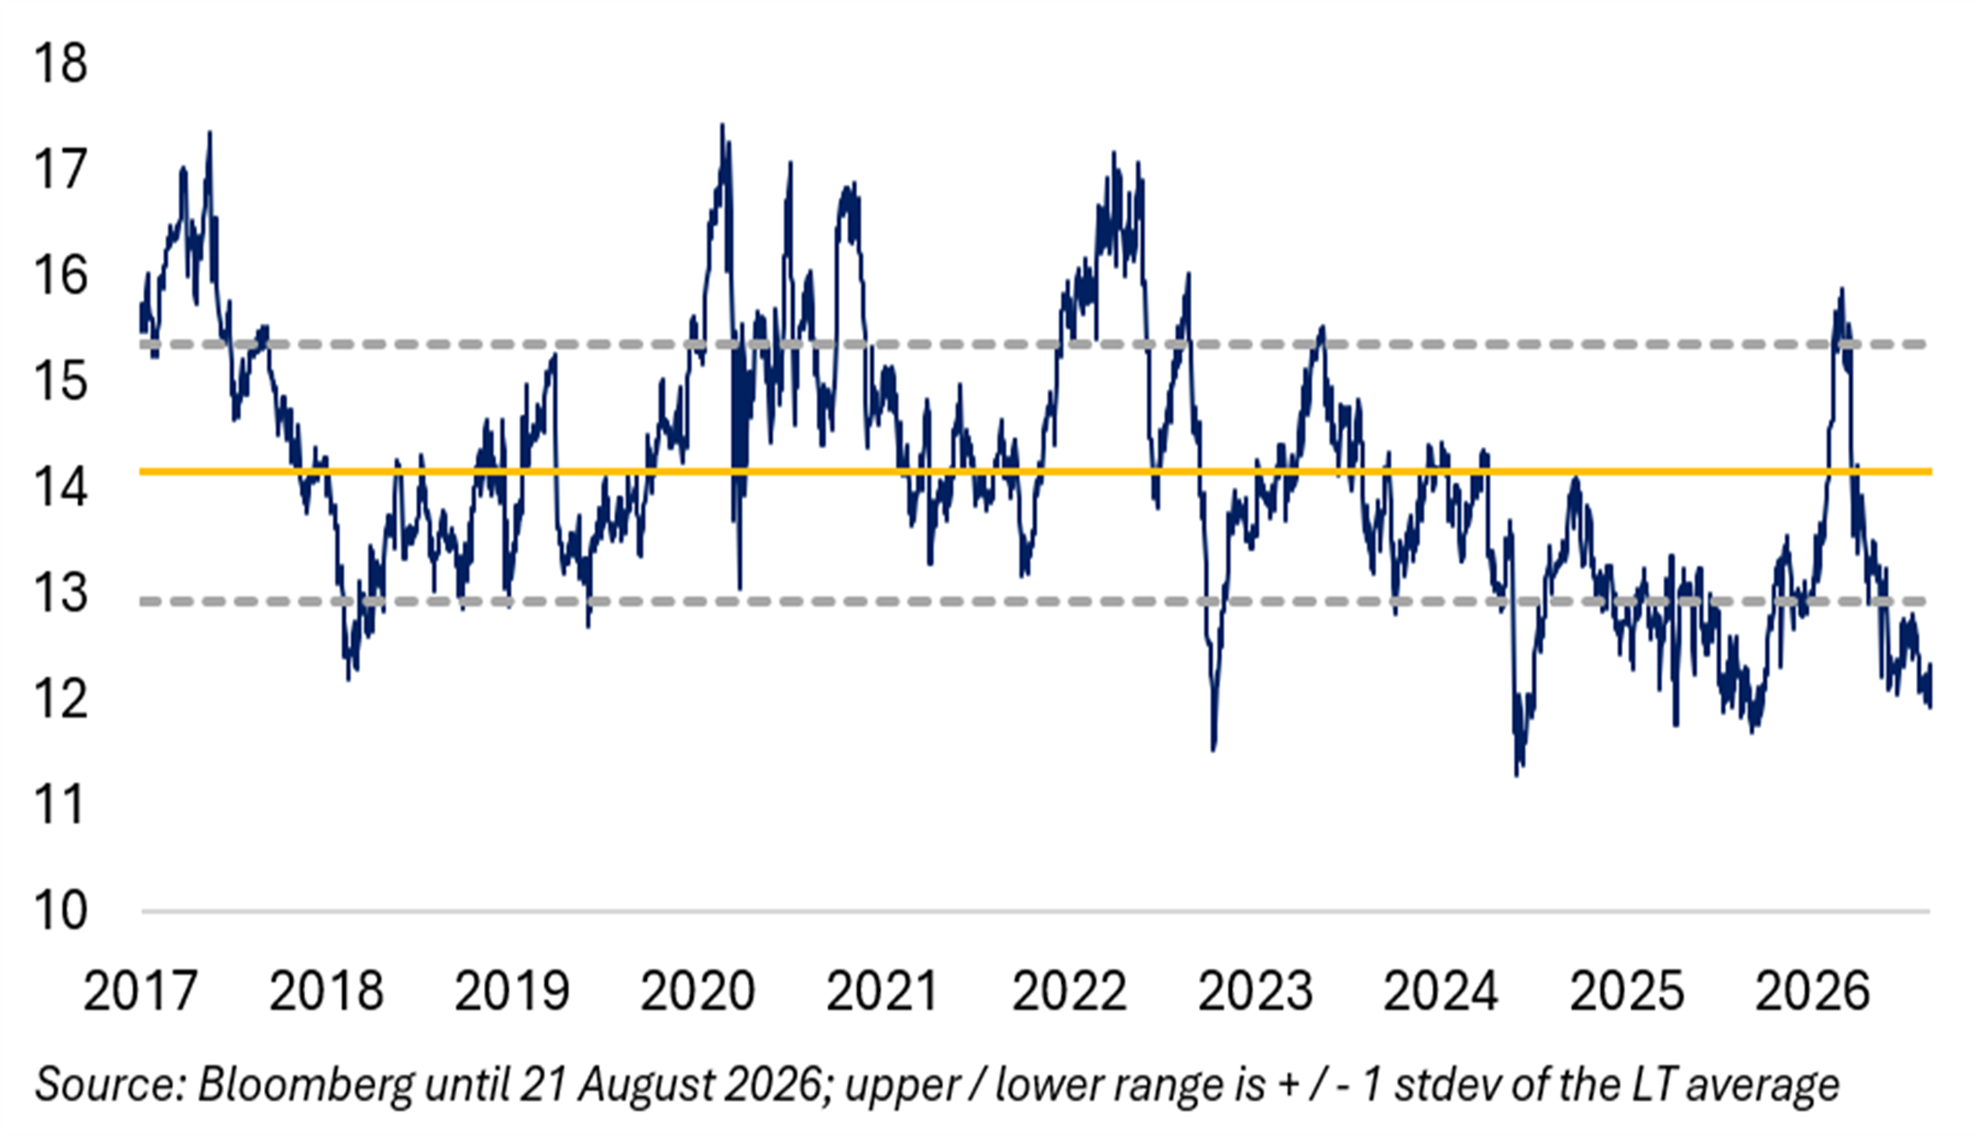
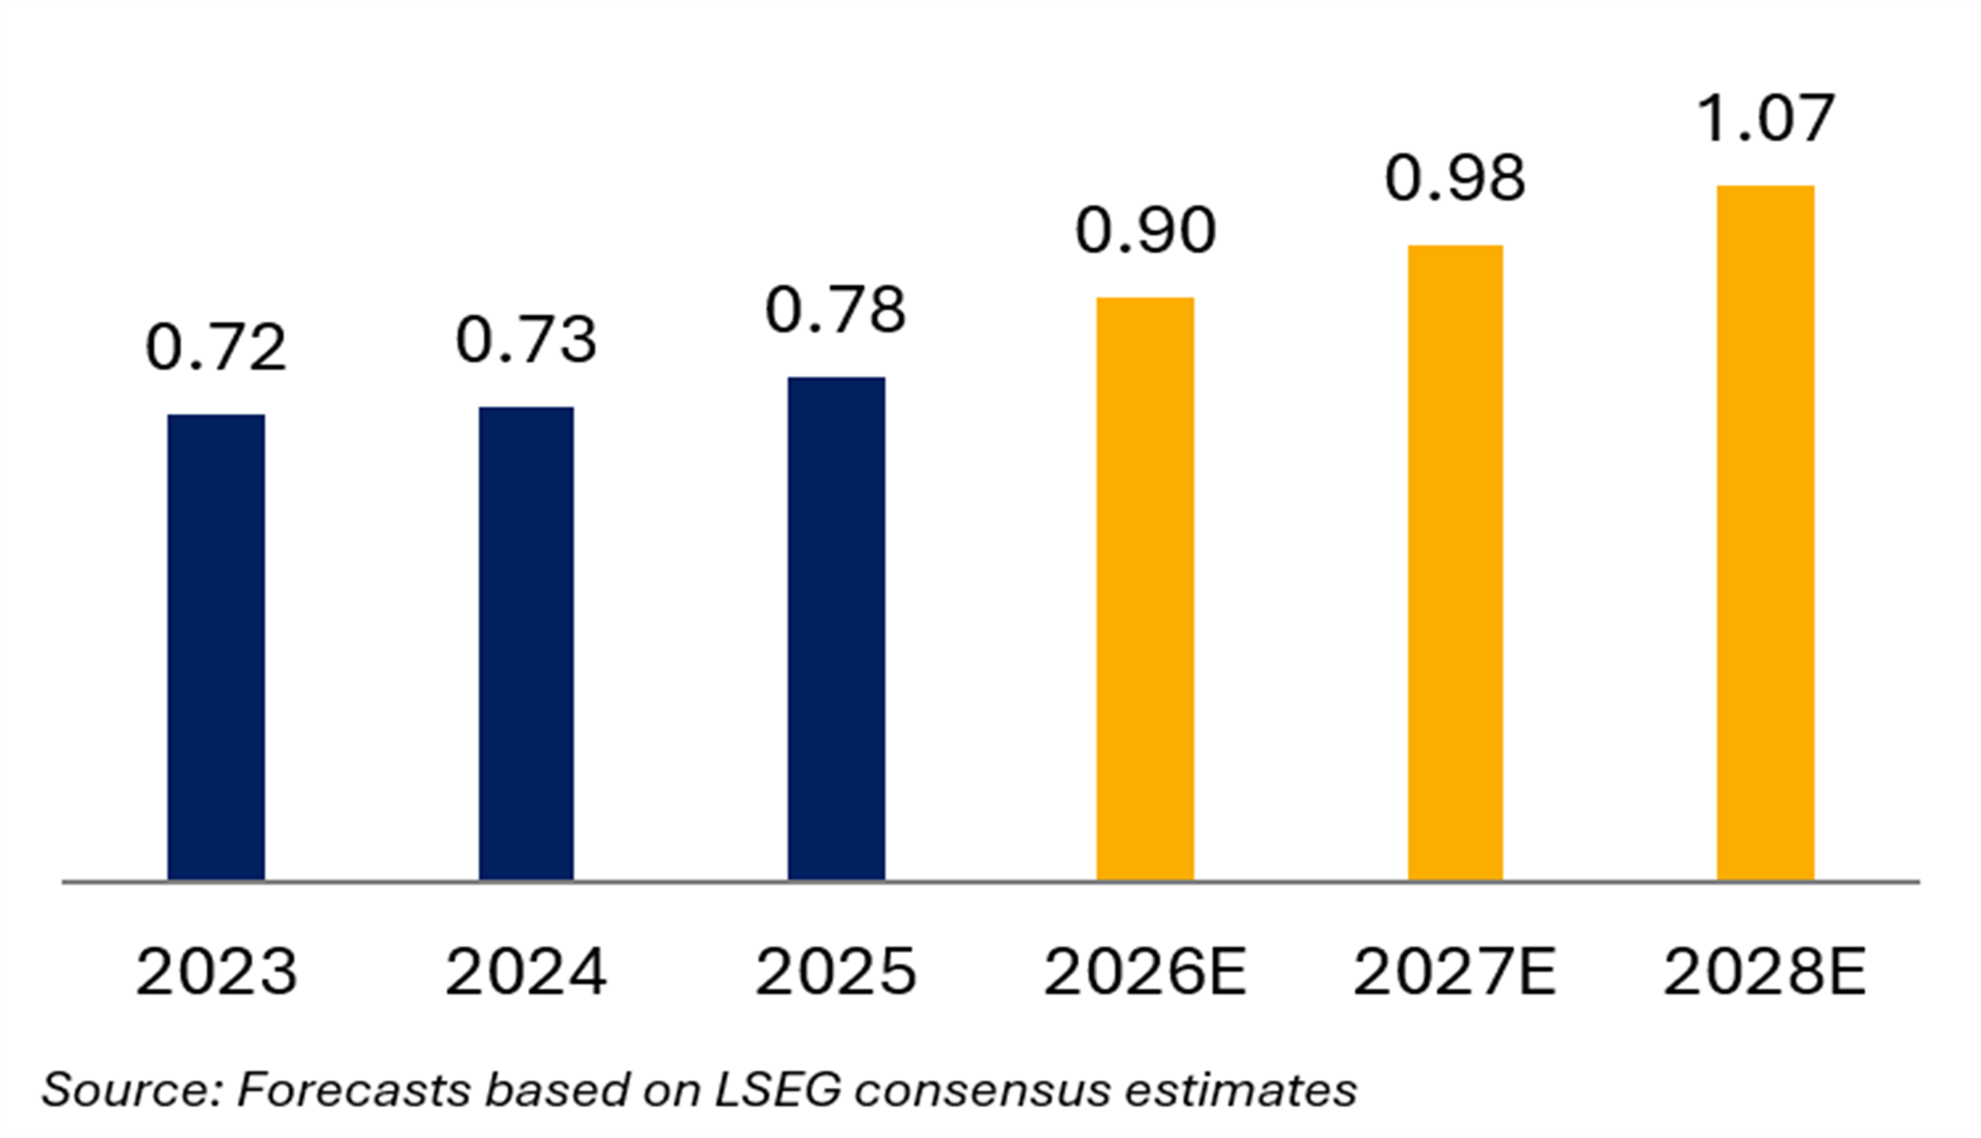
Exhibit 30 1-yr Forward P/E (x) Exhibit 31 EPS € (2025-28 CAGR: 11.0%) 

Redeia: The Leading Transmission Network Company in Spain
Headquartered in Madrid, Spain, Redeia owns and operates through Red Electrica de Espana high-voltage electricity transmission grids and is responsible for its development, maintenance, and improvement of the network’s installations. Redeia is operating along three business segments, “Electricity Infrastructures – Spain”, “Electricity Infrastructures – International” and “Telecommunications”.
The “Electricity Infrastructures – Spain” segment is operating and managing Spain’s electricity transmission grid as the Spanish TSO (Transmission Systems Operator). This segment is Redeia’s core business, accounting for around 85% of group revenues and 80% of group EBITDA.
The “Electricity Infrastructures – International” business is a TSO, which manages and operates international electricity infrastructure in Peru, Chile and Brazil. The international transmission business accounts for roughly 5% of group revenues and for 8% of group EBITDA.
The “Telecommunications” segment consists of the fiber optic business, which primarily operates fiber optic networks and telecommunication services in Spain as well as the 5G business, which develops telecommunications sites for 5G mobile networks. This telecom business accounts for around 10% of group revenues and group EBITDA.
Both of Redeia’s “Electricity Infrastructure” business segments are regulated TSOs in Spain and internationally. Redeia sold its Satellite/Telecom subsidiary Hispasat to Indra at 7.7x EV/EBITDA in 2025. After selling Hispasat and Reintel, Redeia’s telecom-exit plan appears to be completed and future capex should now be channeled primarily into its regulated grid business in Spain to finance the company’s ambitious capex growth plans.
Exhibit 32 Share Price Performance (€) Exhibit 33 1-yr Forward EV/EBITDA 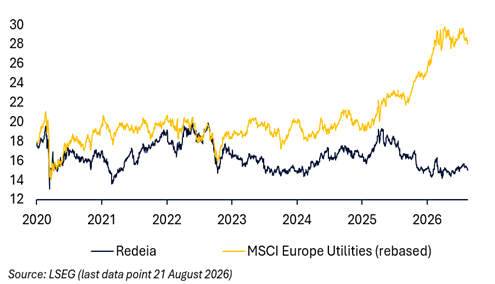
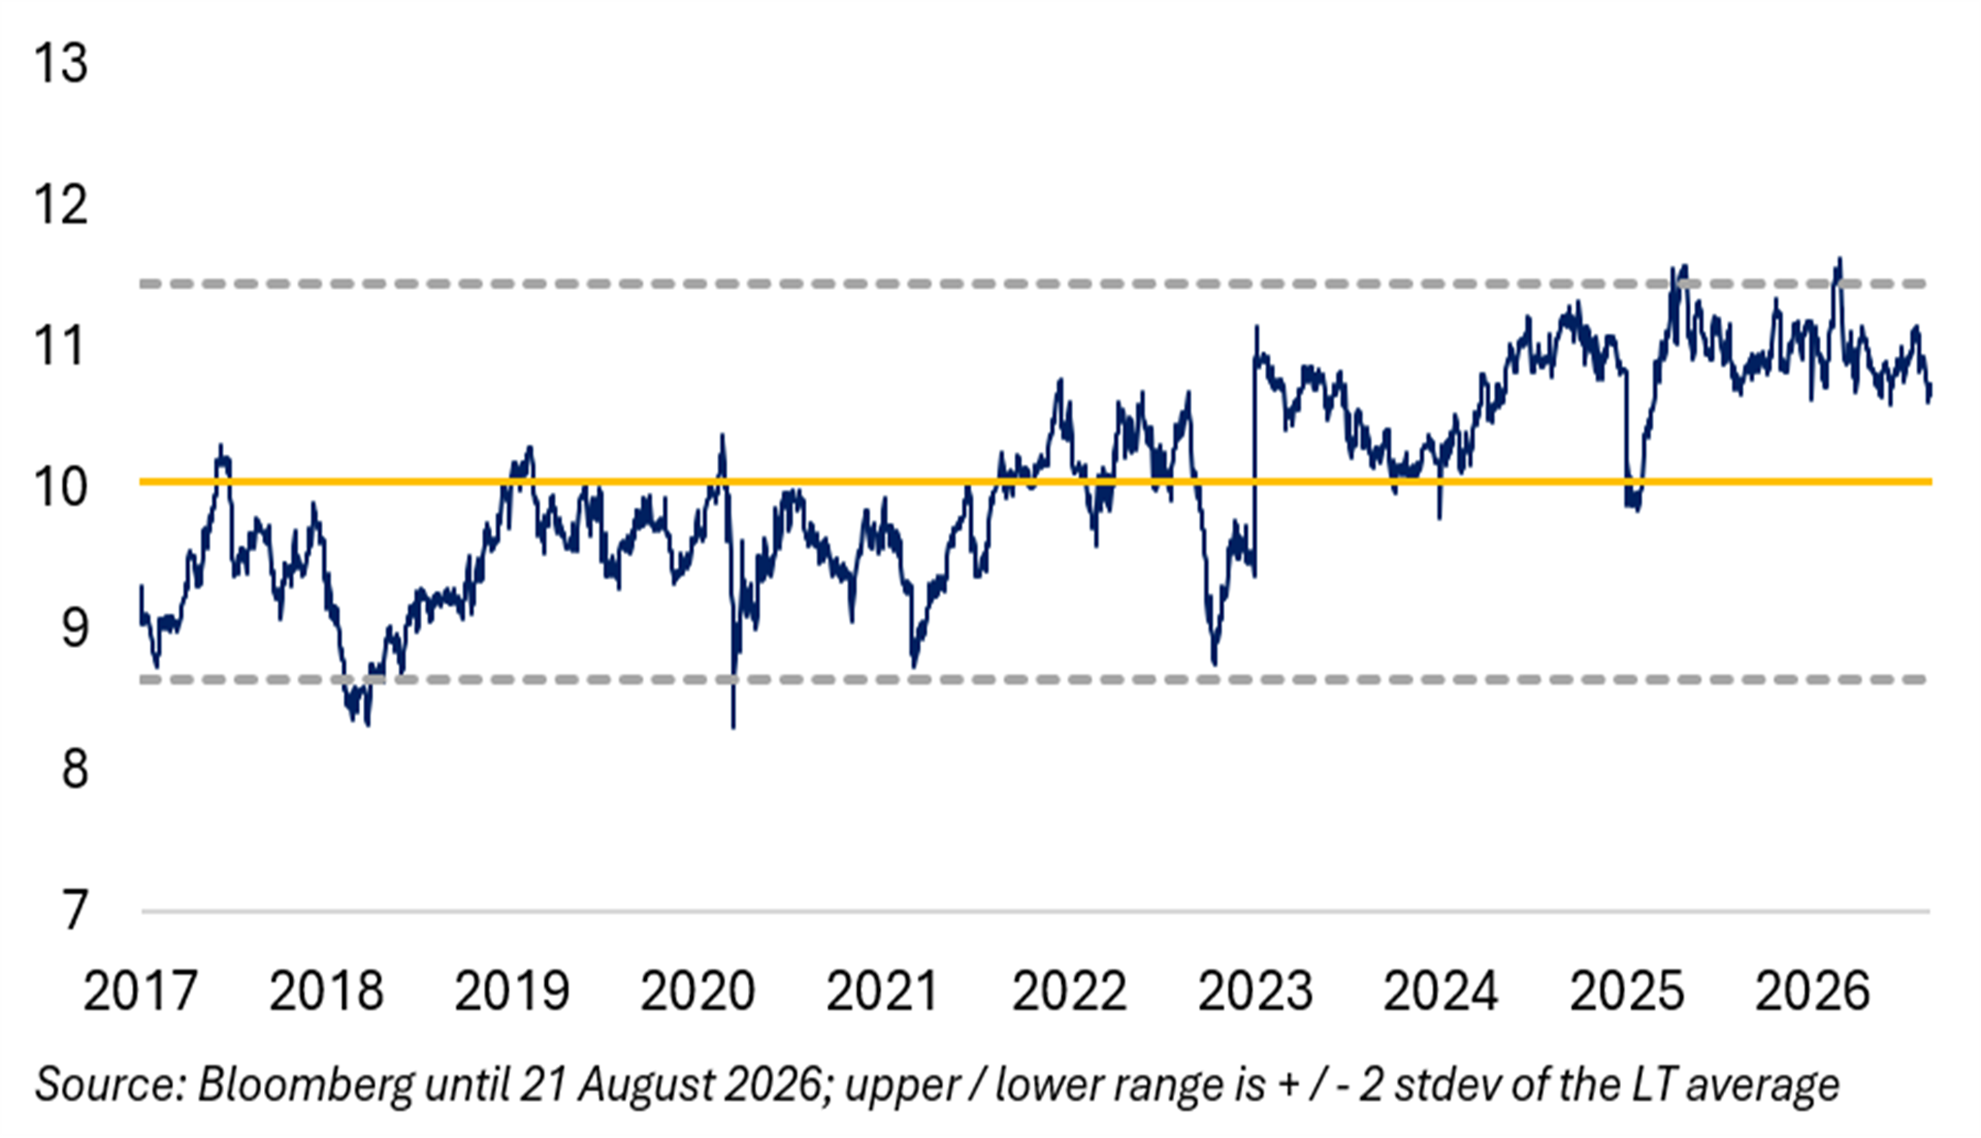

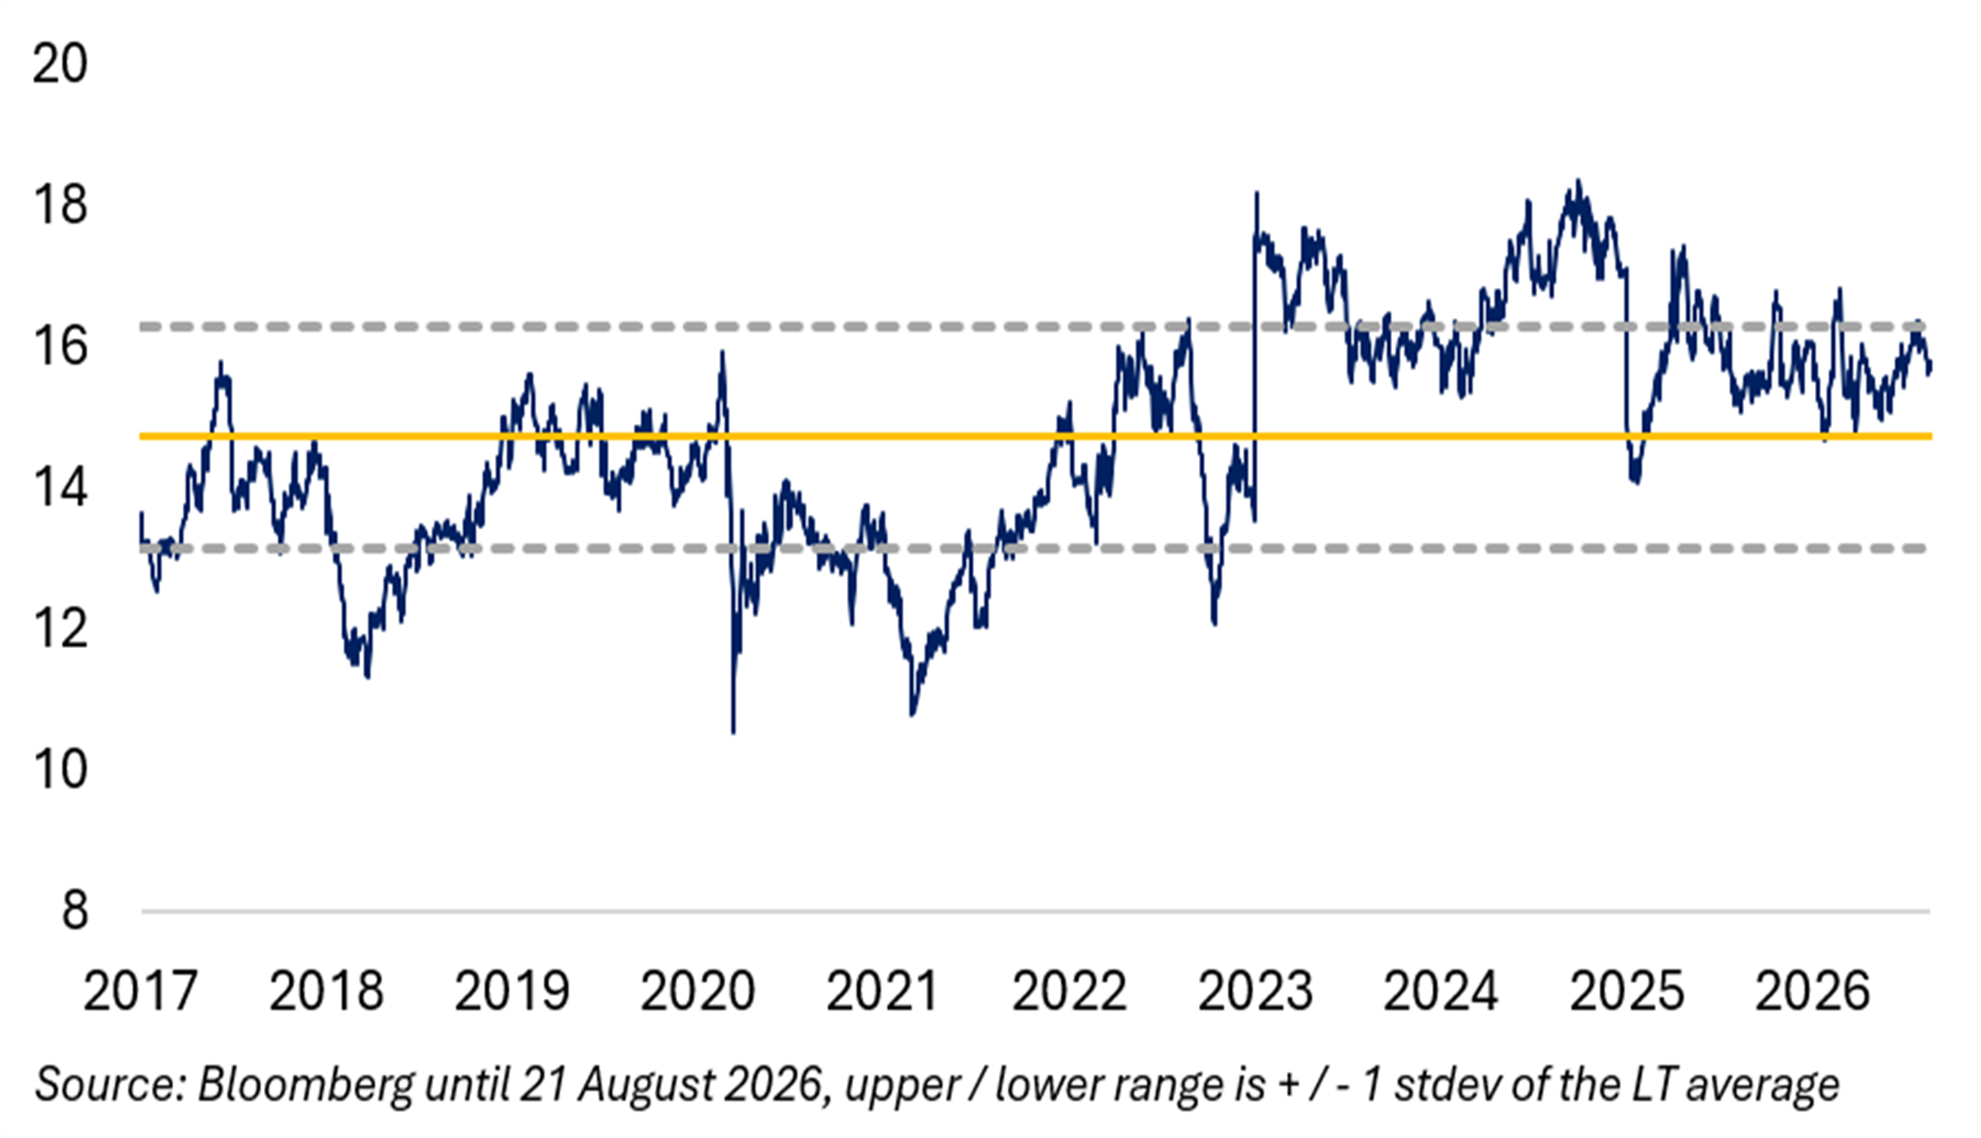
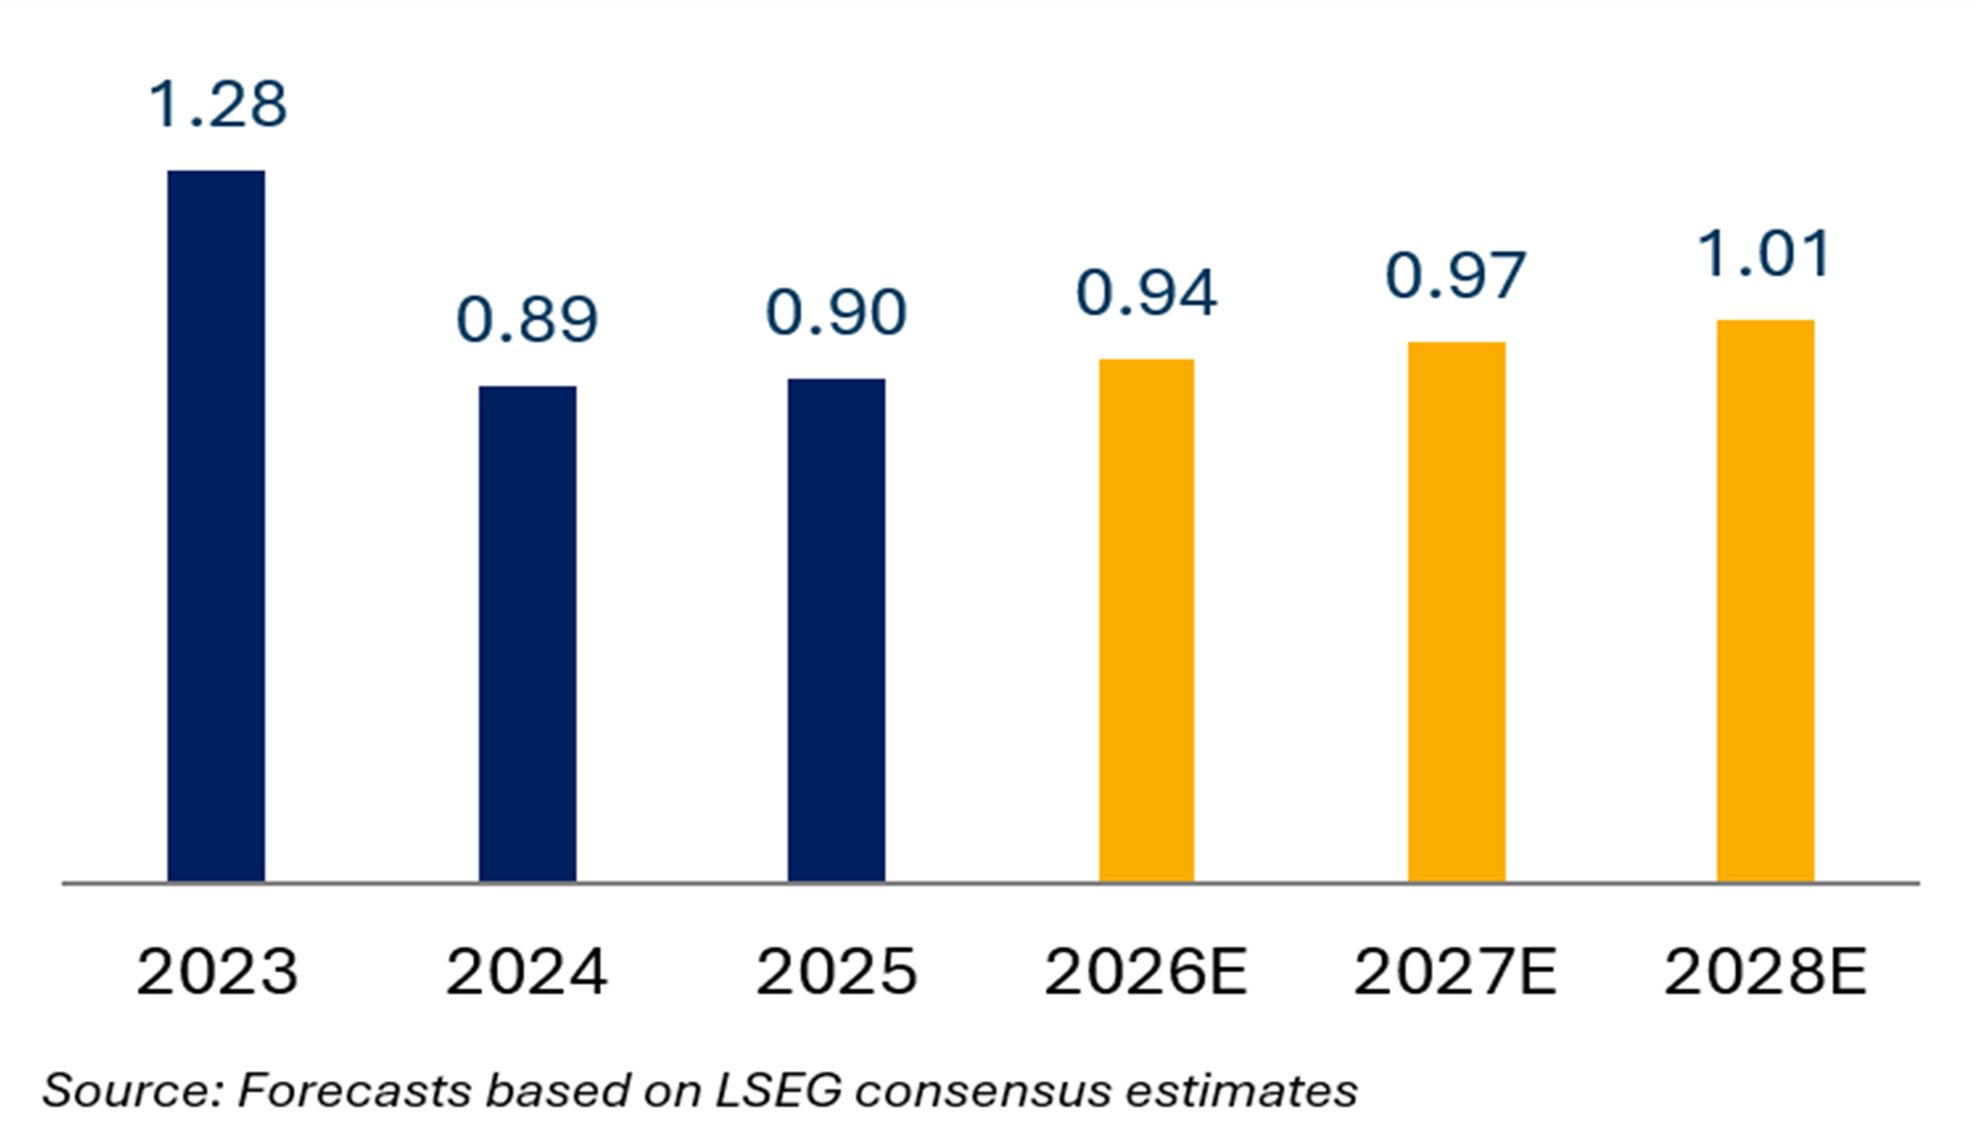
Exhibit 34 1-yr Forward P/E (x) Exhibit 35 EPS € (2025-28 CAGR: 3.7%) 

Terna: Italy’s Power g Transmission Grid Operator
Headquartered in Rome, Italy, Terna owns and operates Italy’s high- and very-high-voltage National Transmission Grid, and, as a TSO, Terna is transmitting and dispatching electricity throughout Italy. Terna is organized along two business units, “Regulated Activities” and “Non-regulated Activities”, of which “Regulated Activities” provides the vast majority of group revenues (80% in FY 2025) and group EBITDA (95%).
Terna’s “Regulated Activities” are divided into two business segments: “Transmission” – planning, developing and maintaining Italy’s transmission grid – and “Dispatching” – maintaining the balance between electricity demand and supply in Italy. These “Regulated Activities” fall under Italy’s Regulatory Authority for Energy, Networks and the Environment (ARERA).
Terna’s “Non-Regulated Activities” comprise three business activities: First, “Equipment”, which operates through two companies, the Tamini Group (power transformers for electricity transmission and distribution grids) and the Brugg Cables Group (very high voltage products, electrical cables of all voltages and accessories for high and very high-voltage cables). Second, “Connectivity”, provides fibre-optic infrastructure, installed within the ground wires of the power lines of the Italian electricity grid. Third, “Energy Services”, which operates through the newly established Altenia Group that provides operation, management and repowering of solar plants.
The CEO of Terna, Mr. Pasqualino Monti, joined the company upon his appointment in May 2026, when he succeeded Ms. Giuseppina Di Foggia, who was CEO from May 2023 until May 2026, when she left to become Chairwoman of Eni. Prior to Terna, Mr. Monti served as CEO and Director of ENAV S.p.A., Italy’s air navigation services provider. The CFO of Terna, Mr. Francesco Beccali joined the company in 2011 and has been CFO since September 2023. Earlier in his career, he held positions at BNP Paribas, BNL, and Cofiri.
Exhibit 36 Share Price Performance (€) Exhibit 37 1-yr Forward EV/EBITDA 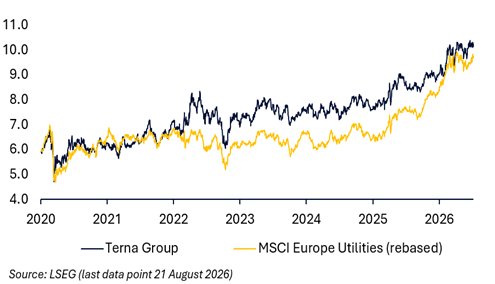
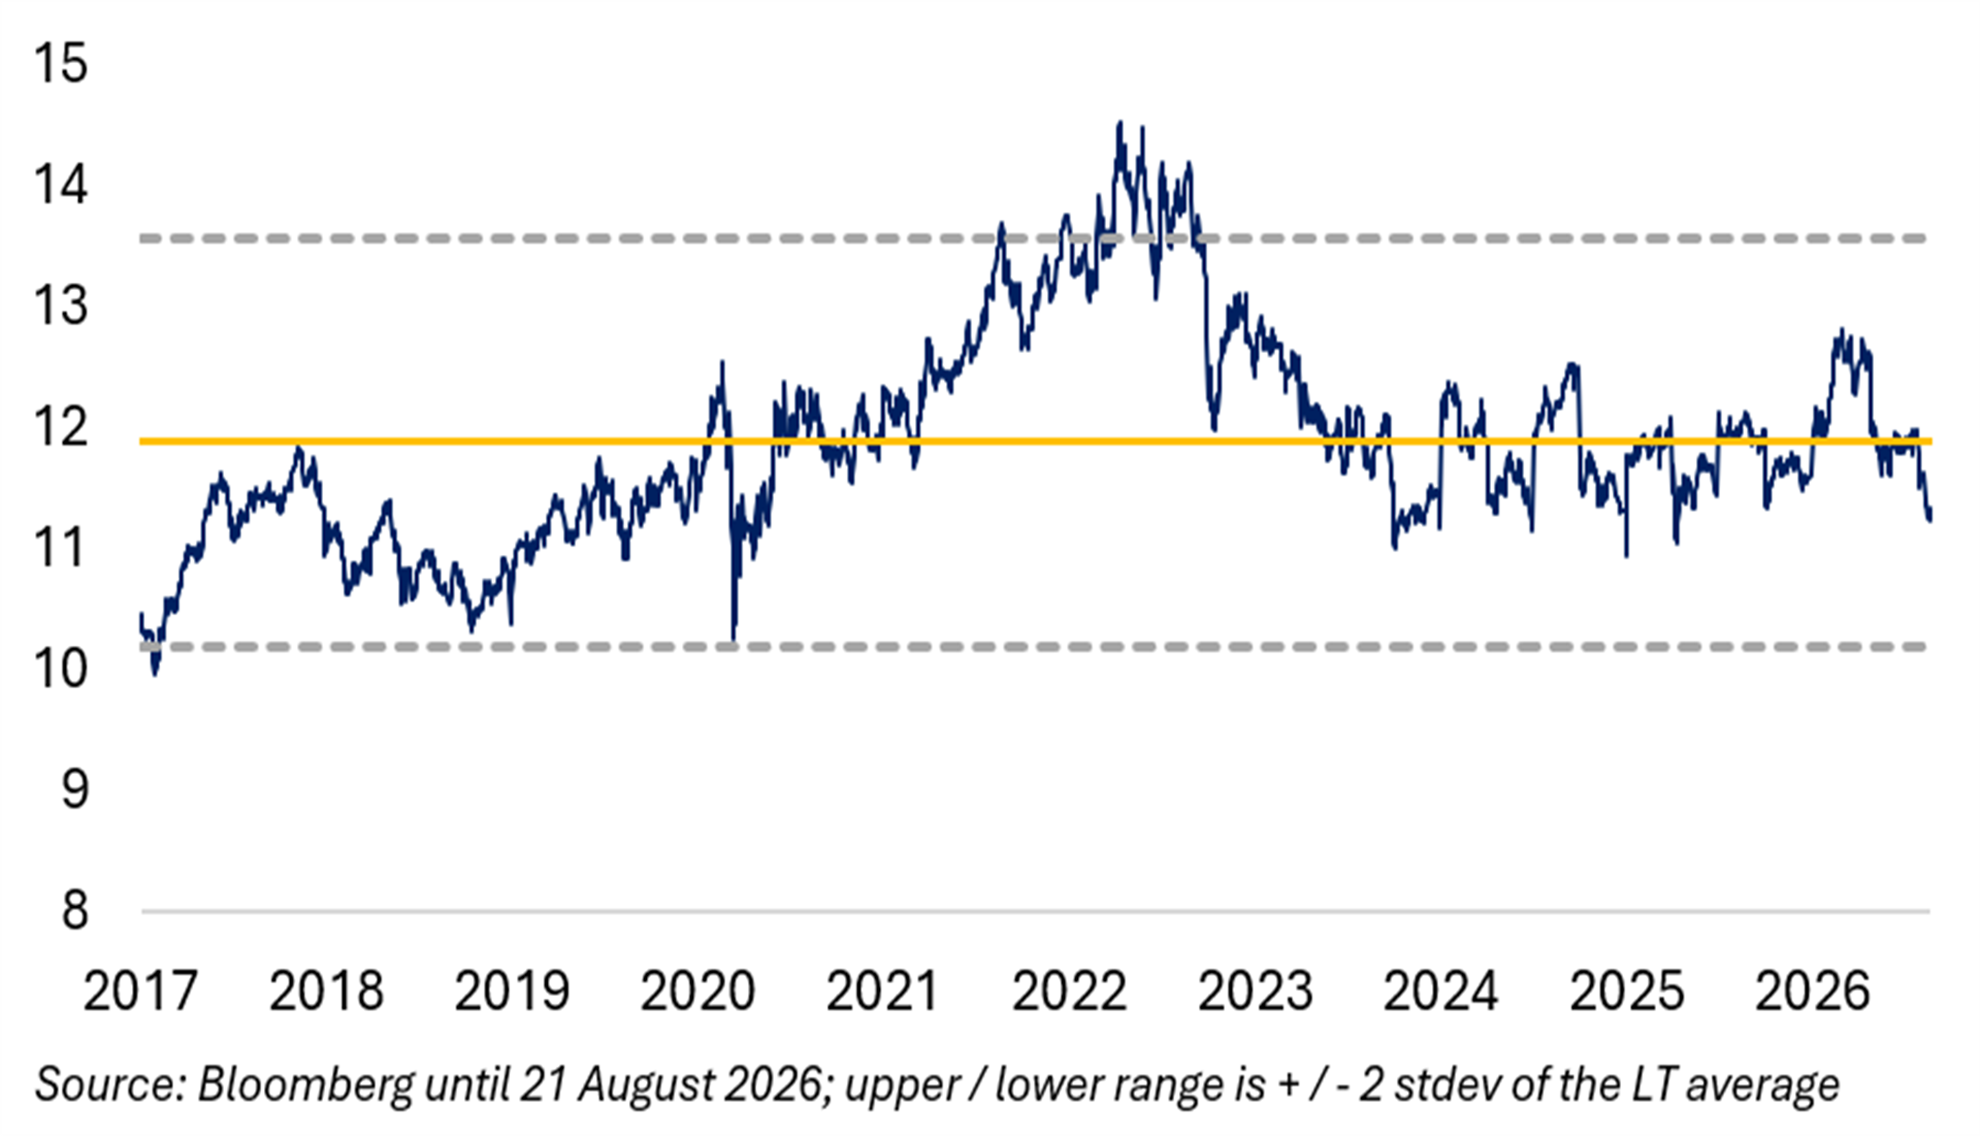

Exhibit 38 1-yr Forward P/E (x) Exhibit 39 EPS € (2025-28 CAGR: 3.2%) 
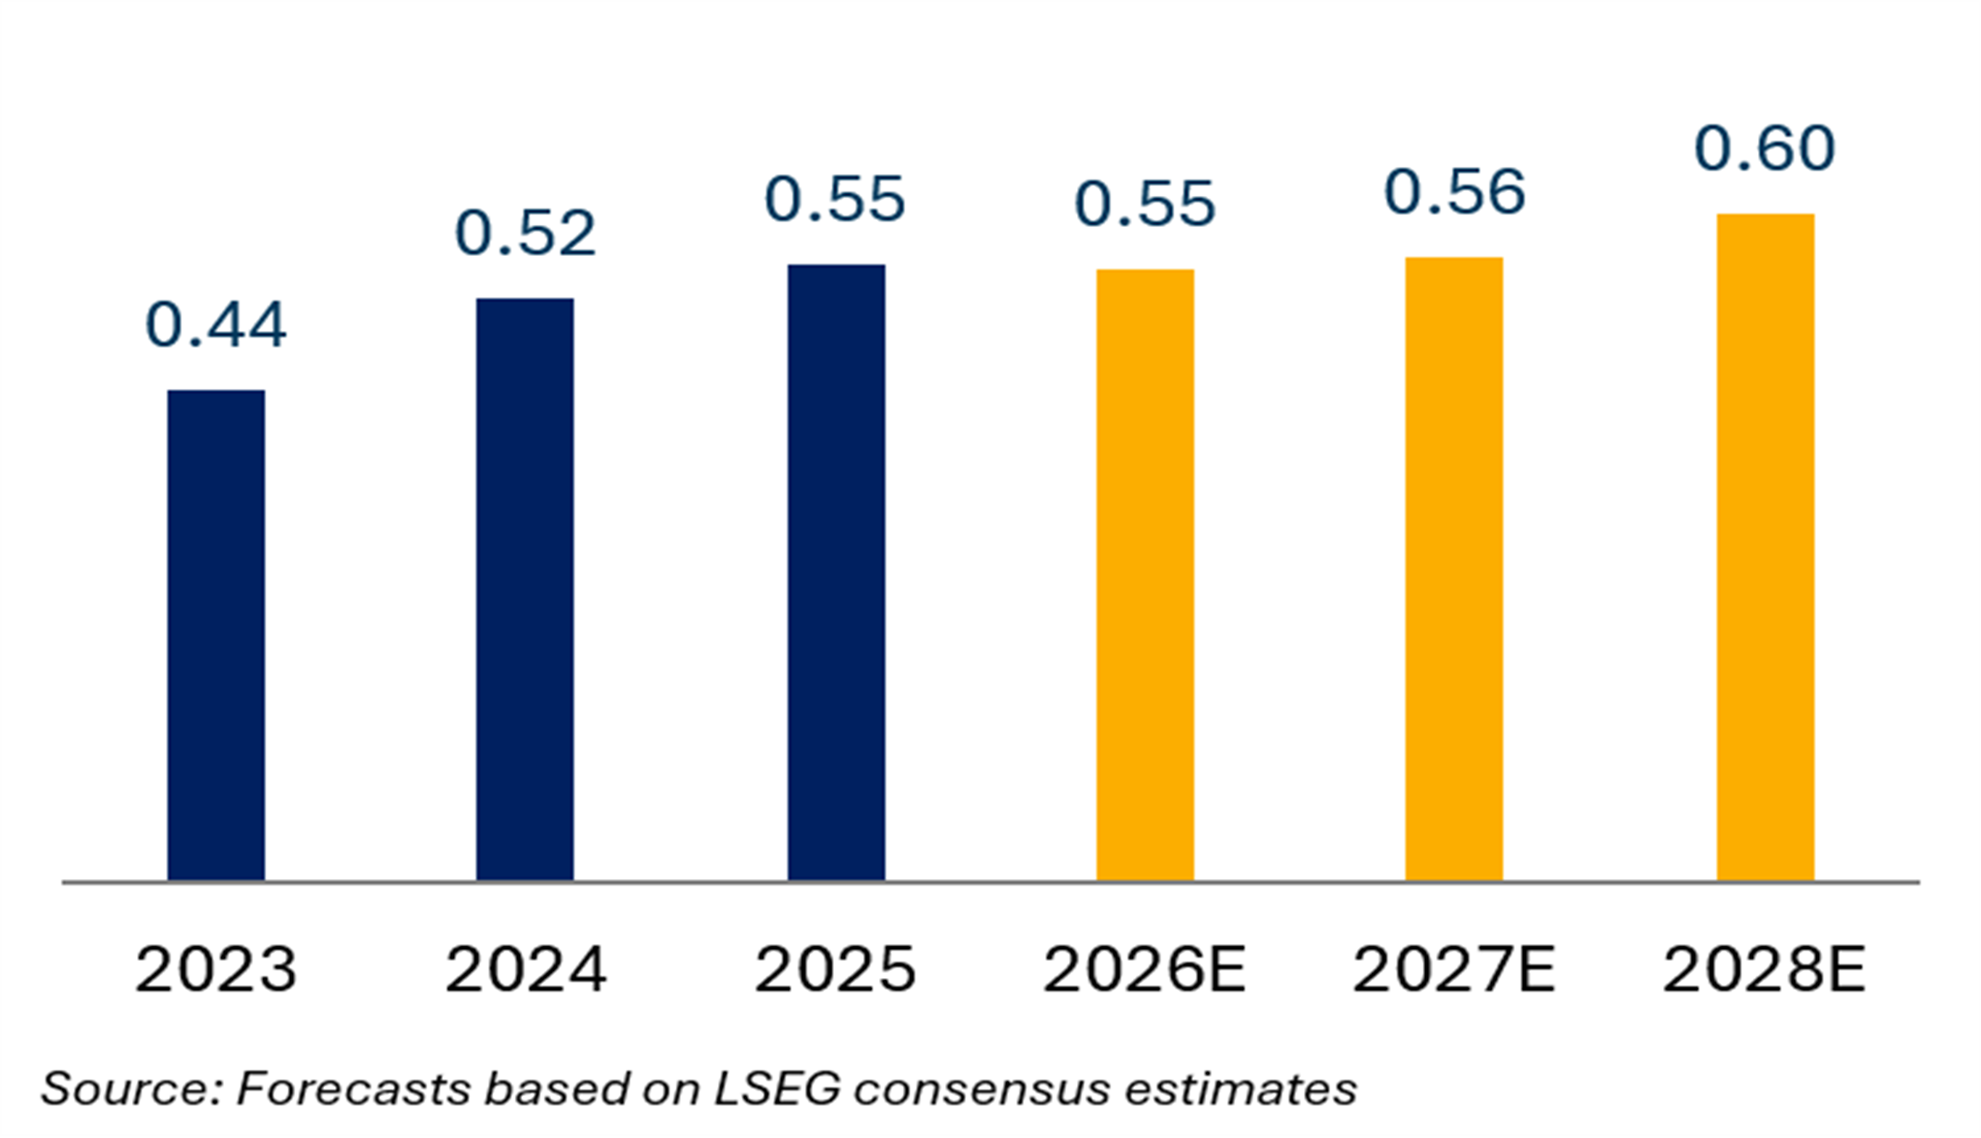
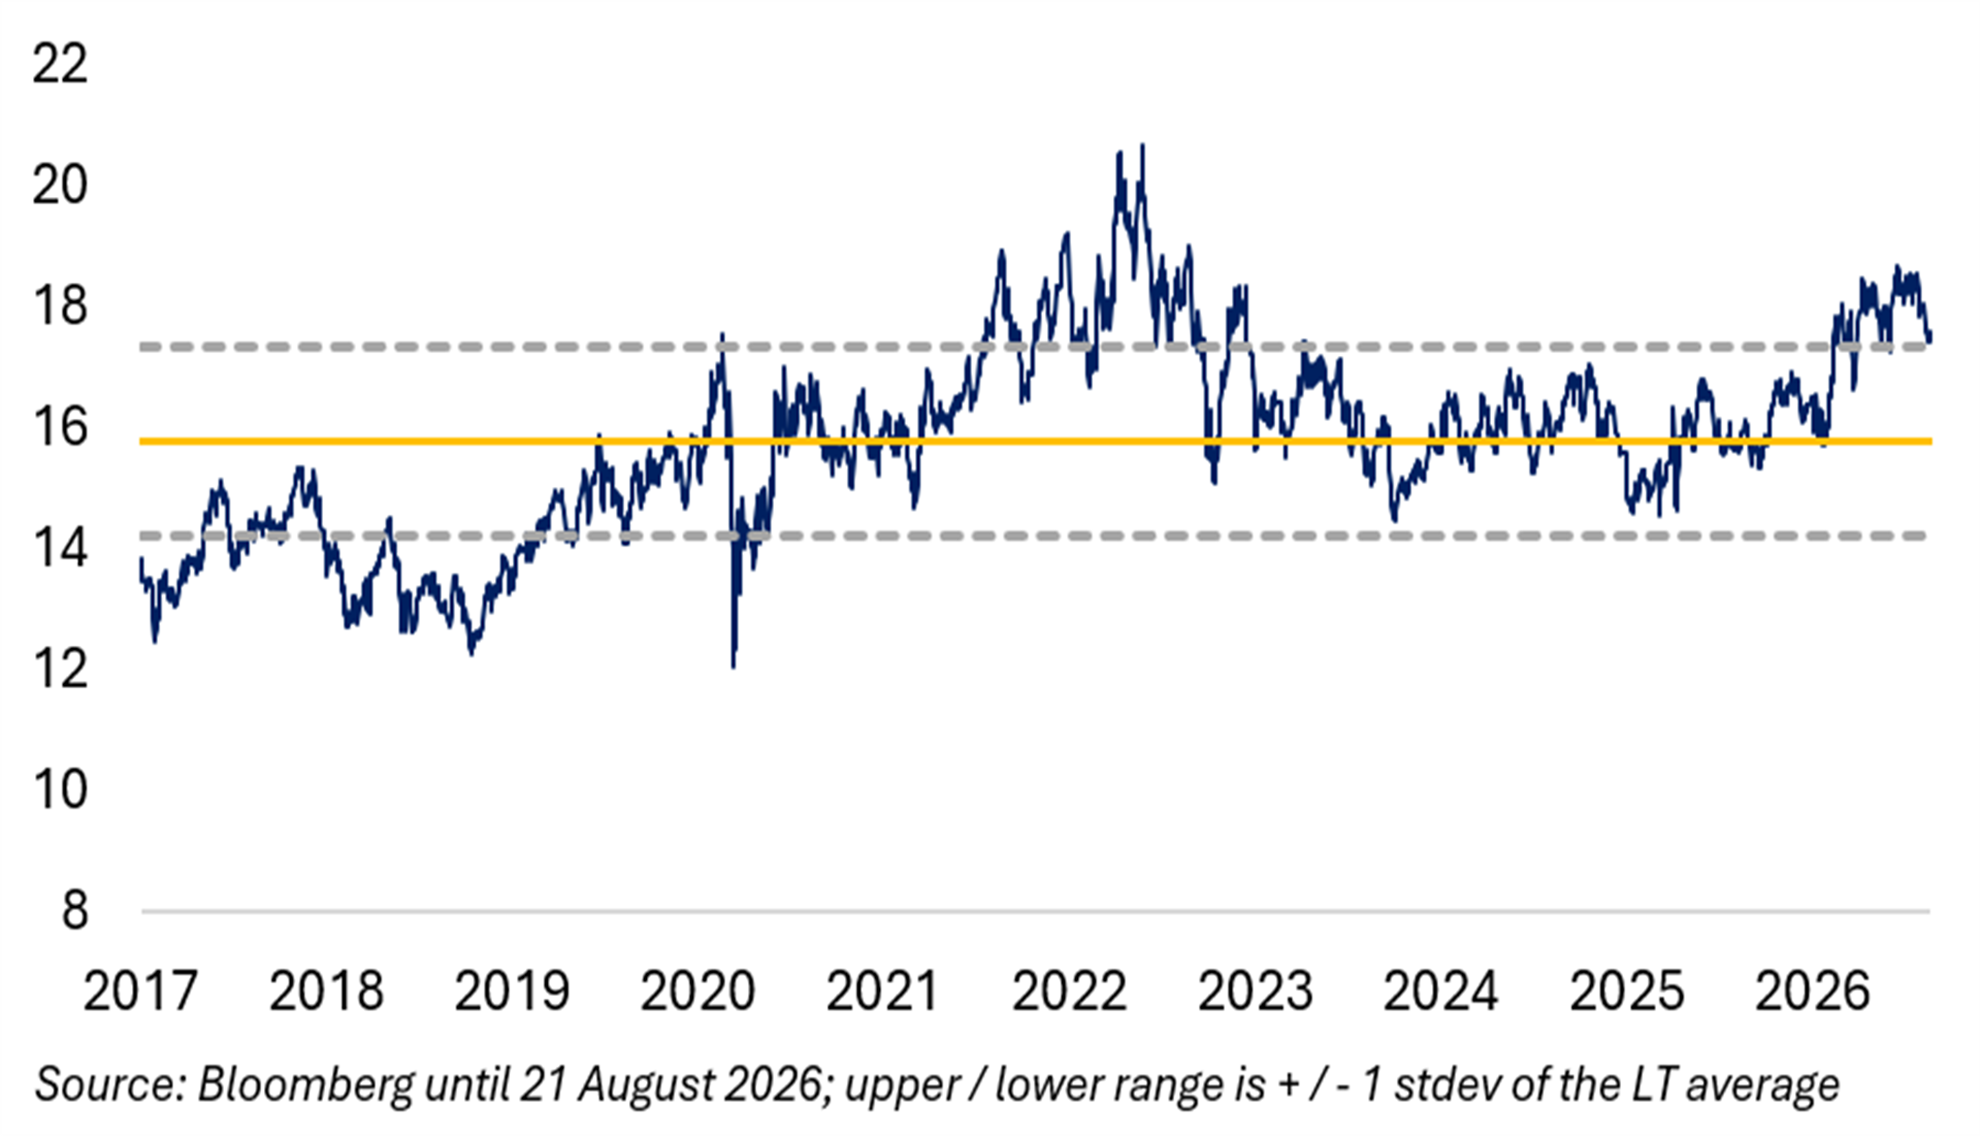

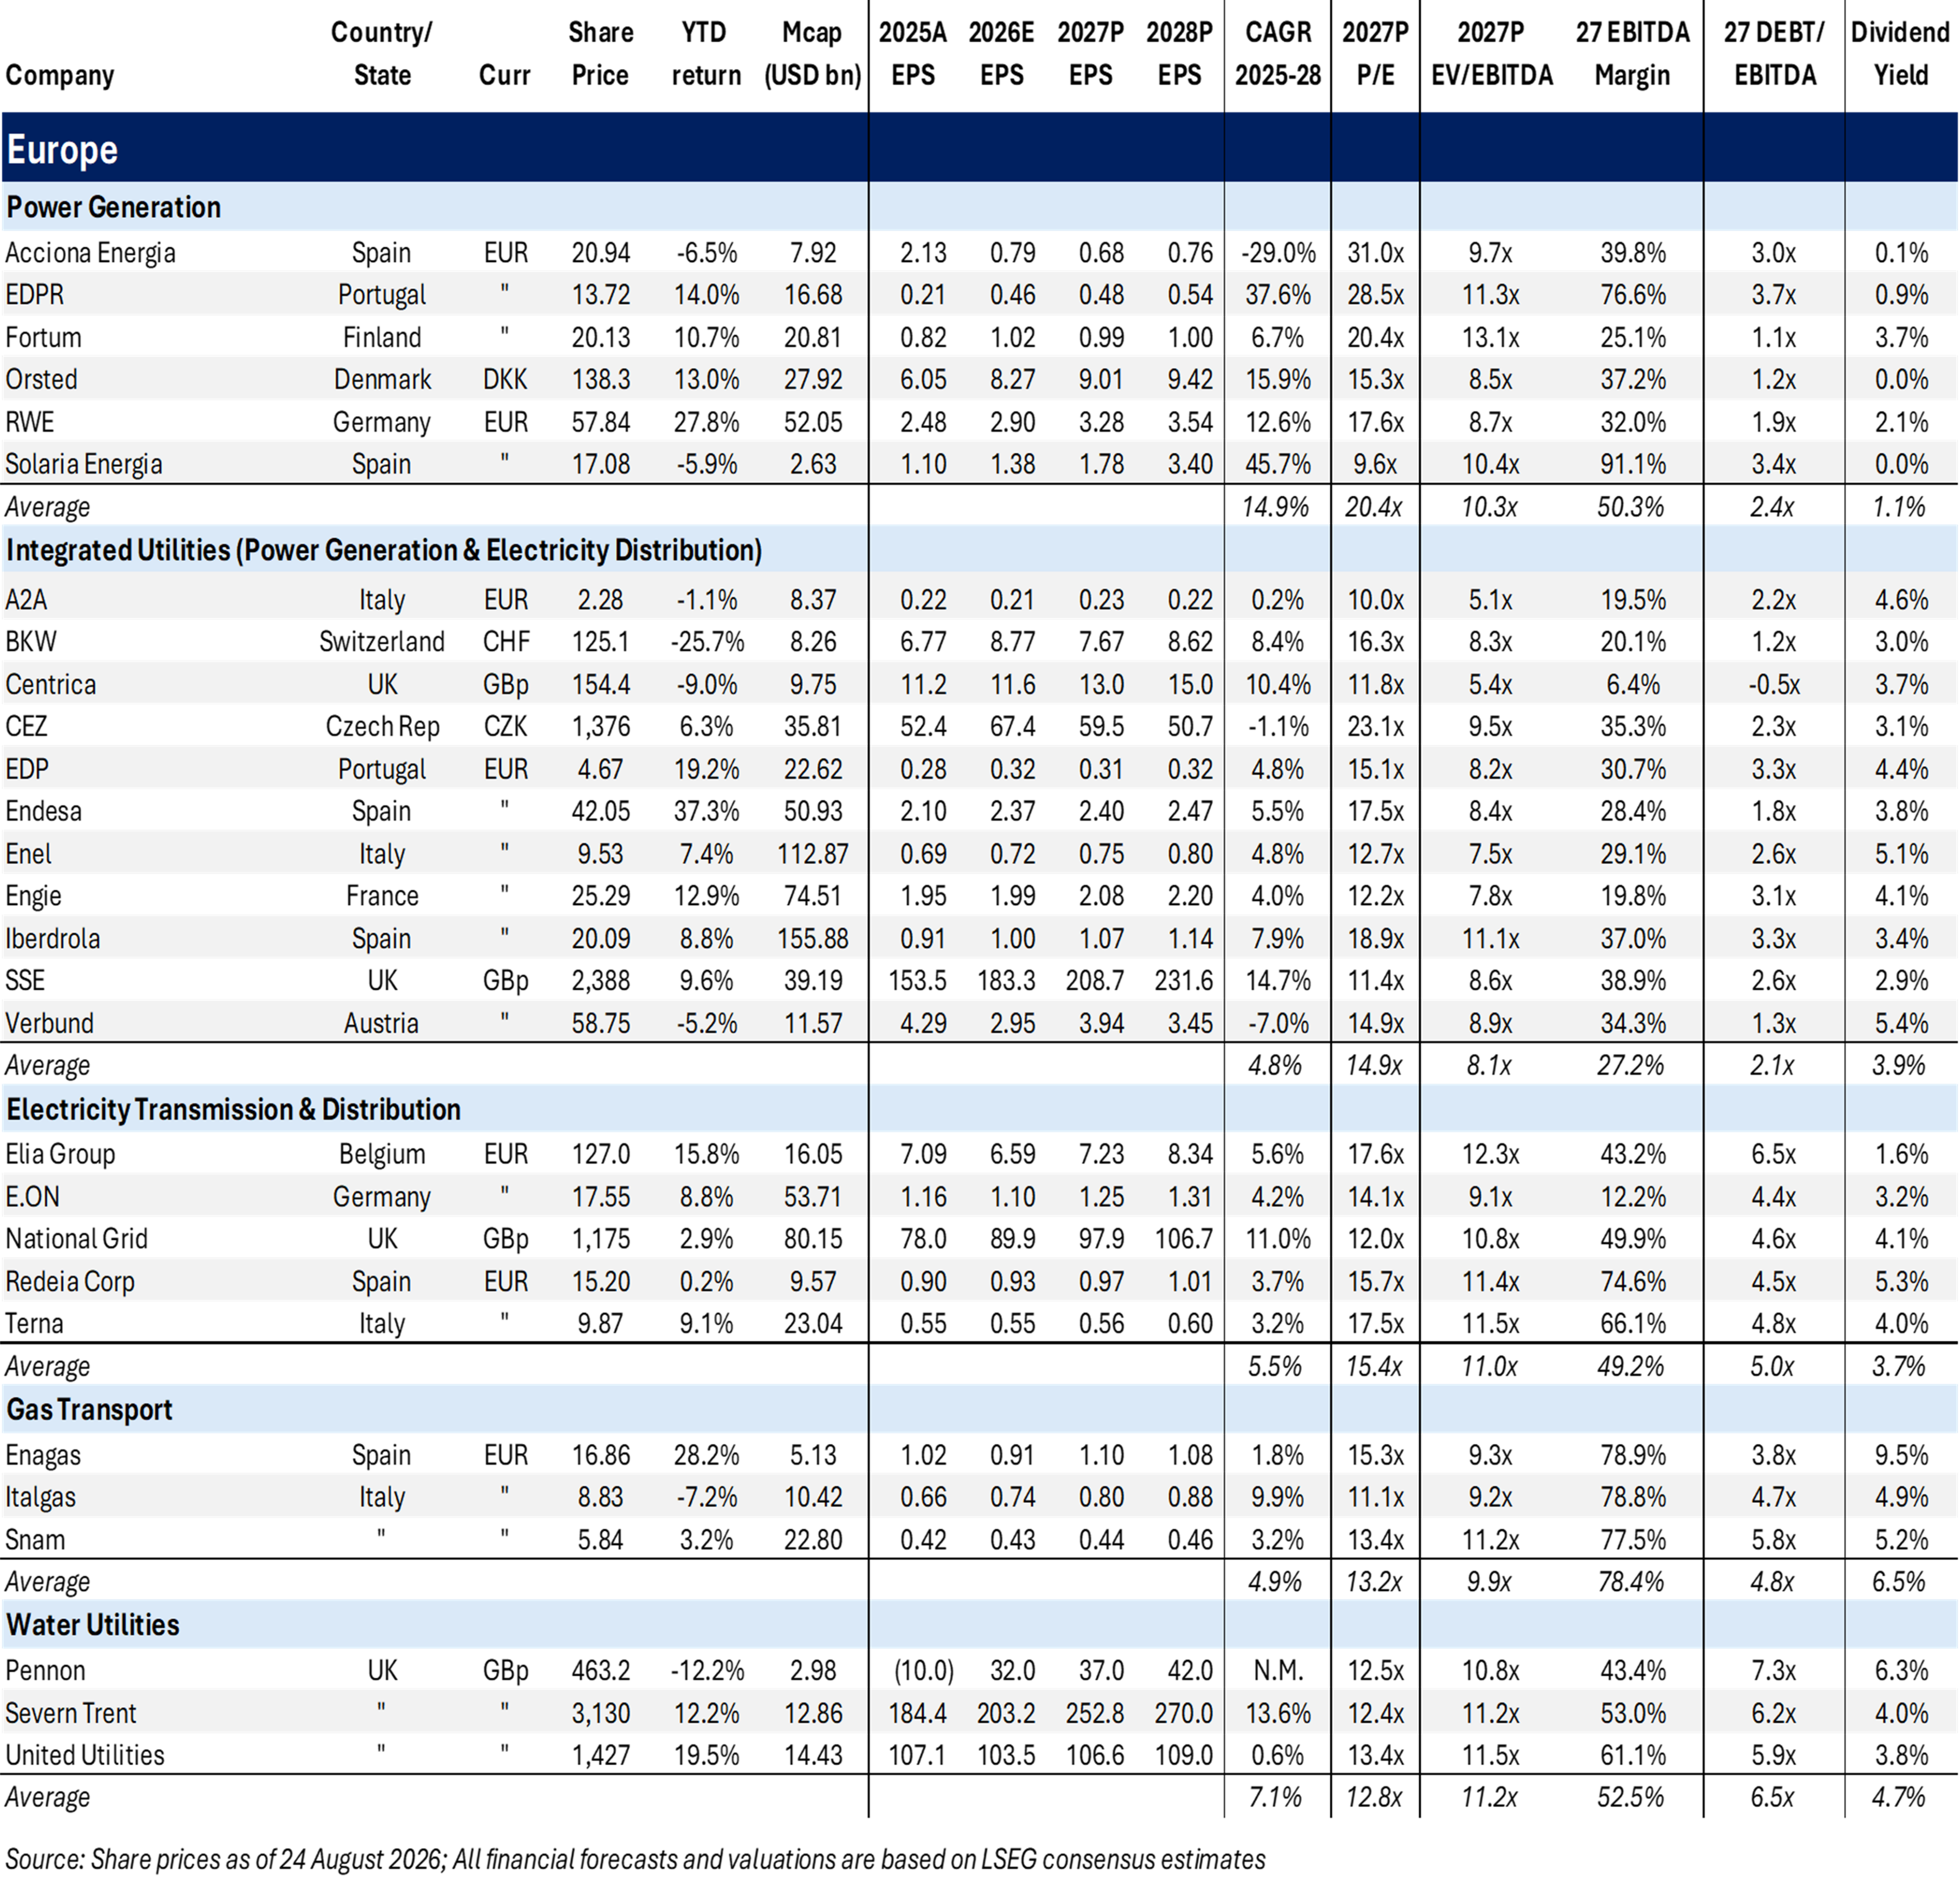
Table 3 Performance and Valuation Comps Table

VOLTASTT. 61 8044 ZURICH, SWITZERLAND Gabelli Funds TEL (914) 921-5100
This whitepaper was prepared by Jens Zimmermann, CFA. The examples cited herein are based on public information and we make no representations regarding their accuracy or usefulness as precedent. The Research Analysts’ views are subject to change at any time based on market and other conditions. The information in this report represent the opinions of the individual Research Analysts’ as of the date hereof and is not intended to be a forecast of future events, a guarantee of future results, or investments advice. The views expressed may differ from other Research Analyst or of the Firm as a whole.
As of June 30, 2026, affiliates of GAMCO Investors, Inc. beneficially owned less than 1% of all companies mentioned.
Funds investing in a single sector, such as utilities, may be subject to more volatility than funds that invest more broadly. The utilities industry can be significantly affected by government regulation, financing difficulties, supply or demand of services or fuel and natural resources conservation. The value of utility stocks changes as long-term interest rates change
Investors should carefully consider the investment objectives, risks, charges and expenses of the Fund before investing. The prospectus, which contains more complete information about this and other matters, should be read carefully before investing. To obtain a prospectus, please call 800 GABELLI or visit www.gabelli.com
Returns represent past performance and do not guarantee future results. Current performance may be lower or higher than the performance data quoted. Investment return and principal value will fluctuate so, upon redemption, shares may be worth more or less than their original cost. To obtain the most recent month end performance information and a prospectus, please call 800-GABELLI or visit www.gabelli.com
Distributed by G.distributors, LLC., a registered broker dealer and member of FINRA.
This whitepaper is not an offer to sell any security nor is it a solicitation of an offer to buy any security.
For more information, visit our website at: www.gabelli.com or call: 800-GABELLI
800-422-3554 • 914-921-5000 • Fax 914-921-5098 • info@gabelli.com
Gabelli Funds, LLC is a registered investment adviser with the Securities and Exchange Commission and is a wholly owned subsidiary of GAMCO Investors, Inc. (OTCQX: GAMI).