May 2026: Solid 1Q 2026 results confirm strong earnings momentum in 2026
What You Need to Know
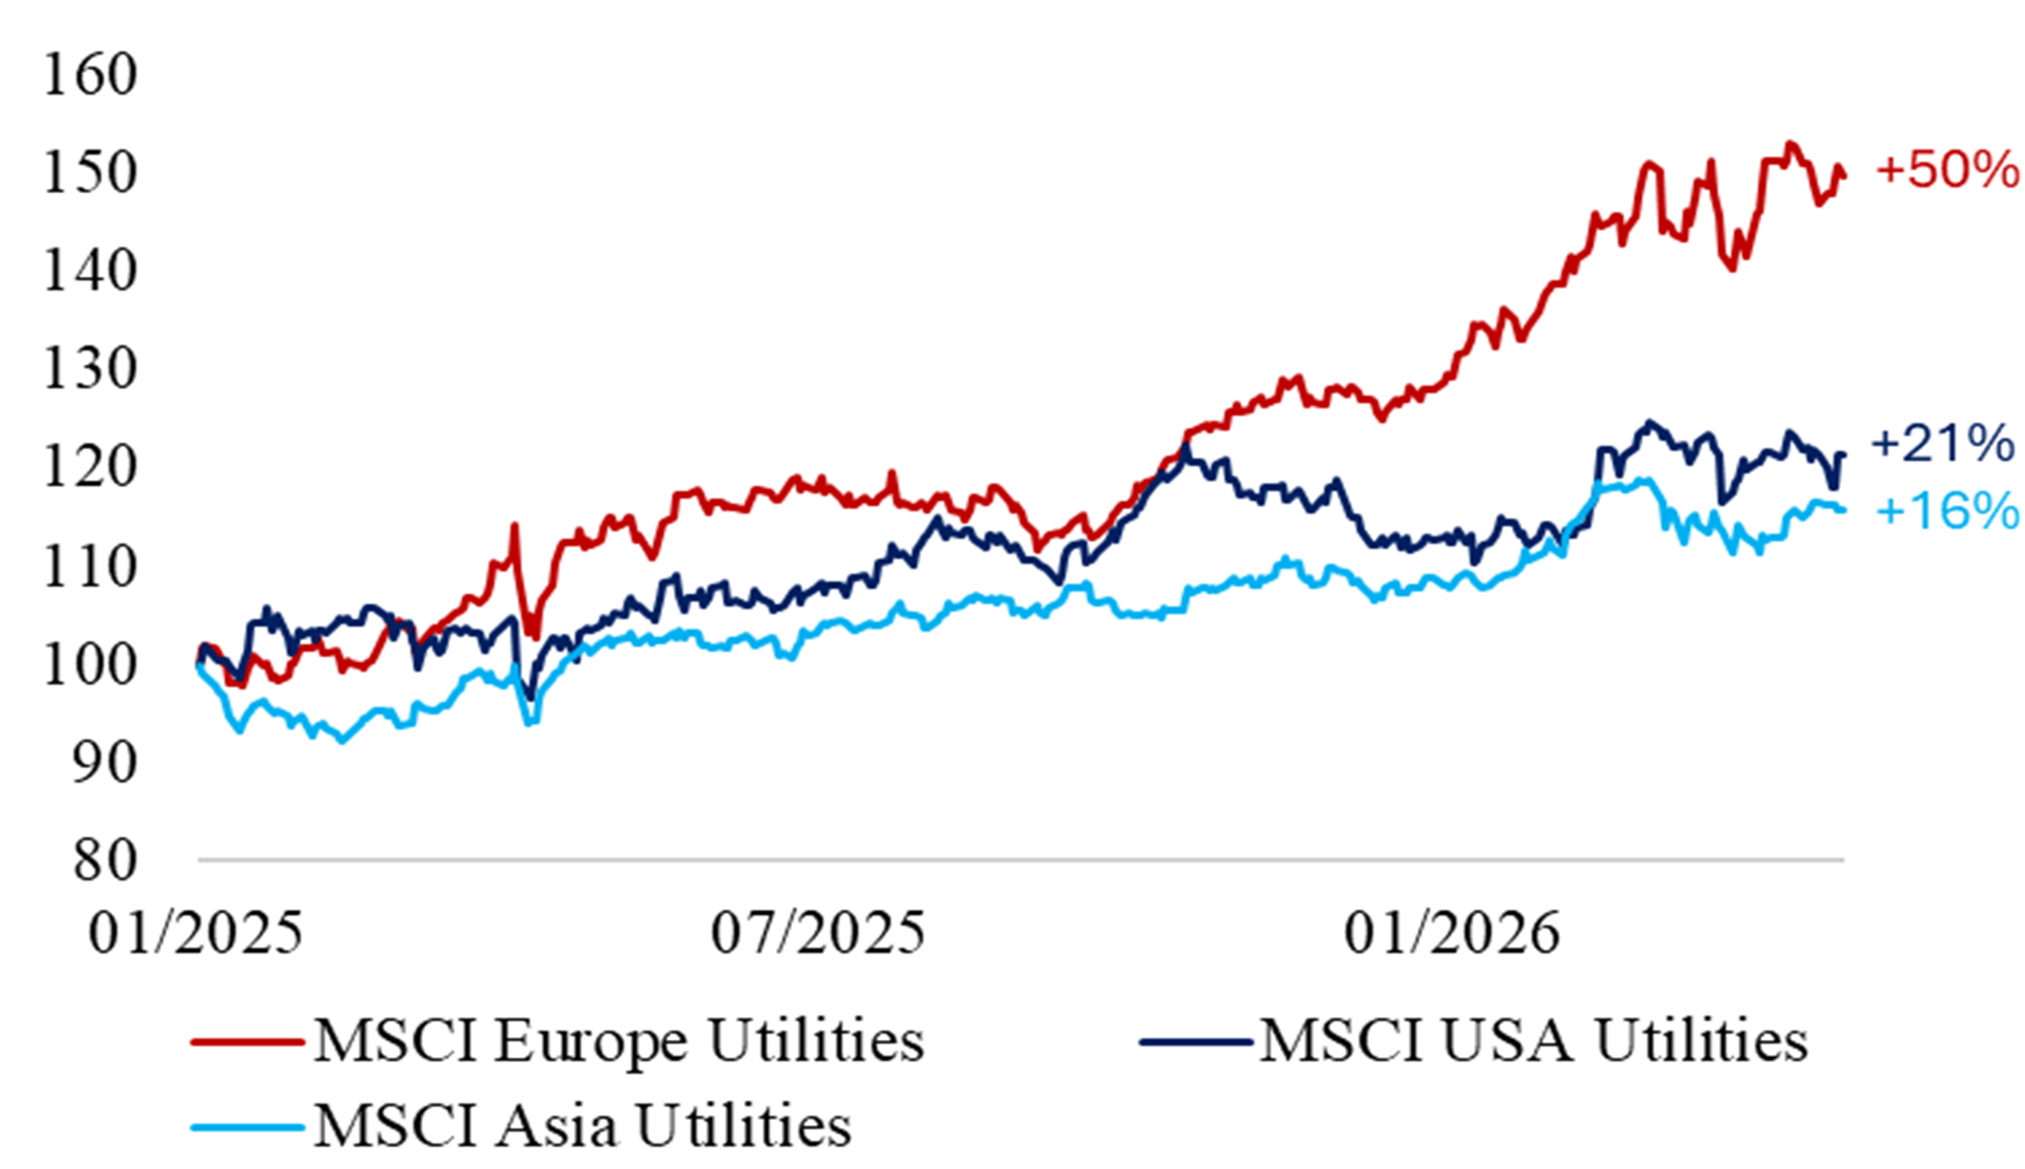
So far, the often-cited stock market adage “Sell in May and go away” has not materialized this month, as global equities have extended April’s winning streak into May. Despite significant geopolitical uncertainty surrounding the outcome of the Iran conflict, the broader market (MSCI World) is on track to add another 3% in May, thereby fully erasing the early March losses and gaining 4.7% since the outbreak of the military conflict on 28 February (see Table 1). Conversely, energy stocks (MSCI World Energy) continued to tread water and dropped slightly in May amid volatile commodity prices, though the energy sector still holds a solid YTD gain of 29%. Global utilities (MSCI World Utilities) have so far also declined in May, giving back all April gains; the sector performance has now turned negative since the start of the Iran conflict and is also slightly trailing the broader market YTD. Thus, despite posting solid 1Q 2026 results that mostly met or beat consensus expectations (see Monthly Focus), US and European utilities could not extend April’s gains and instead declined in May due to rising interest rates. While utilities across all regions have now posted negative returns since 28 February, all regions continue to show solid YTD gains, led by European utilities (MSCI Europe Utilities), which also continue to outperform the broader market (MSCI World) by about 4.5% (see Table 1).
Table 1 Index Performances
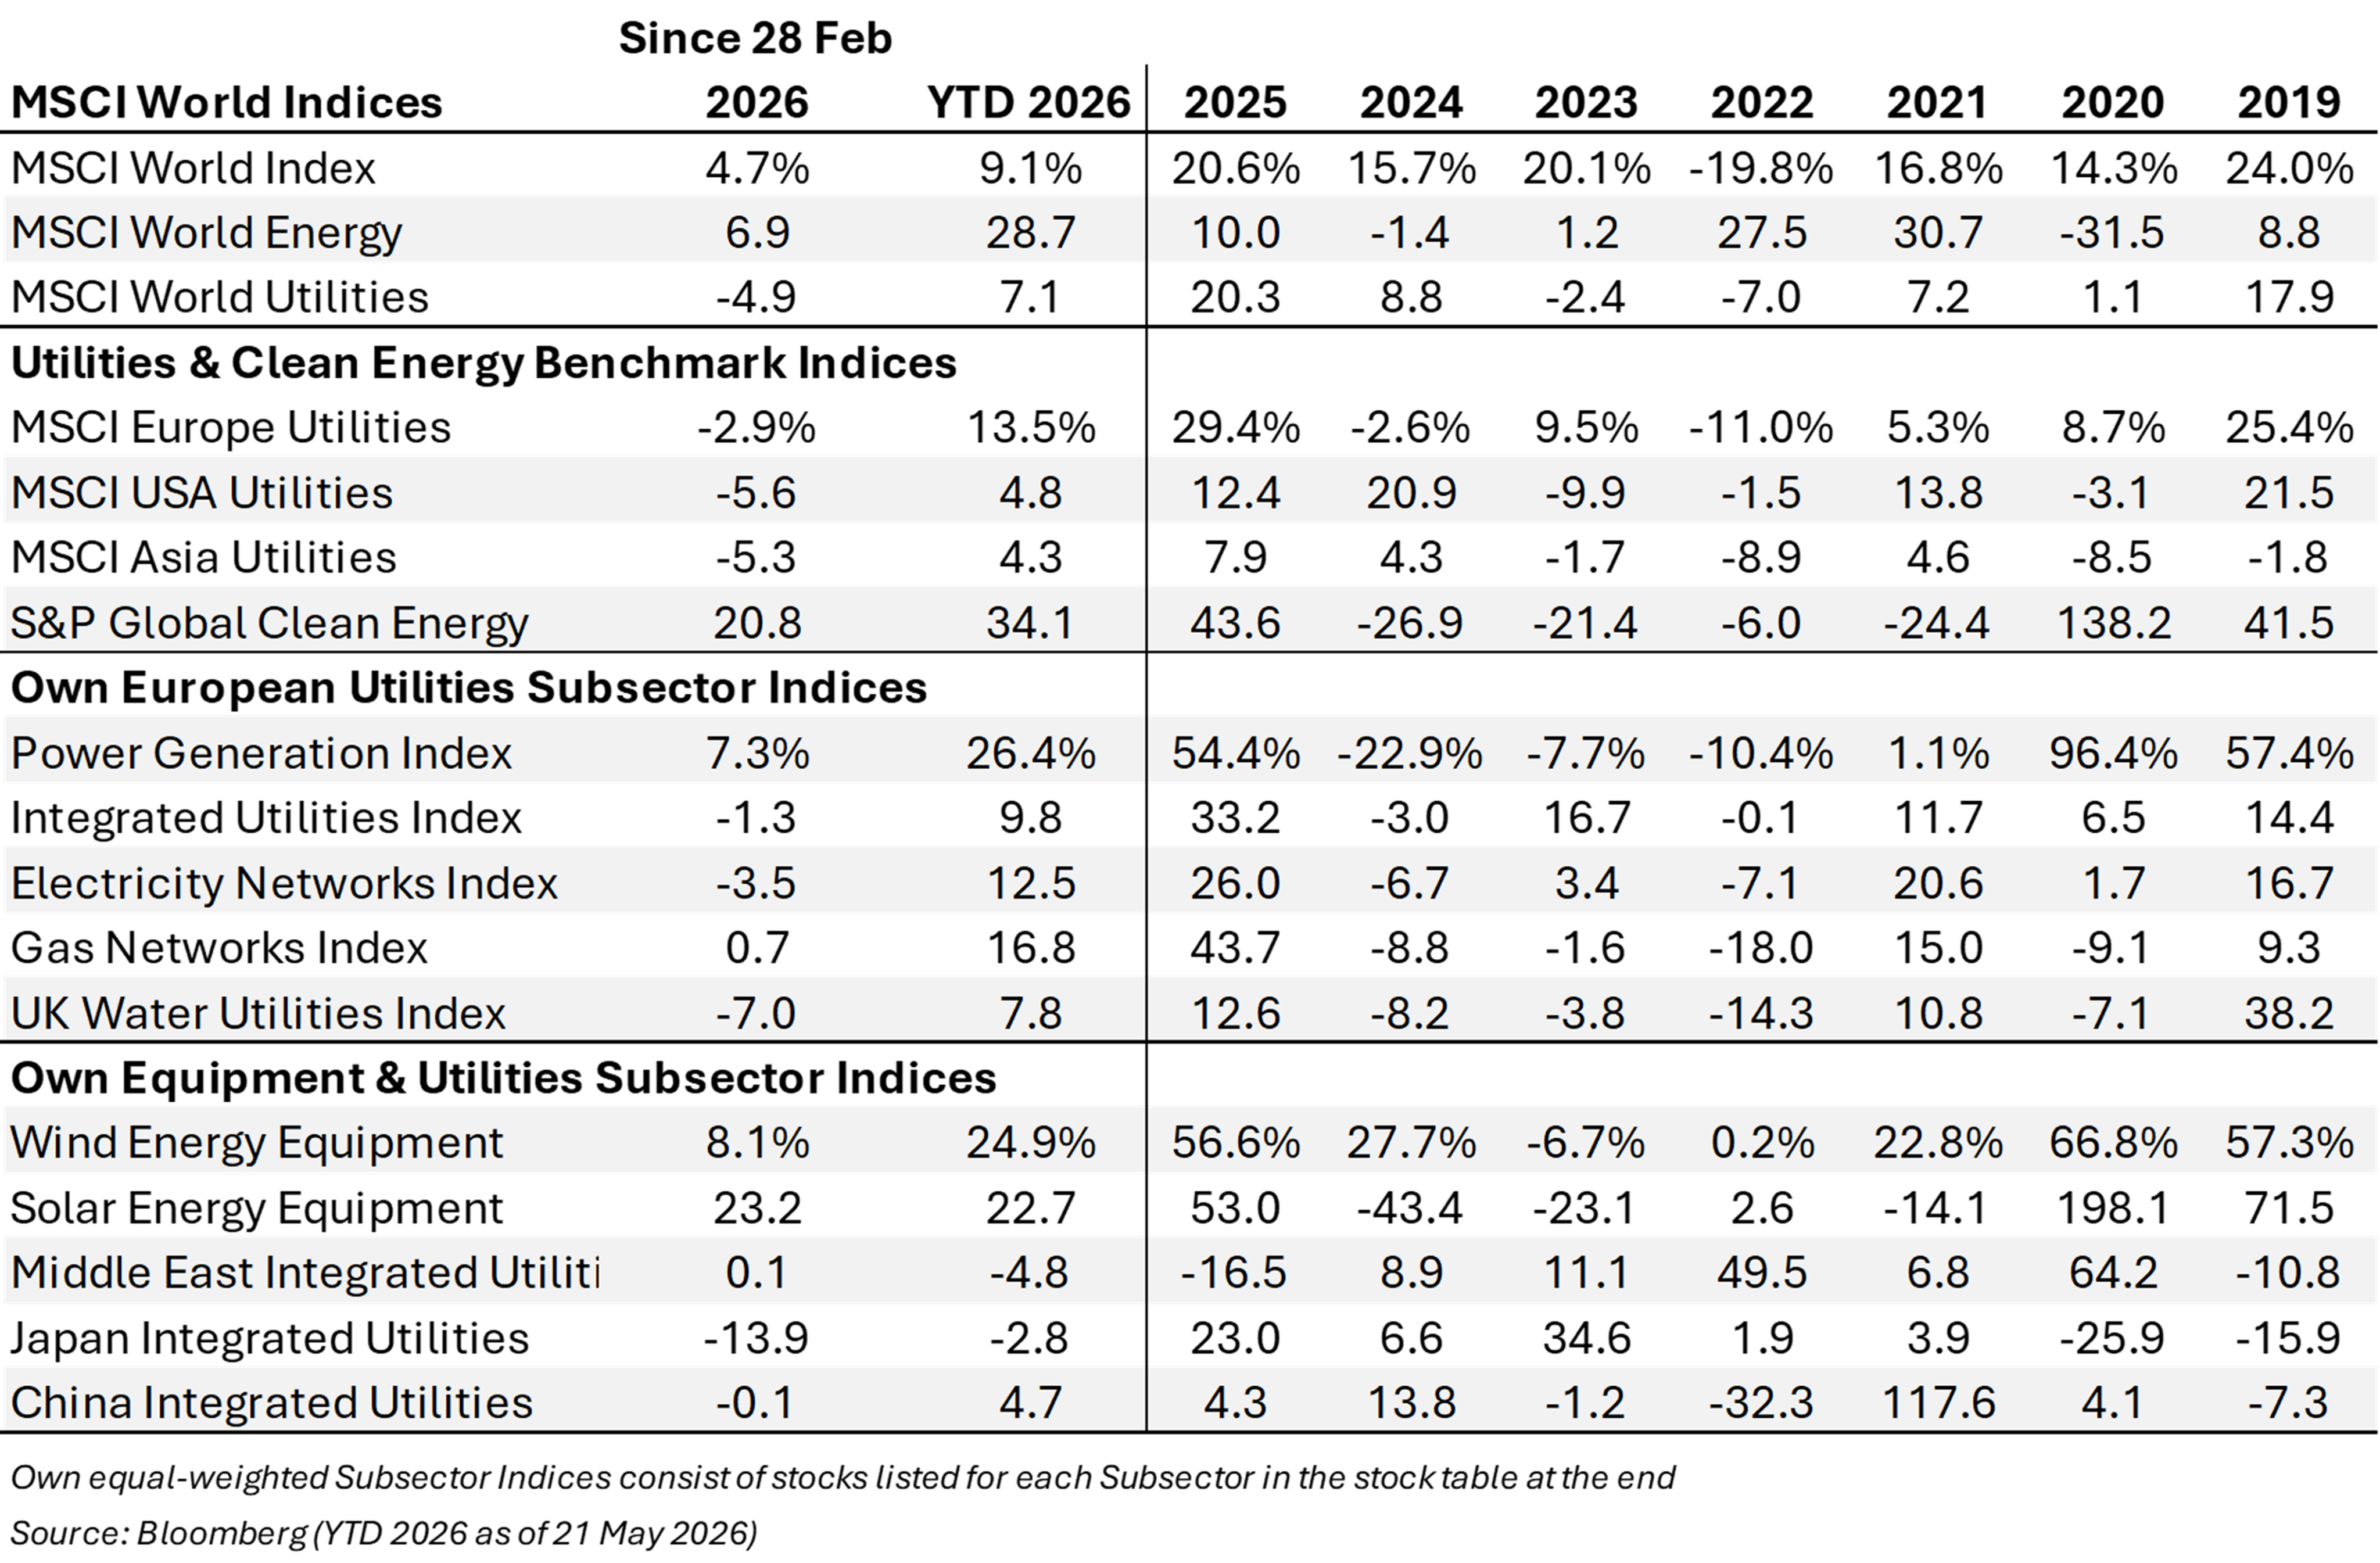
Meanwhile, the S&P Global Clean Energy index extended April’s rally into May, gaining so far more than 6% and outperforming the broader market. YTD, the S&P Global Clean Energy index has now even beaten the World Energy index by more than 5%. This strong YTD index performance is mirrored by robust gains in our equal-weighted “Wind Energy” and “Solar Energy” – Equipment subsector indices, which, as custom indices, include many of the S&P Global Clean Energy constituents. It is important to note that this strong share price performance of wind and solar equipment stocks occurred despite the recent increase in interest rates since the start of the Iran conflict, while previous rate increases in 2021 and 2023 had triggered heavy share price losses for highly leveraged clean energy equipment companies (and for the S&P Global Clean Energy index) in 2023 and 2024 (see Table 1). Apparently, wind & solar equipment companies have become more resilient to a higher interest rate environment.
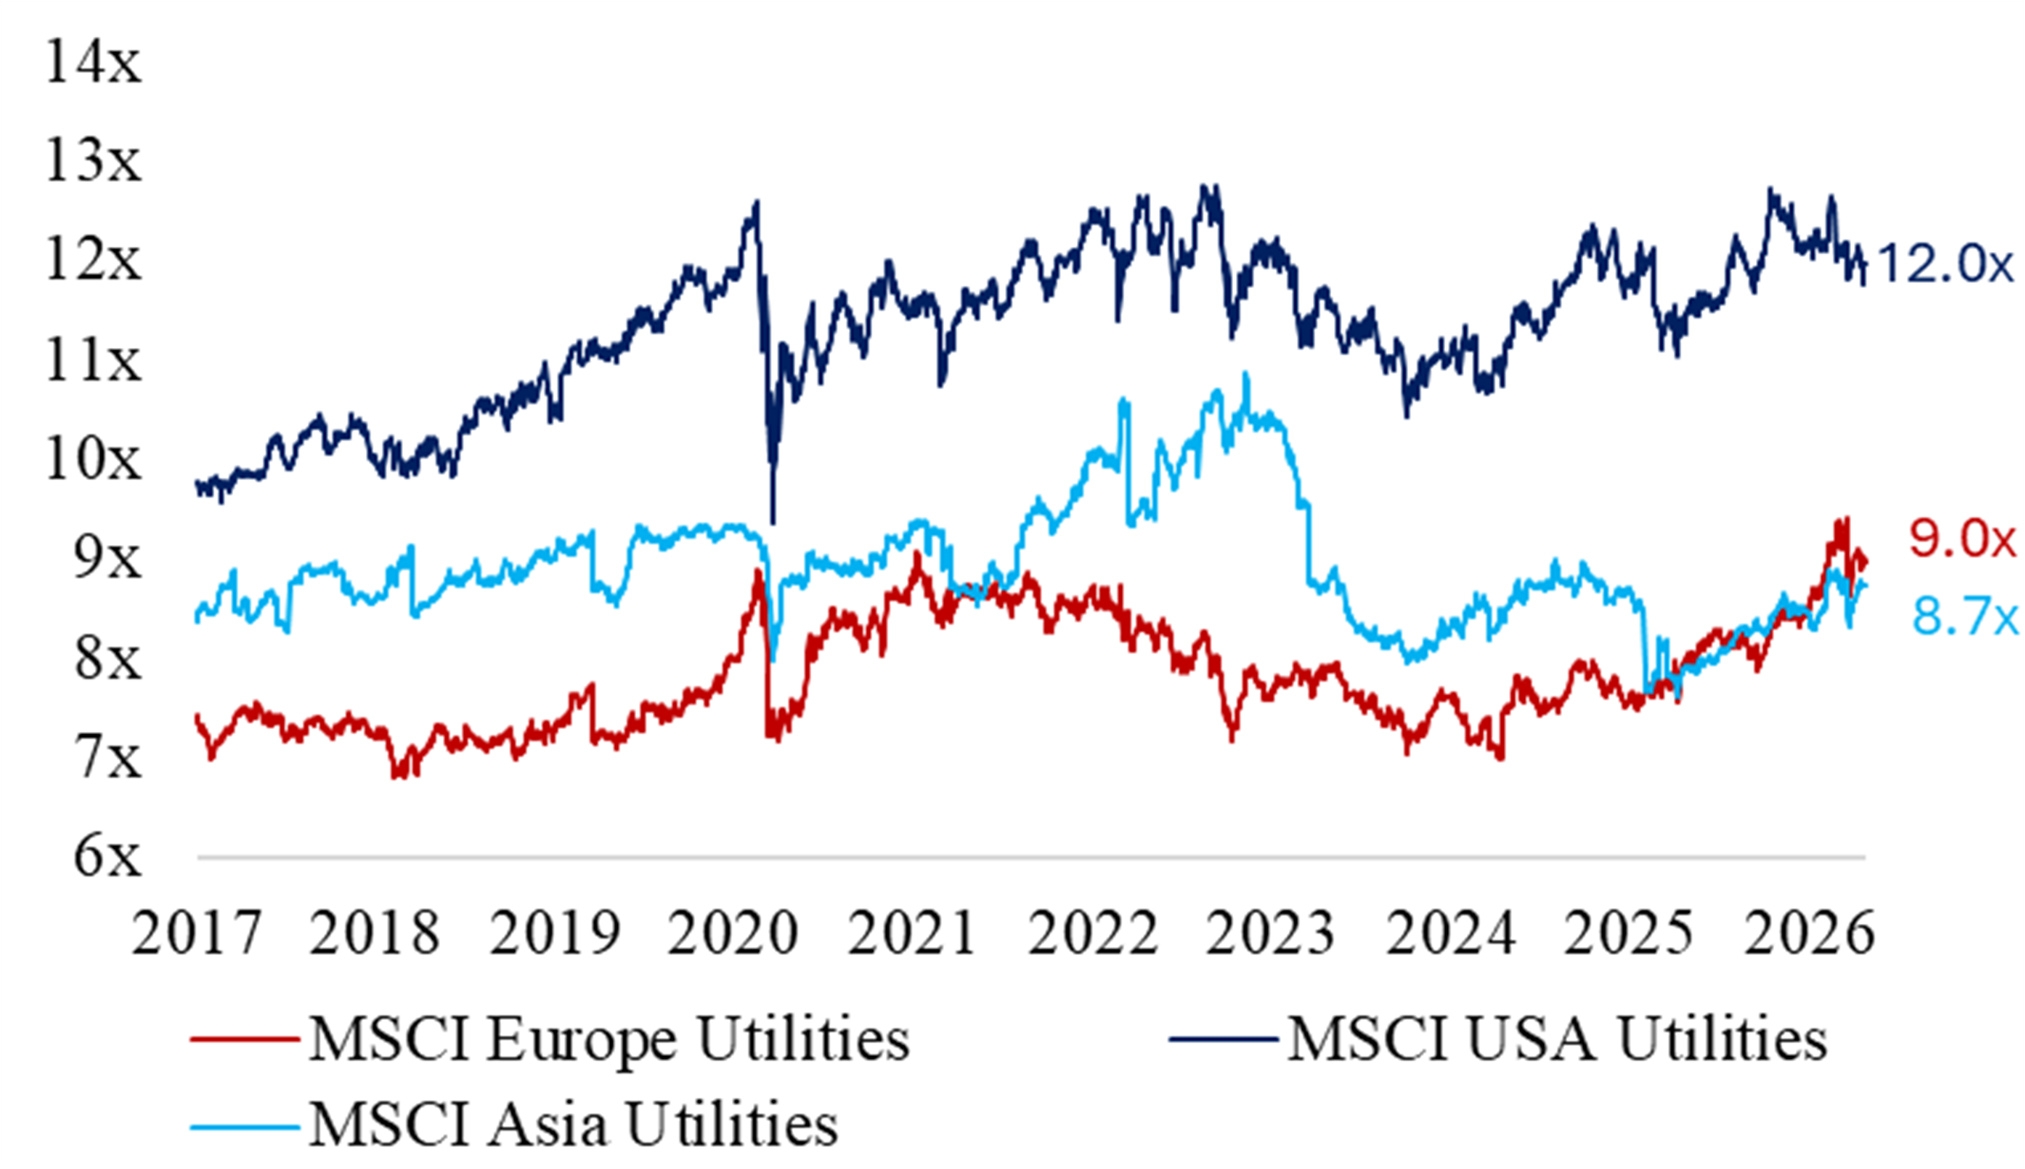
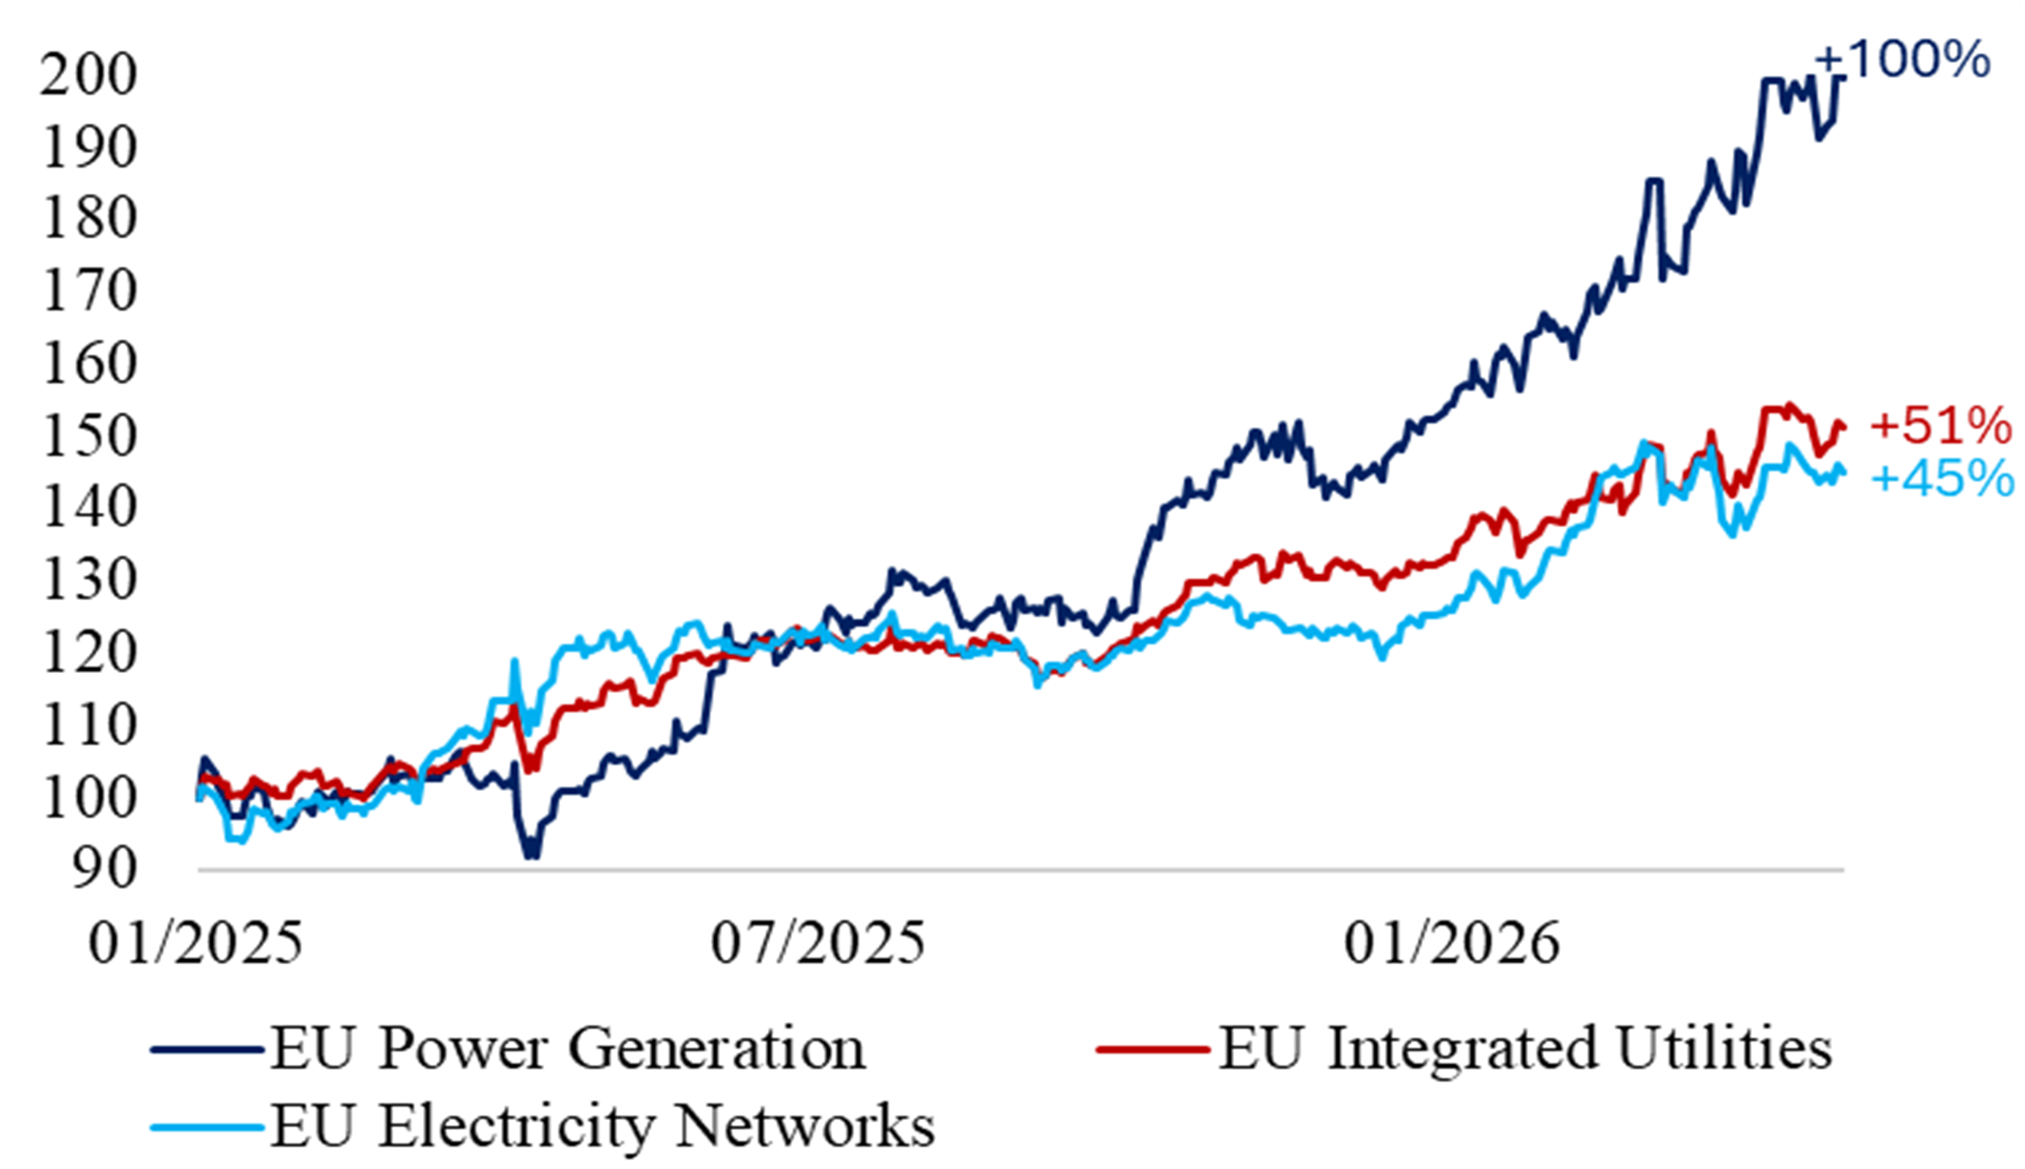
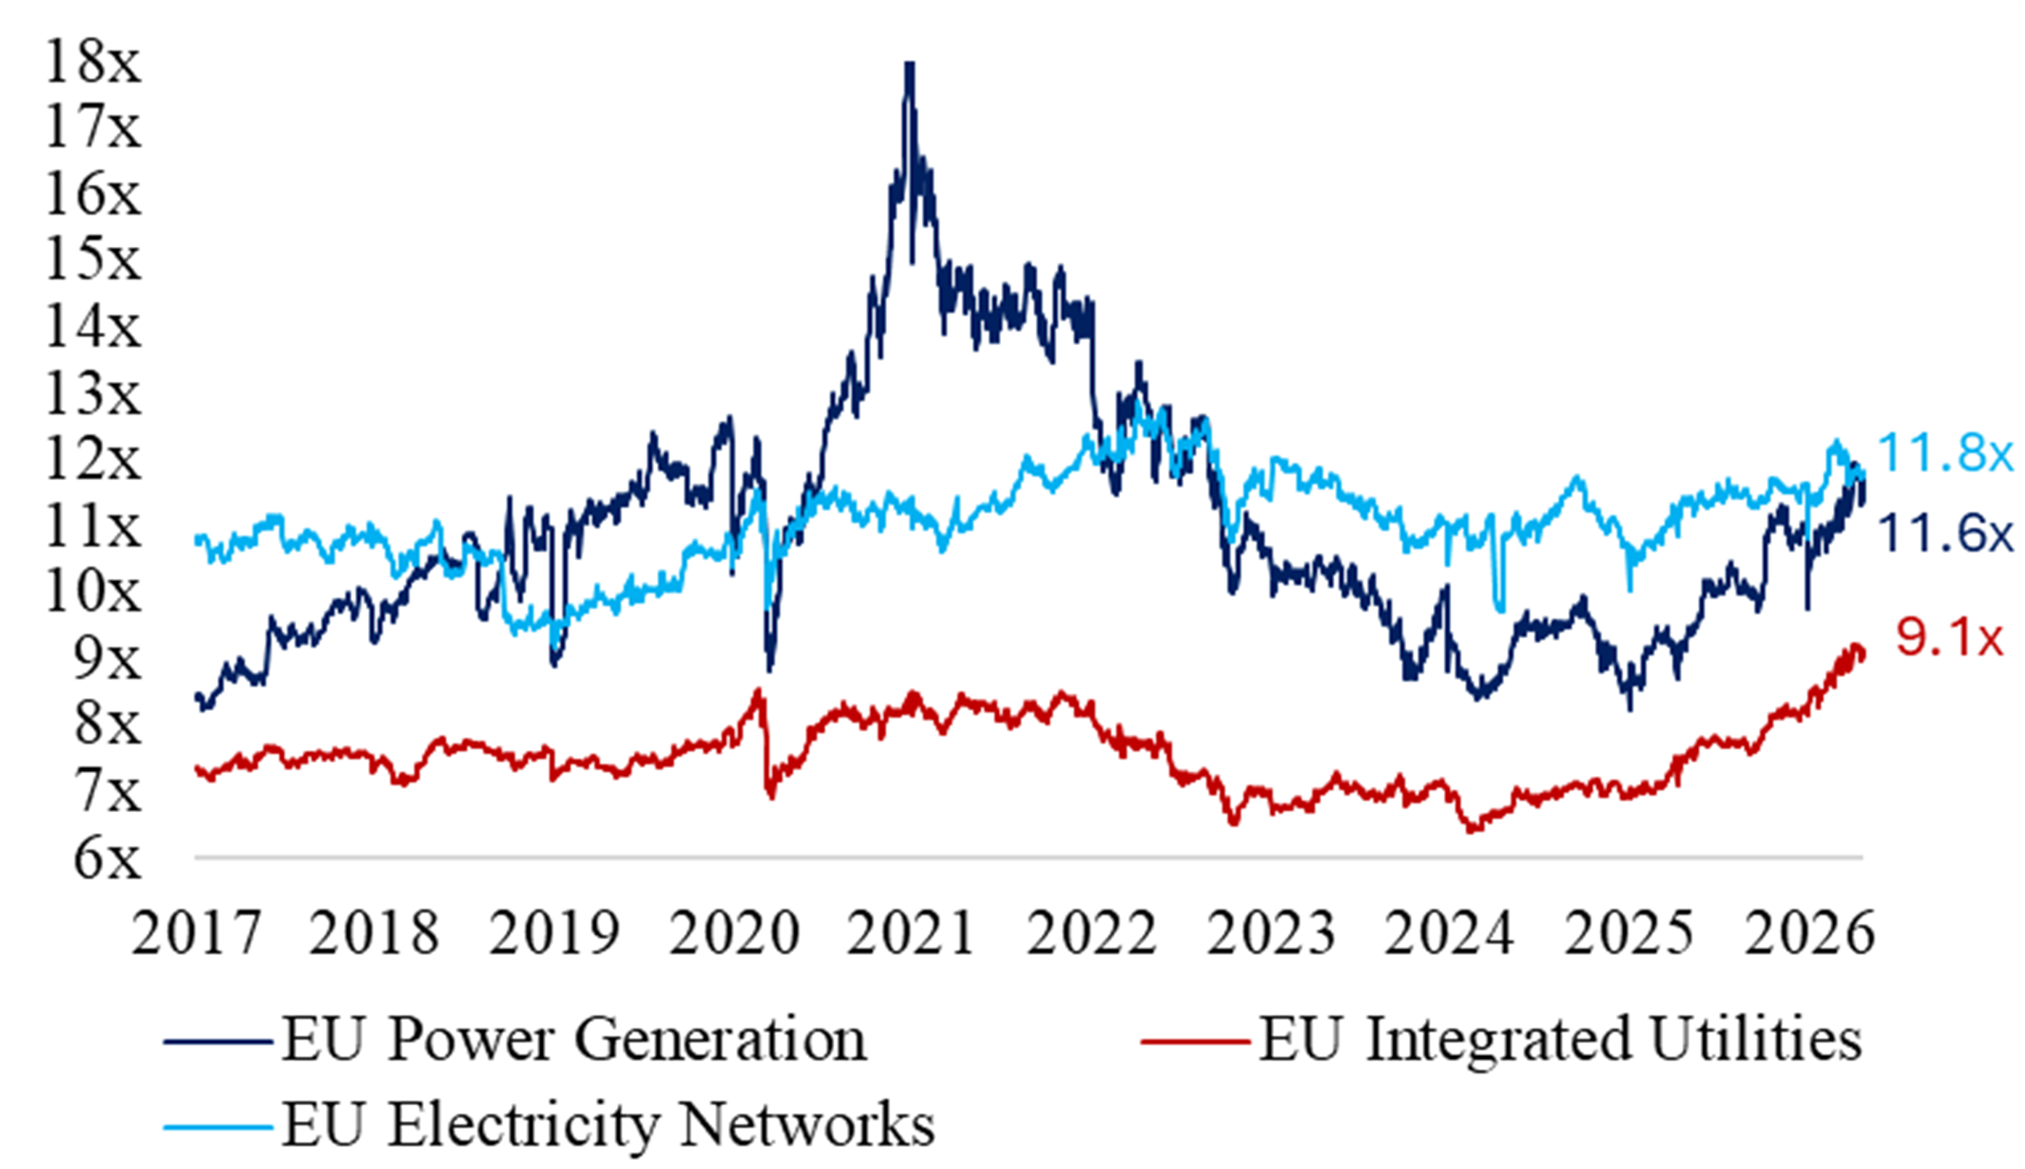
Exhibit 1 Short-Term PERFORMANCE Exhibit 2 Long-Term VALUATION
(rebased since 2025) (1-yr Forward EV/EBITDA since 2017)
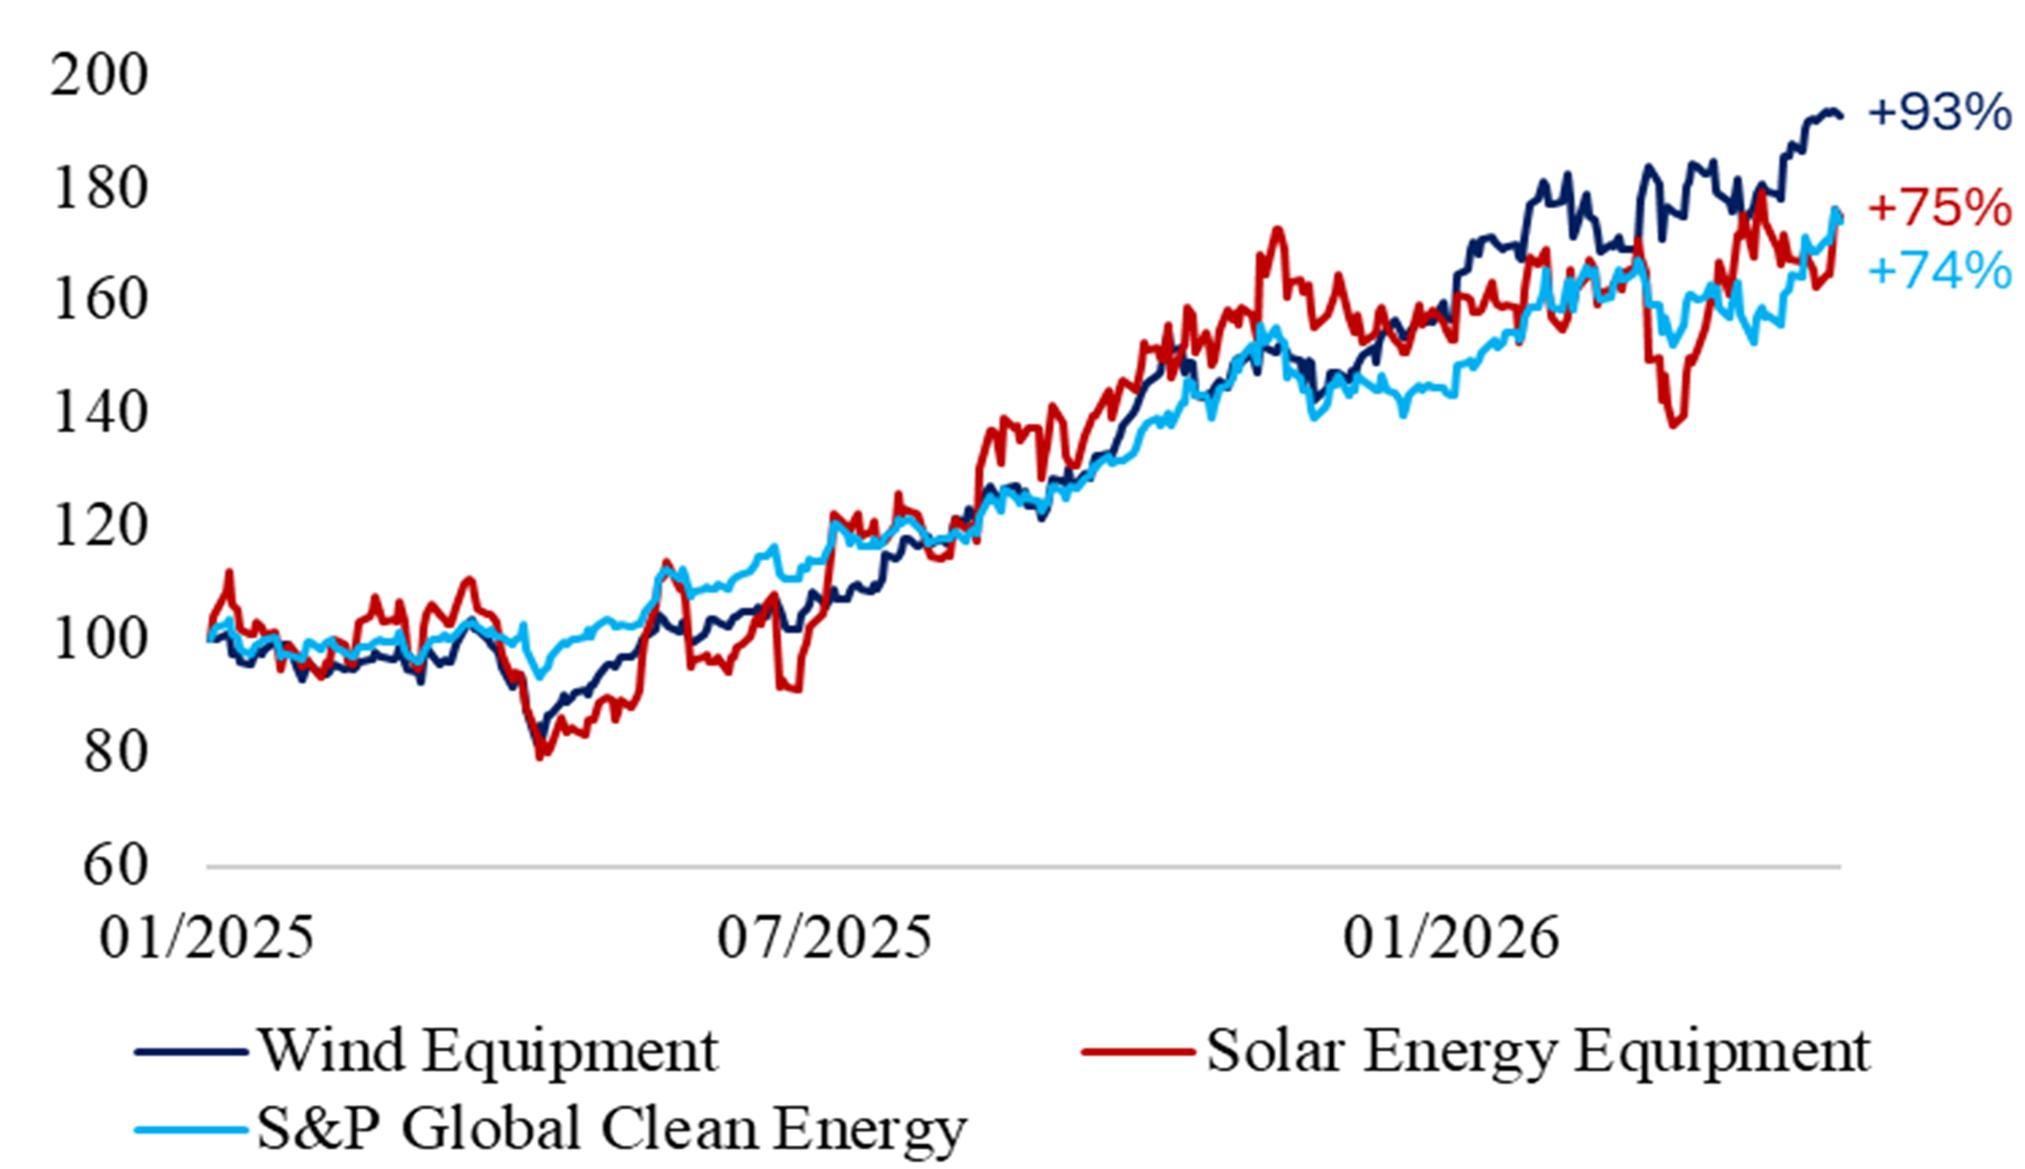
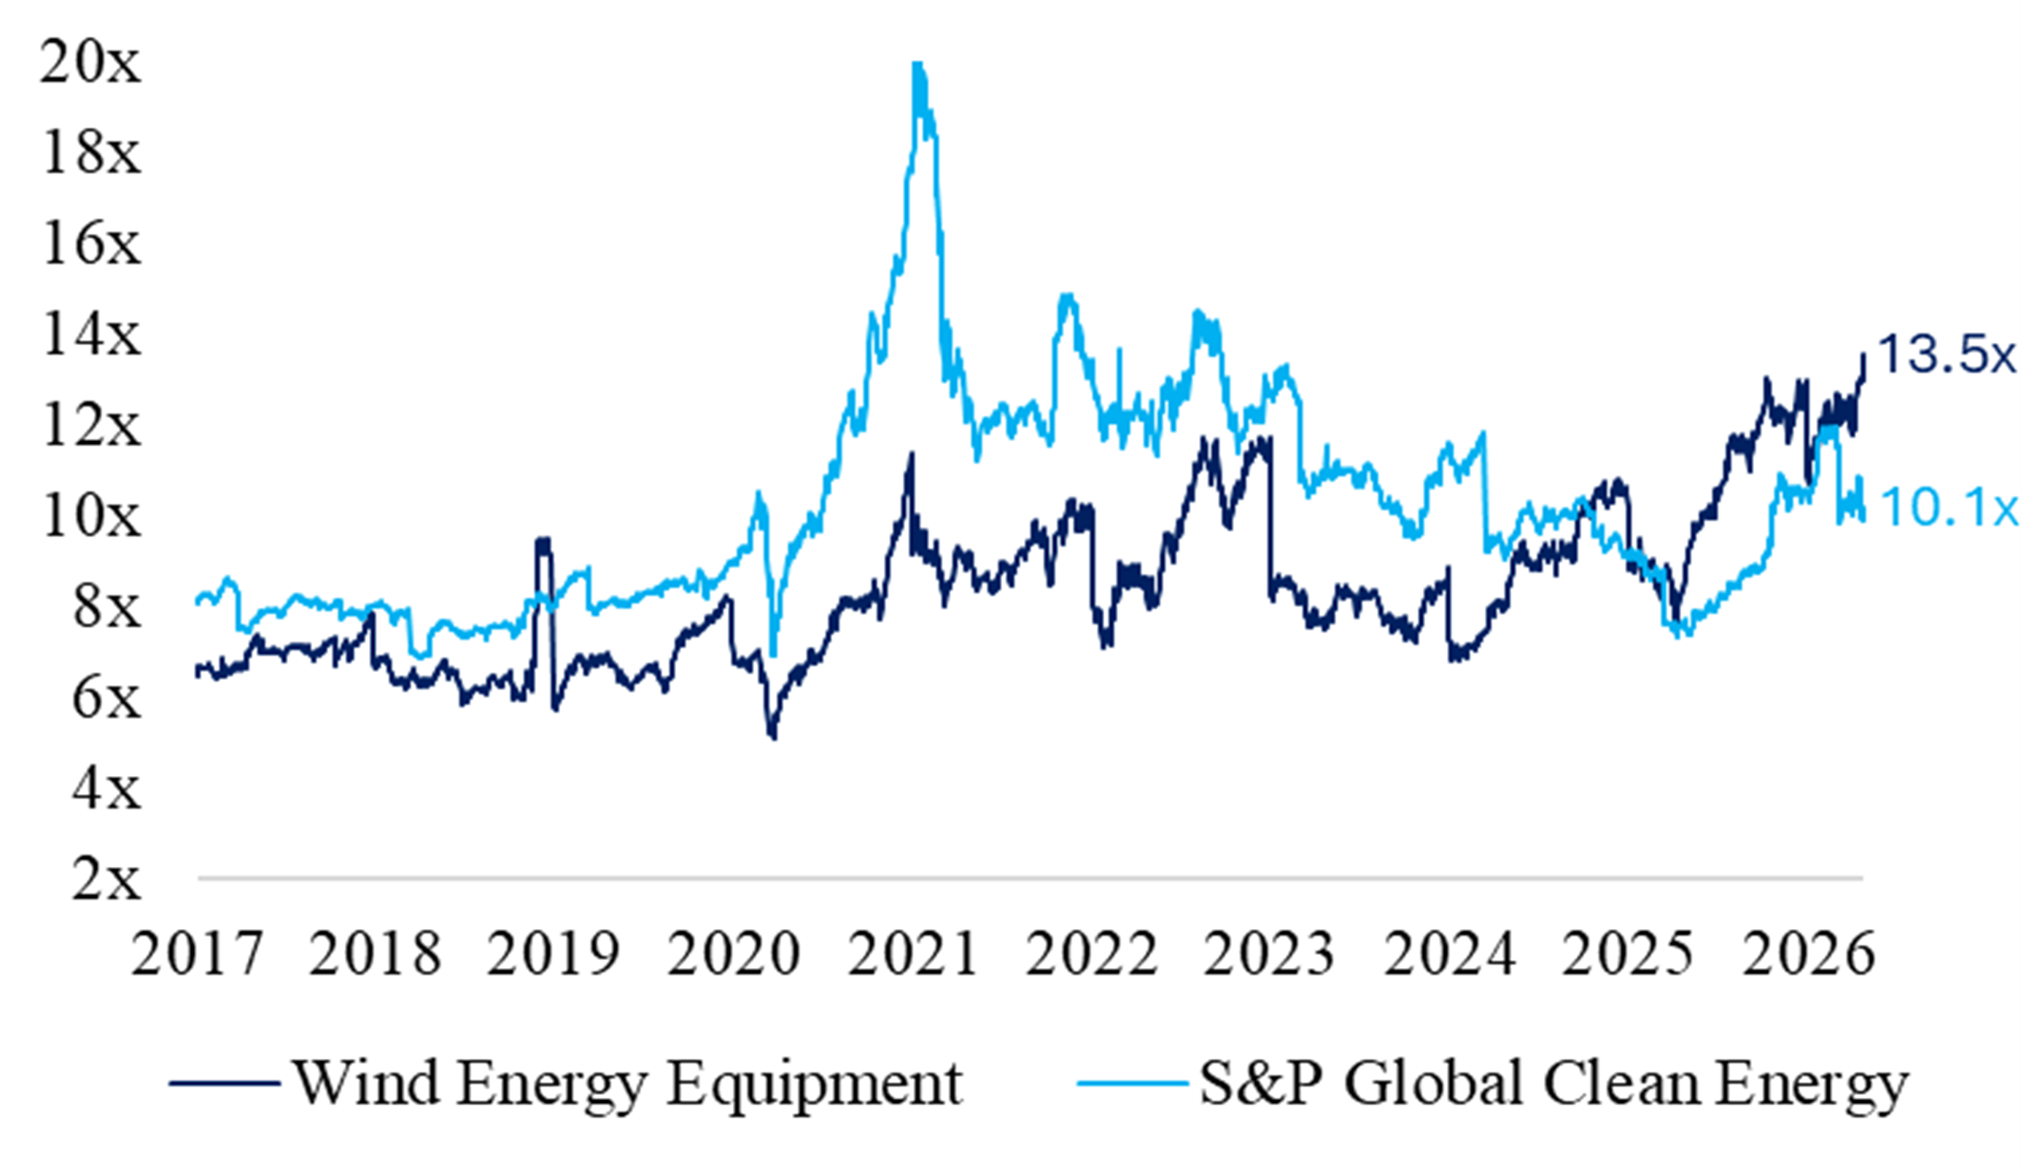
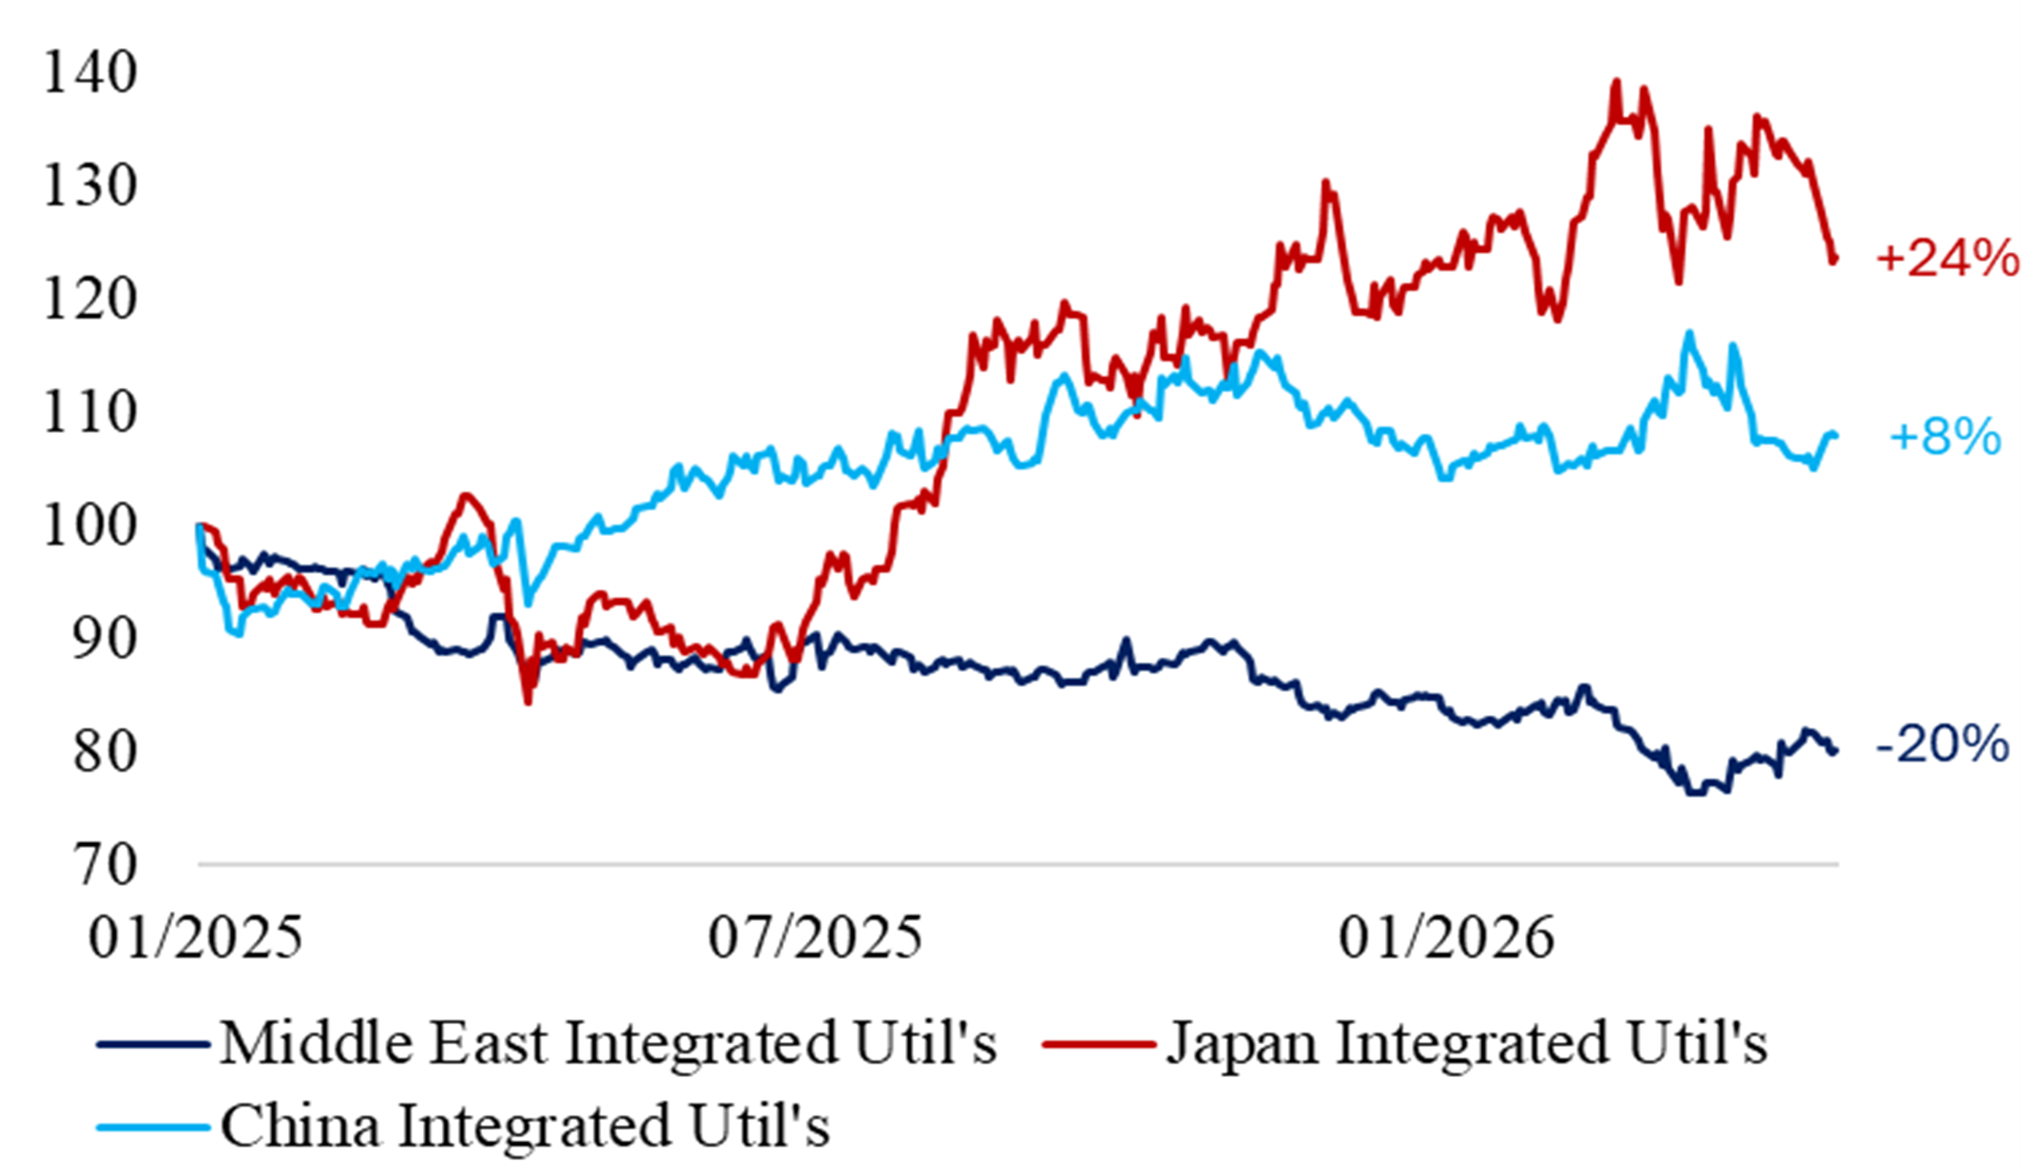
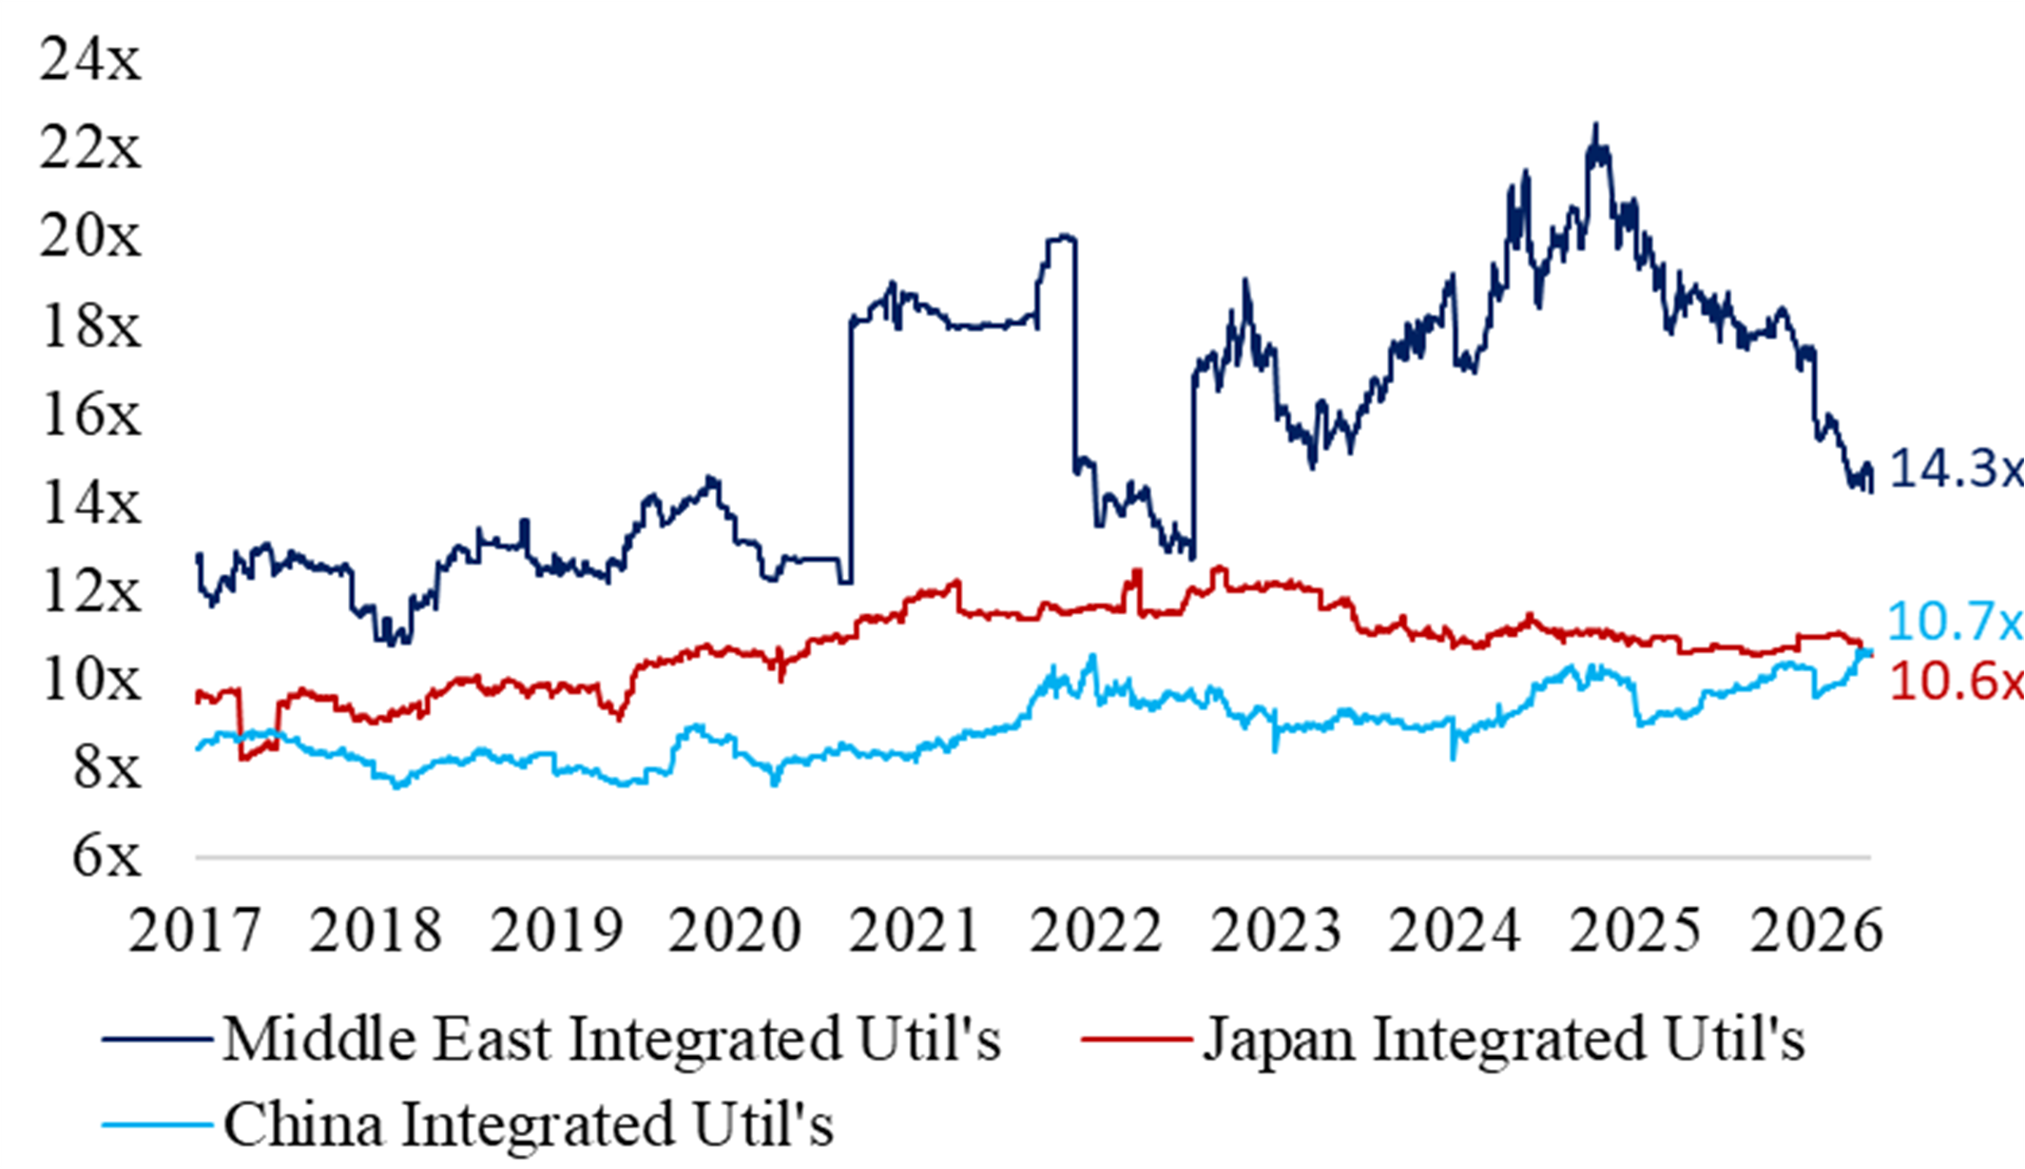
Source: Bloomberg (Prices as of 21 Mayl 2026) Source: Bloomberg (Valuations as of 21 Mayl 2026)
Monthly Focus: European Utilities 1Q Earnings Wrap
1Q 2026 results: Most met or beat expectations, several raised the guidance
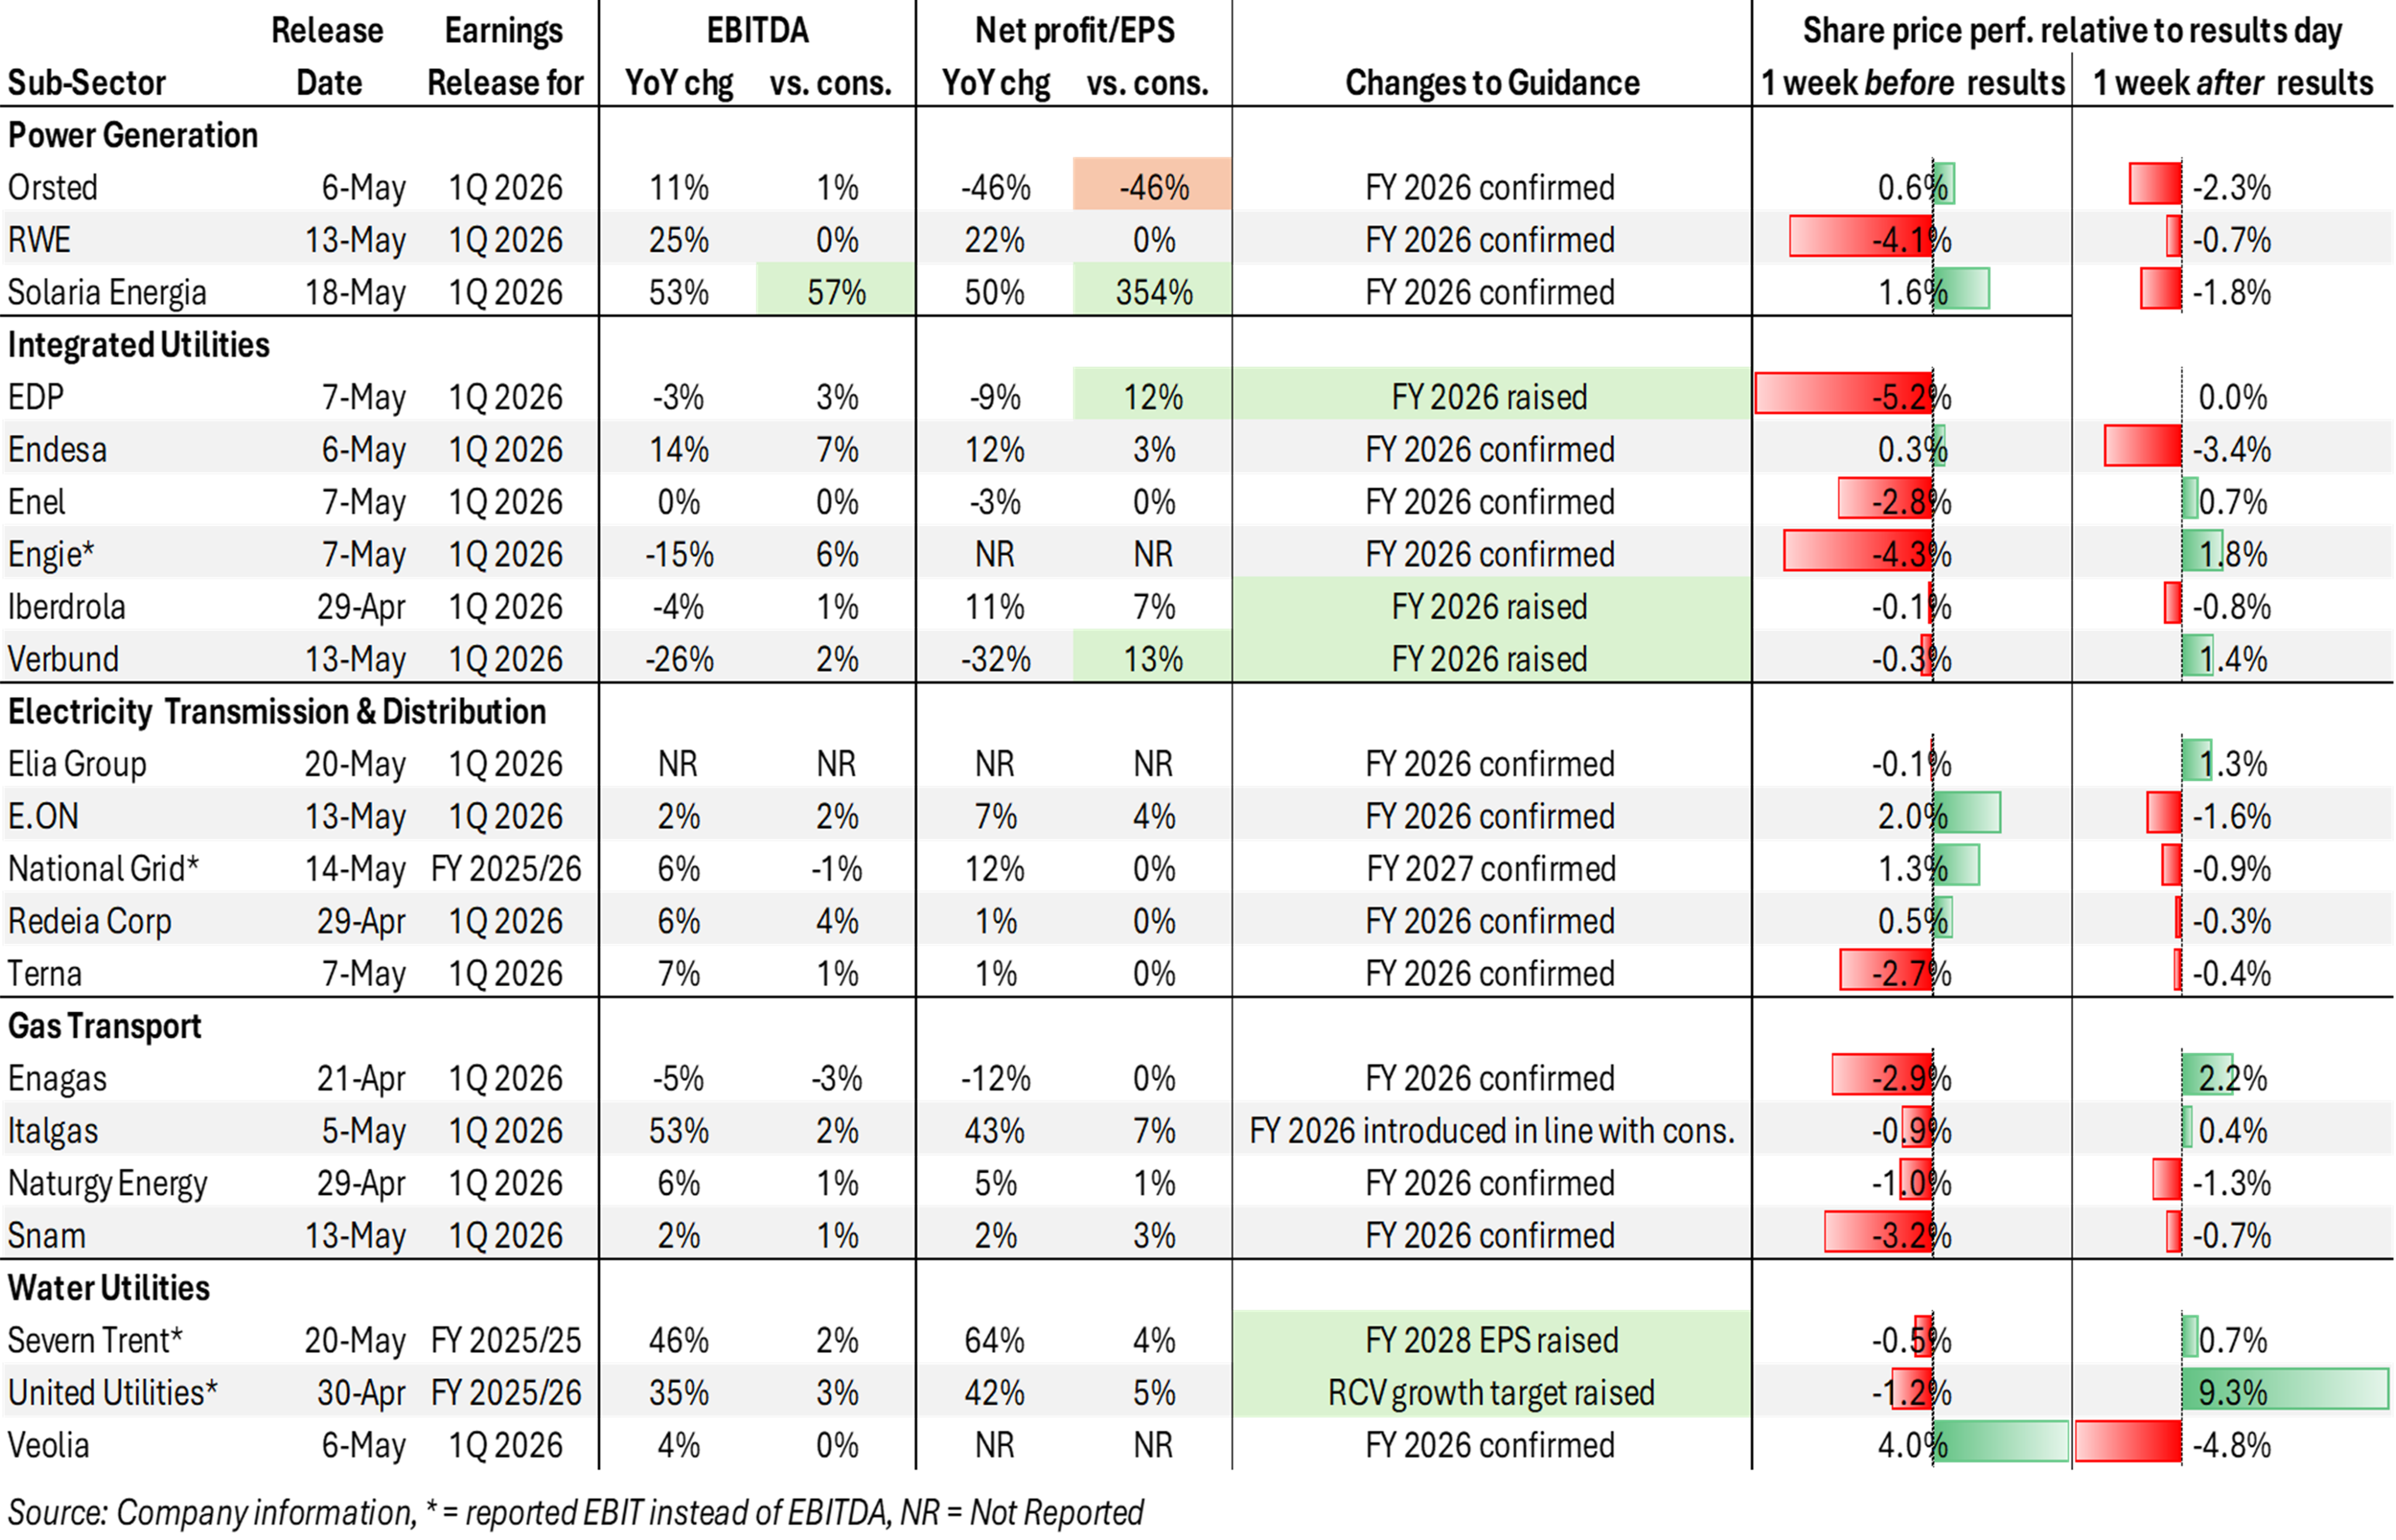
Despite increasing volatility in European gas and power prices in the final month of 1Q 2026 following the start of the military conflict in Iran, European utilities reported solid 1Q results and avoided negative earnings surprises (see Exhibit 1). Almost all companies met or beat consensus expectations at the operating profit level (EBITDA or EBIT) and at the net profit or EPS level. The only negative exception was Orsted, which missed net profit expectations by a wide margin due to a DKK 1.4 billion impairment charge related to its US offshore wind projects. Conversely, Solaria reported 1Q 2026 results significantly above expectations due to a battery storage-related capital gain. Similarly, EDP and Verbund also beat net profit expectations by a wide margin.
Similarly, there were no signs that European utilities are falling behind their business plans or that there is any risk of earnings downgrades later in the year, as all companies confirmed or even raised full year financial guidance for FY 2026 and beyond (which they had previously released with their 4Q results in February/March). Along with its FY 2025/26 results, United Utilities raised its medium-term investment guidance based on a better-than-anticipated outcome of the regulatory review from the UK Water Services Authority, which should lead to a 10% CAGR in its Regulatory Capital Value (RCV) until 2030. Similarly, several companies (EDP, Iberdrola, and Verbund) felt confident enough to raise their FY 2026 guidance early in the year, and Severn Trent increased its medium-term EPS guidance for FY 2027/28 (see Exhibit 1).
Exhibit 3: European Utilities – 1Q 2026 results summary
Earnings growth story drives sector outperformance
Thus, solid 1Q 2026 results along with the reiteration of FY 2026 guidance confirmed the projected earnings momentum for 2026 and in the medium-term until 2028. Based on consensus forecasts, the European utilities universe shown in Exhibit 1 is projected to post average EPS growth of 4.5% in FY 2026, increasing to a medium-term EPS CAGR of 7.8% until FY 2028. Among the utilities subsectors shown in Exhibit 1, “Power Generation” companies are projected to achieve the strongest average EPS CAGR of 27% through FY 2028, followed by “Water Utilities” with an average EPS CAGR of 8%.
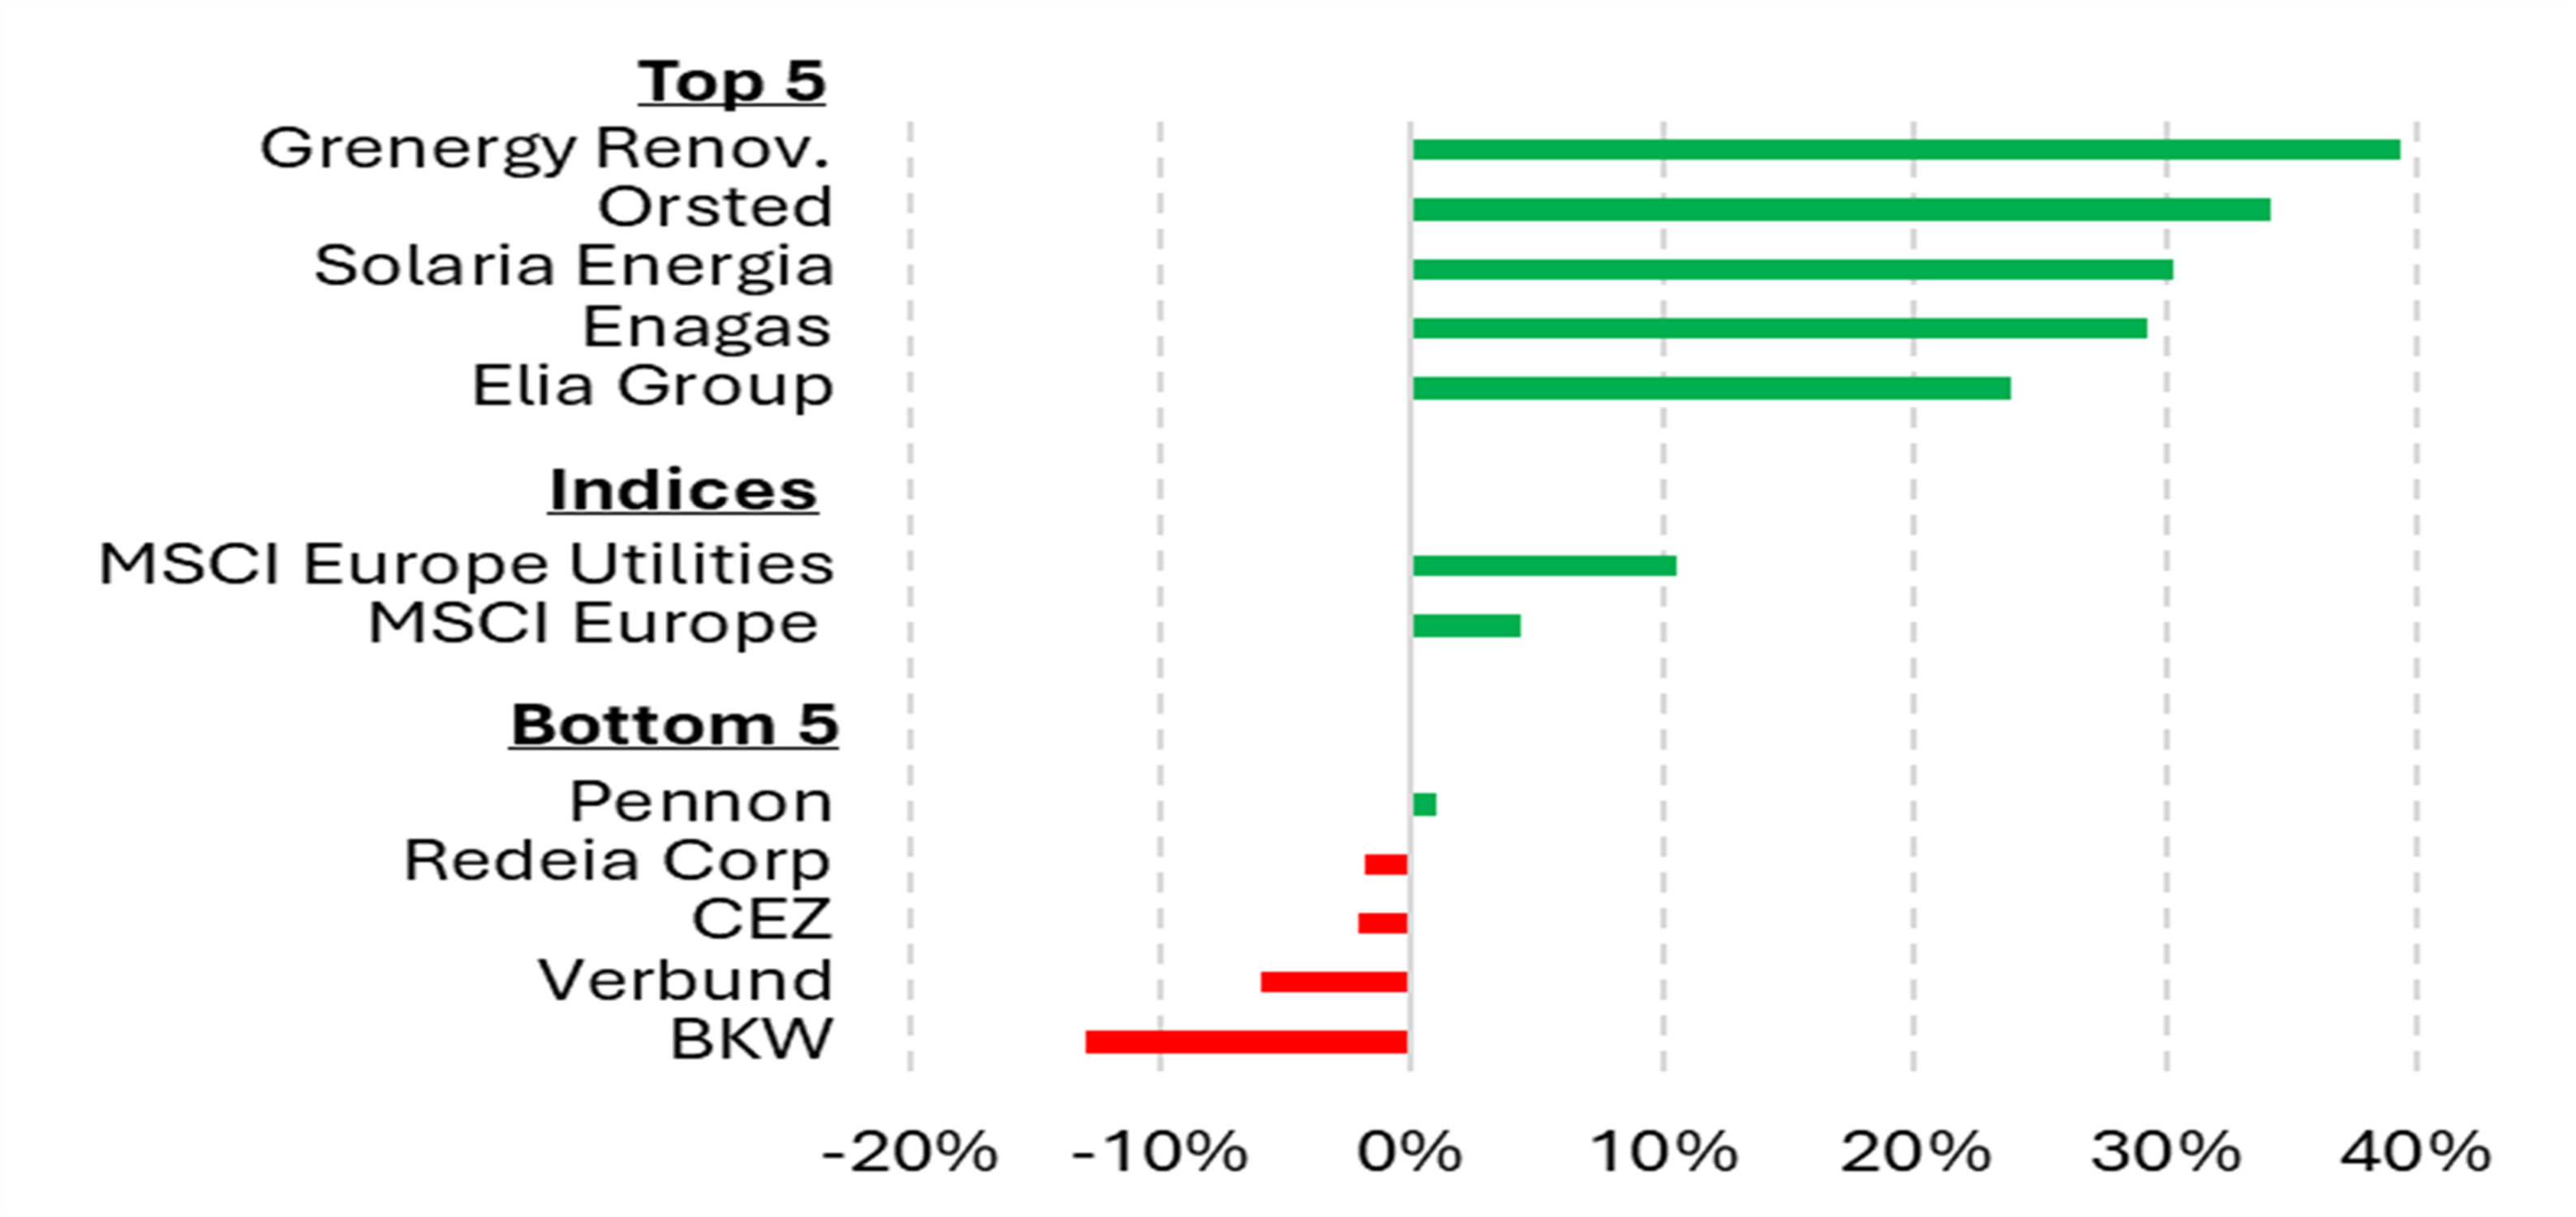
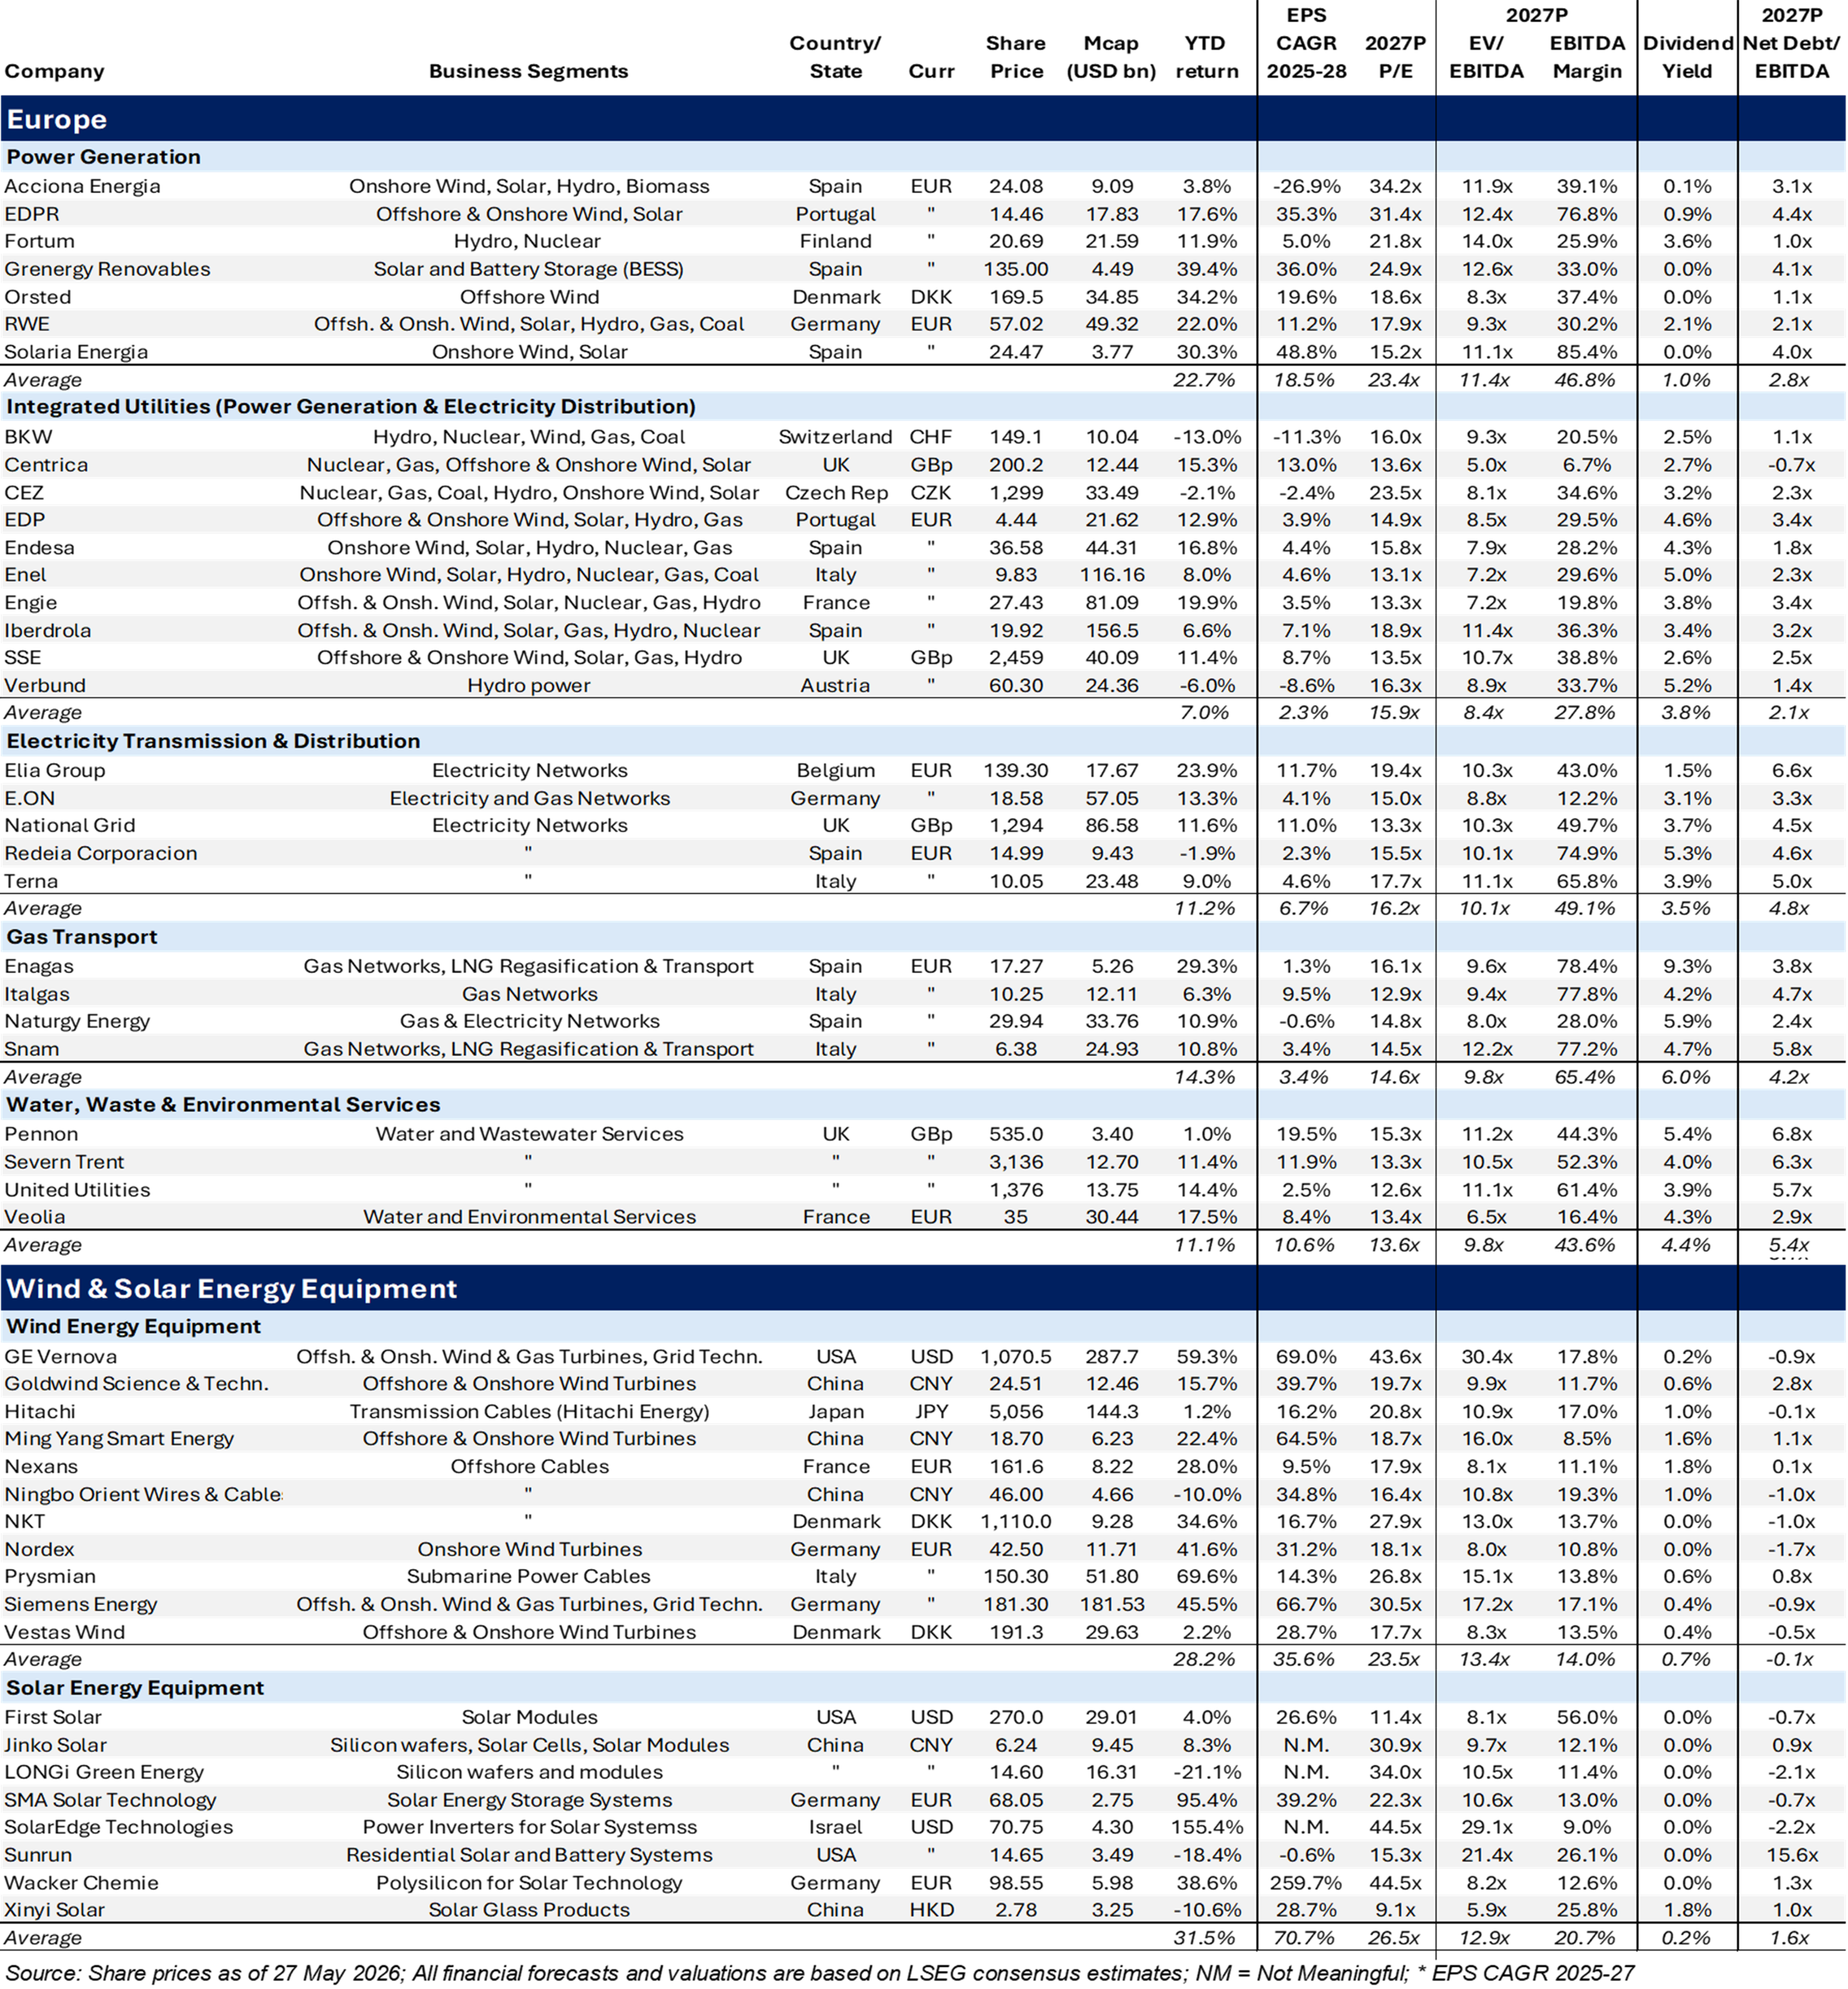
While share price performances in the week following 1Q 2026 results reports were mostly muted (except for United Utilities, which posted a stronger share price gain, and Veolia, Endesa, and Orsted, which all saw slightly larger share price declines), the YTD performance of European utilities remains strong. YTD in 2026, the MSCI Europe Utilities index gained 10.5% and outperformed the broader MSCI Europe benchmark index by 6% as of 27 May 2026. Exhibit 4 highlights the five top- and worst-performing stocks from the European utilities universe shown in Table 4 (stock table at the end of the report):
Exhibit 4: YTD 2026 European share price performance – Top 5 vs. Bottom 5
Source: LSEG (YTD as of 27 May 2026)
No immediate impact from Middle East conflict
Engie and Veolia, which both have direct exposure to the Middle East, emphasized that operations on the ground have not been affected by the military conflict. However, the indirect impact on the entire European utilities sector comes from rising gas prices in Europe, which directly translate into higher European electricity prices (as gas-fired generation is the marginal power producer with the highest marginal generation costs, supplying the last MWh of electricity to clear the market). European utilities have not benefited from the increase in European gas (and power) prices, as many power generators have hedged their power price exposure in the forward market. In addition, several countries have extended windfall taxes to cap gas prices and continued to discuss de-linking power and gas prices. Finally, higher interest rates from rising inflation expectations remain a headwind for the sector. As a result, since the start of the Iran conflict at the end of February, the MSCI Europe Utilities index has declined and ceased outperforming the broader market (see Table 1).
No near-term benefit of rising electricity demand from AI and data centers
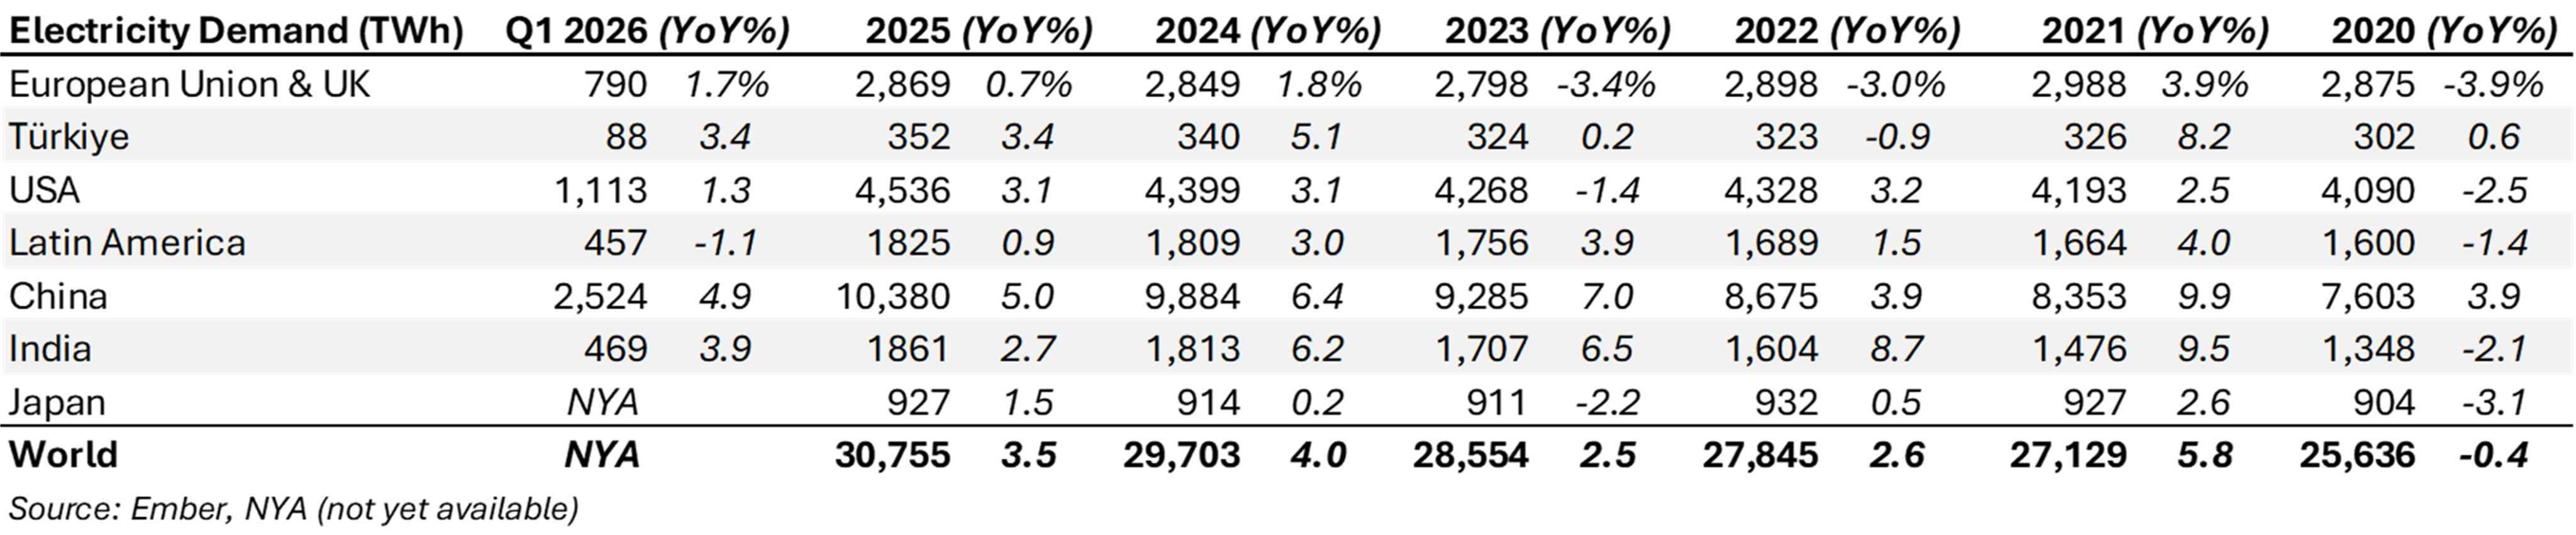
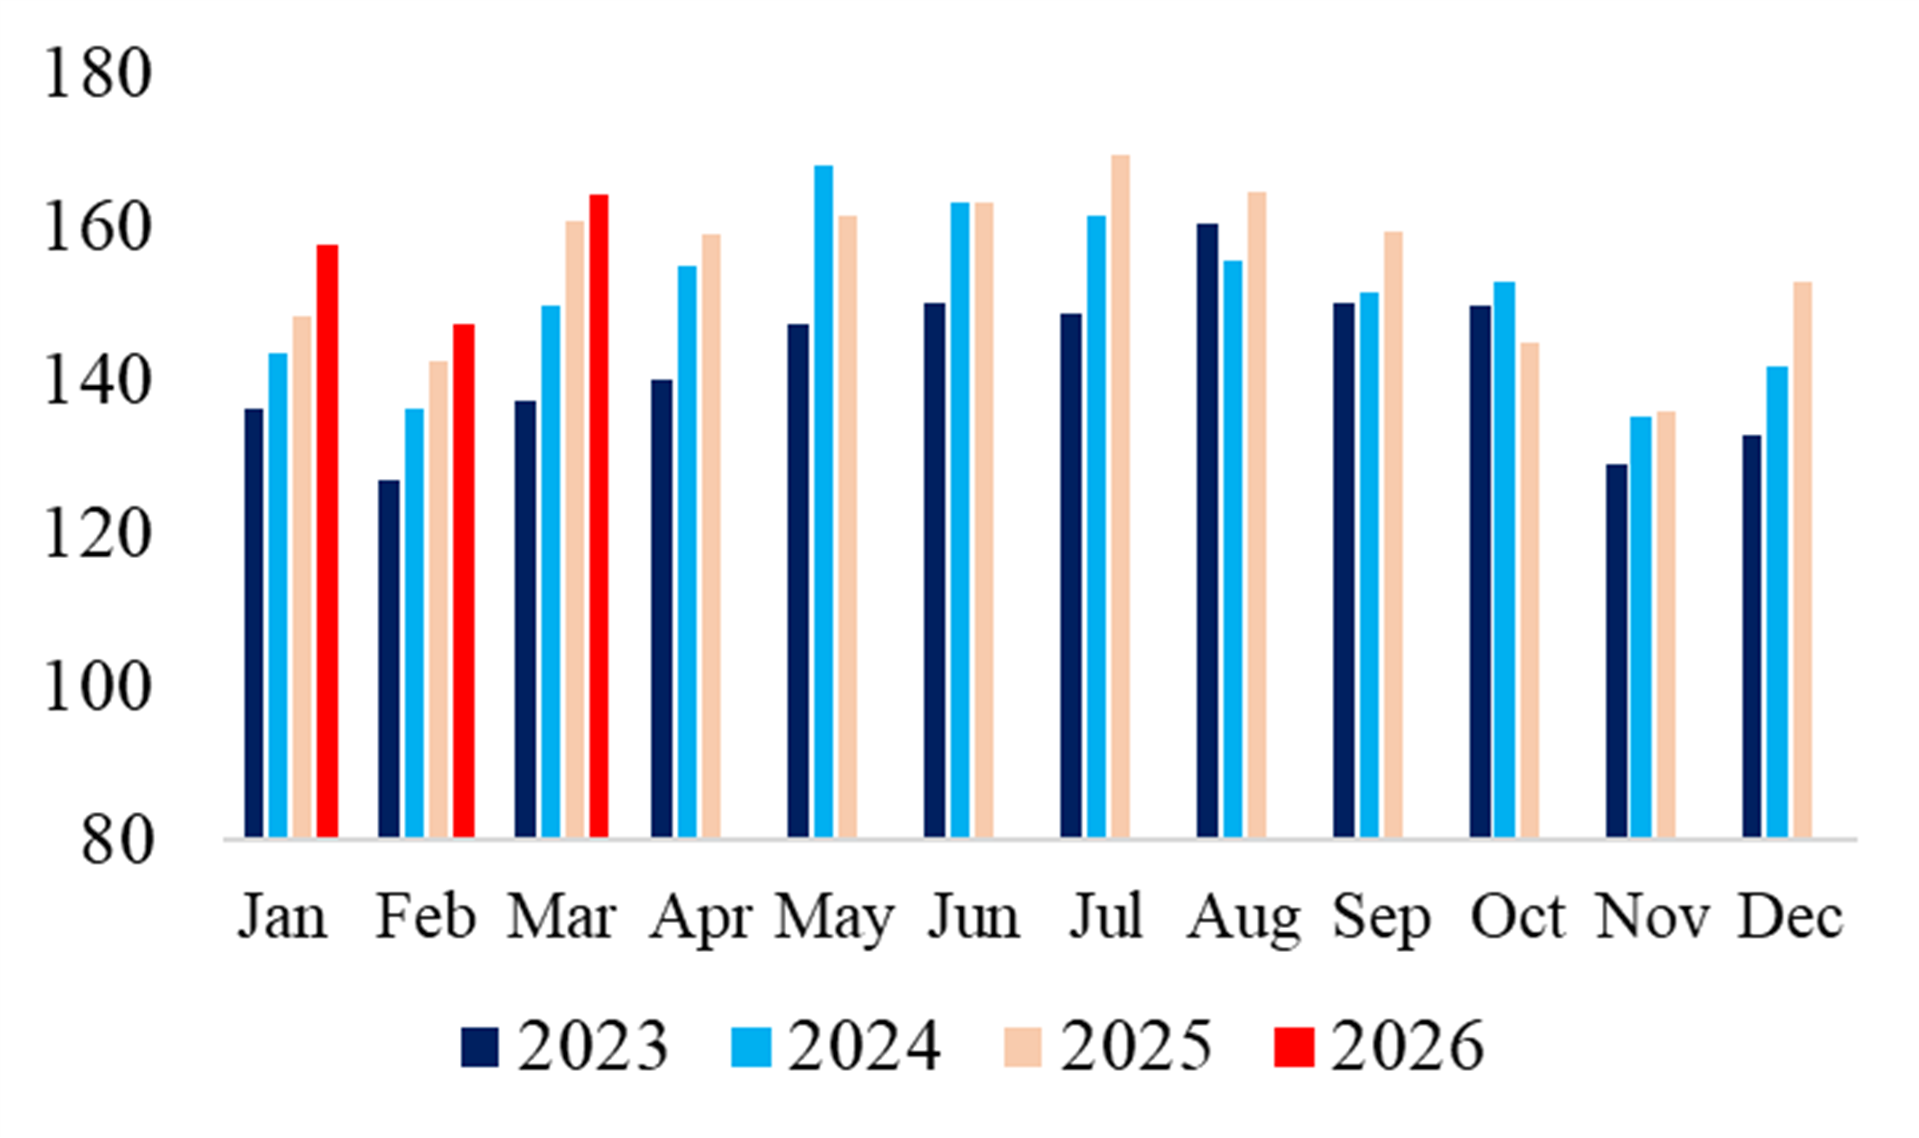
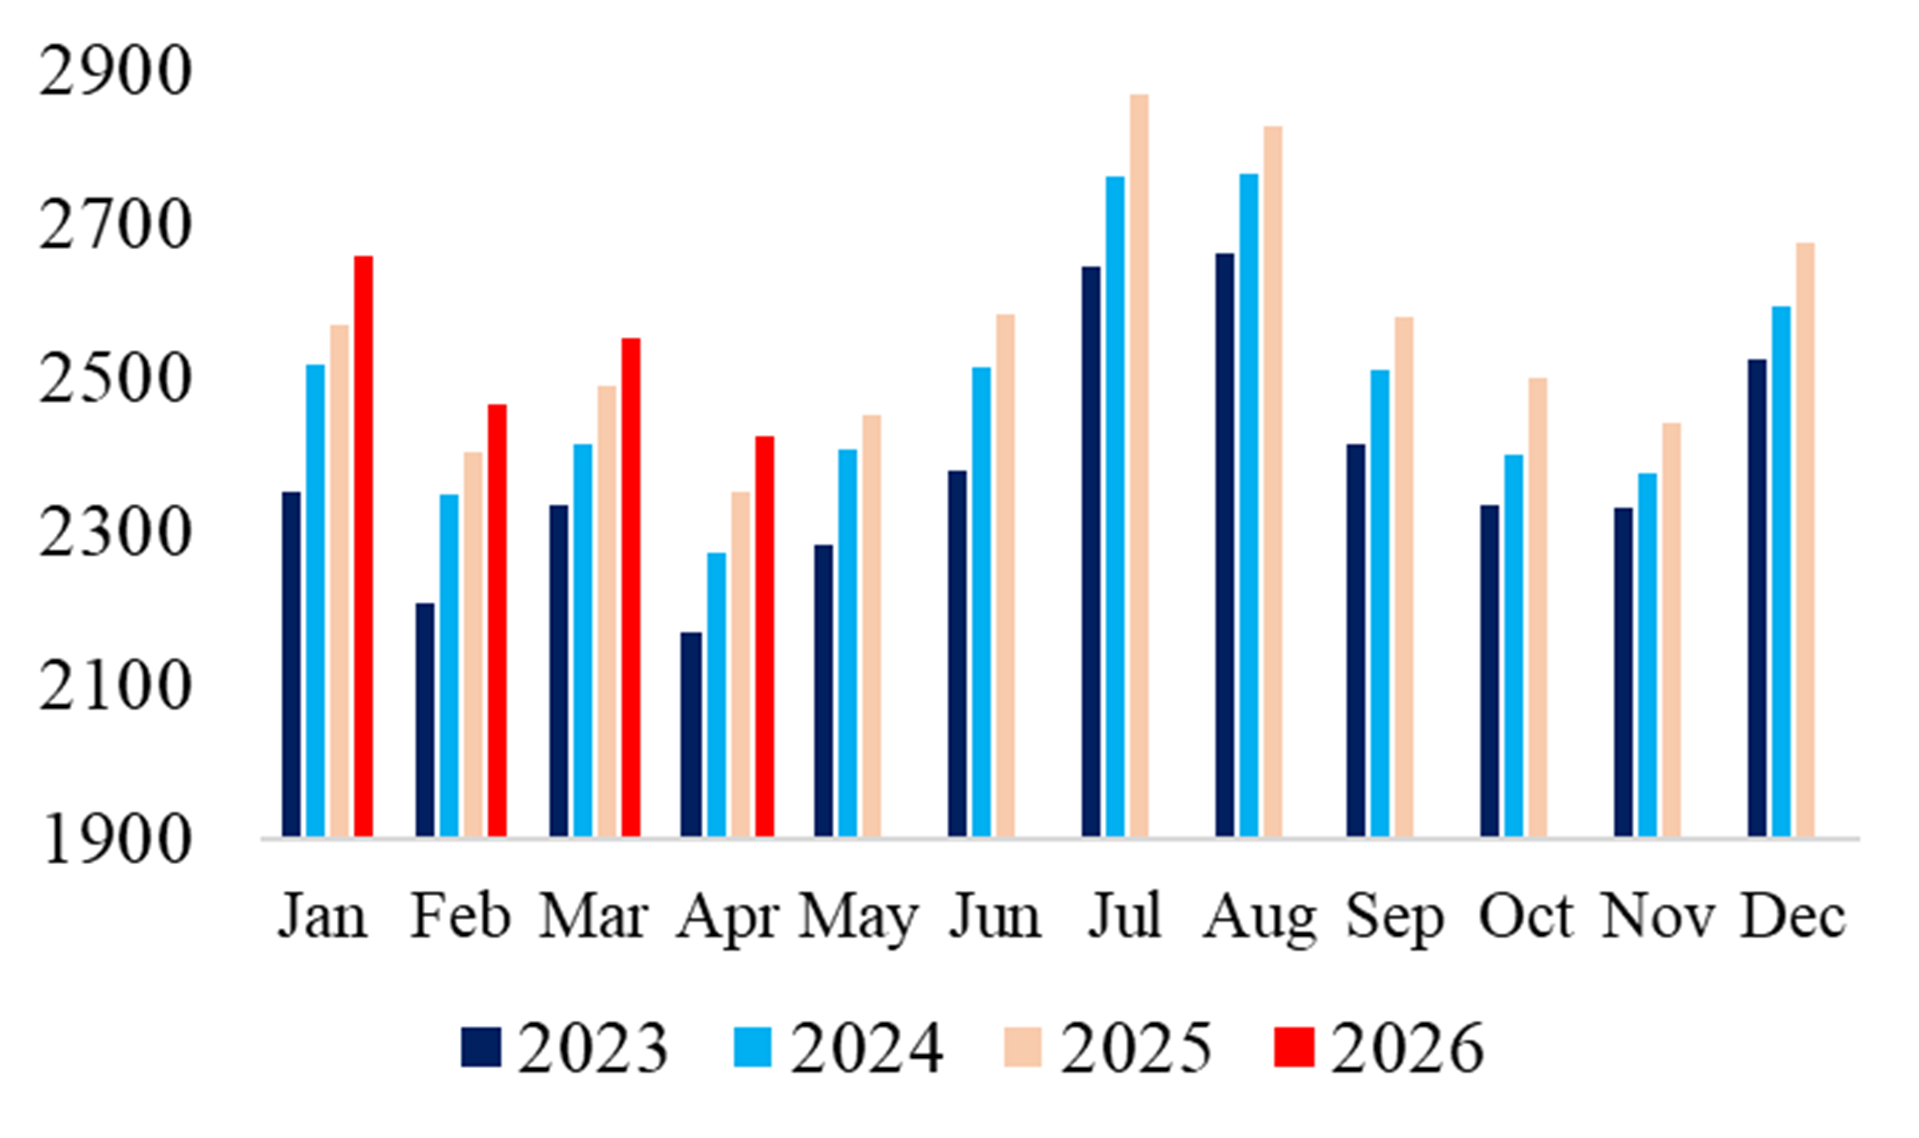
Management teams remained cautious about the growth prospects for power demand from the buildout of data centers in Europe in the foreseeable future. After 20 years of falling electricity demand, power demand has stabilized and started to increase over the past two years (see Table 3). However, the high absolute level of European electricity prices (following the Ukraine war and now again during the Middle East conflict) should limit power demand growth in Europe compared to the USA, where electricity demand has grown above 3% over the past two years.
Private Market Value (PMV) Watch – Deals, Deals and more Power Sector Deals
WIND & SOLAR Assets
Enel buys seven solar plants in the USA (18 May 2026): Enel’s wholly owned subsidiary Enel Green Power North America acquired a portfolio of seven operational solar PV plants in the United States (Virginia, North and South Carolina) with an overall installed capacity of approximately 270 MW and an average output of around 0.4 TWh per year. Enel says the EV of the transaction is $140 million (€120 million) for 270 MW of solar capacity, which generates $20 million net EBITDA annually and implies transaction multiples of $0.5 million/MW (€0.44 million/MW) and 7x EV/EBITDA. The press release also says that the impact on group net financial debt will be approximately $180 million, which reflects private market multiples of EV/MW of $0.67 million (€0.57 million) and EV/EBITDA of 9x. Our take: While no information was provided about the remaining asset life of the solar portfolio, the lower purchase multiple could imply that the assets are older. The transaction confirms Enel’s strategy of growing its renewable energy portfolio through brownfield acquisitions.
EDP buys EDPR’s Brazilian wind and solar assets (20 May 2026): EDP bought the electricity generation, trading, and supply operations in Brazil (EDPR Brazil) from its subsidiary EDPR (in which it owns a 71.3% majority stake). EDPR Brazil has an installed capacity of 1.8 GW (1.1 GW onshore wind and 0.7 GW solar PV), with no growth expected in the 2026-28 business plan. EDP paid an EV of €1.5 billion for 100% of EDPR Brazil, which is projected to generate a 2027 EBITDA of around BRL 800 million (€130-140 million). Thus, the private market transaction implies an EV/EBITDA of 11x and an EV/MW of €0.83 million. Our take: As a very well-informed industrial buyer, EDP is paying an EV/MW multiple that is below the multiples paid for wind and solar assets in the USA and in Europe (usually >€1.0 million), which seems to reflect the limited growth prospects of EDPR’s wind and solar assets.
Orsted explores sale of US onshore assets (26 May 2026): According to news reports, Orsted appears to be in the early stages of looking to divest its onshore wind, solar, and battery storage assets in the USA, which have an estimated installed capacity of 4.8 GW plus assets under construction. The sale of Orsted’s US onshore operations could exceed $1 billion according to the news reports. The potential sale would be in line with Orsted’s recent divestment of its entire European onshore wind and solar business for €1.44 billion to Copenhagen Infrastructure Partners in April 2026 and would confirm the company’s strategy to refocus operations on its offshore wind business following losses tied to its costly US expansion. Our take: It remains to be seen whether this deal will be completed and what multiples will be paid in the private market.
GAS DISTRIBUTION NETWORK Assets
Enagas buys 31.5% stake in French Terega (21 April 2026): Spanish Enagas paid €570 million for a 31.5% stake in the French gas transmission and storage system operator (TSO) Terega that it bought from Singapore’s Sovereign Wealth Fund GIC. Based on Terega’s FY 2025 financial results with an EBITDA of €300 million, a Regulated Asset Base (RAB) of €3.3 billion and a net debt of €1.7 billion, the implied private market multiples reflect an EV/EBITDA of 11.7x and an EV/RAB of 1.07x in this private market transaction. The acquired gas network assets include 5,100 km of gas pipelines and two strategic underground gas storage facilities, which account for about 27% of France’s total gas storage capacity. Our take: These deal multiples are very similar to the ones that were recently quoted by the FT for the expected sale of ownership stakes by Macquarie and a Chinese Sovereign Wealth Fund in the UK’s largest gas distribution network Cadent. As such, it provides a positive read-through for our Engie valuation, for which we applied a lower EV/EBITDA multiple of 9.2x in our PMV calculation.
Power Points
EUROPE
RWE: 1Q 2026 results – In-line results, FY 2026 guidance confirmed
Adjusted EBITDA of €1,631m (+25% YoY) was in line with the company-collected consensus (€1,629m): “Offshore Wind” EBITDA of €657m outperformed by 9% on normalized wind conditions, which was fully offset by a weaker-than-expected “Supply & Trading” results with a loss of €84m (consensus was -€20m), due to “the turbulence on energy markets following the outbreak of the Iran war”. “Onshore Wind & Solar” (€507m) was in line with expectations and “Flexible Generation” (gas and hydro) reported €657m in line with the consensus, but only with the help of a non-recurring compensation payment of €332m for production restrictions in 2022 of the Eemshaven power plant in the Netherlands. Adjusted net income of €608m (+22% YoY) was also in line with the consensus of €605m. The FY 2026 guidance was fully reiterated (Adjusted EBITDA of €5.2-5.8bn and Adjusted net income of €1.55-2.05bn), with 1Q26 EPS now reflecting 33% of the FY 2026 EPS guidance.
E.ON: 1Q 2026 results – Slight beat, FY 2026 guidance confirmed
E.ON reported a slight beat at the EBITDA and net profit levels: Adjusted EBITDA of €3,253m was 2% ahead of company-provided consensus and Adjusted net income of €1,341m was 4% above expectations. The small beat was mainly driven by a stronger retail performance, which was supported by higher prices in January. The FY 2026 guidance was fully confirmed: Adjusted EBITDA of €5.2-5.8bn and Adjusted net income of €1.55-2.05bn. In addition, E.ON acquired UK energy supplier, OVO, and the combined E.ON/OVO business should become the #1 in electricity supply and the #3 gas supplier in the UK; no deal price was announced (Financial Times mentioned £600m). E.ON expects the deal to be EPS accretive by 2030. While UK retail may not be the preferred investors’ choice of capital allocation, EPS accretion and increased cash generation from a relatively small deal should be incremental positives.
Veolia: 1Q 2026 results – In-line results, FY 2026 guidance confirmed
Revenues of €11,427m declined by 0.7% YoY in 1Q 2026 but increased by 2.1% on a like-for-like basis (without forex and energy price impact). “Water” revenues declined YoY because “Water Technologies” sales dropped due to Middle East project slowdowns and booking delays related to the military conflict. “Waste” revenues also declined YoY because sustained US sales growth in “Hazardous Waste” could only partially offset lower sales in “Solid Waste”. In contrast, “Energy” revenues increased YoY with sales growth coming from both business units: “District Heating” benefited from a good heating season and “Bioenergy” performed well in Northern Europe. Finally, 1Q 2026 EBITDA and EBIT met expectations and increased YoY by 4.2% and 6.1%, respectively, on higher margins. Veolia confirmed its previous FY 2026 guidance of solid organic revenue growth (excluding energy prices) and organic EBITDA growth of 5-6%. Veolia targets net income growth of at least 8% at constant forex, excluding the recent “Clean Earth” acquisition in the USA. EPS is projected to grow in line with net income, and dividend growth should be in line with EPS growth. Management also expects the €2bn disposal program to be delivered within two years following the closing of the “Clean Earth” acquisition.
Engie: 1Q 2026 results – Slight beat, FY 2026 guidance confirmed
Engie released only a few selected financials for 1Q 2026: EBIT including nuclear of €3,522m was down 13% YoY, EBIT ex nuclear of €3,411m was down 6.6%, but both beat the consensus of €3,310m (which probably reflects a mix of both EBIT numbers), so this implies a beat of 3.0-6.5%, which was mainly driven by a better result in Supply & Energy Management. Veolia confirmed the FY 2026 guidance with EBIT (ex. nuclear) at €8.7-9.7bn and with net income at €4.6-5.2bn, based on a recurring effective tax rate of 20-23%. Engie sees only a limited impact on its Middle East activities from the military conflict. The recently announced UK Power Network (UKPN) acquisition was completed two months ahead of schedule.
EDP: 1Q 2026 results – Strong beat, FY 2026 guidance raised by 5%
Recurring EBITDA (€1.38bn) was down 2% YoY but 3% above the company-collected consensus (€1.34bn) due to strong hydro volumes in Spain and higher network profits in Brazil. The recurring net profit (€399m) declined by 9% YoY but beat the consensus (€356m) by 12% (due to lower financial costs and lower taxes). The FY 2026 guidance for recurring EBITDA and recurring net profit were each raised by 5% from the mid-point of the previous guidance range: Recurring EBITDA from €4.95bn to €5.2bn and net profit from €1.25bn to around €1.3bn.
Orsted: 1Q 2026 results – Slight beat, FY 2026 guidance confirmed
Orsted reported a slight beat at the EBITDA level with DKK 9,545m vs. the company collected consensus of DKK 9,473m, driven by its “Onshore” business (DKK 1,371m), which was 10% ahead of expectations, while the “Offshore Wind” segment (DKK 7,548m) delivered a modest 2% beat and “Bioenergy” was weaker (DKK 430m); Net profit of DKK 2,176m missed expectations due to a DKK 1,369m impairment charge. The FY 2026 guidance was confirmed with EBITDA “above DKK 28bn” and gross investment of DKK 50-55bn. Due to delayed grid connections, first power for Hornsea 3 is now expected in Q1 2027 but Revolution Wind in the USA (94% complete) is already delivering power. Finally, the commissioning of the Sunrise and Changua 2b/4 projects remains on track.
Iberdrola: 1Q 2026 results – Slight beat, FY 2026 guidance raised
Adjusted EBITDA (€4.1bn) increased by 2% YoY and was 1% above consensus expectations (€4.0bn); Adjusted net profit (€1.87 billion) was up 11% YoY and beat the consensus of €1.74bn by 7%. Following the completion of the Mexico asset sale and the payment for Neoenergia minorities, adjusted FFO/adjusted net debt improved to 24.8% in 1Q 2026, from 21.2% on a comparable basis in 1Q 2025. The FY 2026 guidance was raised as Iberdrola lifted the guidance for net profit growth from “around 6% growth” to now “above 8% growth”. The guidance upgrade is driven by faster‑than‑expected networks execution, favorable UK regulation, full Neoenergia consolidation and supportive UK capital allowances.
GE Vernova: 1Q 2026 results – Strong beat, FY 2026 guidance raised
GE Vernova reported a strong 1Q beat, primarily at the EBITDA level. While Sales increased 16% YoY to $9.3bn, EBITDA almost doubled YoY to $896m, which was 14% ahead of consensus expectations. Accordingly, the EBITDA margin almost doubled to 9.6% in 1Q 2026 from 5.7% last year (consensus was projecting 8.5%). Net income jumped from $264m in 1Q 2025 to $4,750m in 1Q 2026 (which included $4.5bn of net M&A gains from last year’s Prolec acquisition. The order intake jumped 78% YoY to $18.3bn, driven by solid order growth in all business units: “Power” +60% YoY, “Wind” +87% YoY and “Electrification” +111% YoY. After a very strong start into year, the company already raised the FY 2026 guidance for the EBITDA margin range at the group level by 1% to 12-14% and as well as for the “Power” division by 1% to 17-19% and for the “Electrification” business by 1% to 18-20%.
UNITED KINGDOM:
United Utilities: FY 2025/26 results – Solid beat, investment guidance raised
United Utilities (UU) reported a solid beat in FY 2025/26 results for the period ending 31 Mar 2026, with 42% YoY EPS growth to £1.07 (vs. £1.02 consensus) on the back of a 35% YoY underlying operating profit increase due to higher regulatory revenues, which were allowed under the “AMP 8” final determination (“Asset Management Period 8”, which runs from 2025-30). Capex of £1.5bn was in line with expectations and regulatory gearing remained unchanged at 60%. More importantly, the company also announced an £800m equity increase on the back of a £2.5bn investment increase during AMP8 to a total capex of £11.5bn. As a result, the Regulatory Capital Value (RCV) is now expected to grow at a 10% CAGR during AMP8 (vs. 7% previously). UU also lifted its regulatory return target by 100bp to 10-11% and the regulatory gearing is guided for a 55–65% target range during AMP8. The company also submitted an AMP8 re-opener of £1.4bn in incremental capex to OFWAT (the UK Water Services Regulation Authority), highlighting higher investments related to increased housing targets, more water demand from AI/datacenters and new priority projects. OFWAT is expected to give its draft and final decisions in August and in December 2026, respectively.
Severn Trent: FY 2025/26 results – Small beat, FY 2027/28 EPS guidance raised
Severn Trent (SVT) reported a slight beat in FY 2025/26 for the period ending 31 March 2026. While revenues were in line at £2.8bn, the company reported a 65% YoY increase in EPS to £1.84, which was 4% ahead of consensus expectations. “Outcome Delivery Incentives” (ODIs) reached £59m in FY 2025/26, well ahead of the guidance of above £40m. For FY 2026/27, the company expects at least £40m in ODIs on a real basis (2022/23 prices) with overall ODI expectations for AMP 8 (Asset Management Period 8 from 2025-28) remaining unchanged at £300m. FY 2025/26 capex grew 17% YoY to £1.9bn and the company targets capex of £2.2-2.5bn for FY 2026/27. SVT increased the dividend per share in FY 2025/26 by 3.5% YoY to 130.5 pence, which implies a dividend yield of 4.2%. SVT raised the FY 2027/28 EPS target by 11% to £2.50 (from £2.24), driven by a £150m cost efficiency program in AMP8, strong ODI performance and financing outperformance. SVT is fully hedged for energy costs in FY 2026/27 and 90% hedged out to FY2028/29. Finally, SVT submitted £588m of re-openers to OFWAT (the UK Water Services Regulation Authority) related to investments in water resilience, sewage capacity/inspections, boreholes and water storage tanks. The draft determination from OFWAT is expected by 15 August. If approved, the additional investments could can add 70 bps to SVT’s Regulatory Capital Value (RCV) growth per annum, which implies 10.5-11% annual RCV growth versus 10% currently.
MIDDLE EAST:
DEWA: 1Q 2026 results – Strong beat, no FY 2026 guidance due to geopolitics
DEWA reported a strong set of 1Q 2026 results, which beat consensus expectations. Revenues rose 8% YoY to AED 6,452m (vs. consensus of AED 5,964m) and EBITDA jumped 18% YoY to AED 2,880m, which was 15% ahead of consensus (AED 2,432m). Accordingly, the EBITDA margin also increased from 41% in 1Q 2025 to 45% in 1Q 2026. Finally, 1Q net profit almost doubled YoY to AED 905m and was more than double the consensus estimate. Utilities’ demand growth in Dubai remained robust in 1Q 2026 as DEWA’s total power & water production increased by 5.7% YoY and 5.5% YoY, respectively. In 1Q 2026, total power generation increased 5.7% YoY to 11.1 TWh (including clean energy generation of 2.1 TWh or 18.5% of its fuel mix) and desalinated water production was up 5.5% to 37.6 BIG (billion imperial gallons). At the end of 1Q 2026, DEWA’s installed power capacity stood at 18.0GW, of which around 3.9GW was solar/renewable power. While no specific business outlook or guidance was presented in the current geopolitical environment, the company expects to install an additional 120 MIGD (million imperial gallons of water) of SWRO (seawater reverse osmosis) capacity in FY 2026.
JAPAN:
Osaka Gas: FY 2025/26 results – Solid profit beat, dividend raised
For FY 2025/26 ending in March 2026, Osaka Gas reported net sales of JPY 2,030.3bn, down 1.9% YoY, primarily due to lower unit selling prices for city gas under the gas rate adjustment system. Ordinary profit rose by 7.8% YoY to JPY 204.5bn and profit attributable to owners of the parent increased 13.6% YoY to JPY 152.7bn. Ordinary profit beat the earlier announced guidance by about 10% due to higher-than-expected earnings from US upstream operations in the “International Energy” segment and increased property sales in the “Life & Business Solutions” segment. For FY 2026/27, the company is guiding for ordinary profit to decline by 7% to JPY 190bn, primarily due to lower earnings from electricity market transactions in the “Domestic Energy” segment and higher fixed costs from the Himeji Power Plant. Net sales are projected to be slightly higher at JPY 2,070bn in FY 2026/27. The annual dividend for FY2025/26 was raised by 26% YoY, or JPY 25, to JPY 120 per share, which reflected the seventh consecutive year of dividend increases. For FY2026/27, the company forecasts another dividend increase of JPY 10 to JPY 130/share along with a new share buyback program of up to JPY 80bn.
CHINA:
“Power of Siberia 2” pipeline would more than double China’s gas imports from Russia
Days after President Trump’s visit to China in mid-May, President Putin also paid a state visit to China and President Xi Jin Ping. One of Russia’s main focuses of the meeting was increasing Russia’s energy exports to China and progressing talks on the “Power of Siberia 2” pipeline, which has been in discussions for over a decade. The planned Power of Siberia 2 is a 2,800 kilometers (1,700 miles) pipeline that would carry 50 BCM (billion cubic meters) of natural gas from Russia to China via Mongolia annually. The Power of Siberia 1 currently delivers 38 BCM of gas to China annually. Russia and China signed a “legally binding memorandum” in September 2025 to advance construction of the second pipeline. During the meeting last week, Russia and China signaled that discussions continue to move forward, but no deal was signed. One of the main hurdles to this pipeline is pricing and contractual volumes. It has been reported that China wants pricing terms close to Russia’s domestic gas price of $120-$130/1,000 cubic centimeters, while Russia is seeking prices similar to “Power of Siberia 1” (estimated at $265-285 per 1000 cubic meters, which are indexed to the Asian oil product basket). As Russia looks to replace much of the lost gas sales to Europe since the invasion of Ukraine, China remains in the driver’s seat as it has the optionality to source more LNG imports (for gas in industrial applications). China’s share of gas in power generation is already negligible at 3% (see Exhibit 37) and could soon be fully replaced by China’s rapid build-out of renewable energy.
European Power Prices and Global Electricity Demand Growth
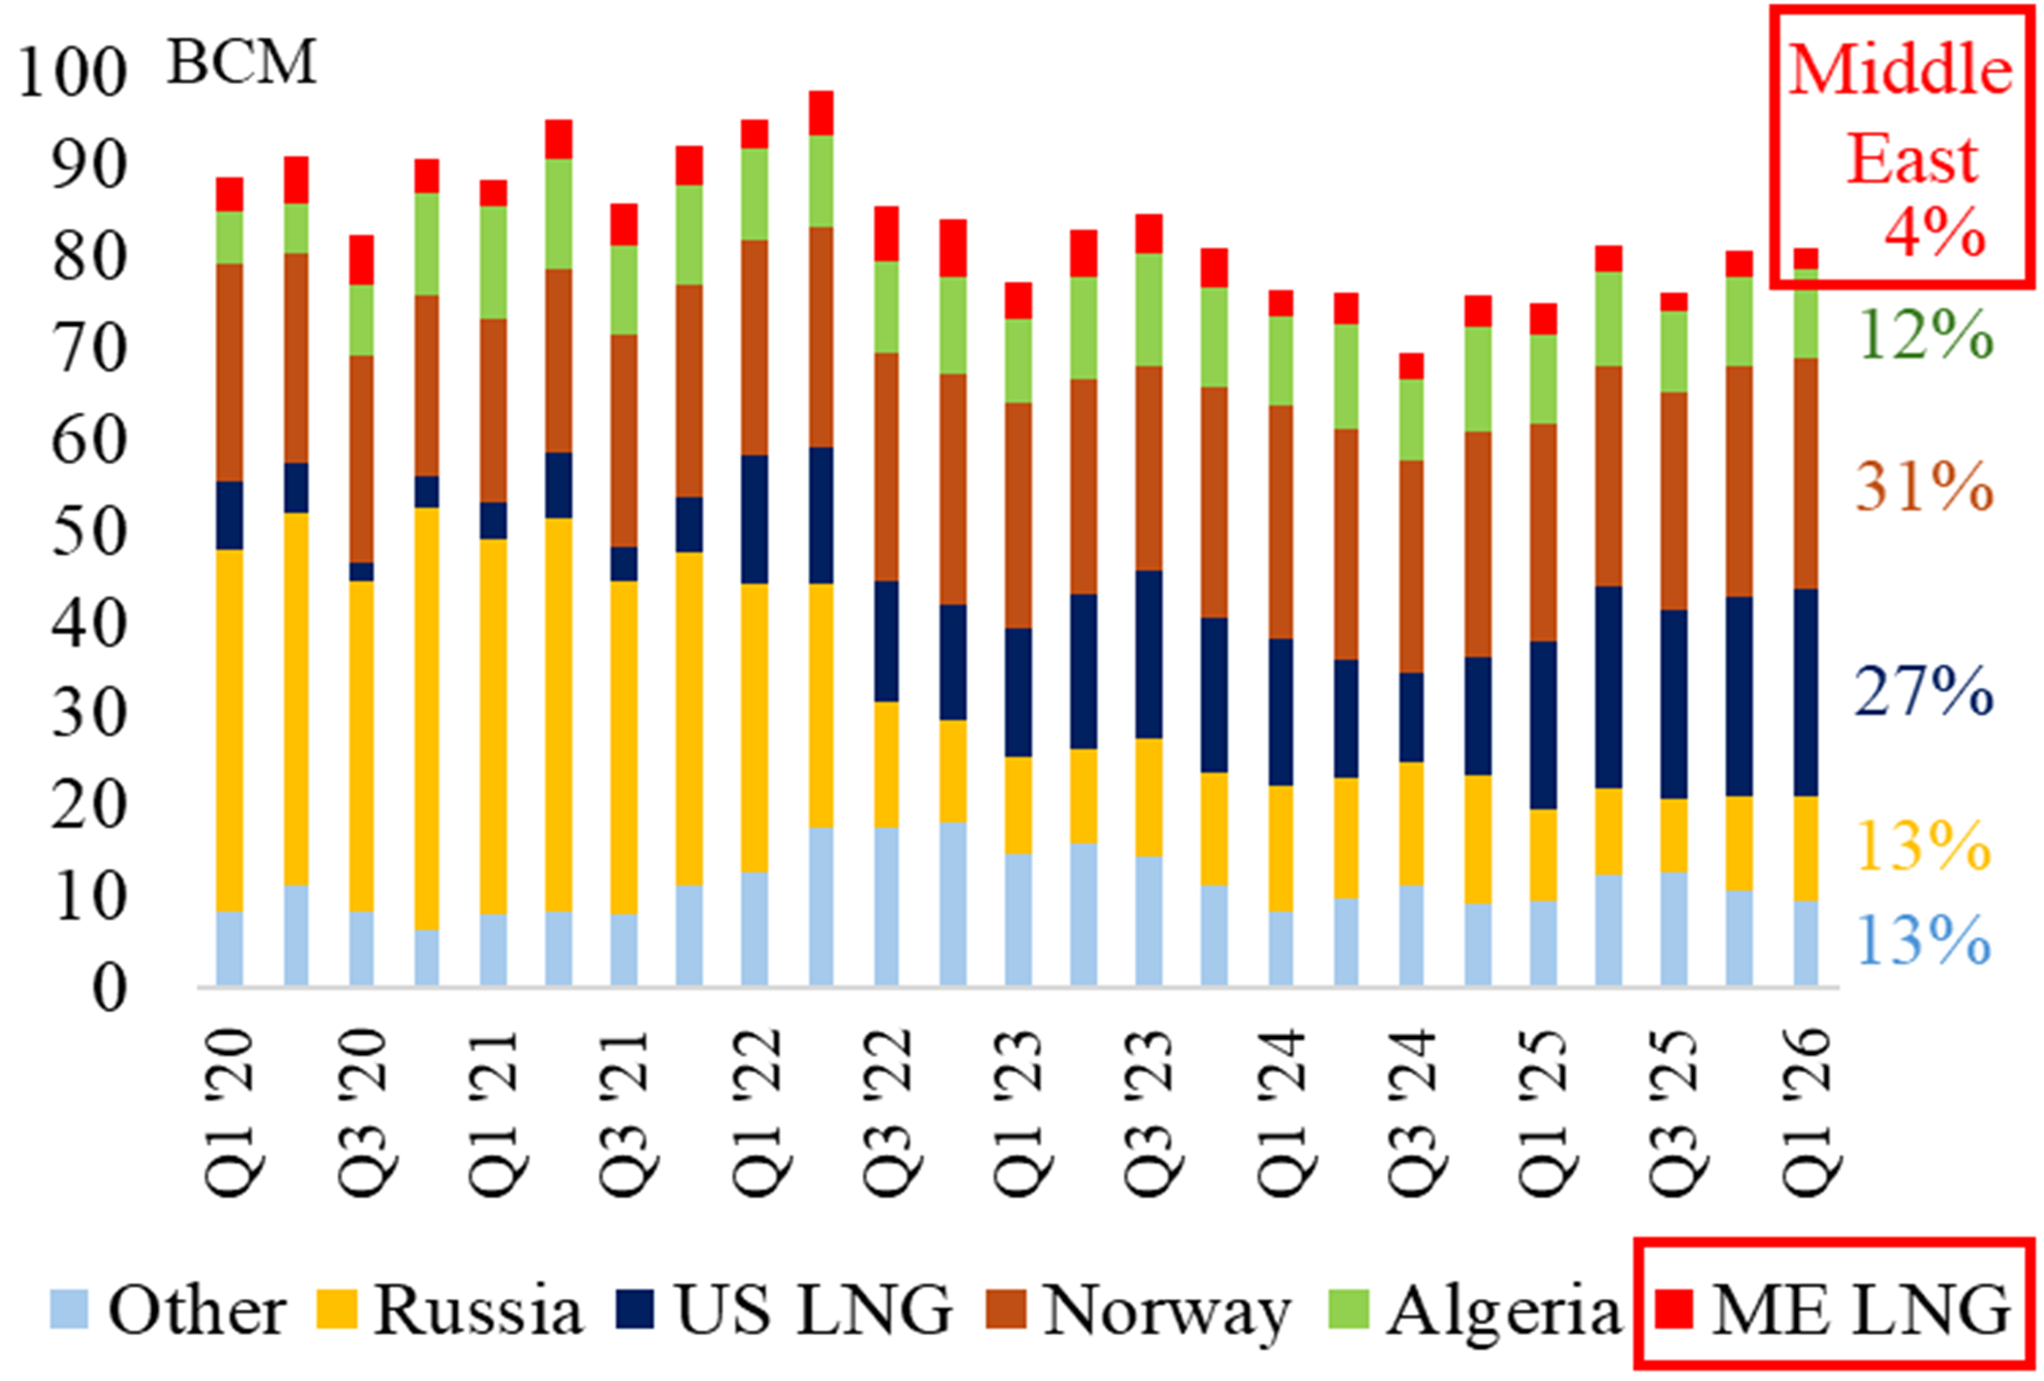
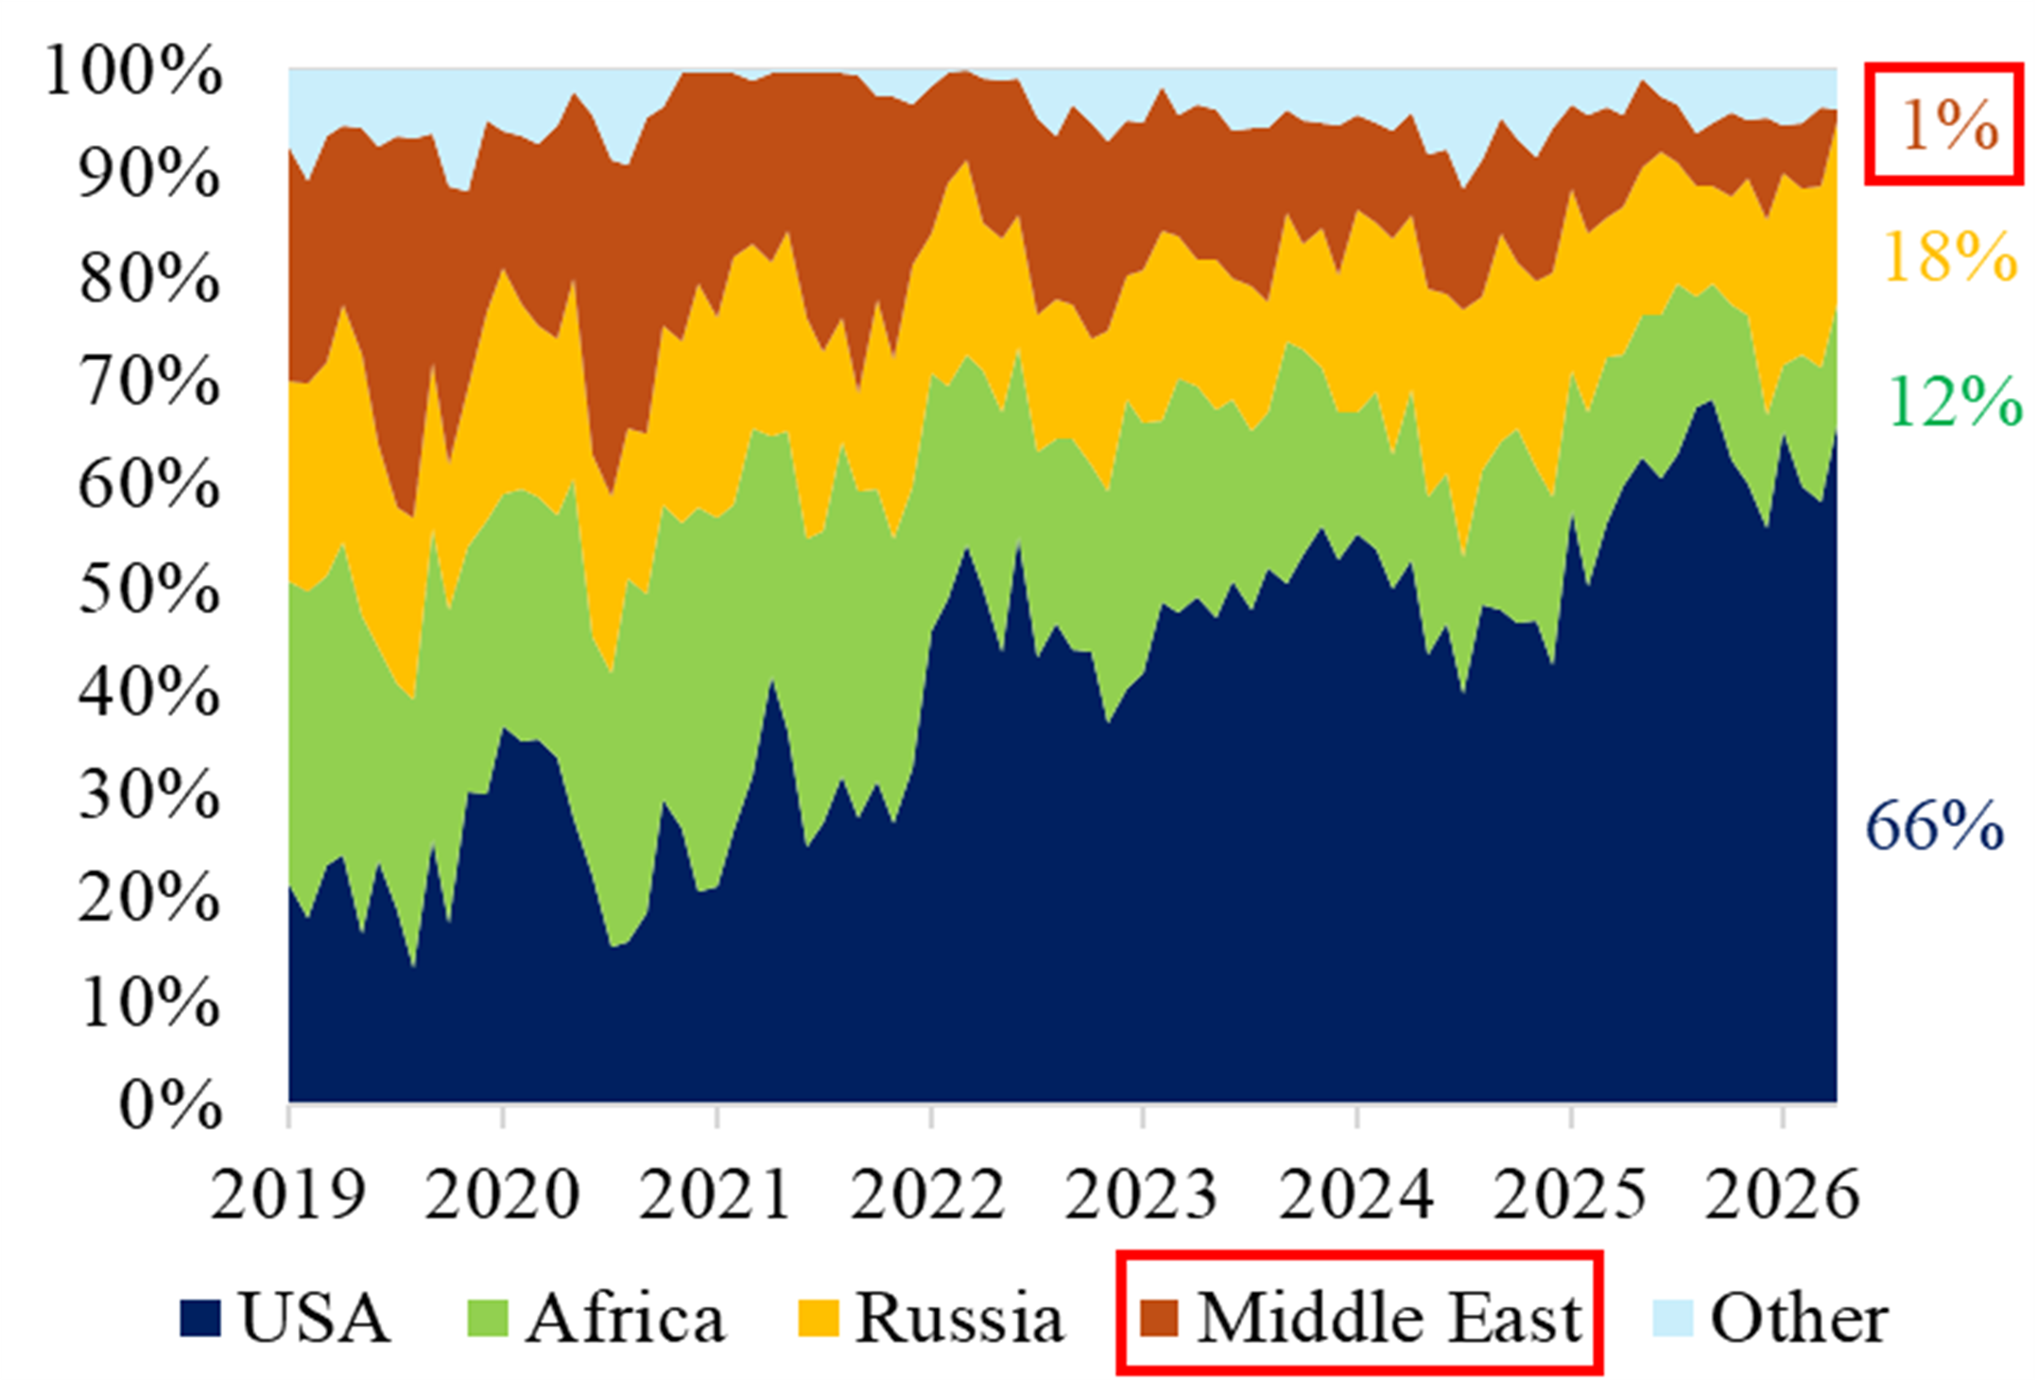
The Iran conflict has pushed Europe into its second energy crisis within four years and put the spotlight back on European gas and power prices. In contrast to the previous energy crisis in 2022, when Russia halted the supply of pipeline gas, Europe faces little volume risk this time, as only about 4% of total gas imports (see Exhibit 9) and only 1% of European LNG imports (see Exhibit 10) come from the Middle East. But Europe will have to refill its depleted gas storage with LNG purchases this summer, as EU gas storage remains very low at only 38% filled by the end of May, which is at the 5-year low of 2021, the year before the 2022 energy crisis started (see Exhibit 7). Thus, as European LNG buyers compete this summer with Asian buyers in the spot market to refill their depleted gas storage for next winter, LNG prices (and by extension European gas prices) are expected to remain elevated throughout 2026. As the average LNG price is YTD in 2026 already 22% above last year’s level, the average EU gas price has followed and is also 16% above 2025, and the average UK gas price is YTD 9% higher than in 2025 (see Table 2).
Table 2 Average Electricity, Carbon, Coal and Natural Gas Prices
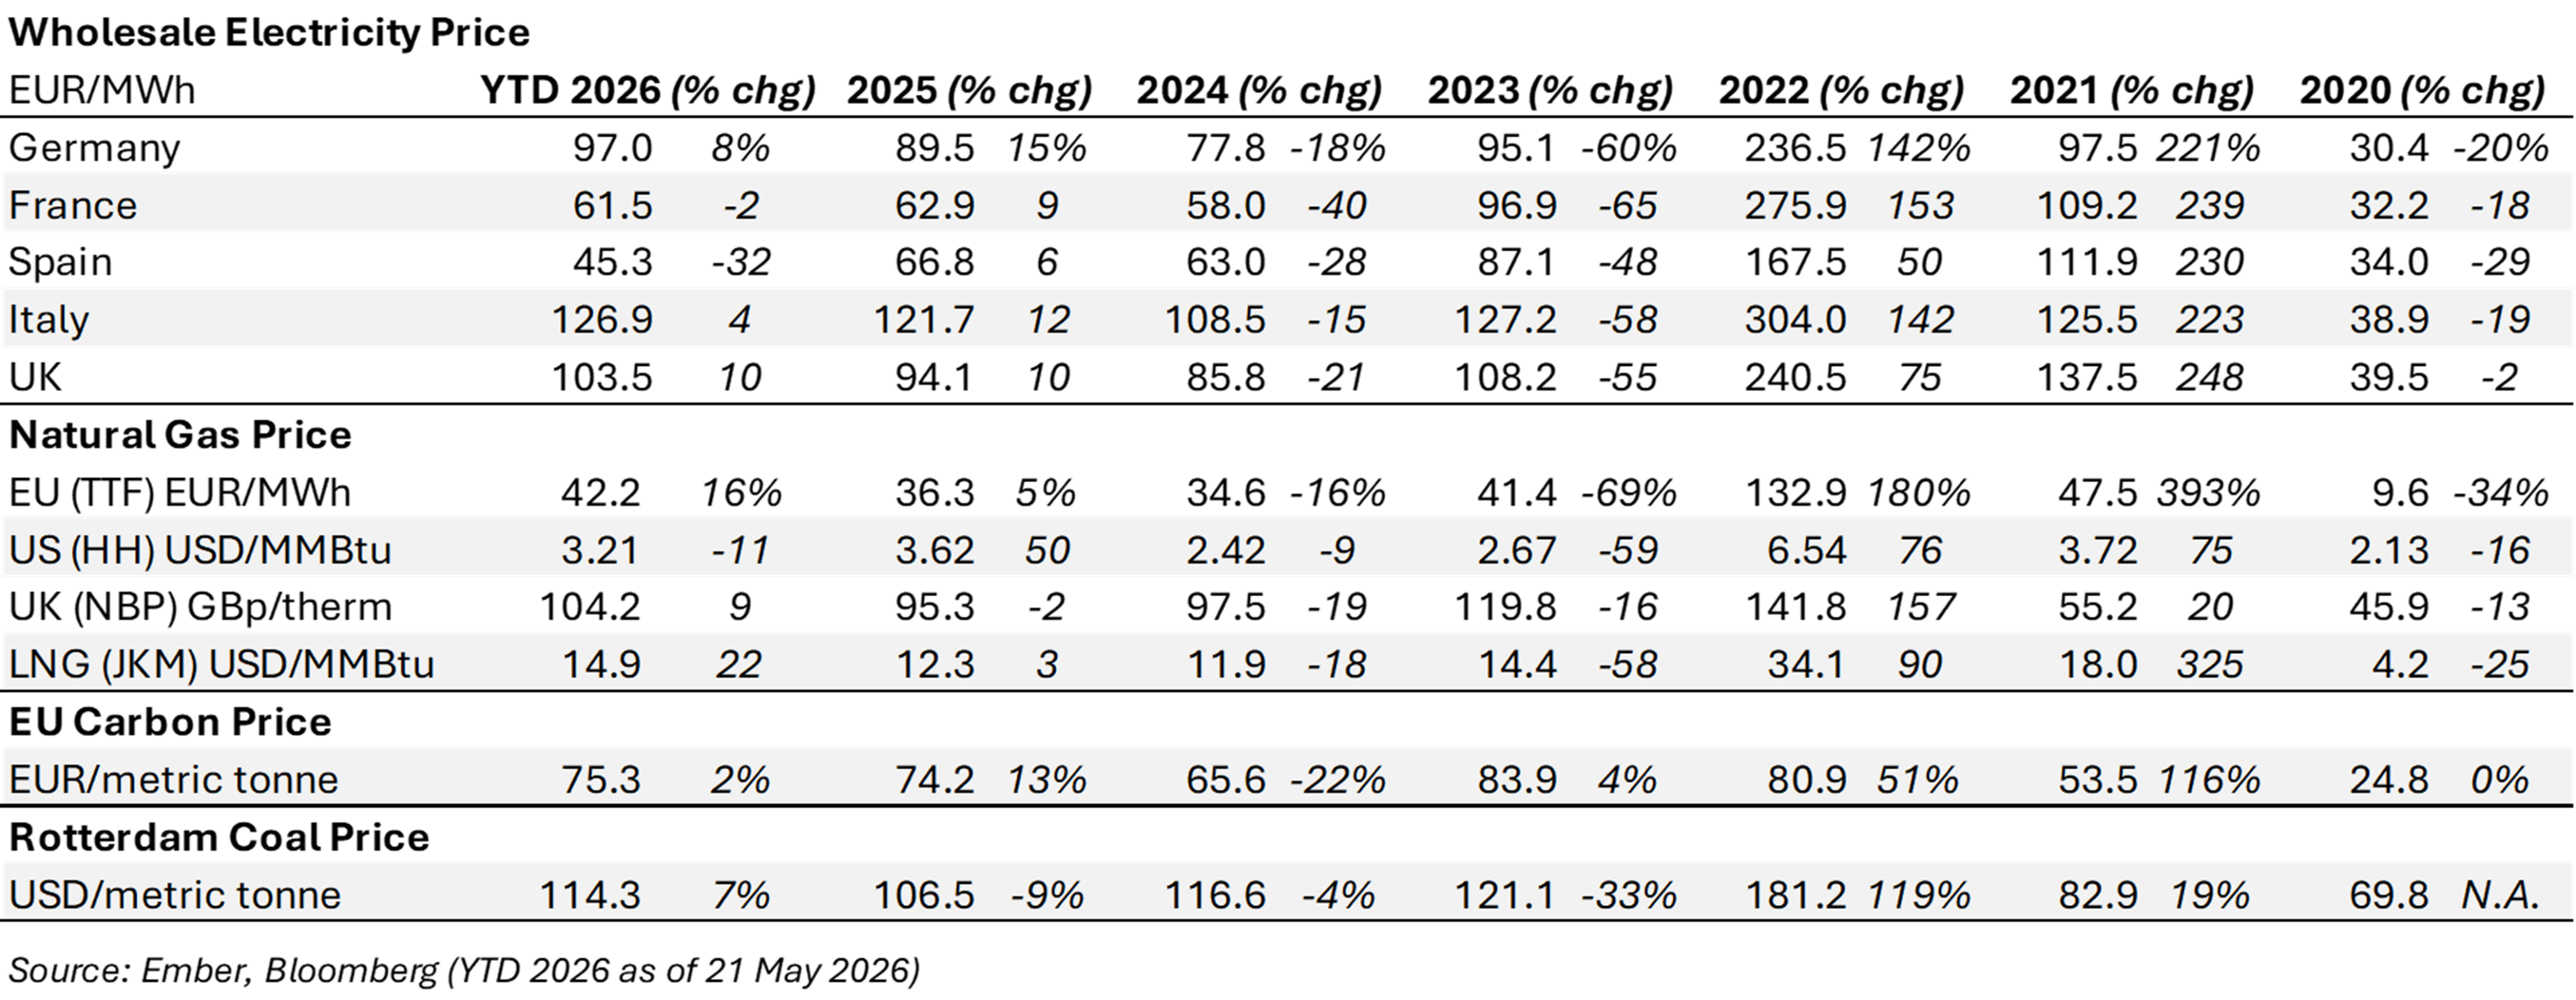
Rising gas prices have also lifted power prices in countries that are highly dependent on gas-fired power generation, because gas-fired generation remains the marginal electricity producer under the merit order principle in Europe (and therefore the gas price sets power prices in Europe). Accordingly, in Germany, Italy, and the UK, average wholesale electricity prices have YTD in 2026 already surpassed average power prices in 2025 by 8%, 4% and 10%, respectively (see also Table 2). It is important to highlight that, in contrast to the last energy crisis in 2022, European gas and electricity prices are still significantly below the peak levels of 2022. Thus, despite high power prices in Europe, it is encouraging to see in Table 3 that EU&UK electricity demand has continued to increase by 1.7% in 1Q 2026 (after several years of falling power demand due to efficiency gains in response to high power prices).
Table 3 Annual Electricity Demand (TWh)
Gas Storage and LNG Flows
Exhibit 5 US Gas Storage Exhibit 6 US LNG Exports
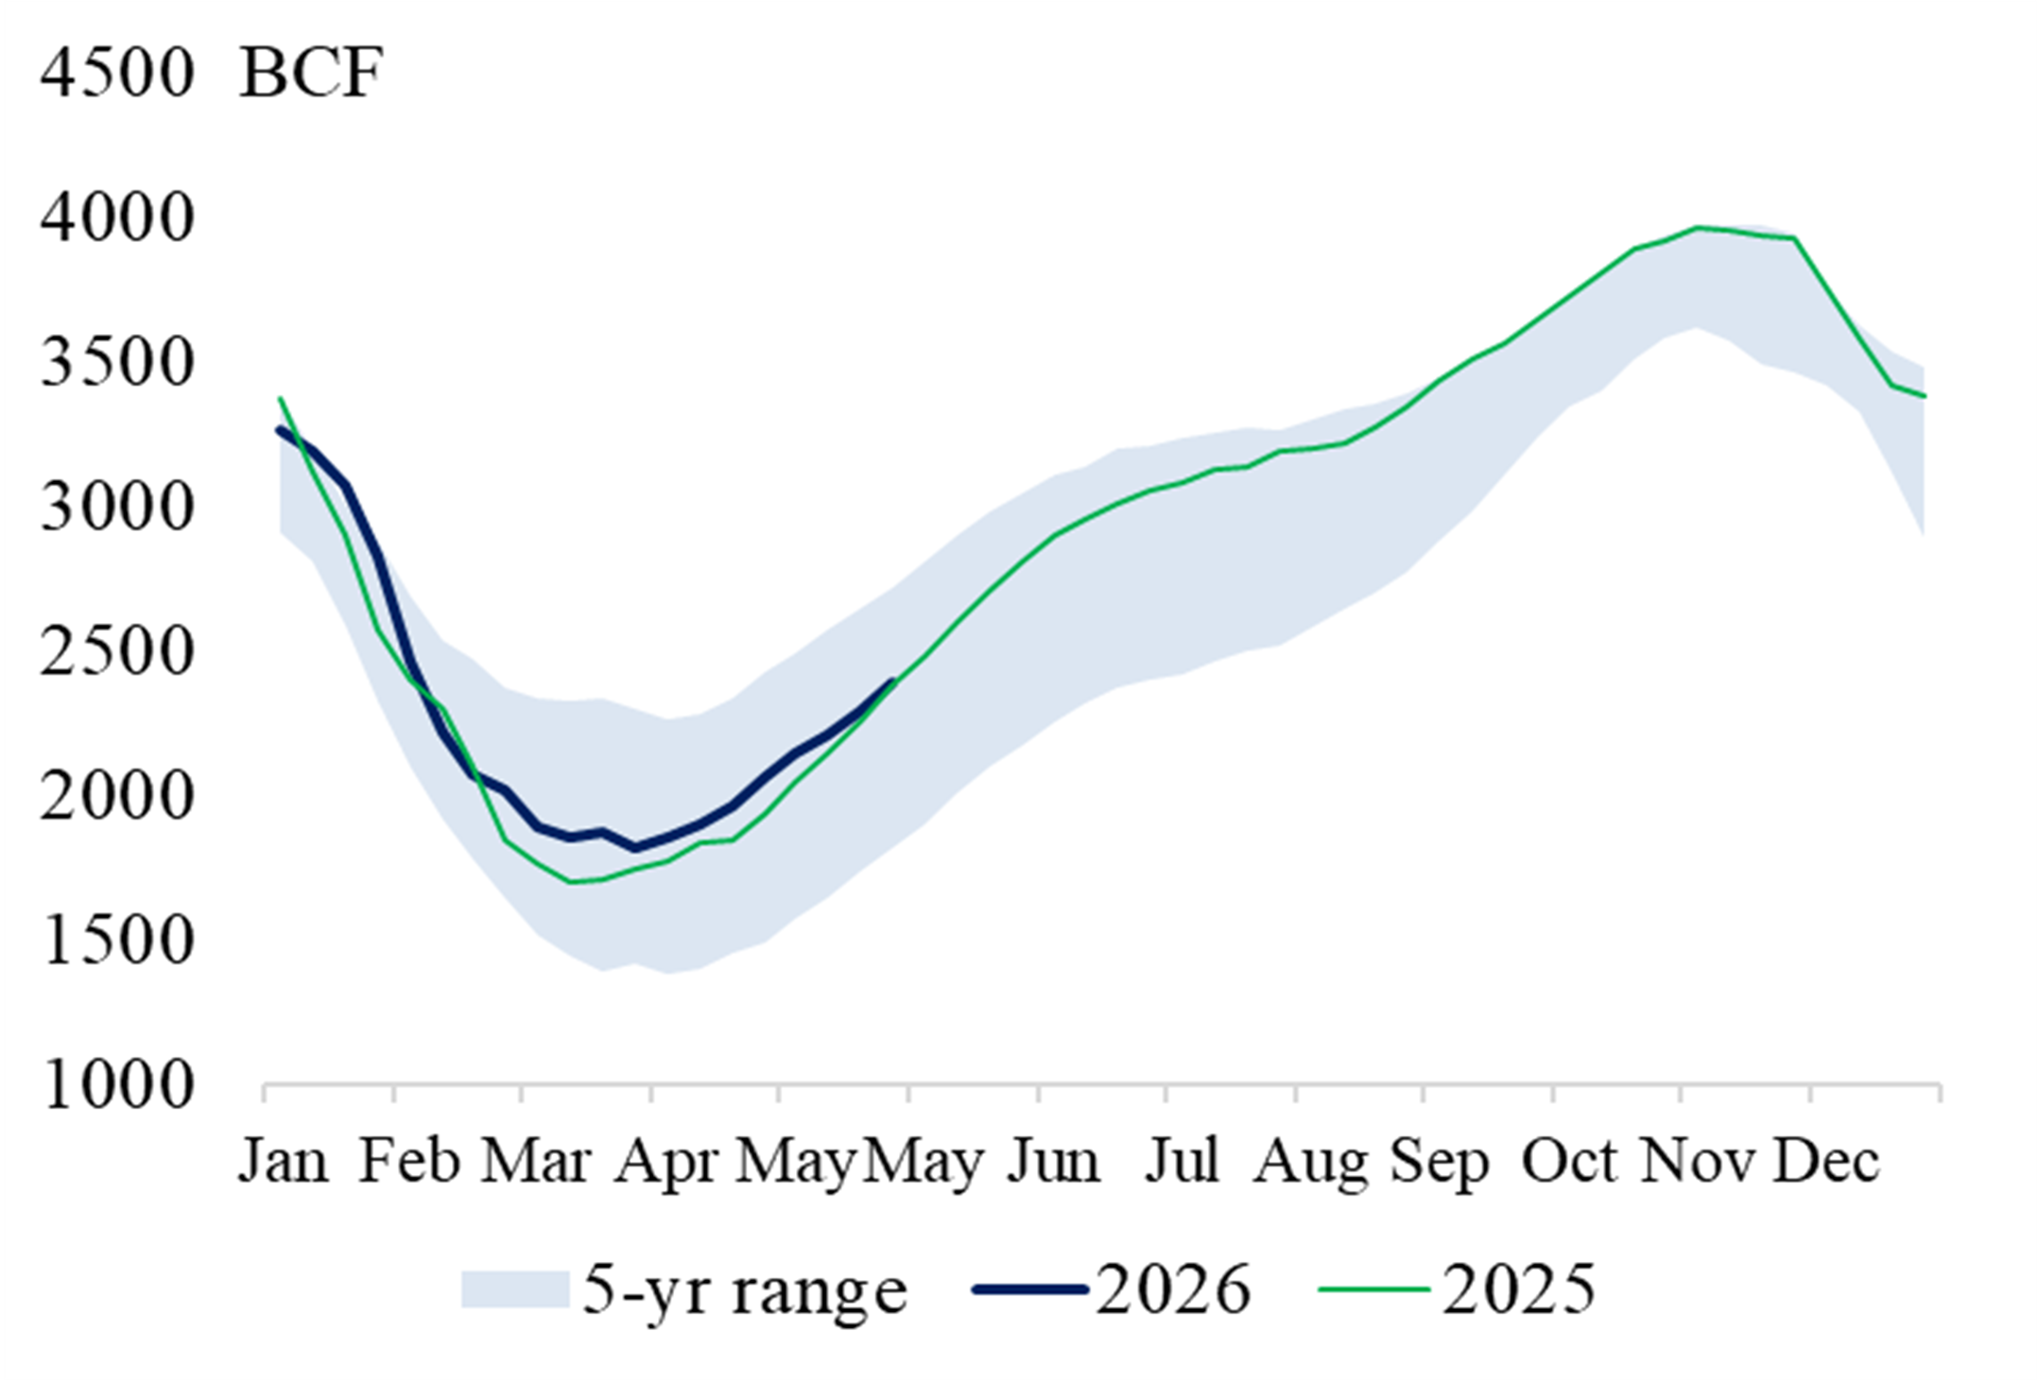
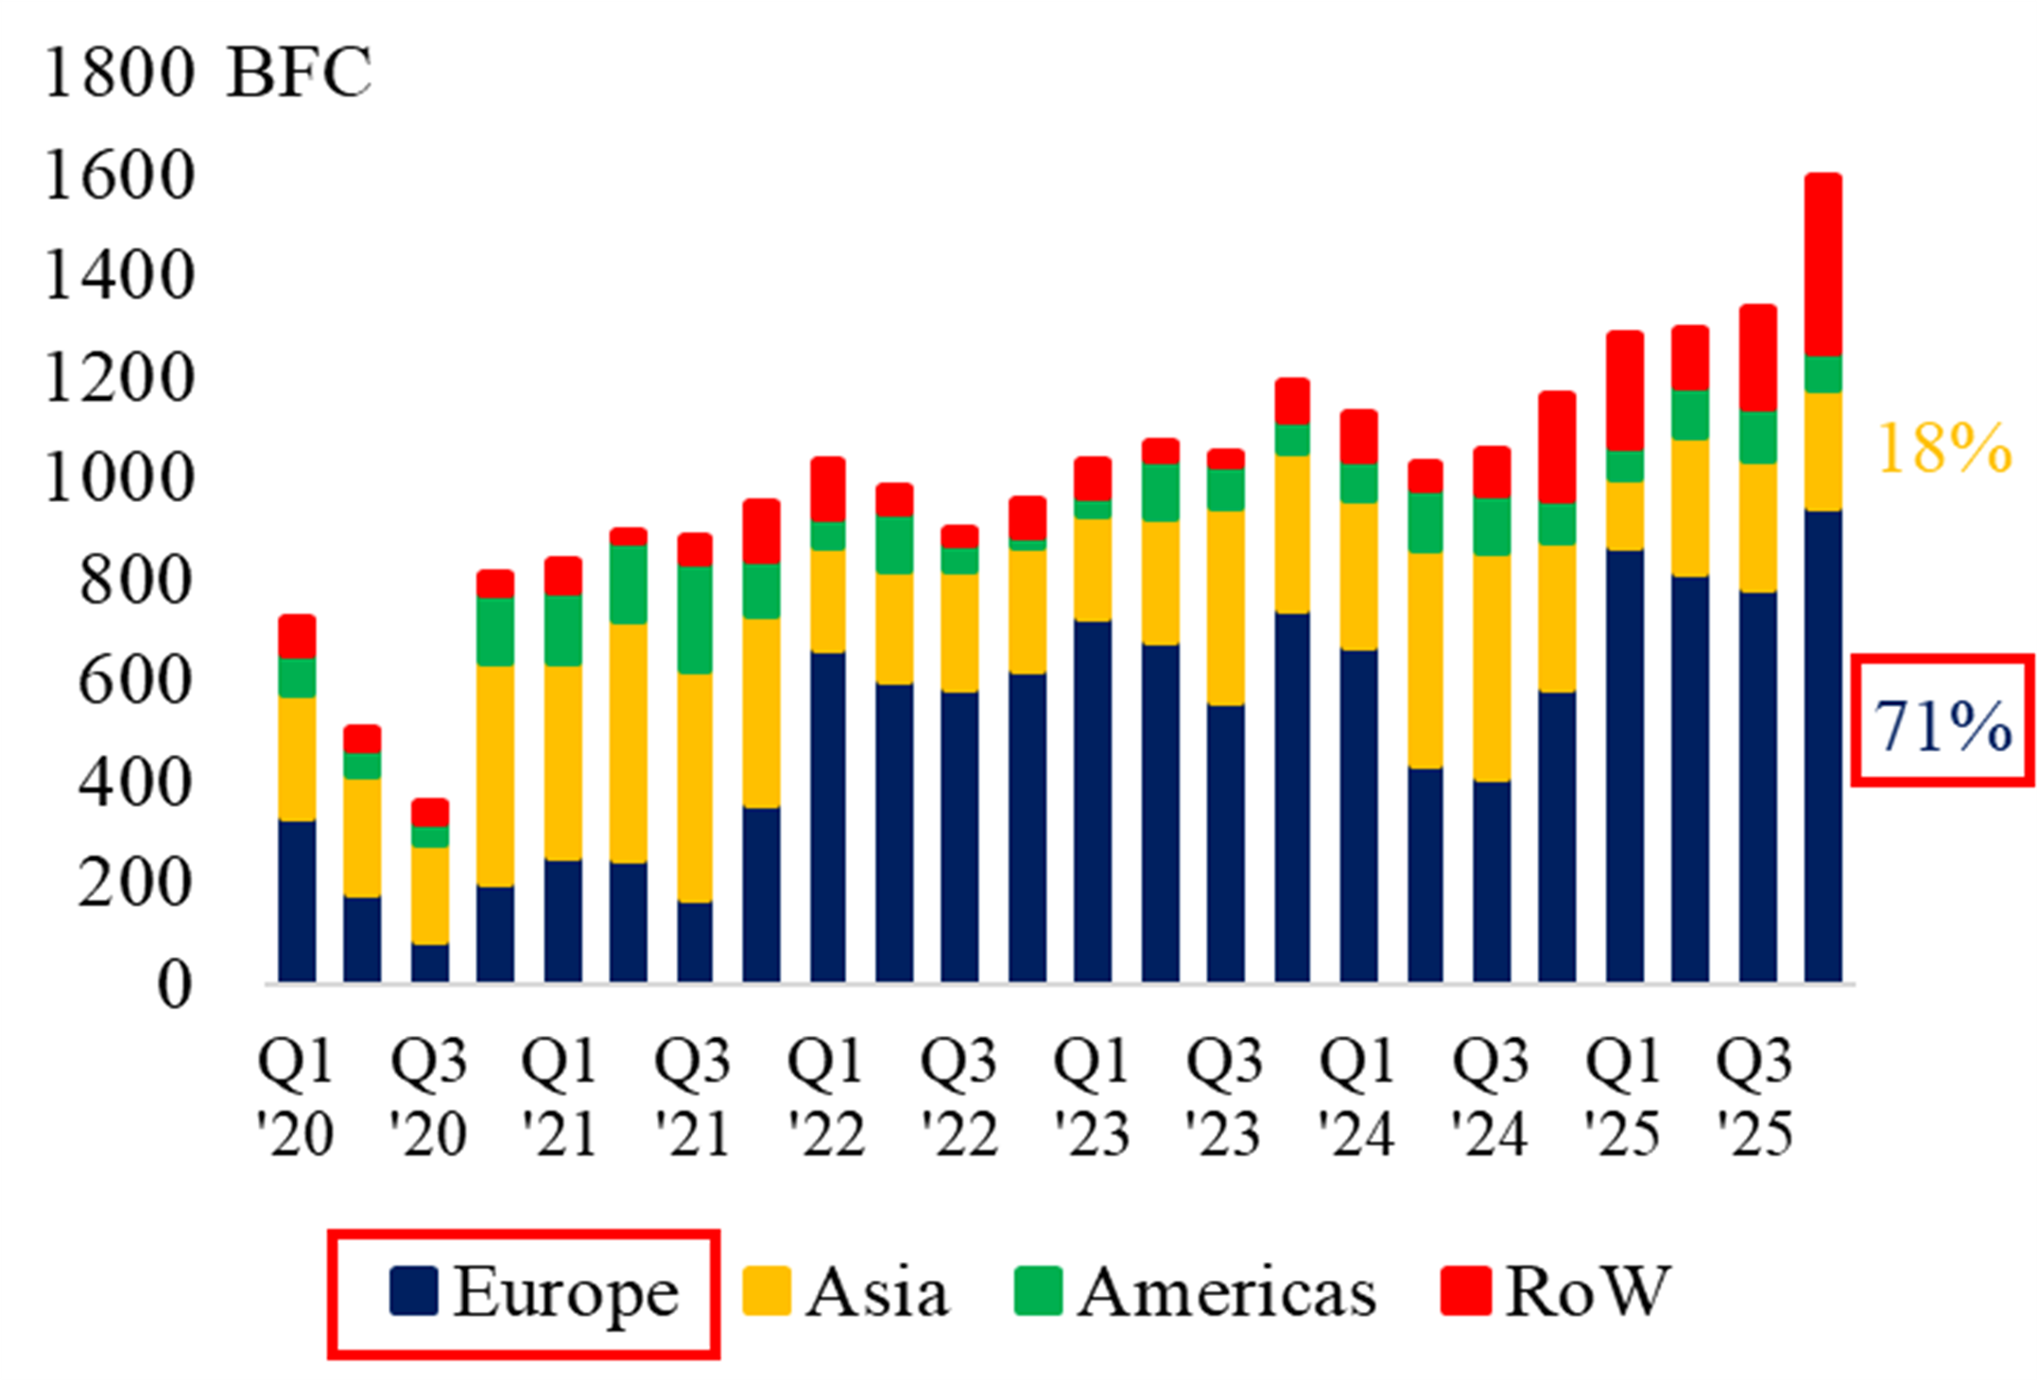
Source: US Energy Information Administration Source: US Energy Information Administration
Exhibit 7 EU Gas Storage (% full) Exhibit 8 EU Gas Demand
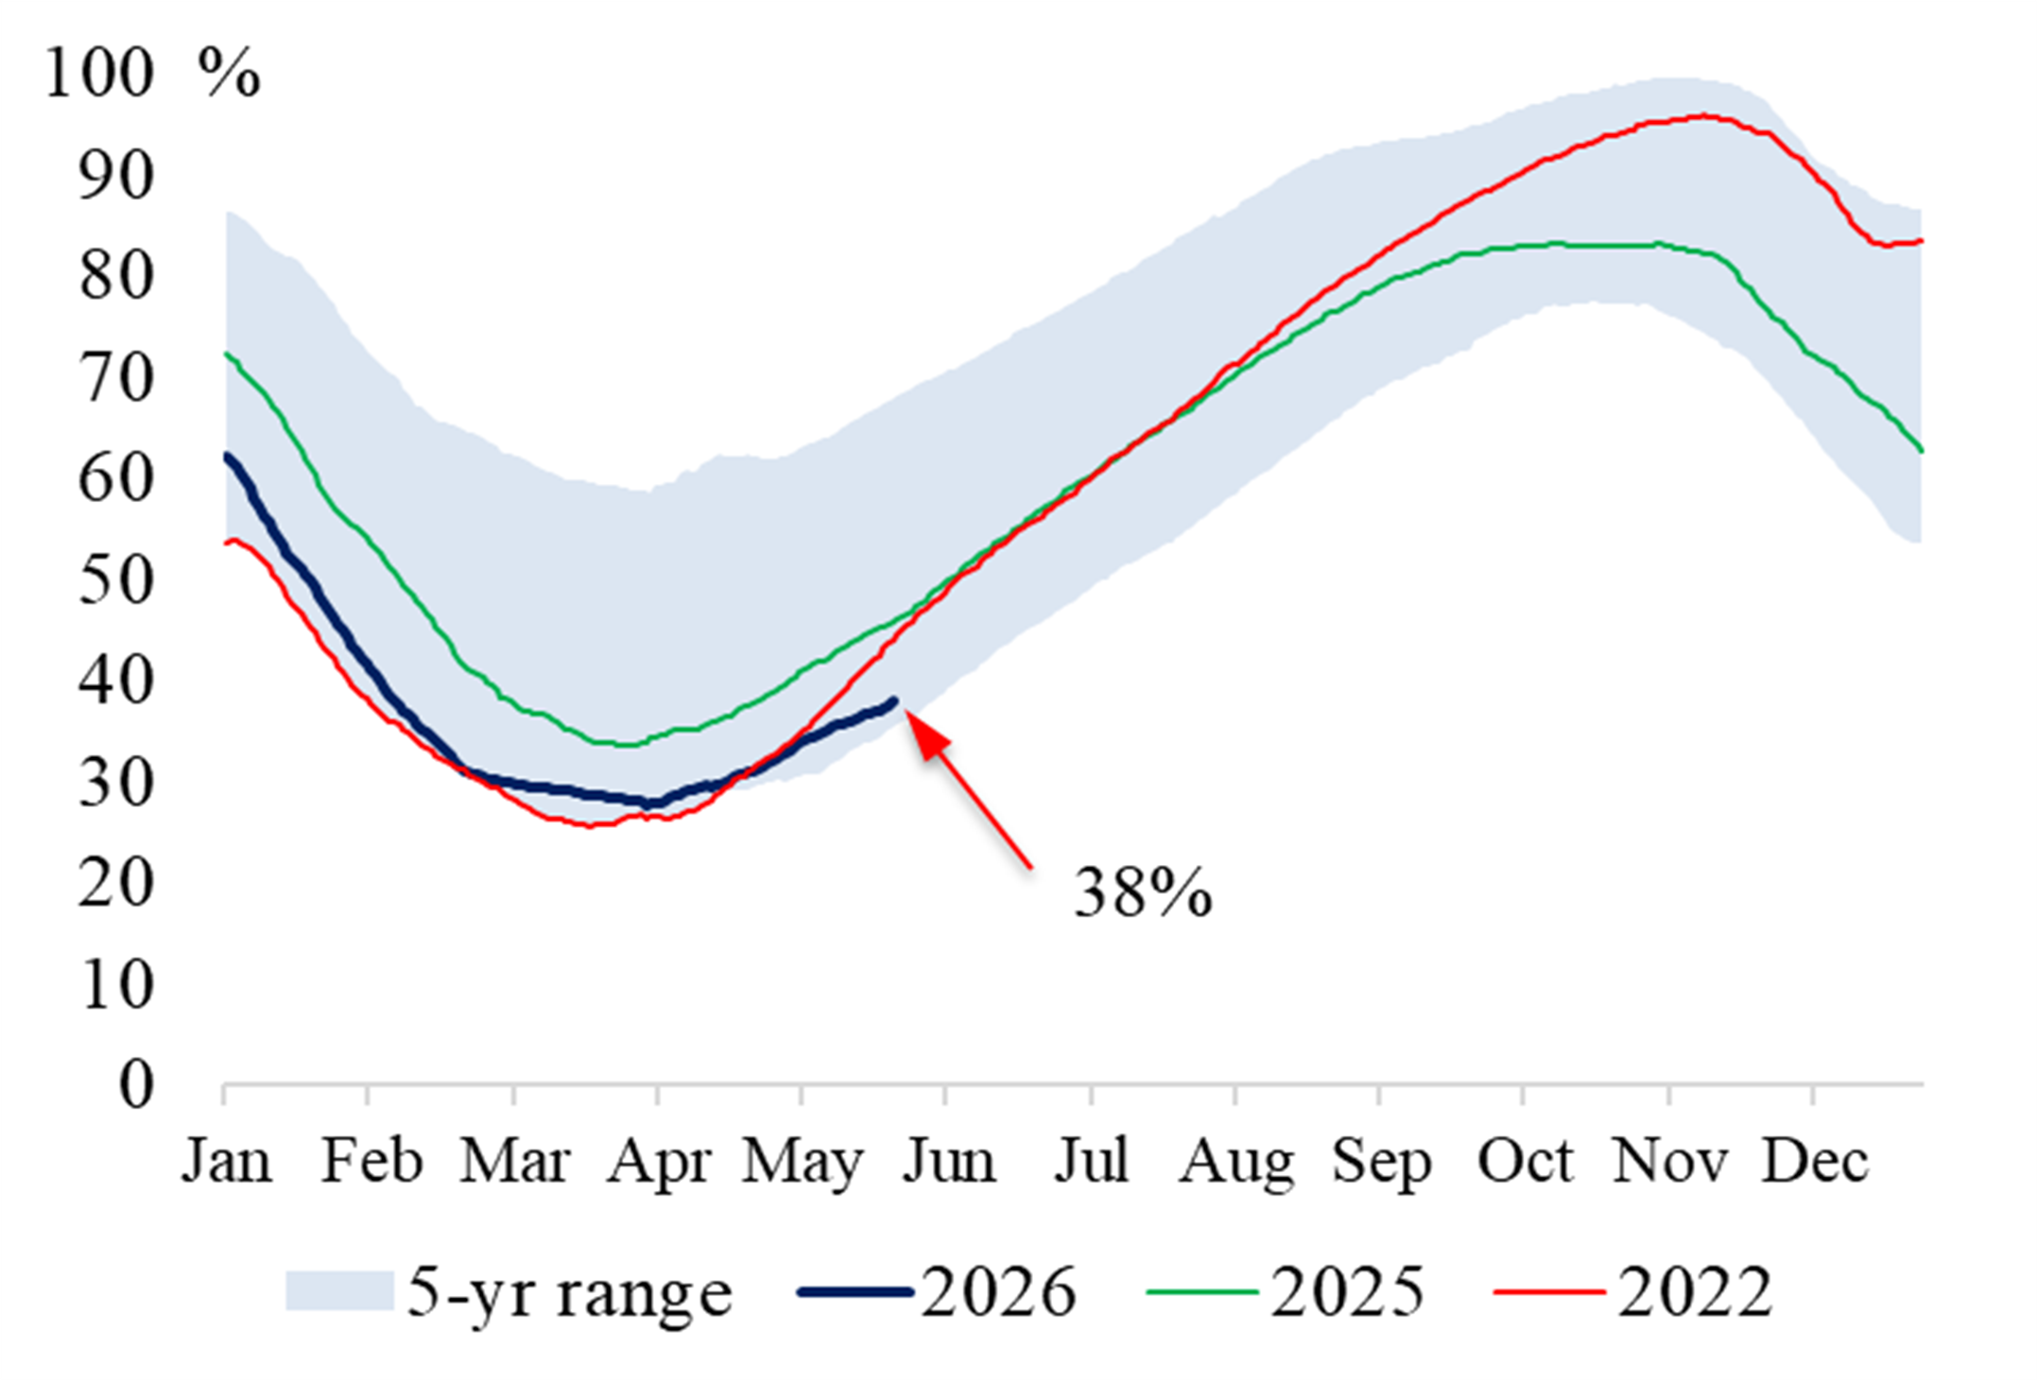
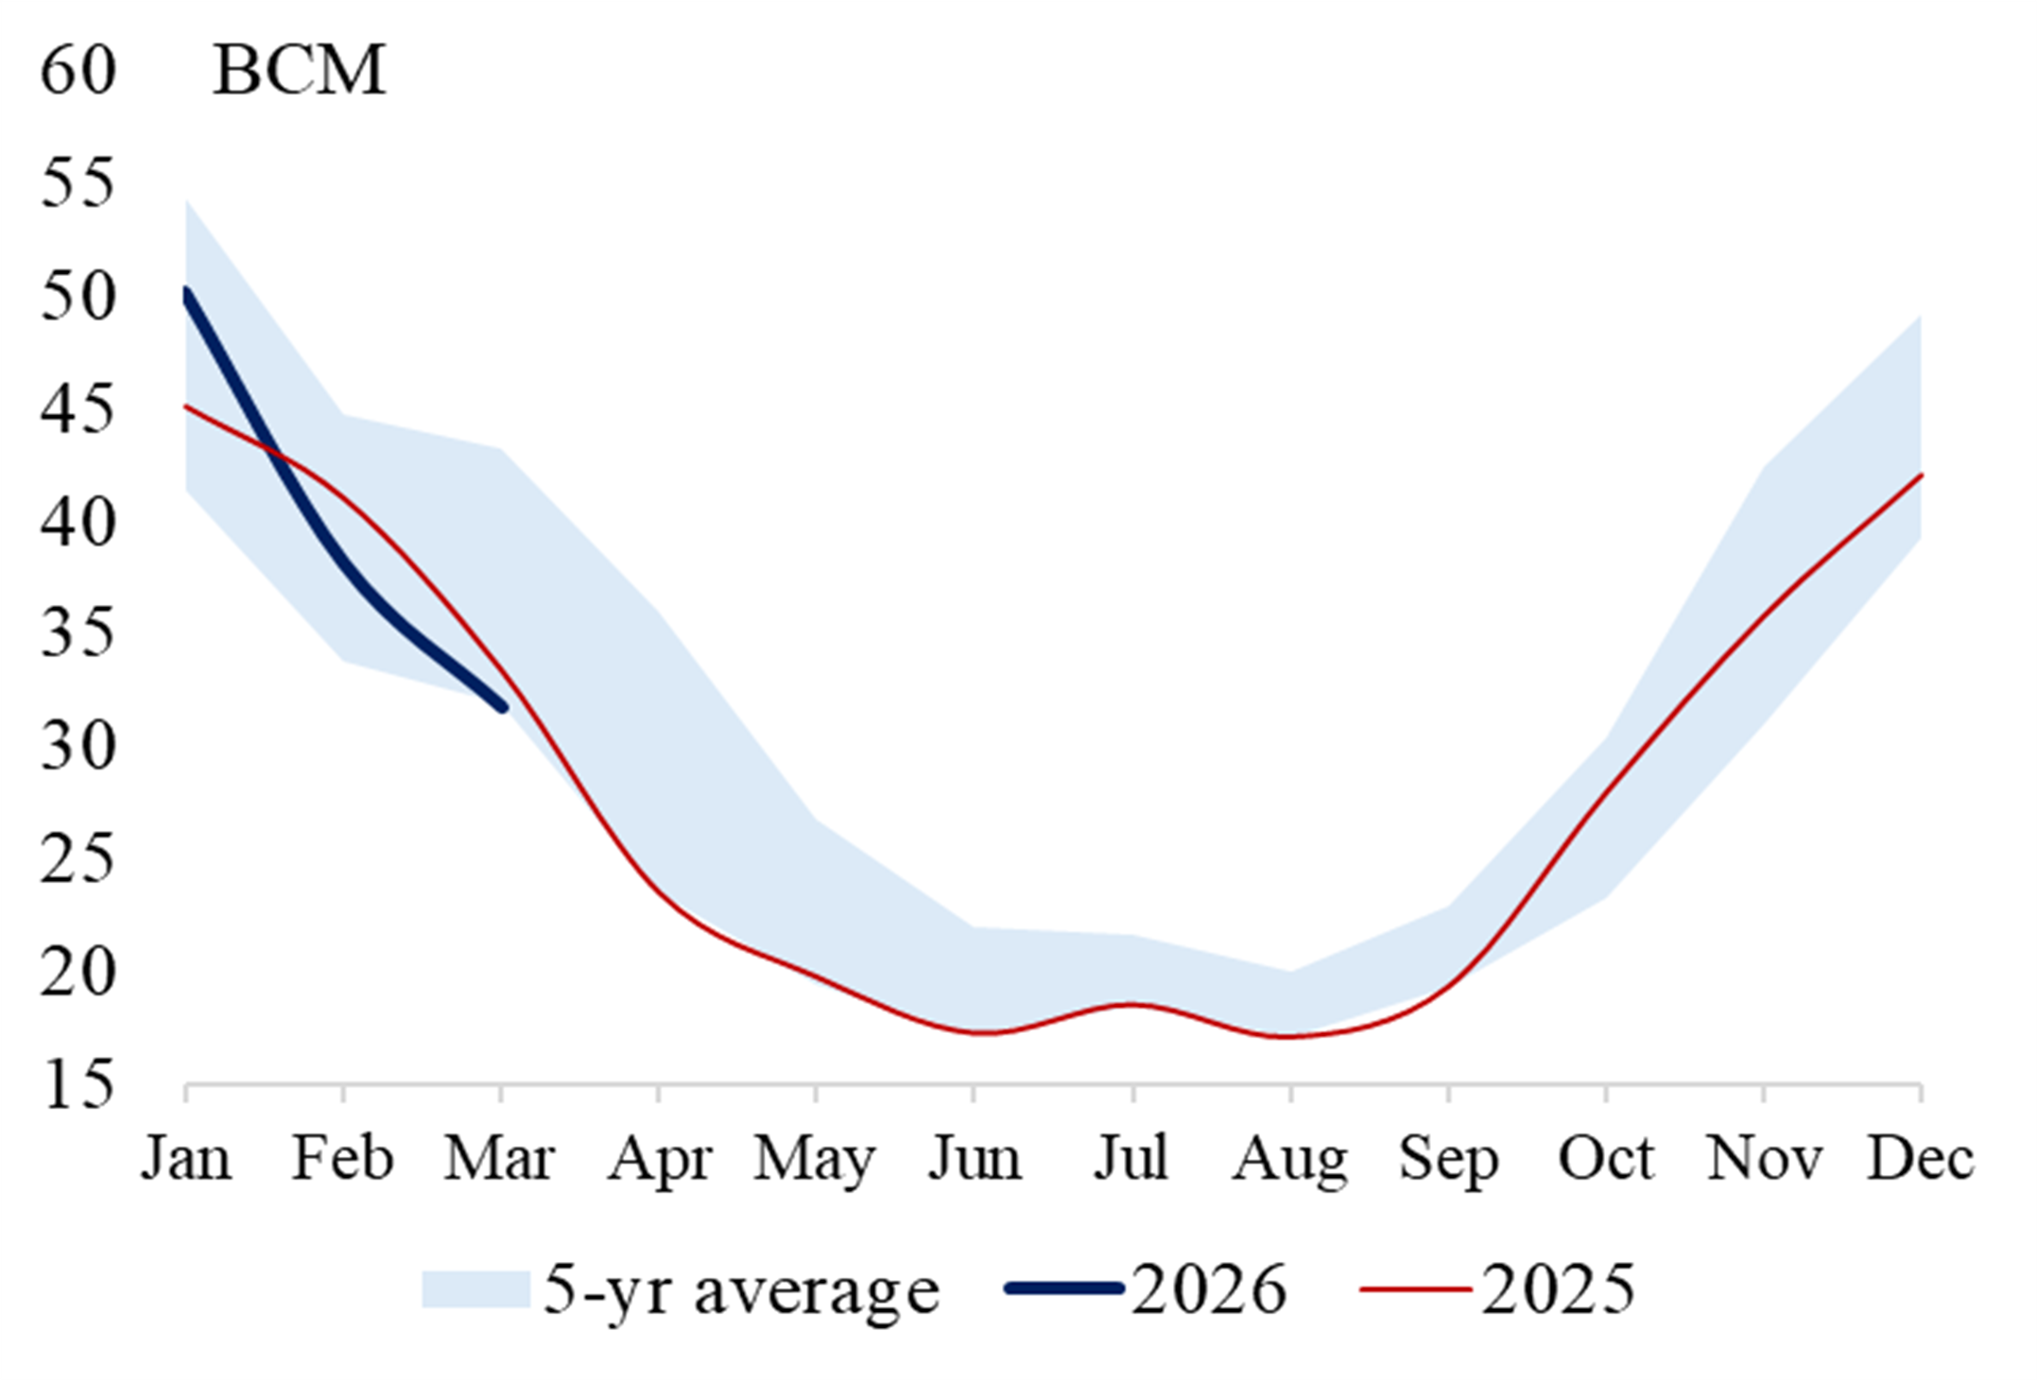
Source: Gas Infrastructure Europe Source: Eurostat
Exhibit 9 EU Quarterly Gas Imports Exhibit 10 EU LNG Imports
by Source by Region
Source: Bruegel Source: Bruegel
Global Electrification Trends (Power Demand in TWh)
Exhibit 11 Europe Electricity Demand Exhibit 12 USA Electricity Demand
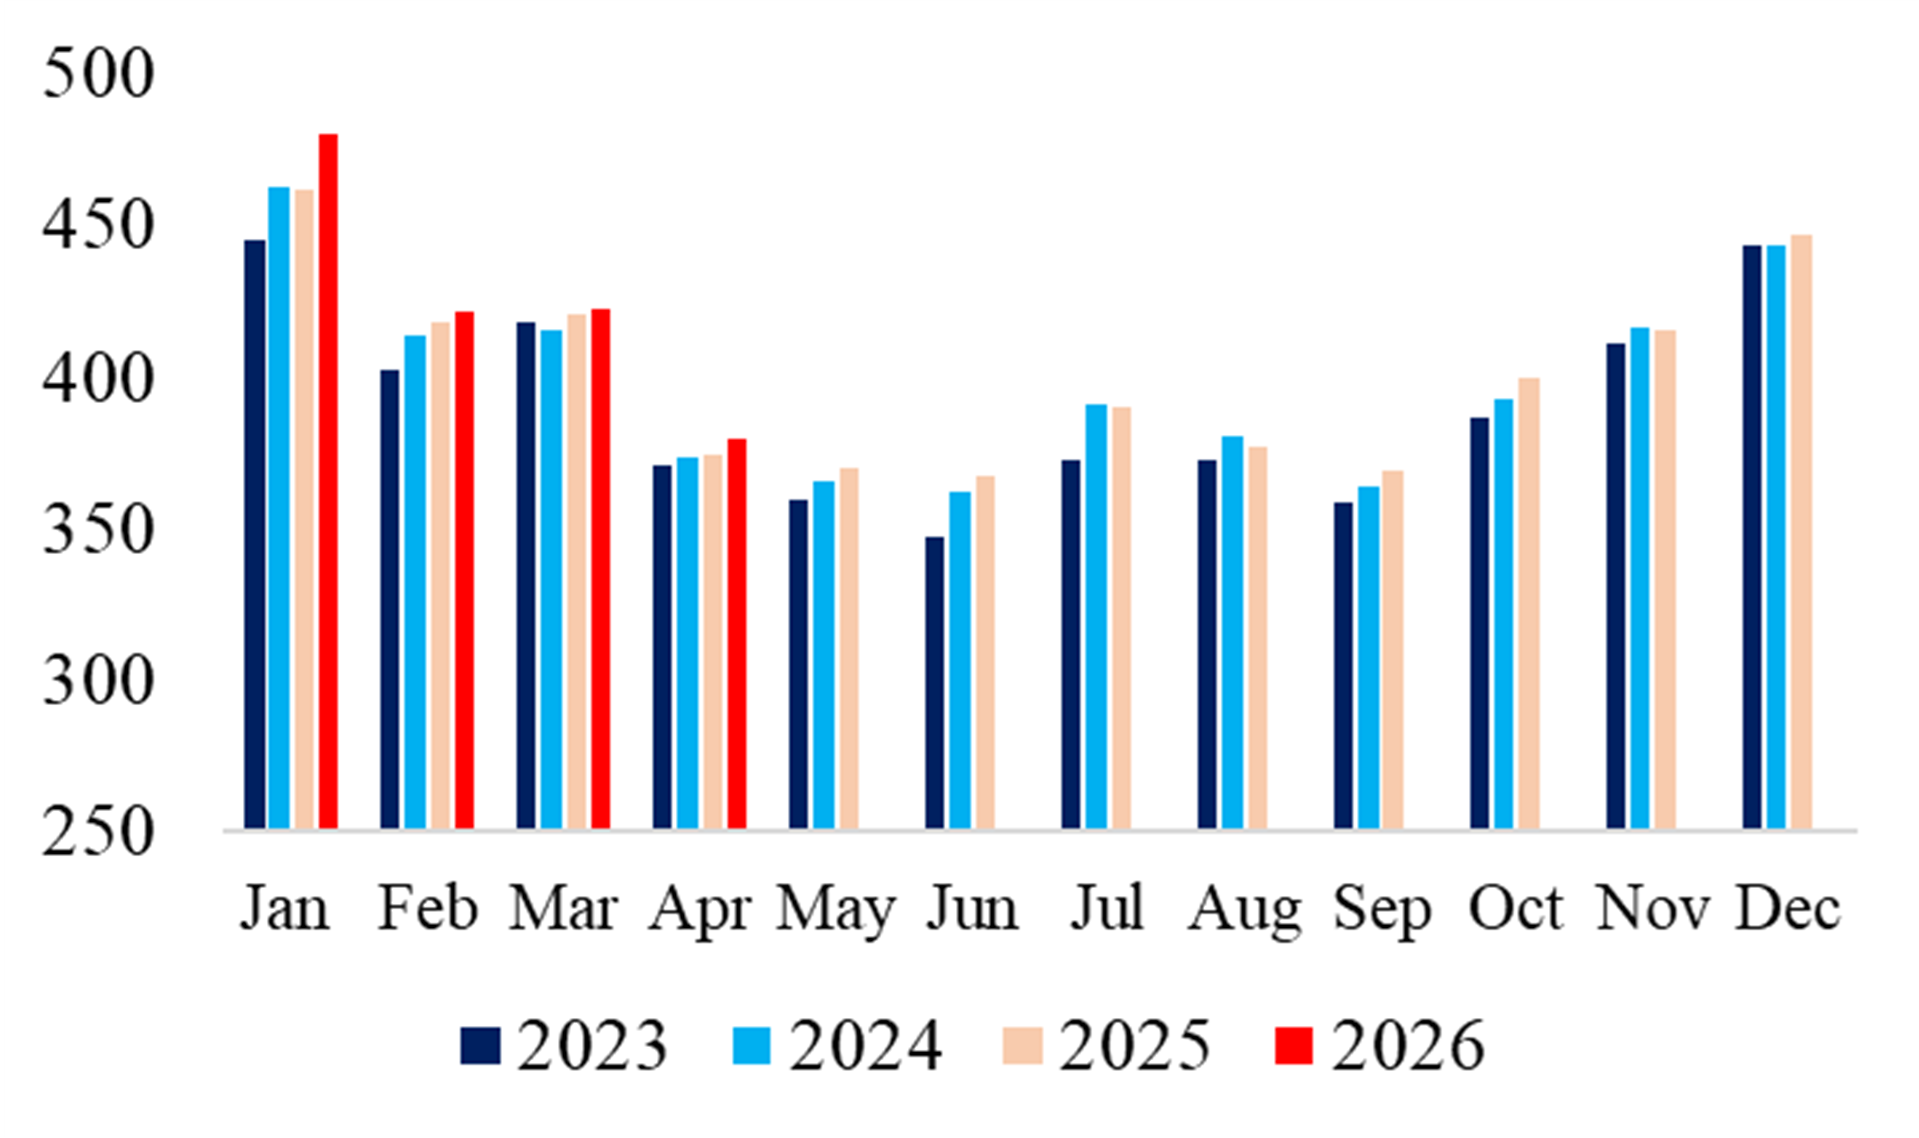
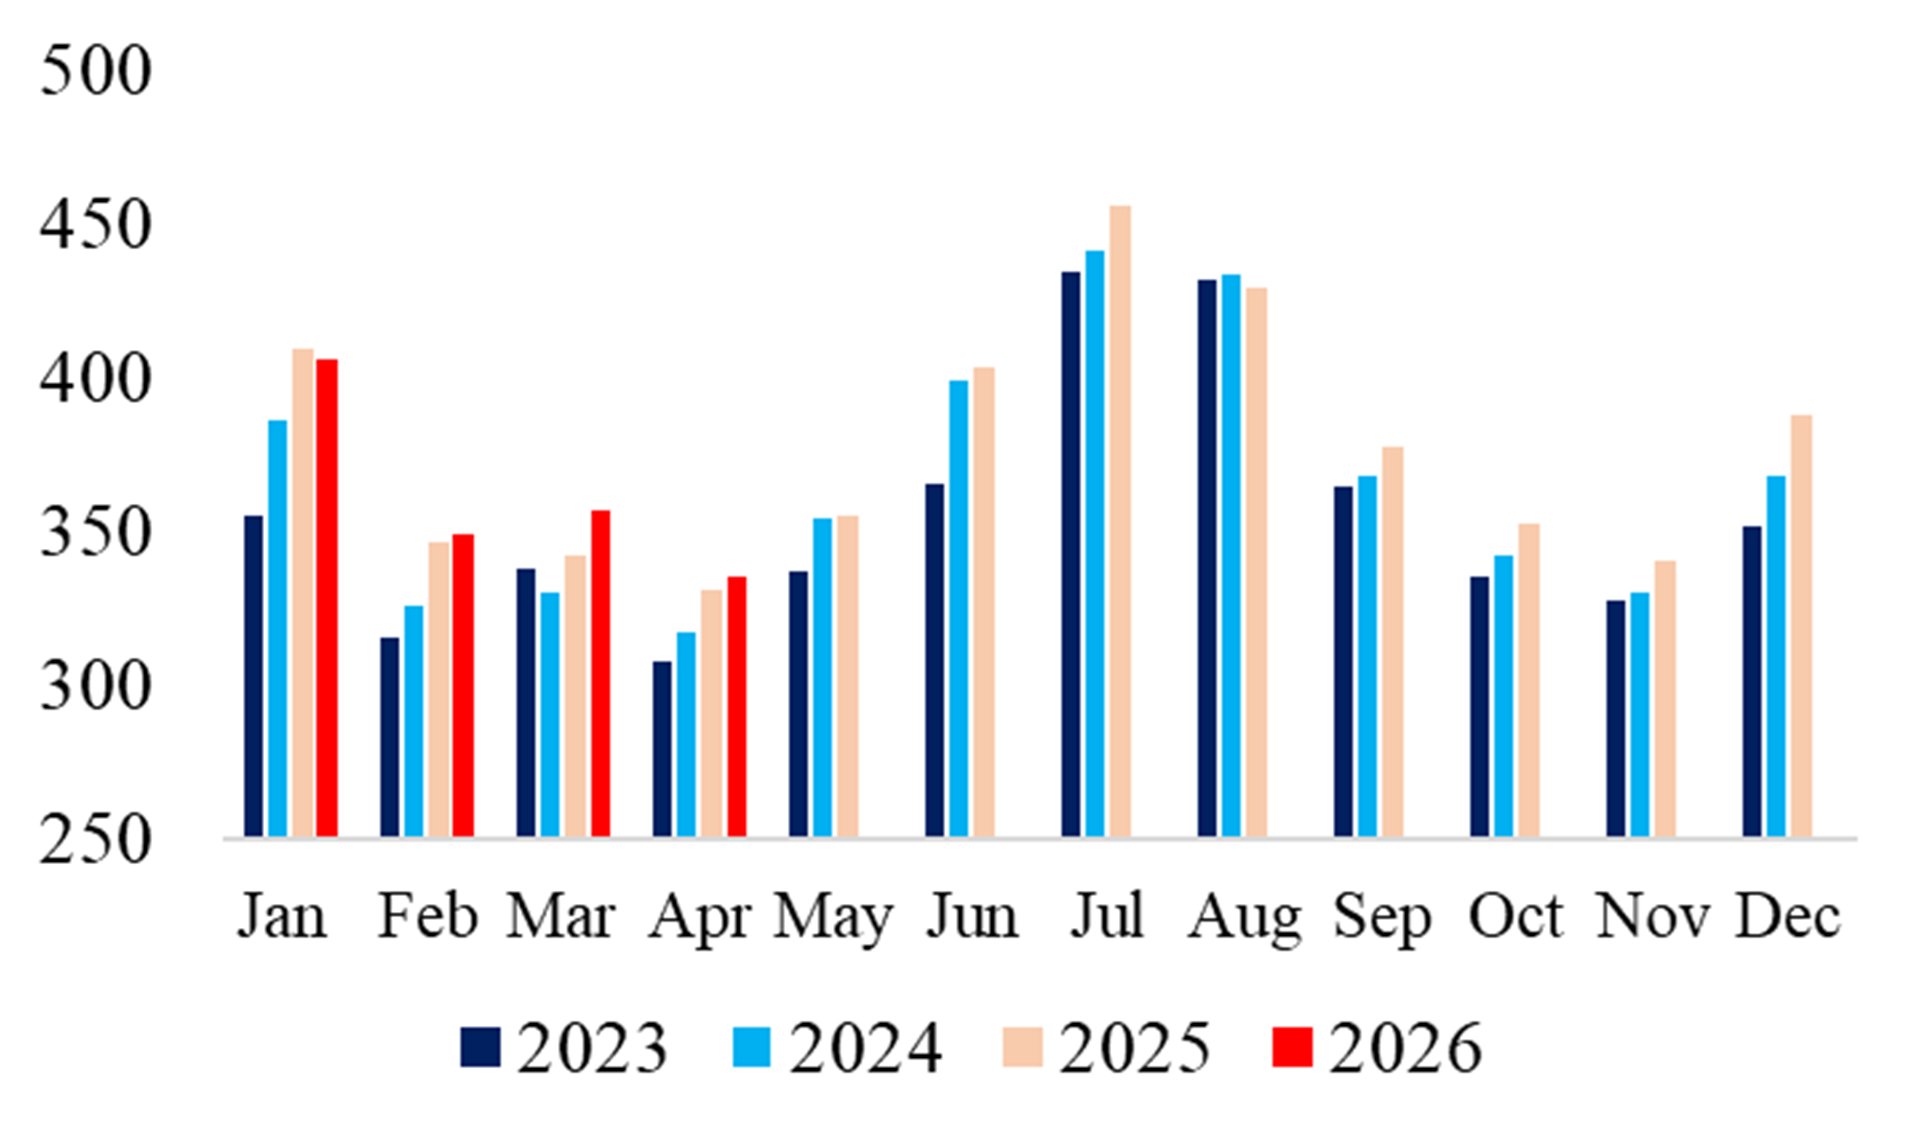
Exhibit 13 Türkiye Electricity Demand Exhibit 14 LatAm Electricity Demand
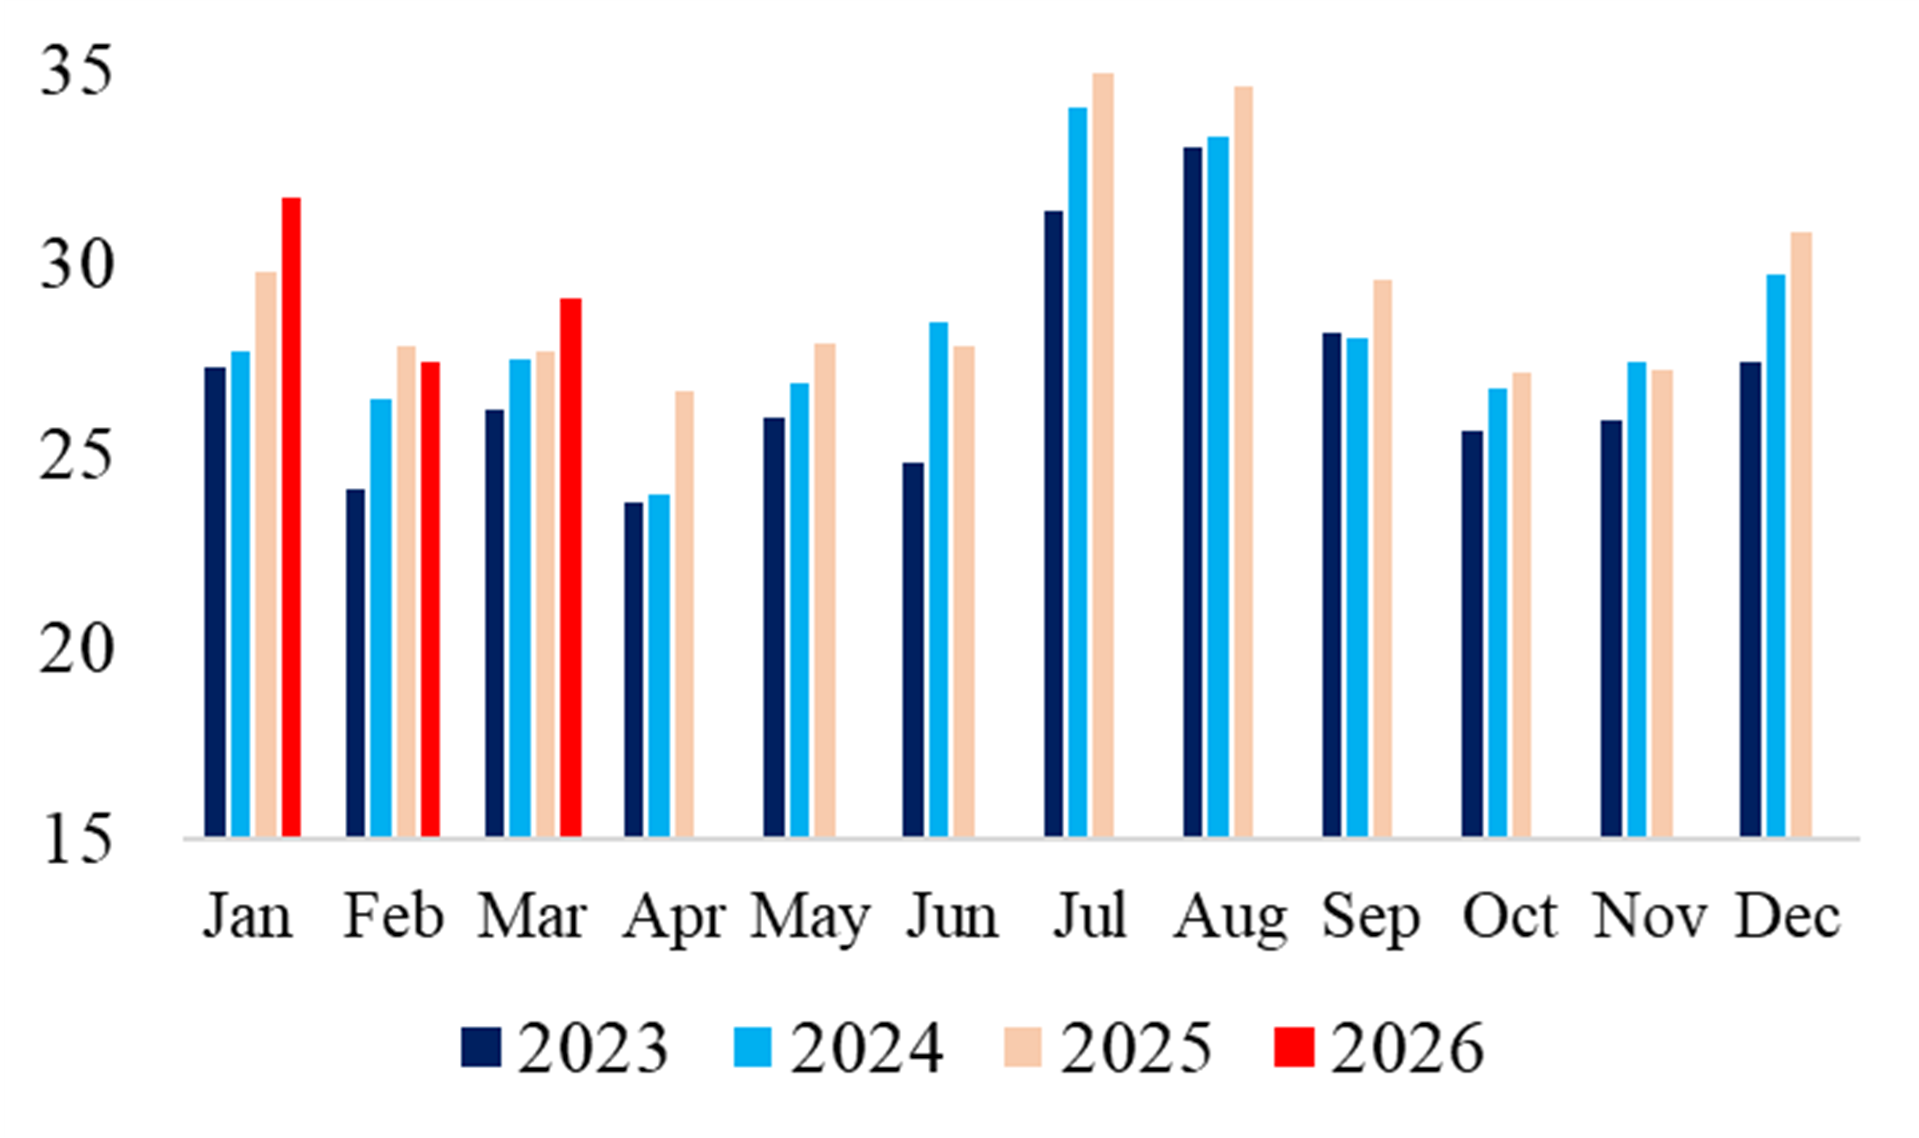
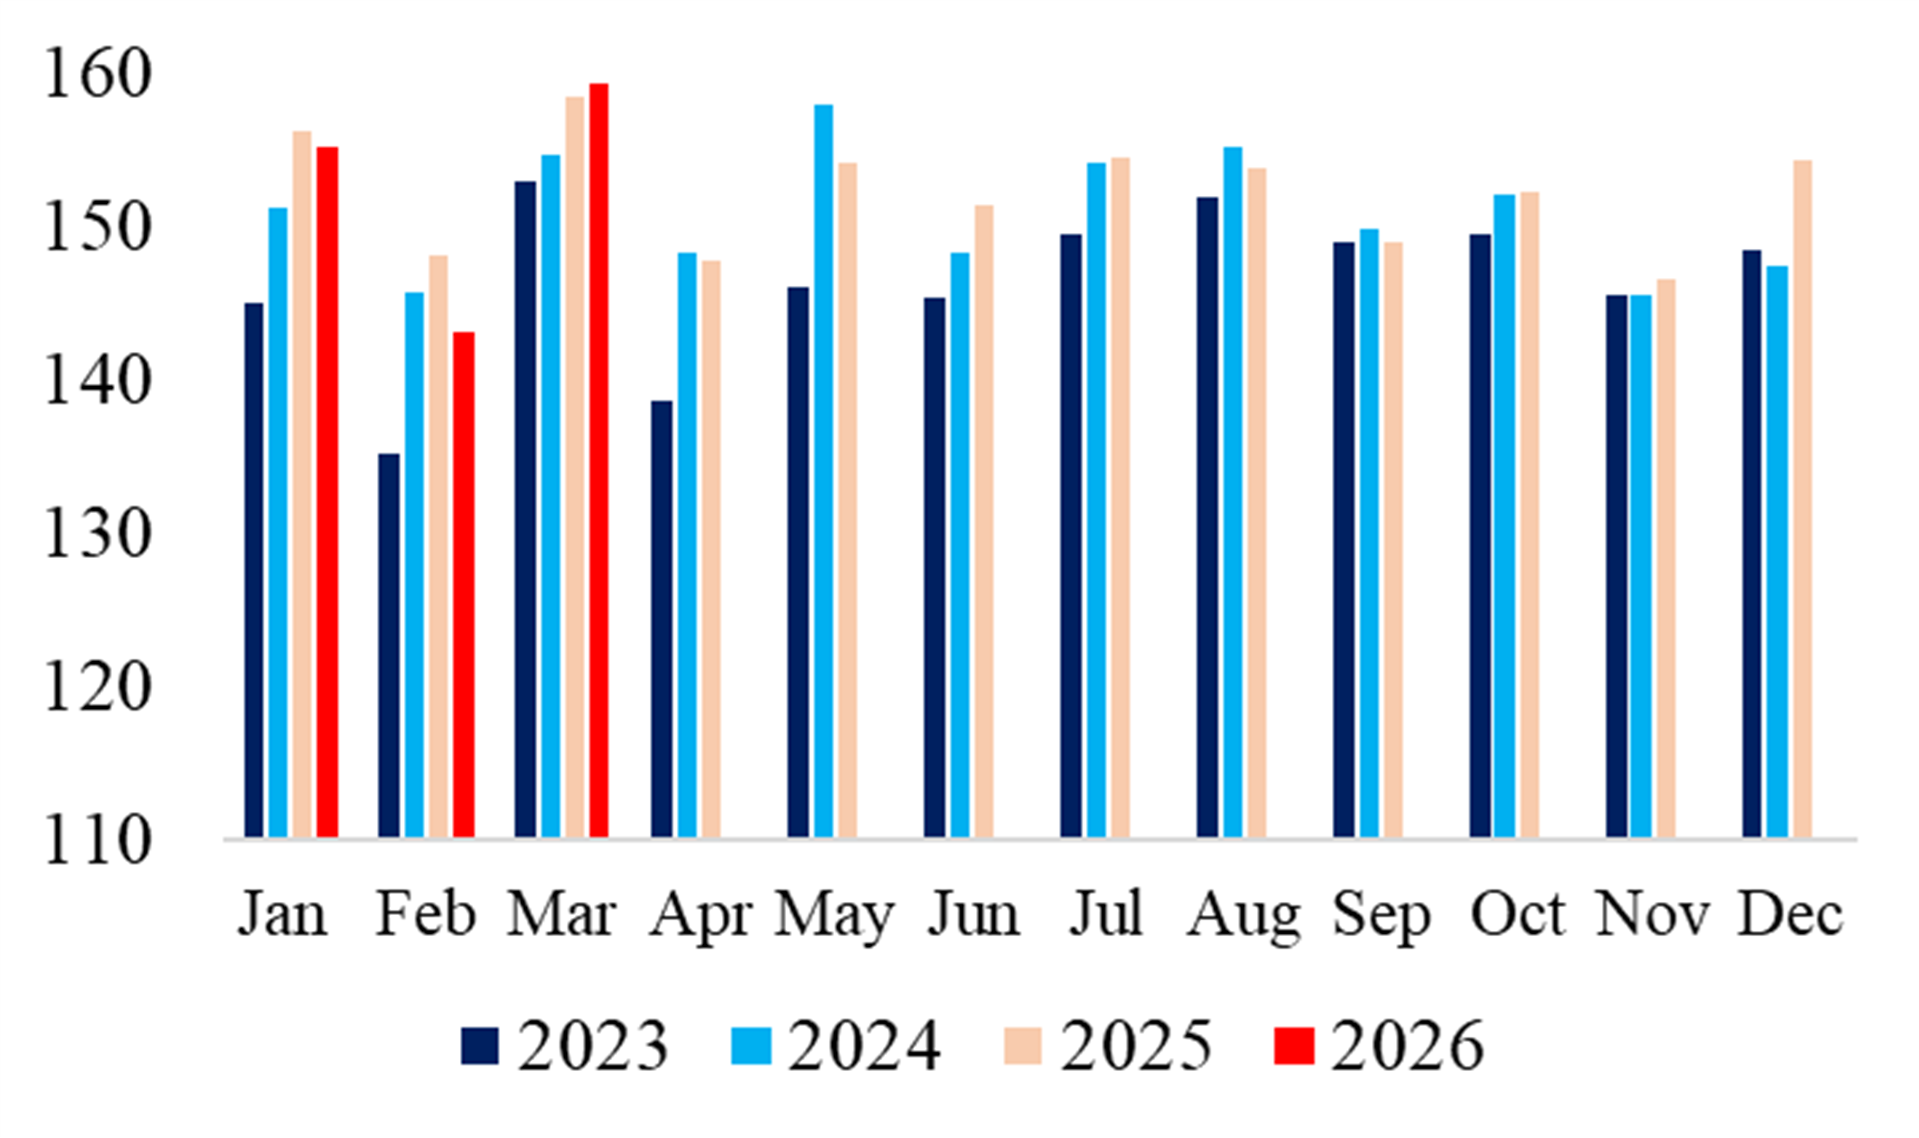
Exhibit 15 China Electricity Demand Exhibit 16 Japan Electricity Demand
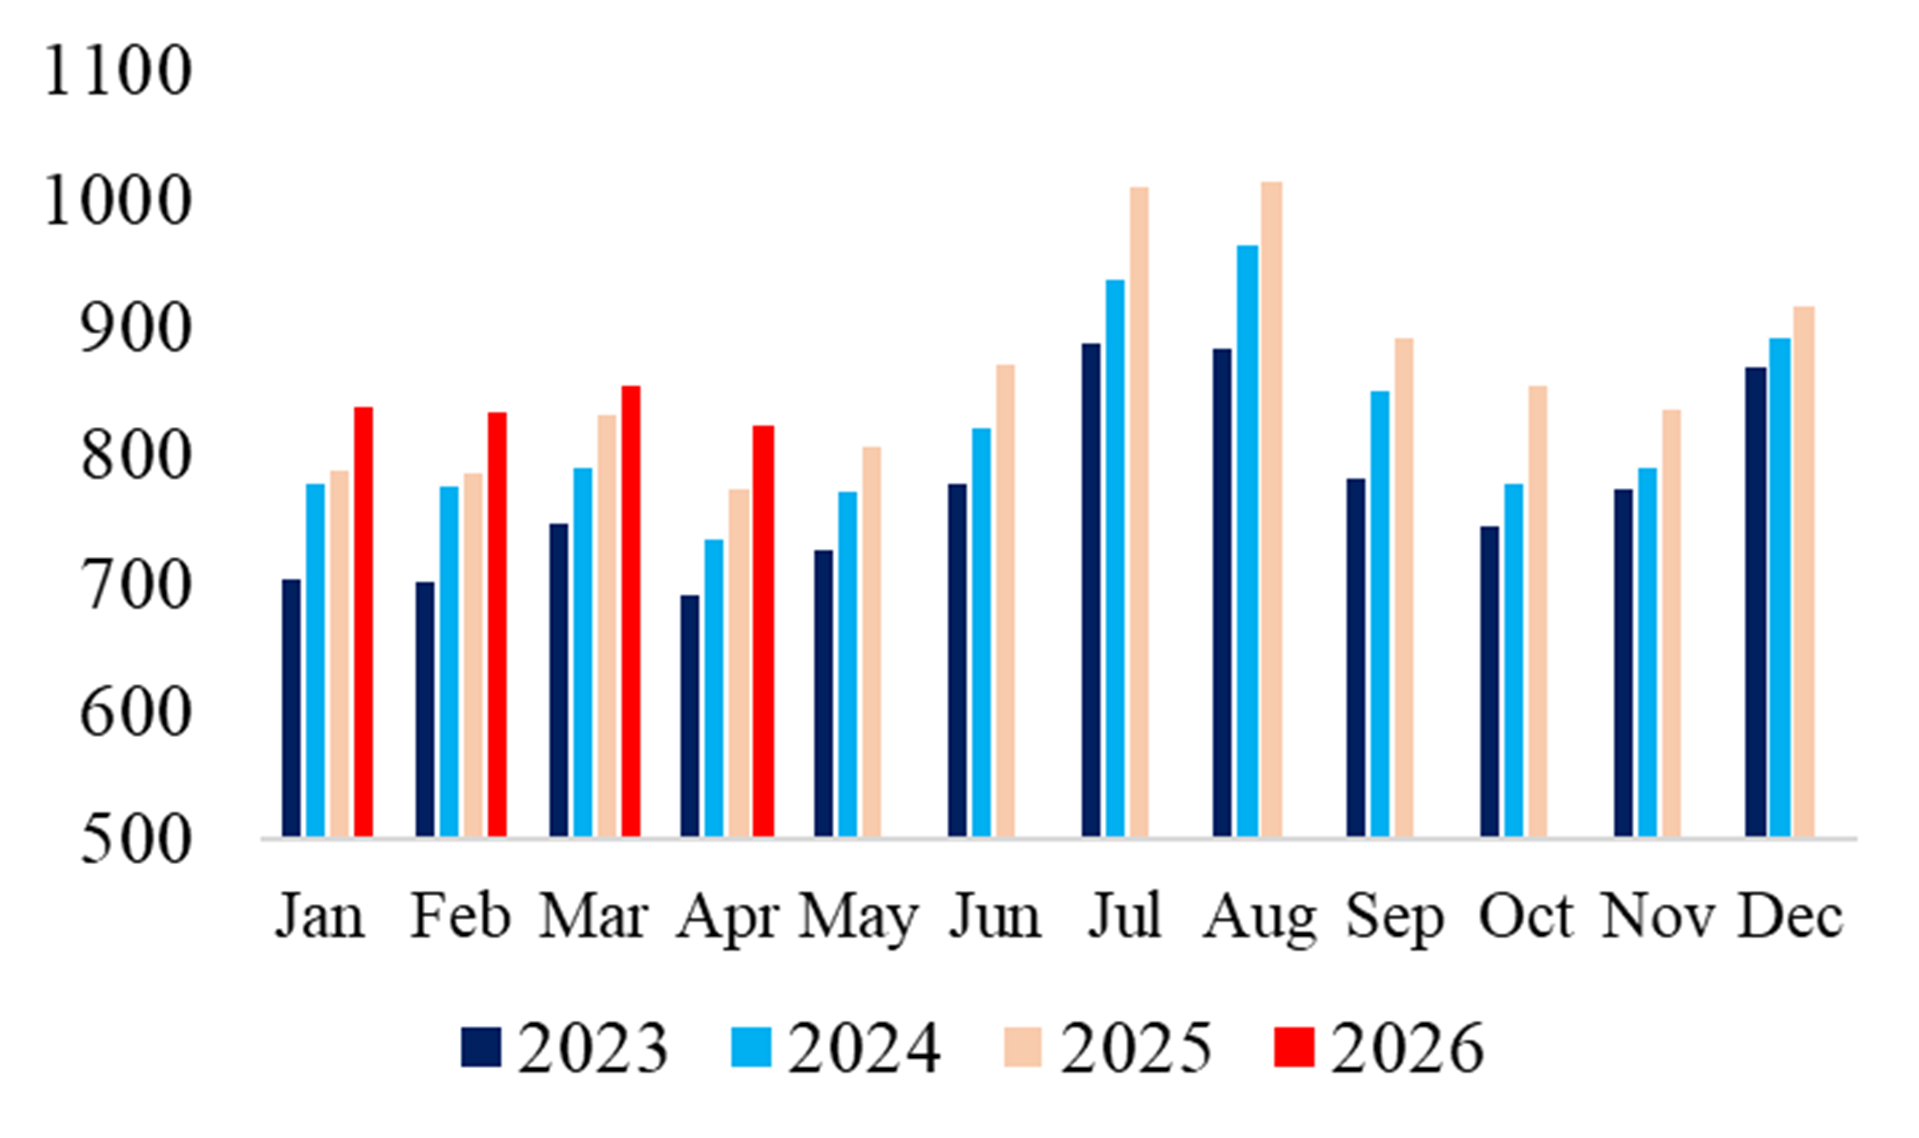
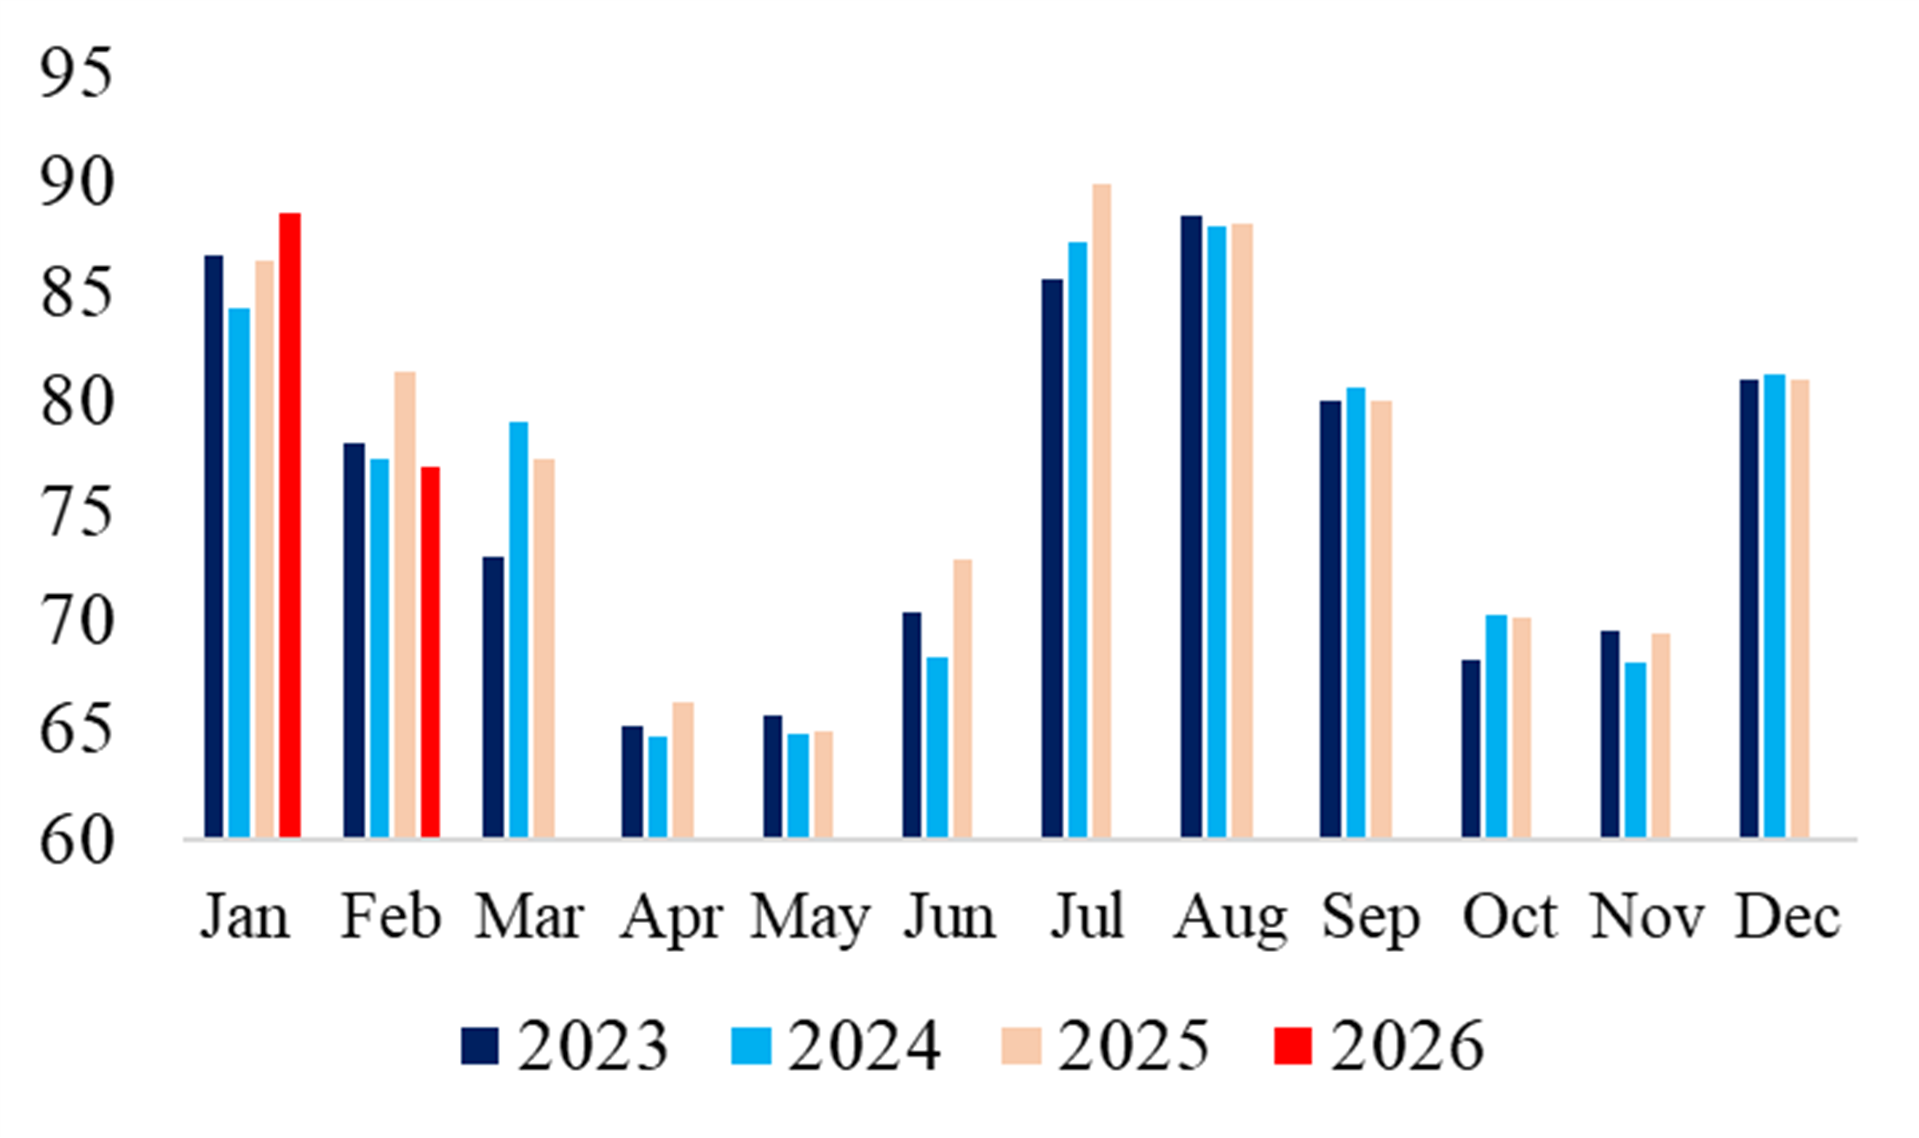
Exhibit 17 India Electricity Demand Exhibit 18 World Electricity Demand
Source: EMBER
Power Tracker: Changing Fuel Mix and 3 Biggest Sources of Power Generation
EUROPE
Exhibit 19 Europe: Biggest Source of Electricity in Each Country
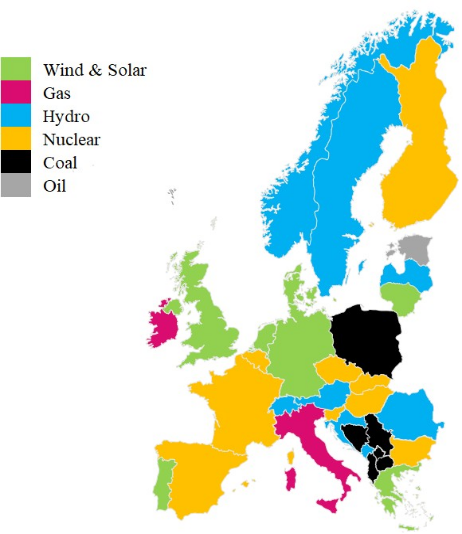
Exhibit 20 Power Generation Exhibit 21 Share of Wind & Solar (%)
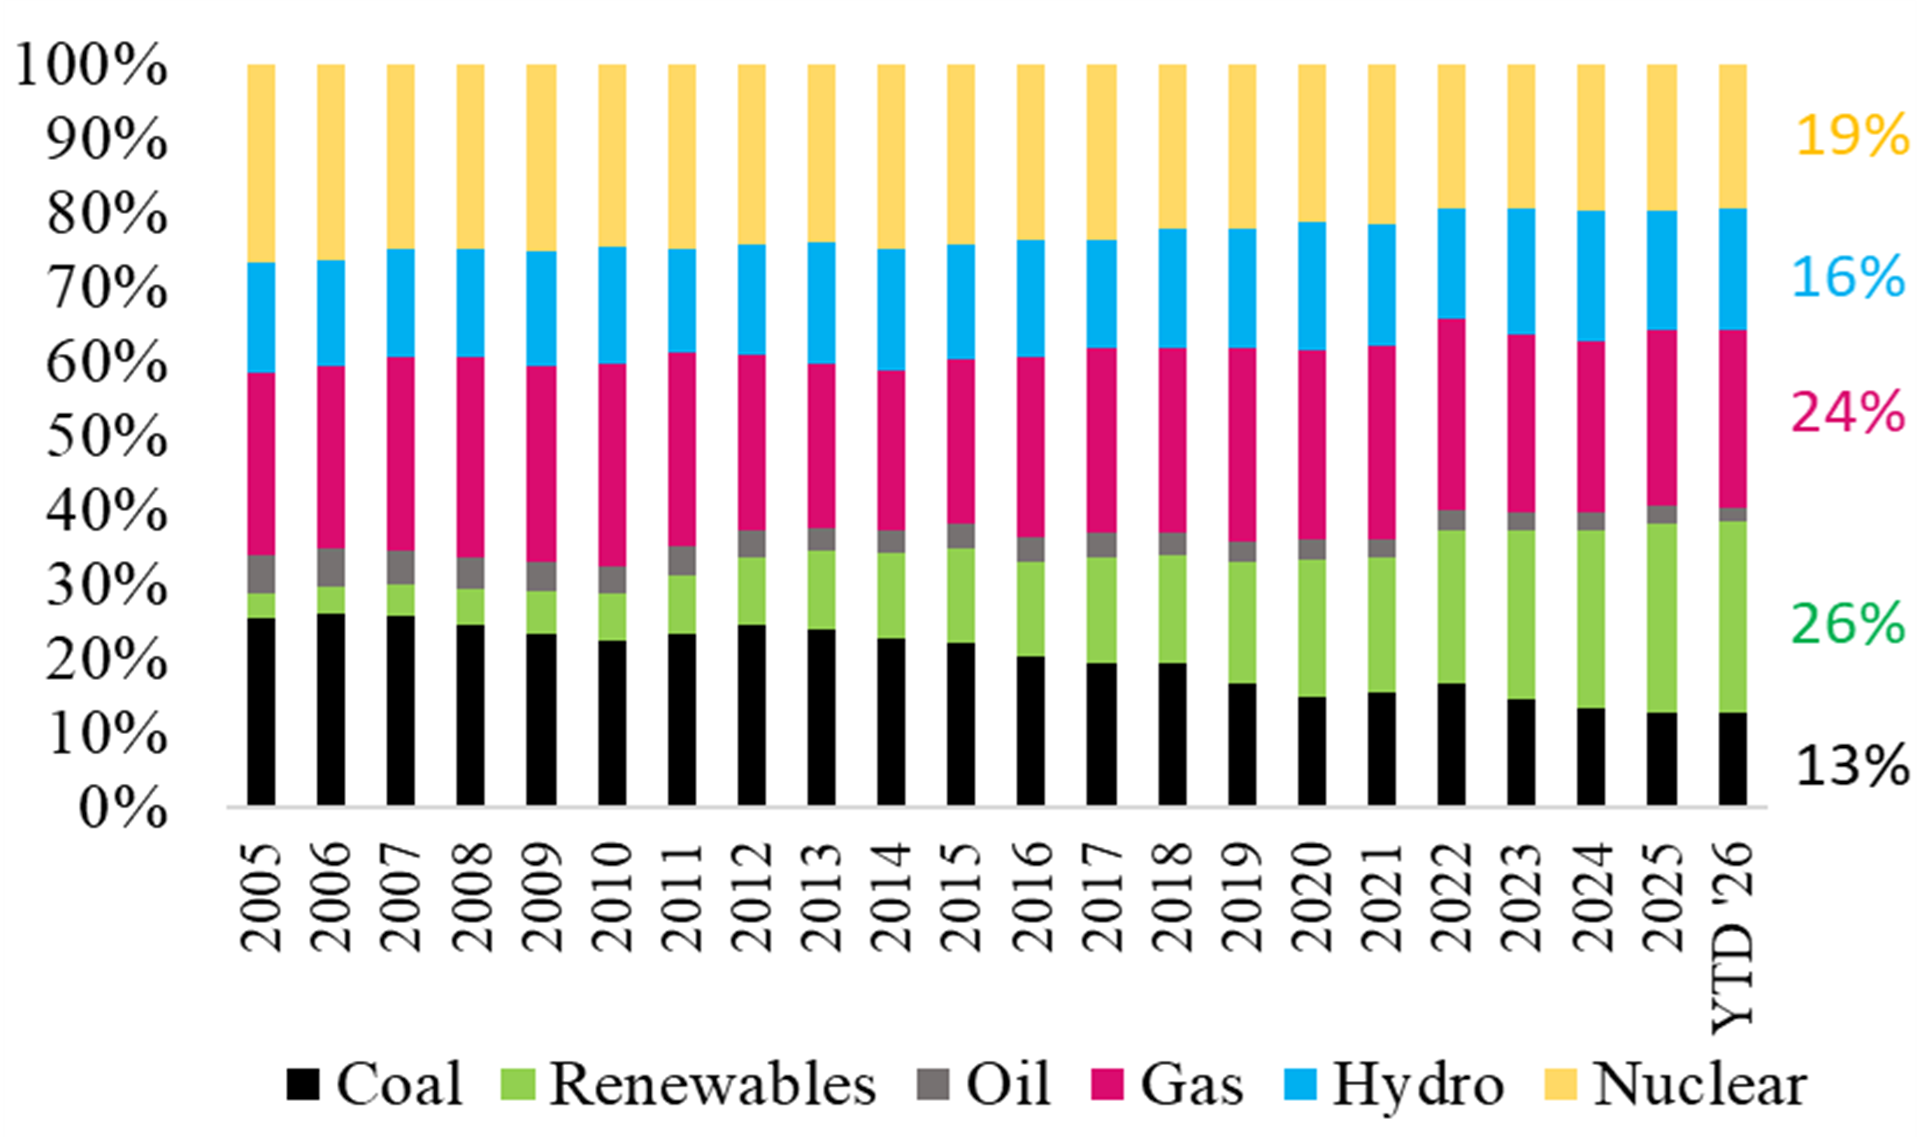
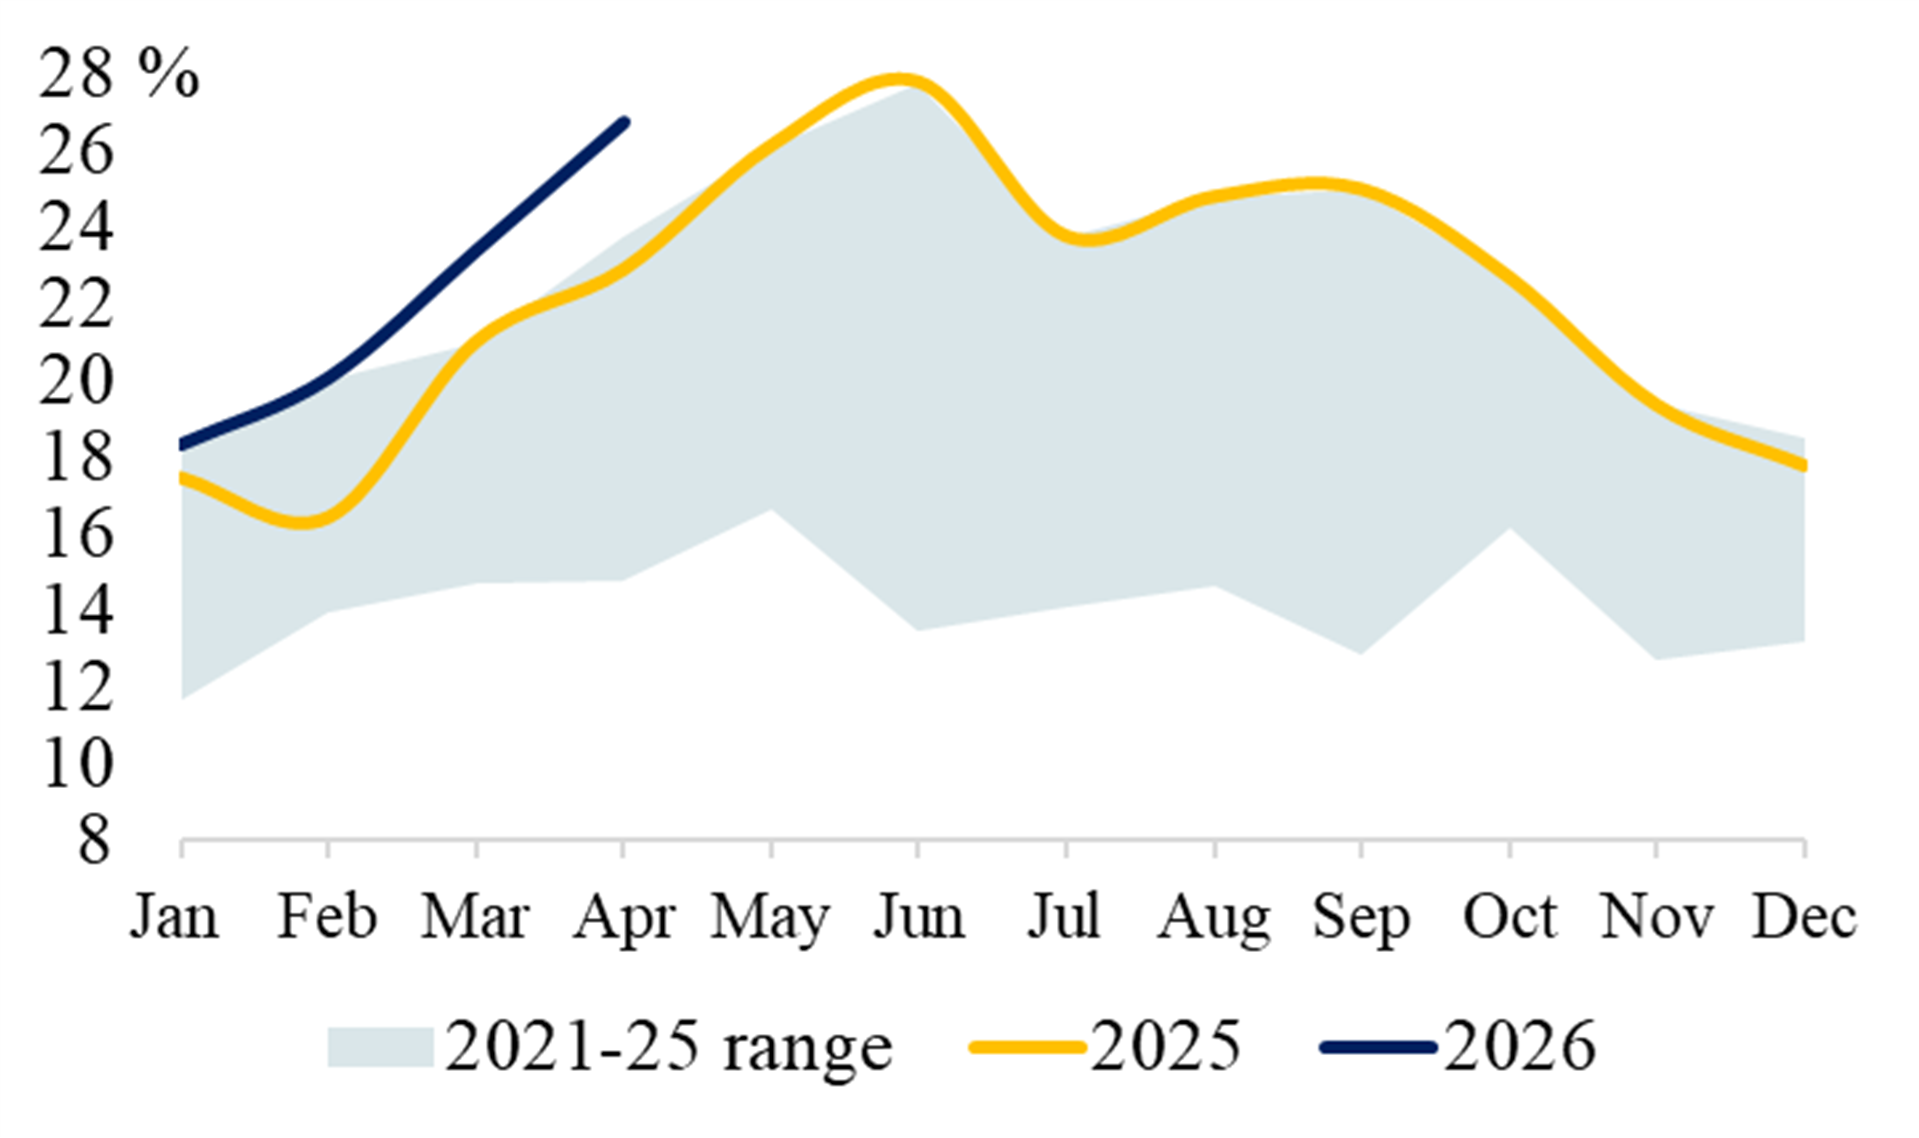
Exhibit 22 Share of Gas (%) Exhibit 23 Share of Nuclear (%)
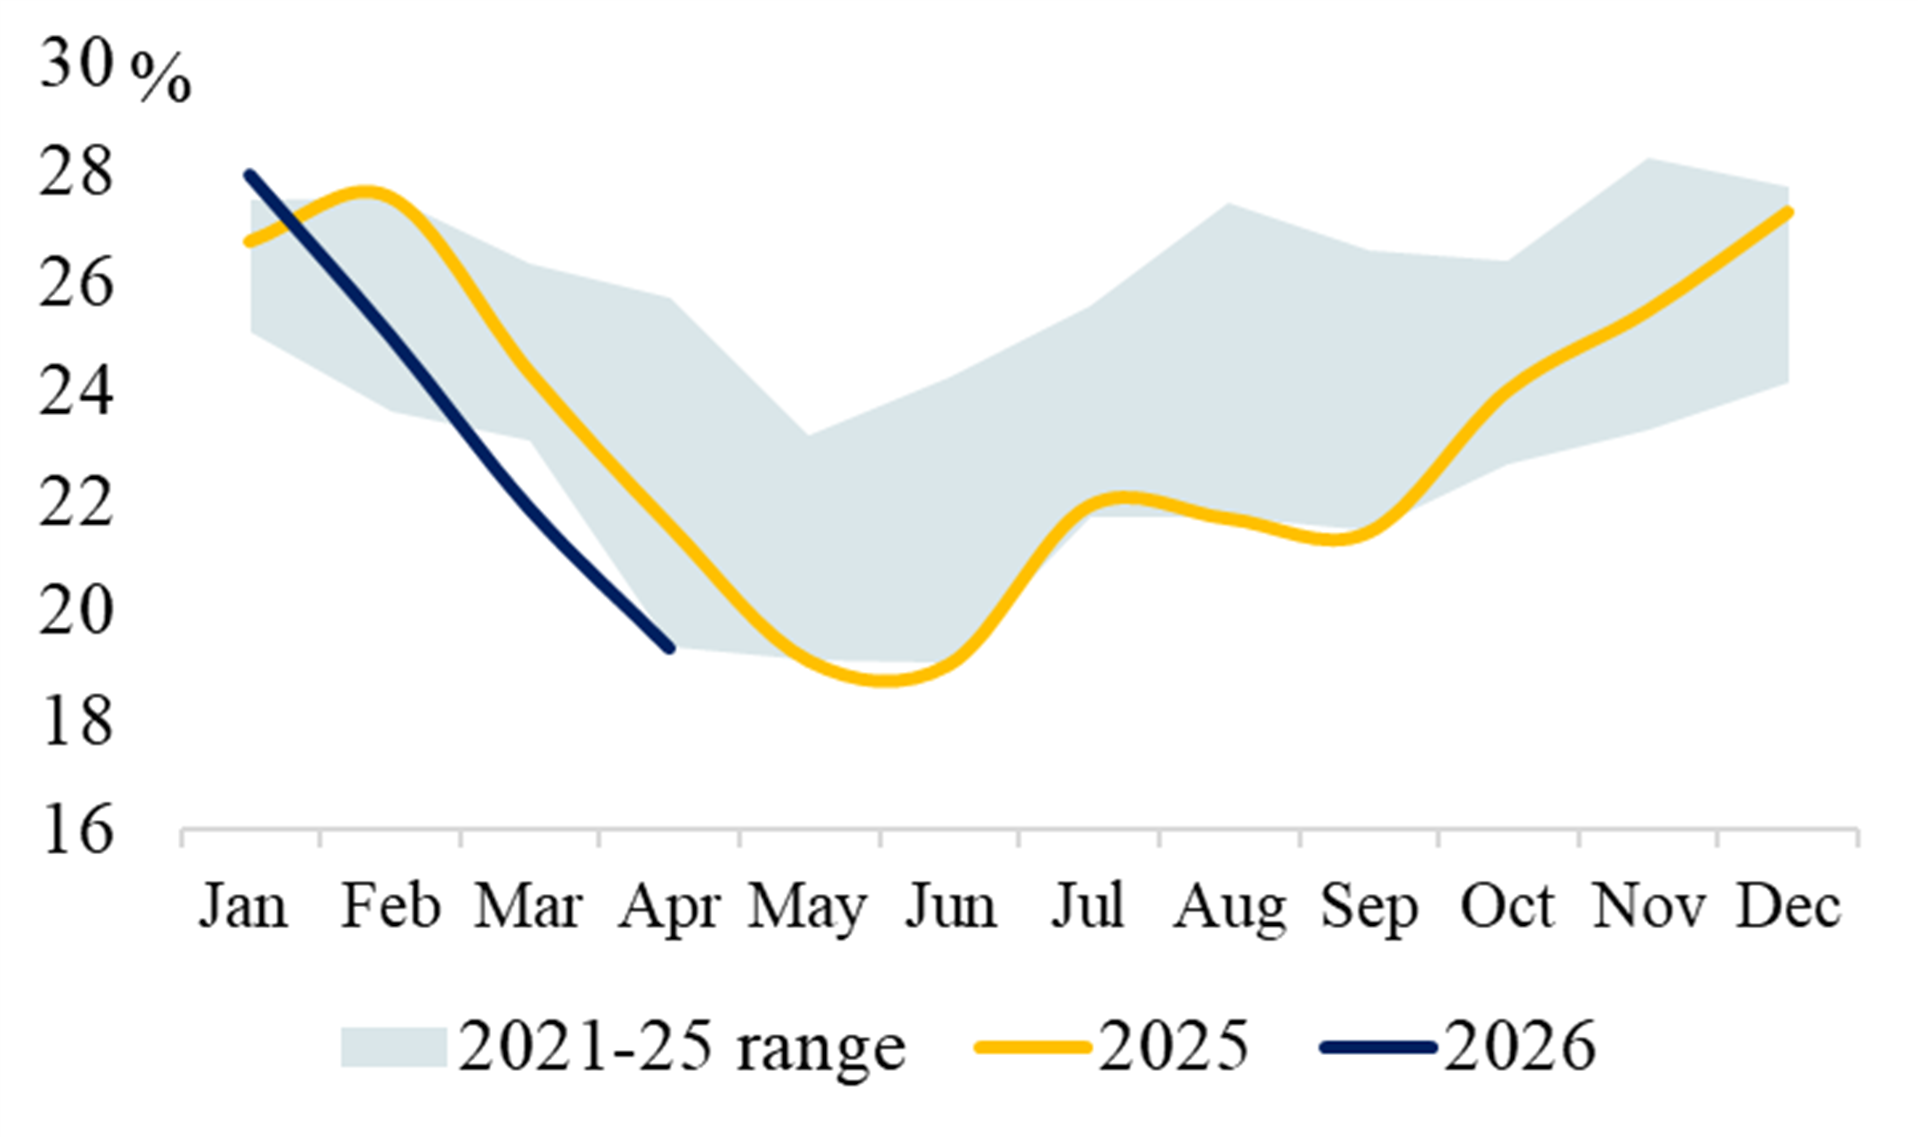
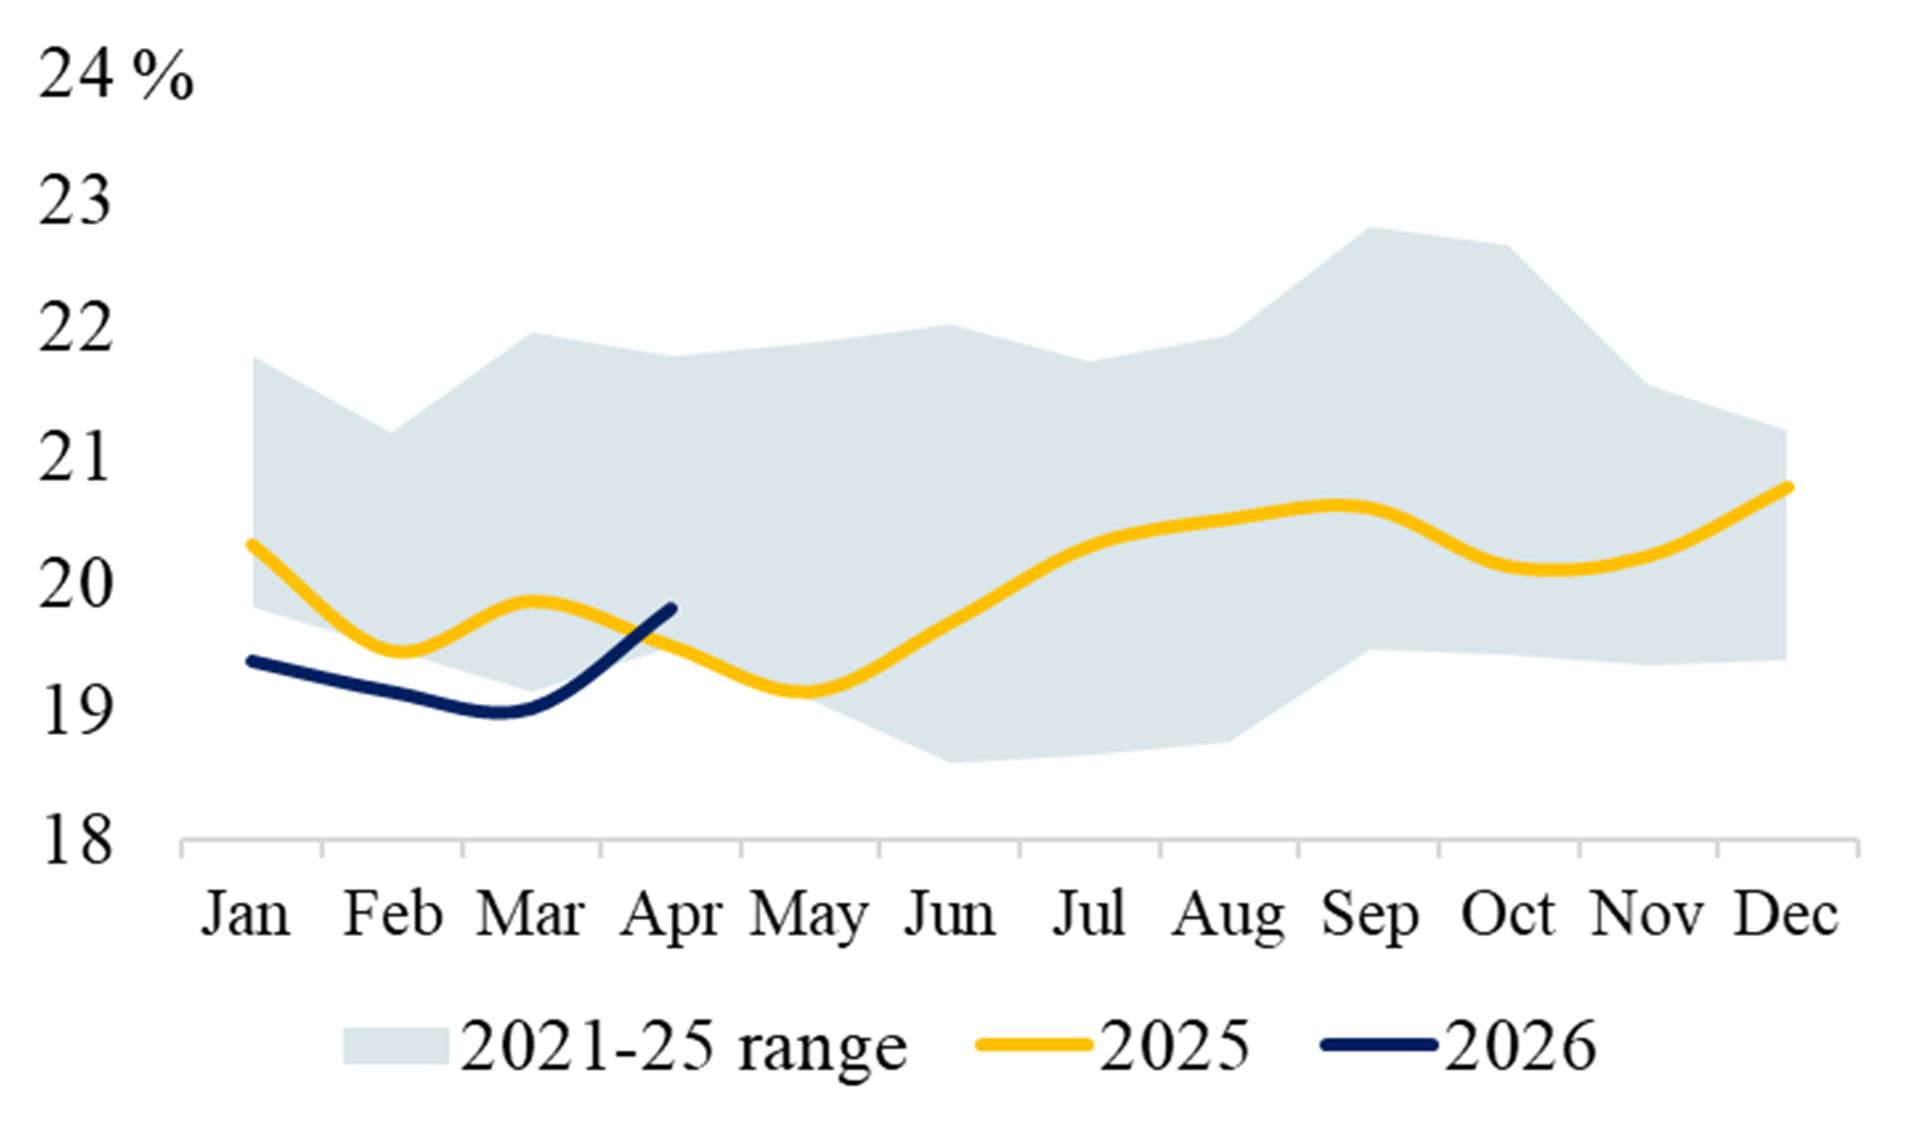
Source: EMBER
USA
Exhibit 24 USA: Biggest Source of Electricity in each State
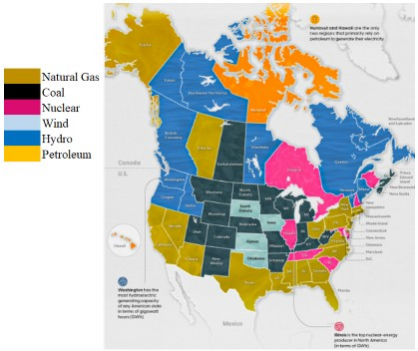
Exhibit 25 Power Generation Exhibit 26 Share of Gas (%)
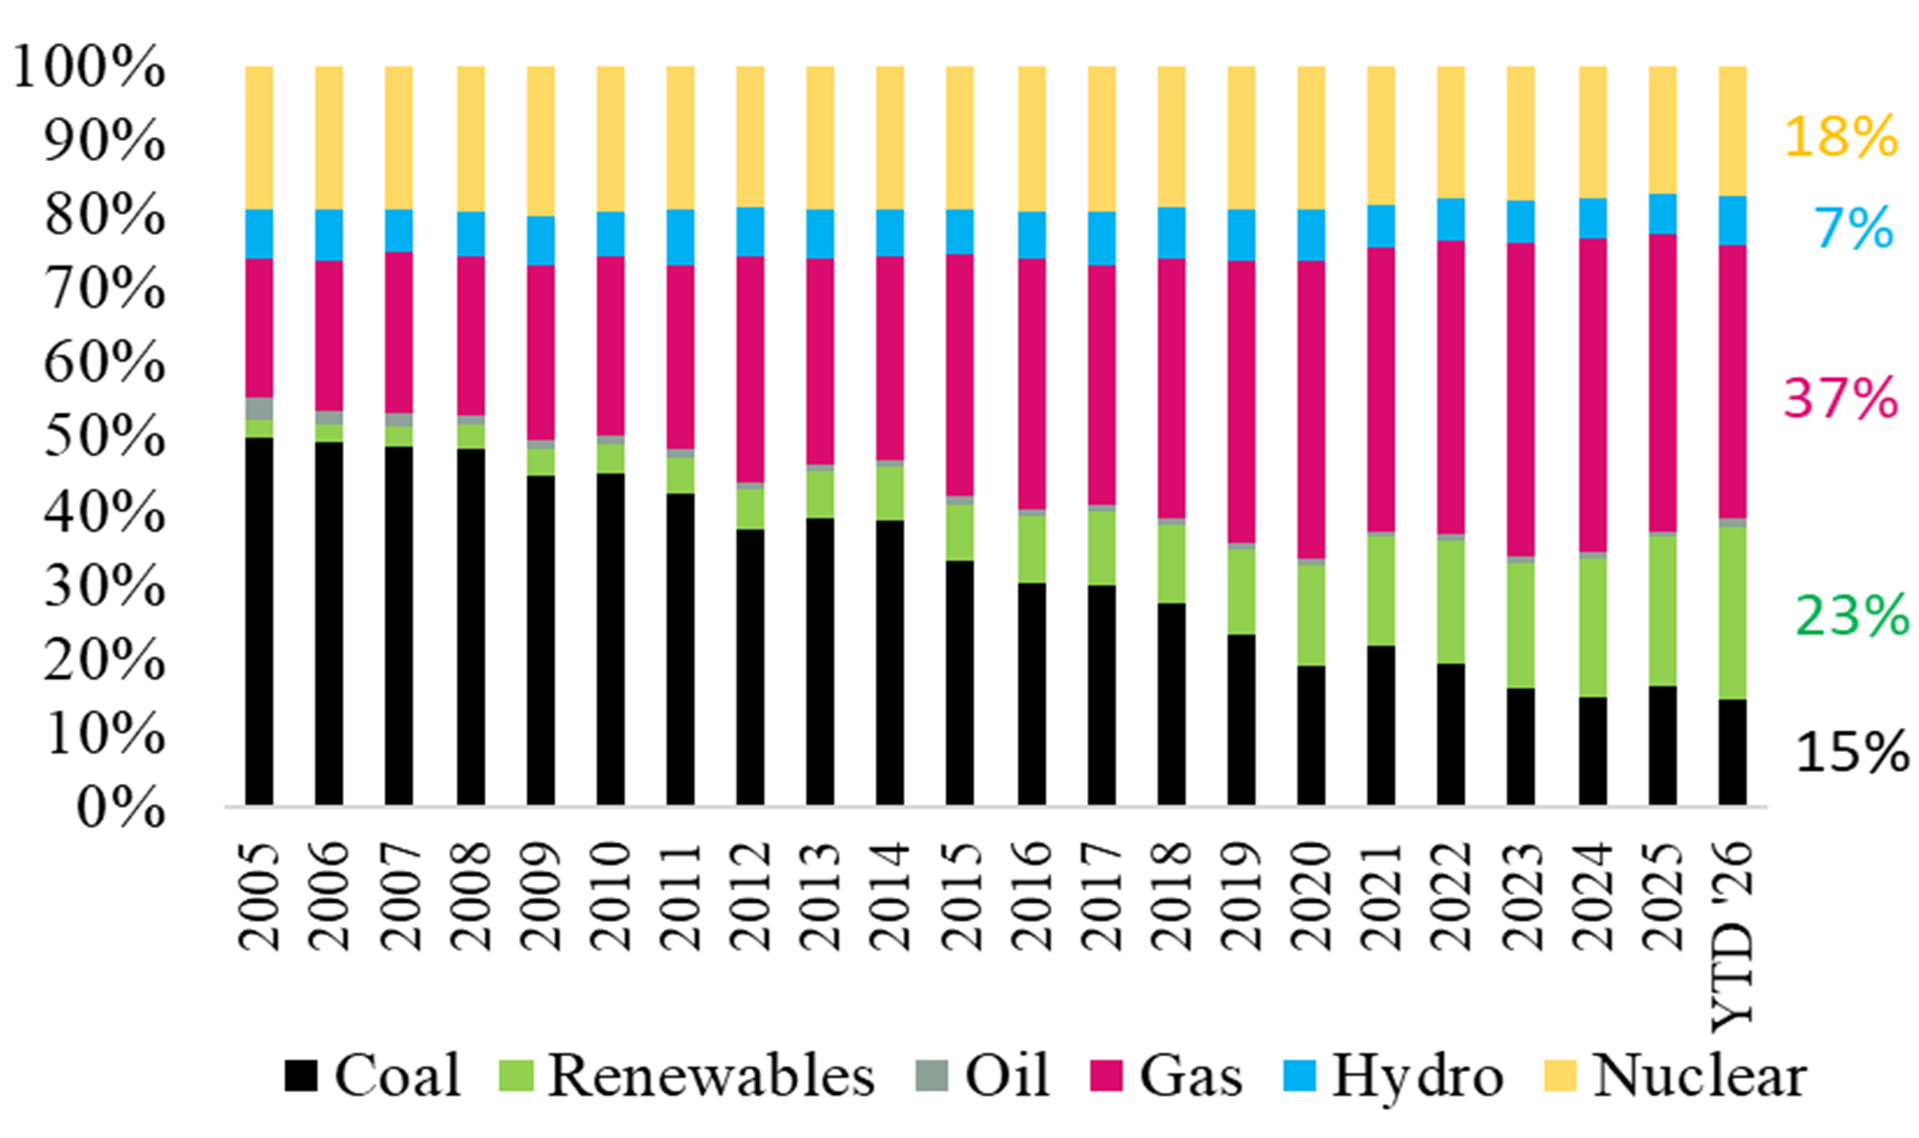
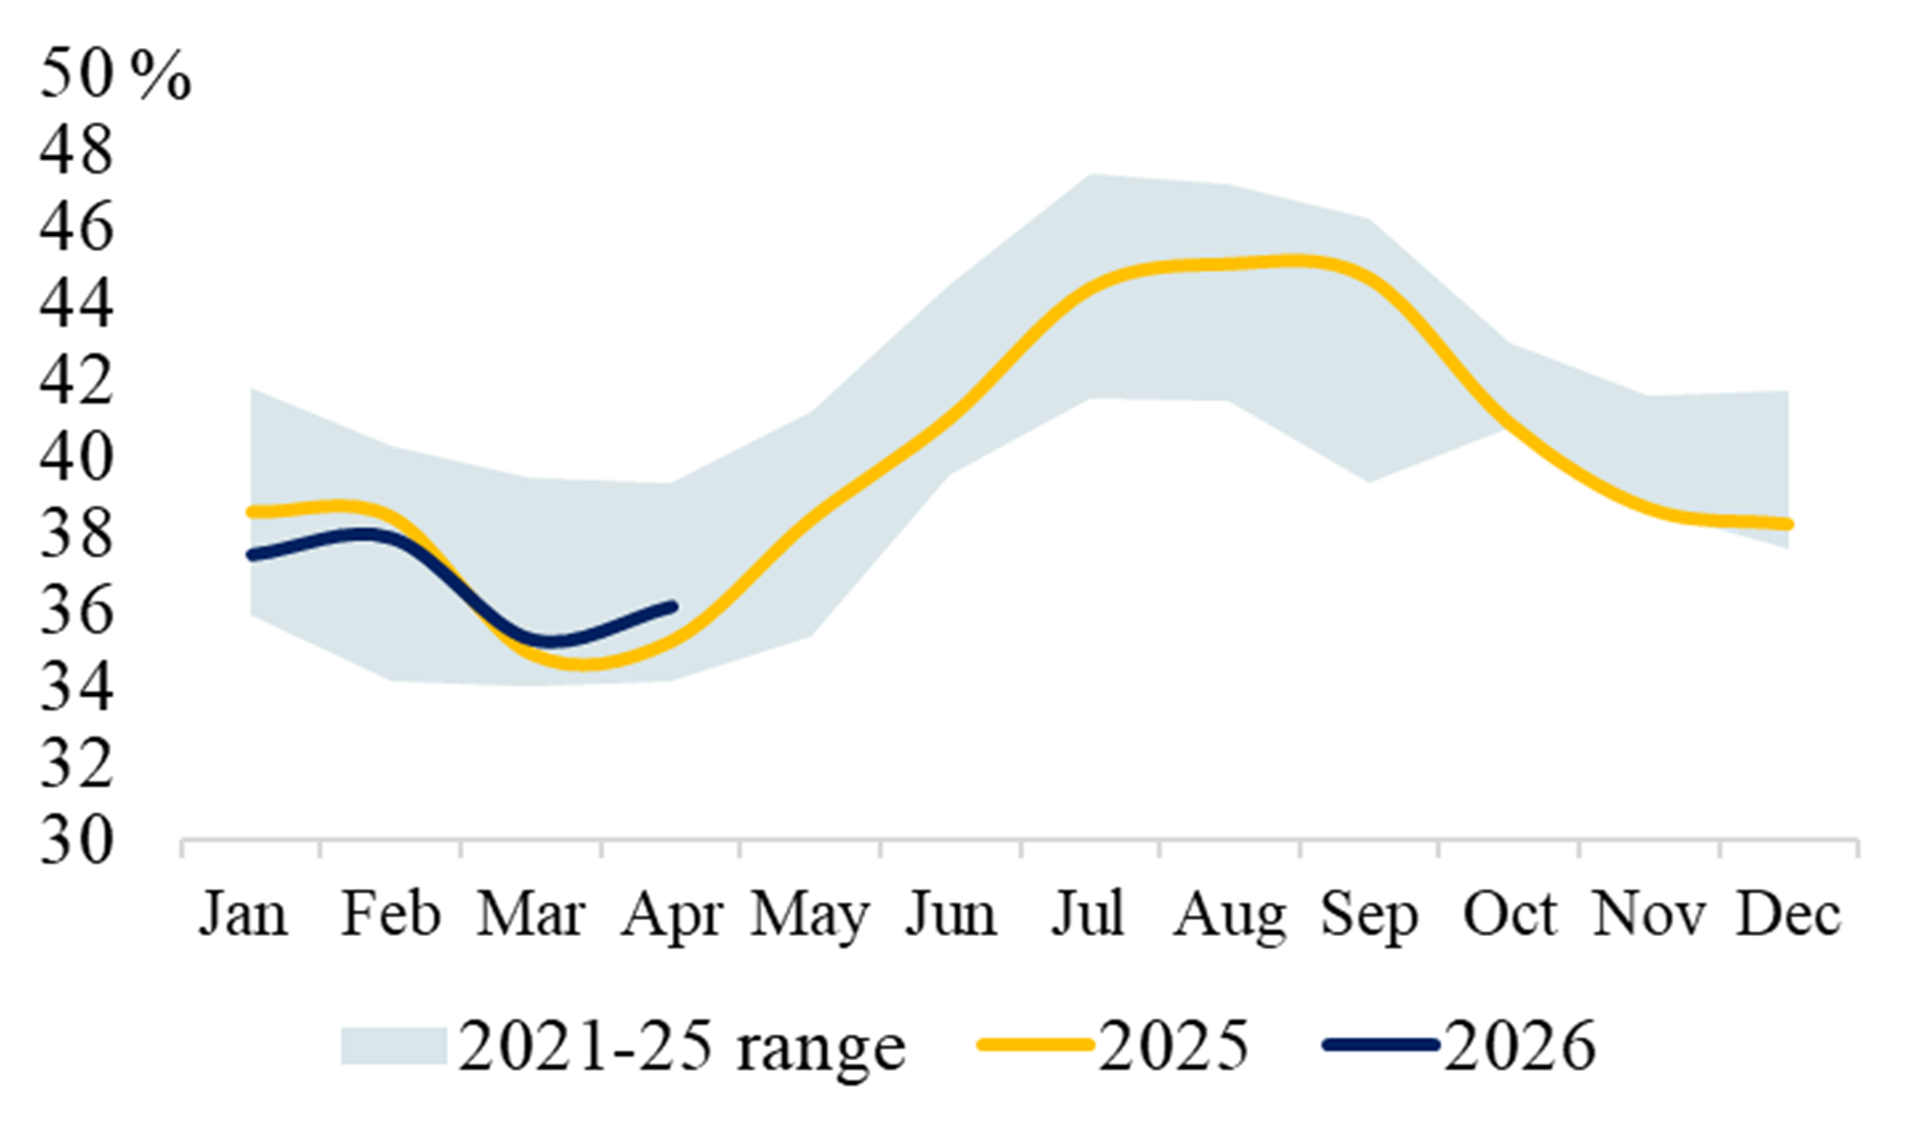
Exhibit 27 Share of Wind & Solar (%) Exhibit 28 Share of Nuclear (%) 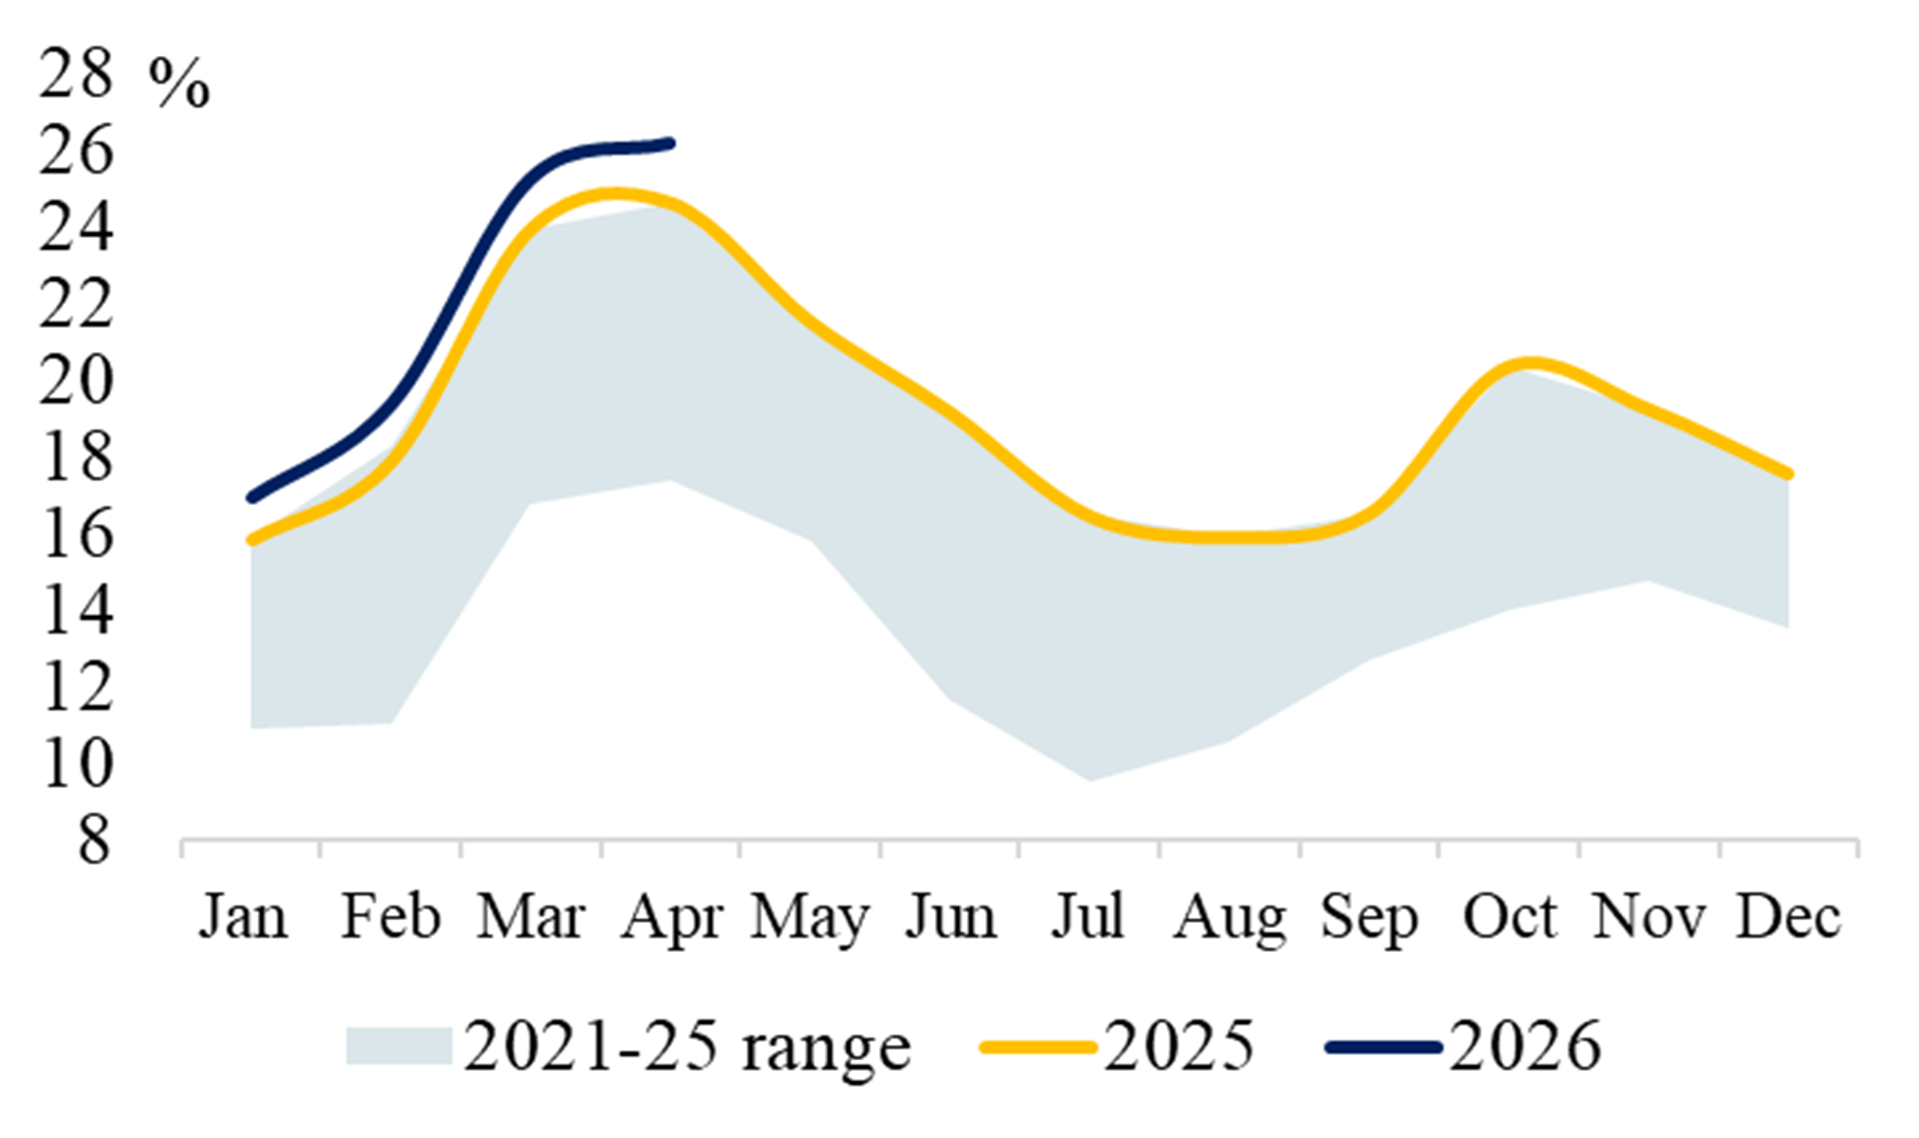
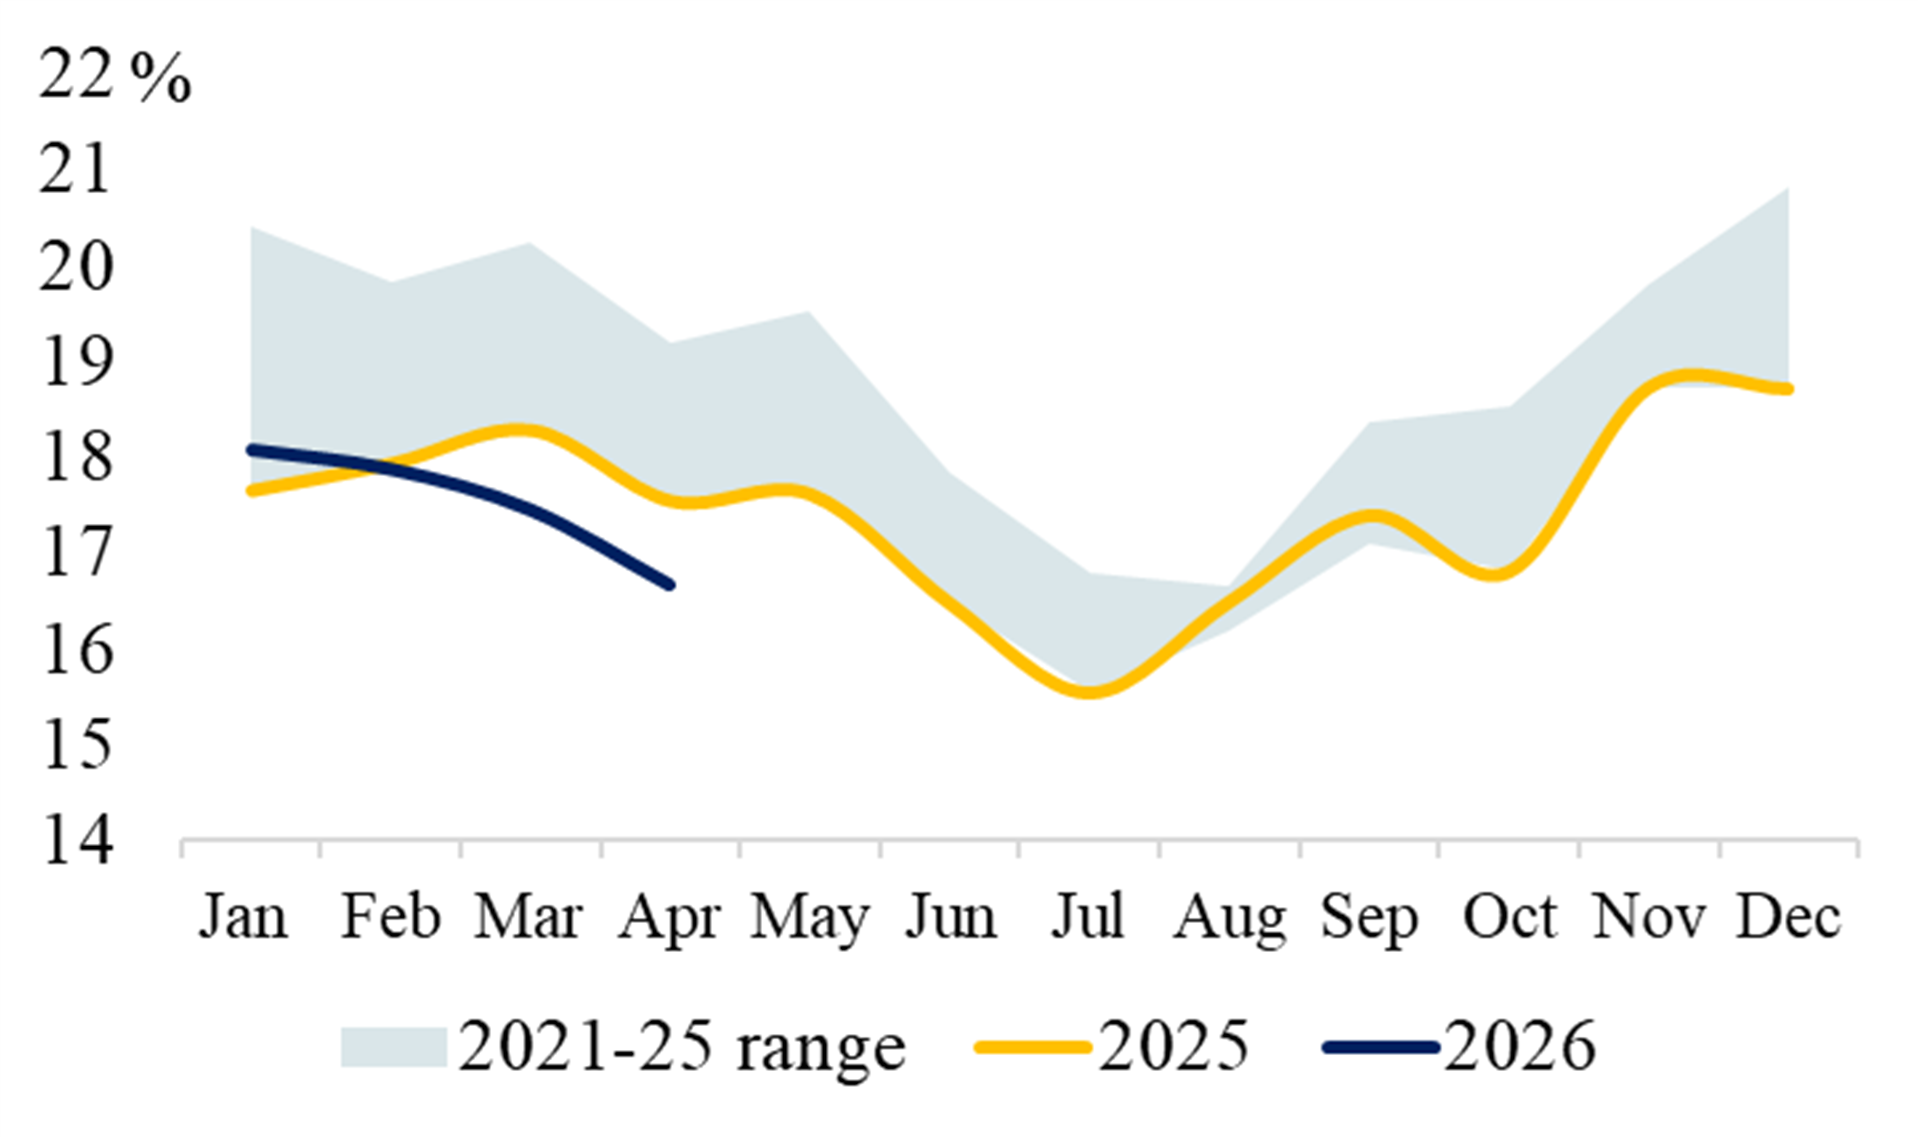
Source: EMBER
TÜRKIYE
Exhibit 29 Power Generation Exhibit 30 Share of Coal (%) 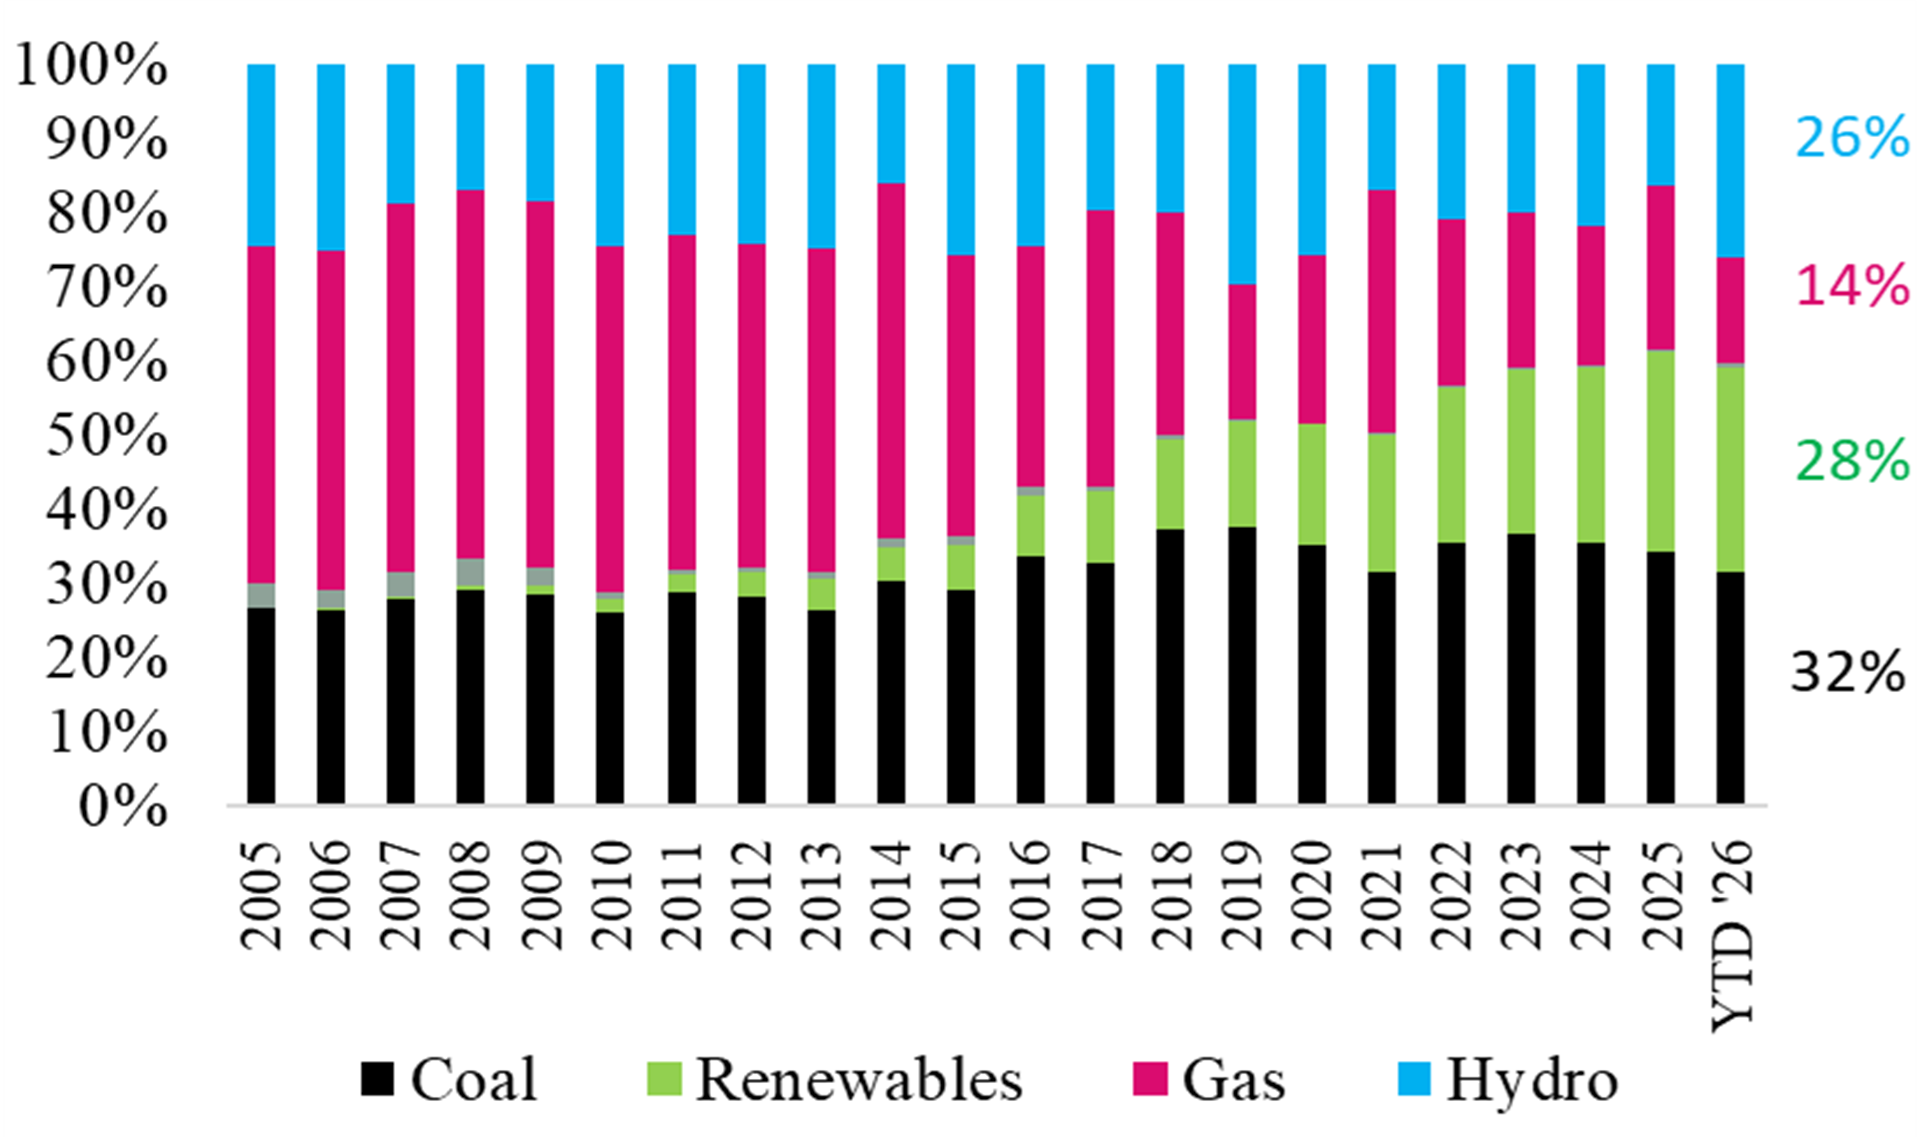
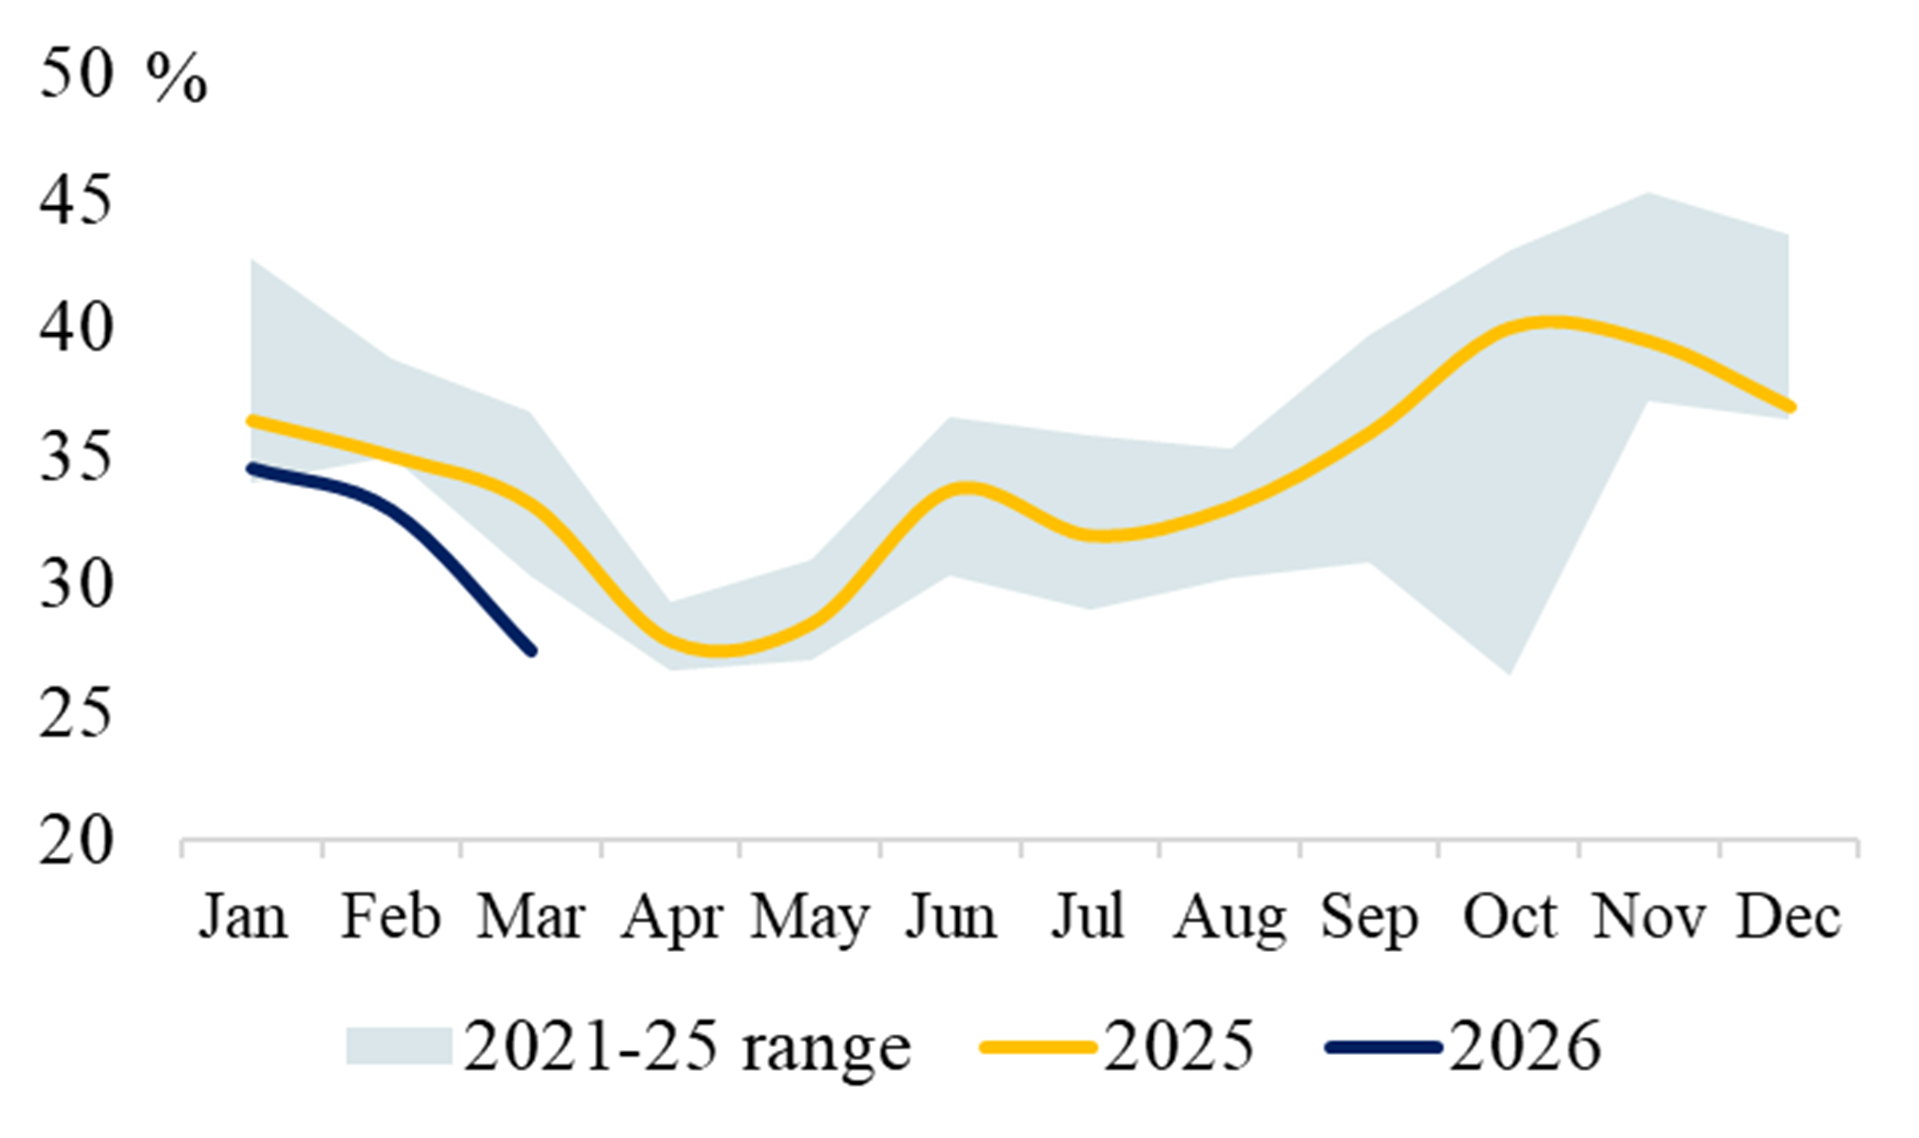
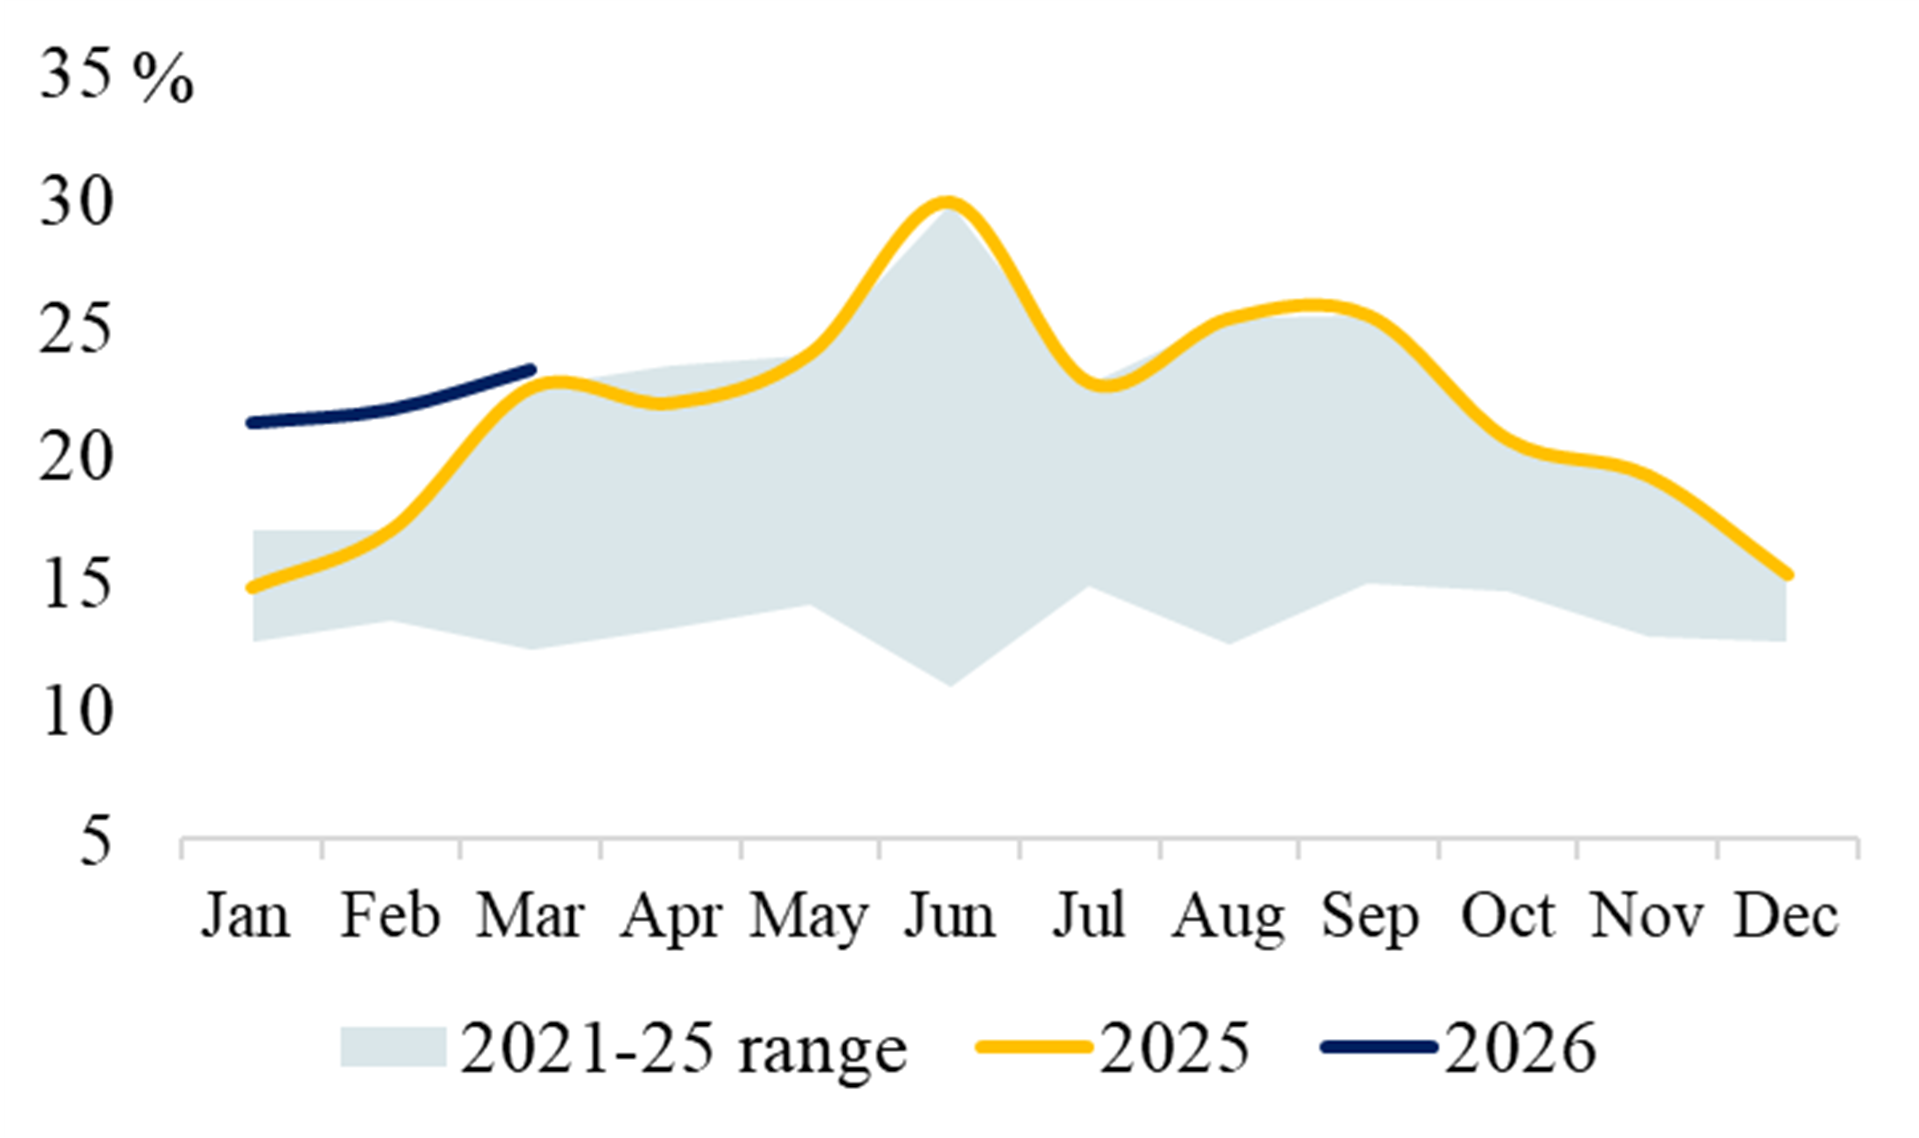
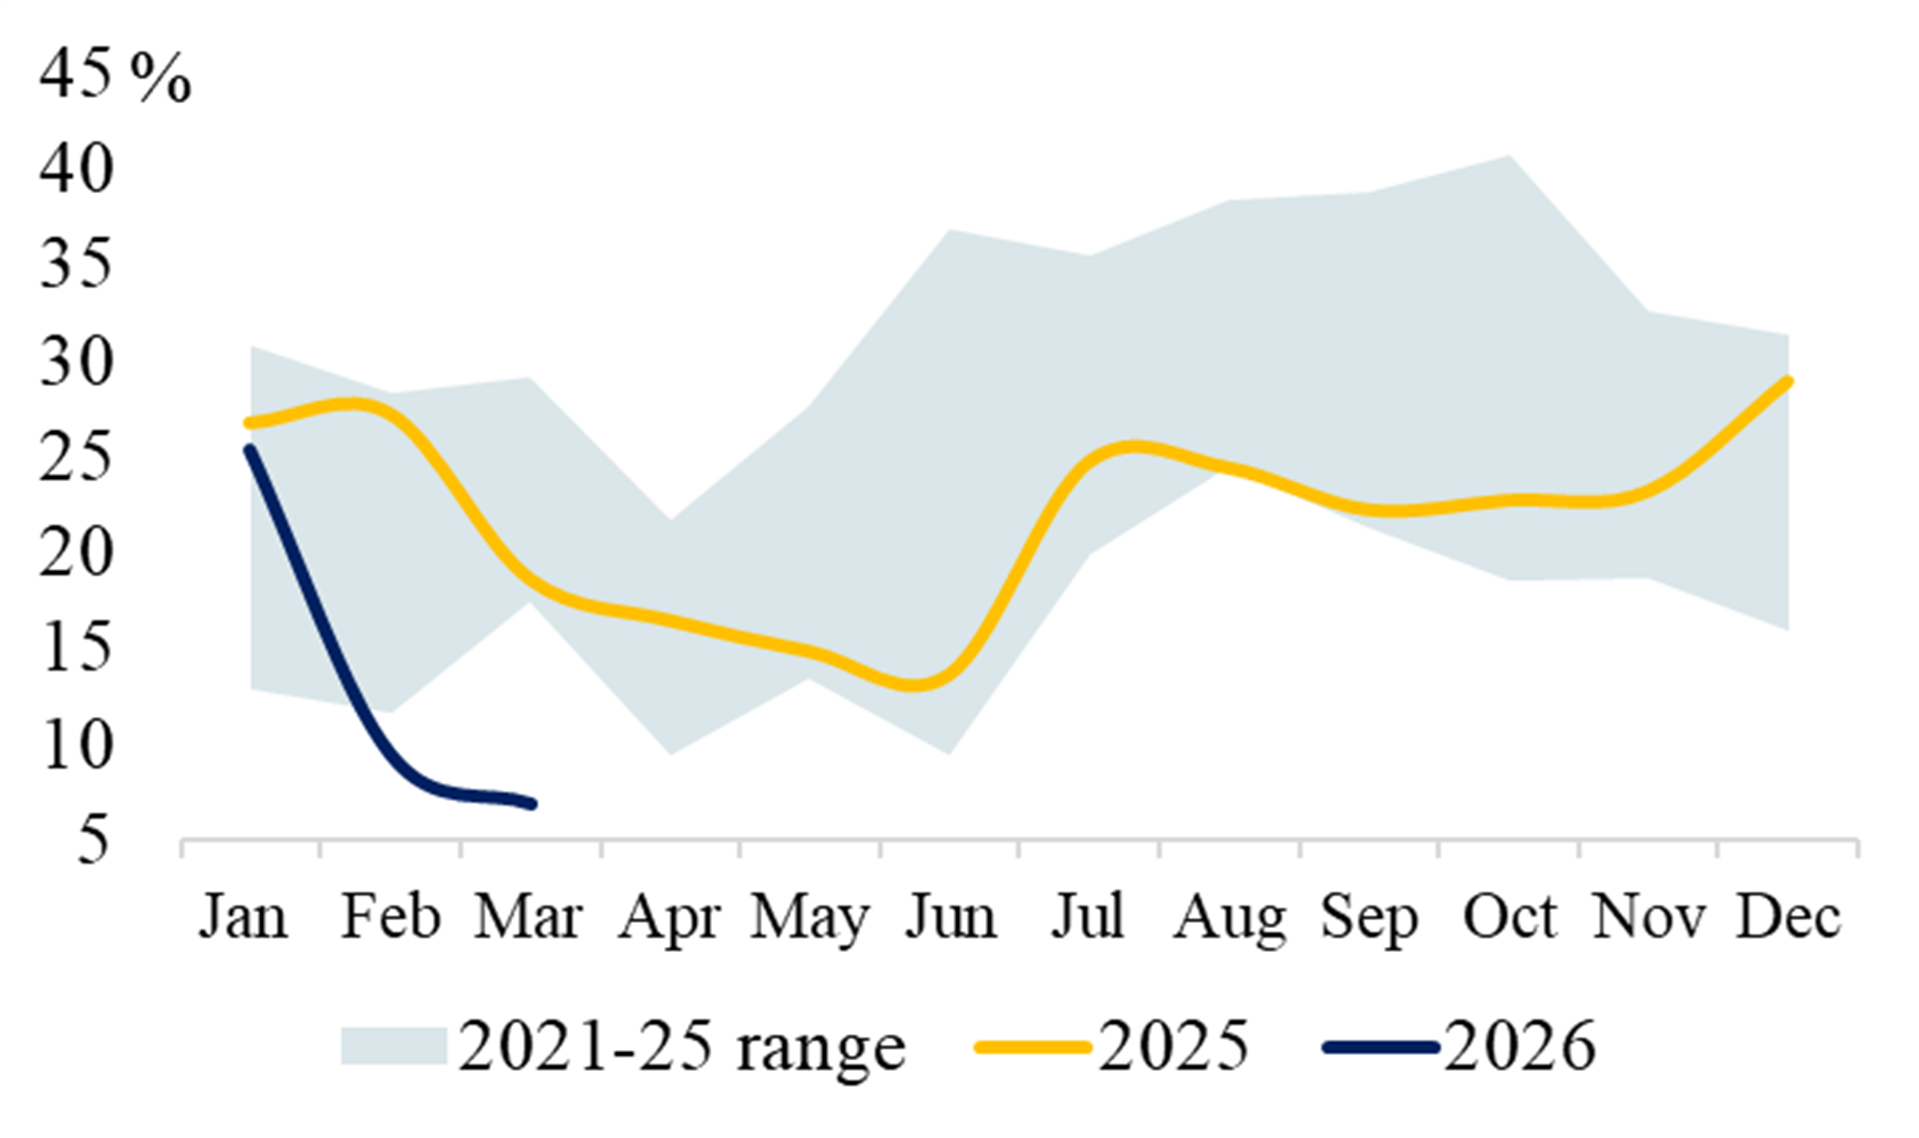
Exhibit 31 Share of Wind & Solar (%) Exhibit 32 Share of Gas (%)
INDIA
Exhibit 33 Power Generation Exhibit 34 Share of Coal (%) 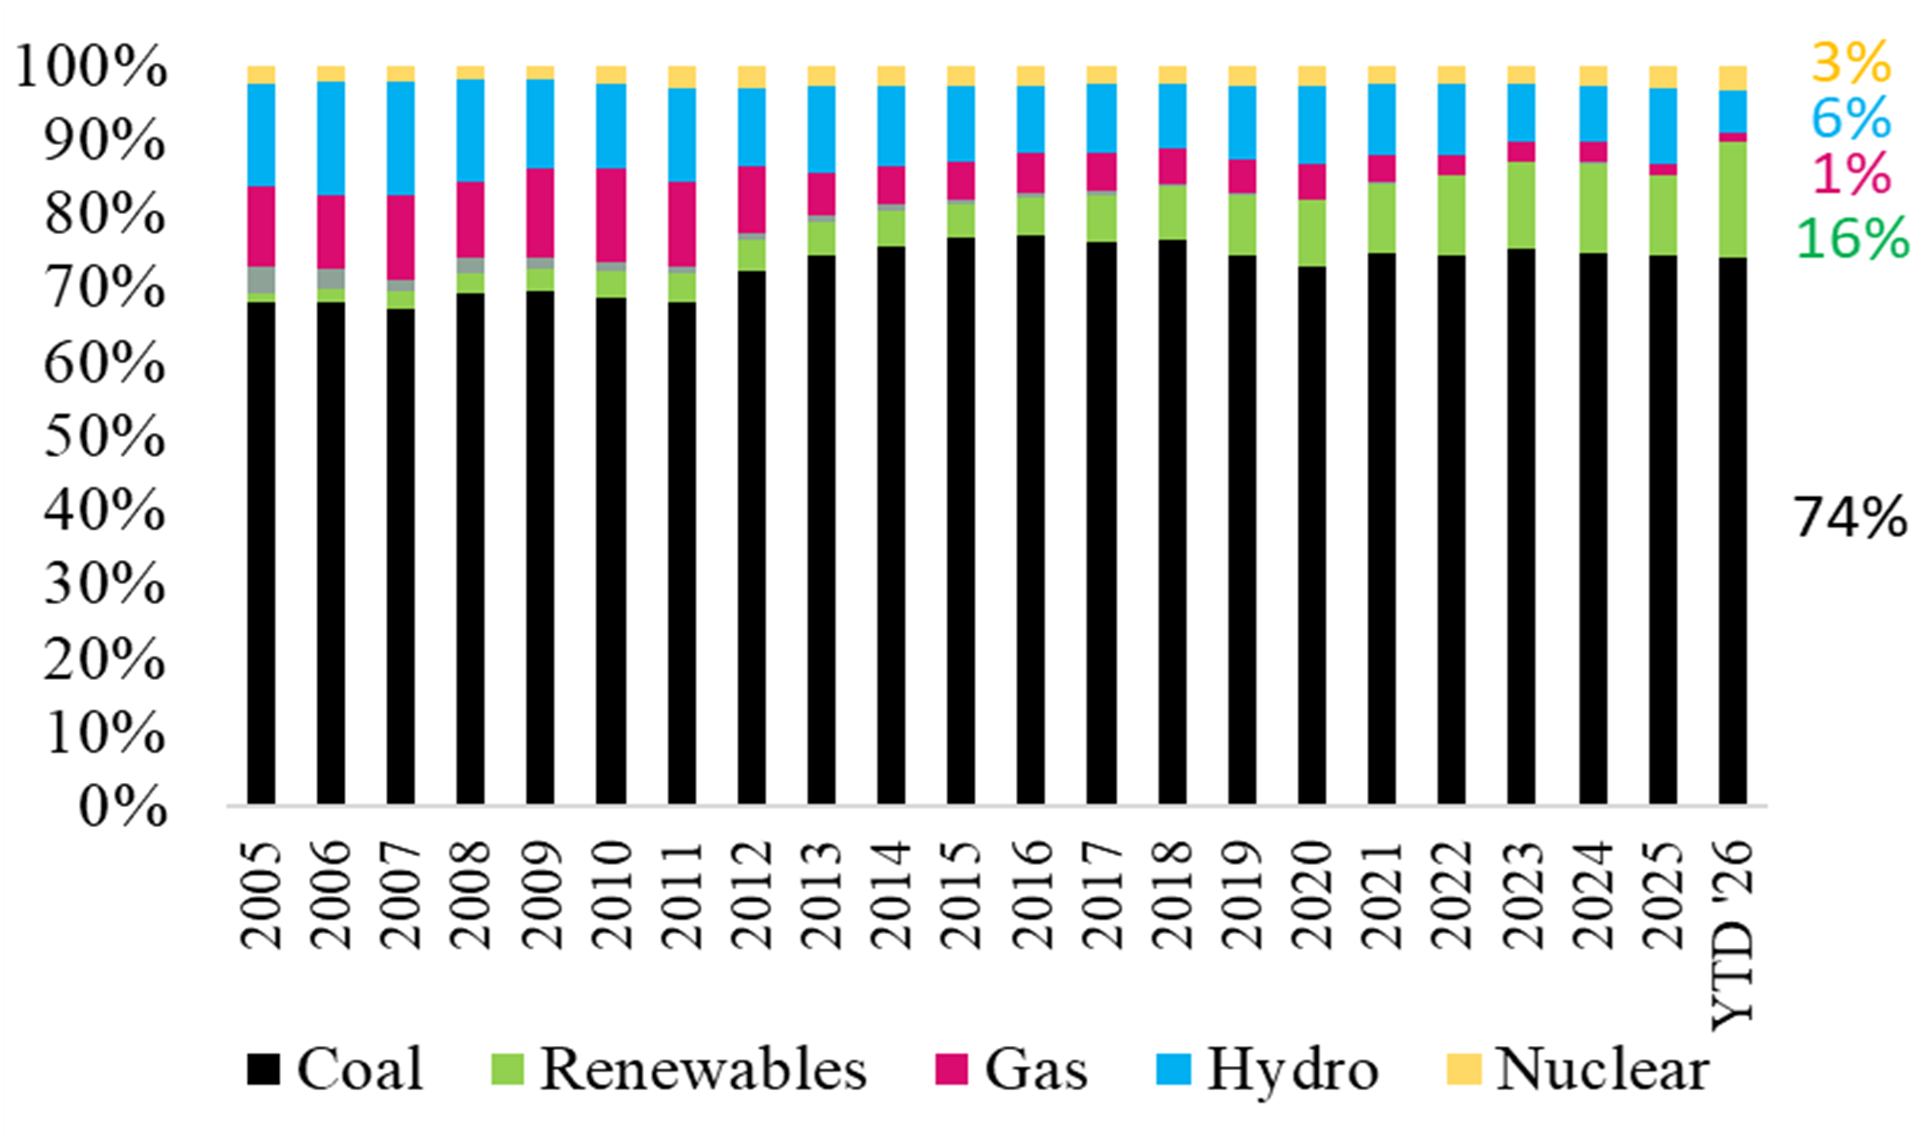
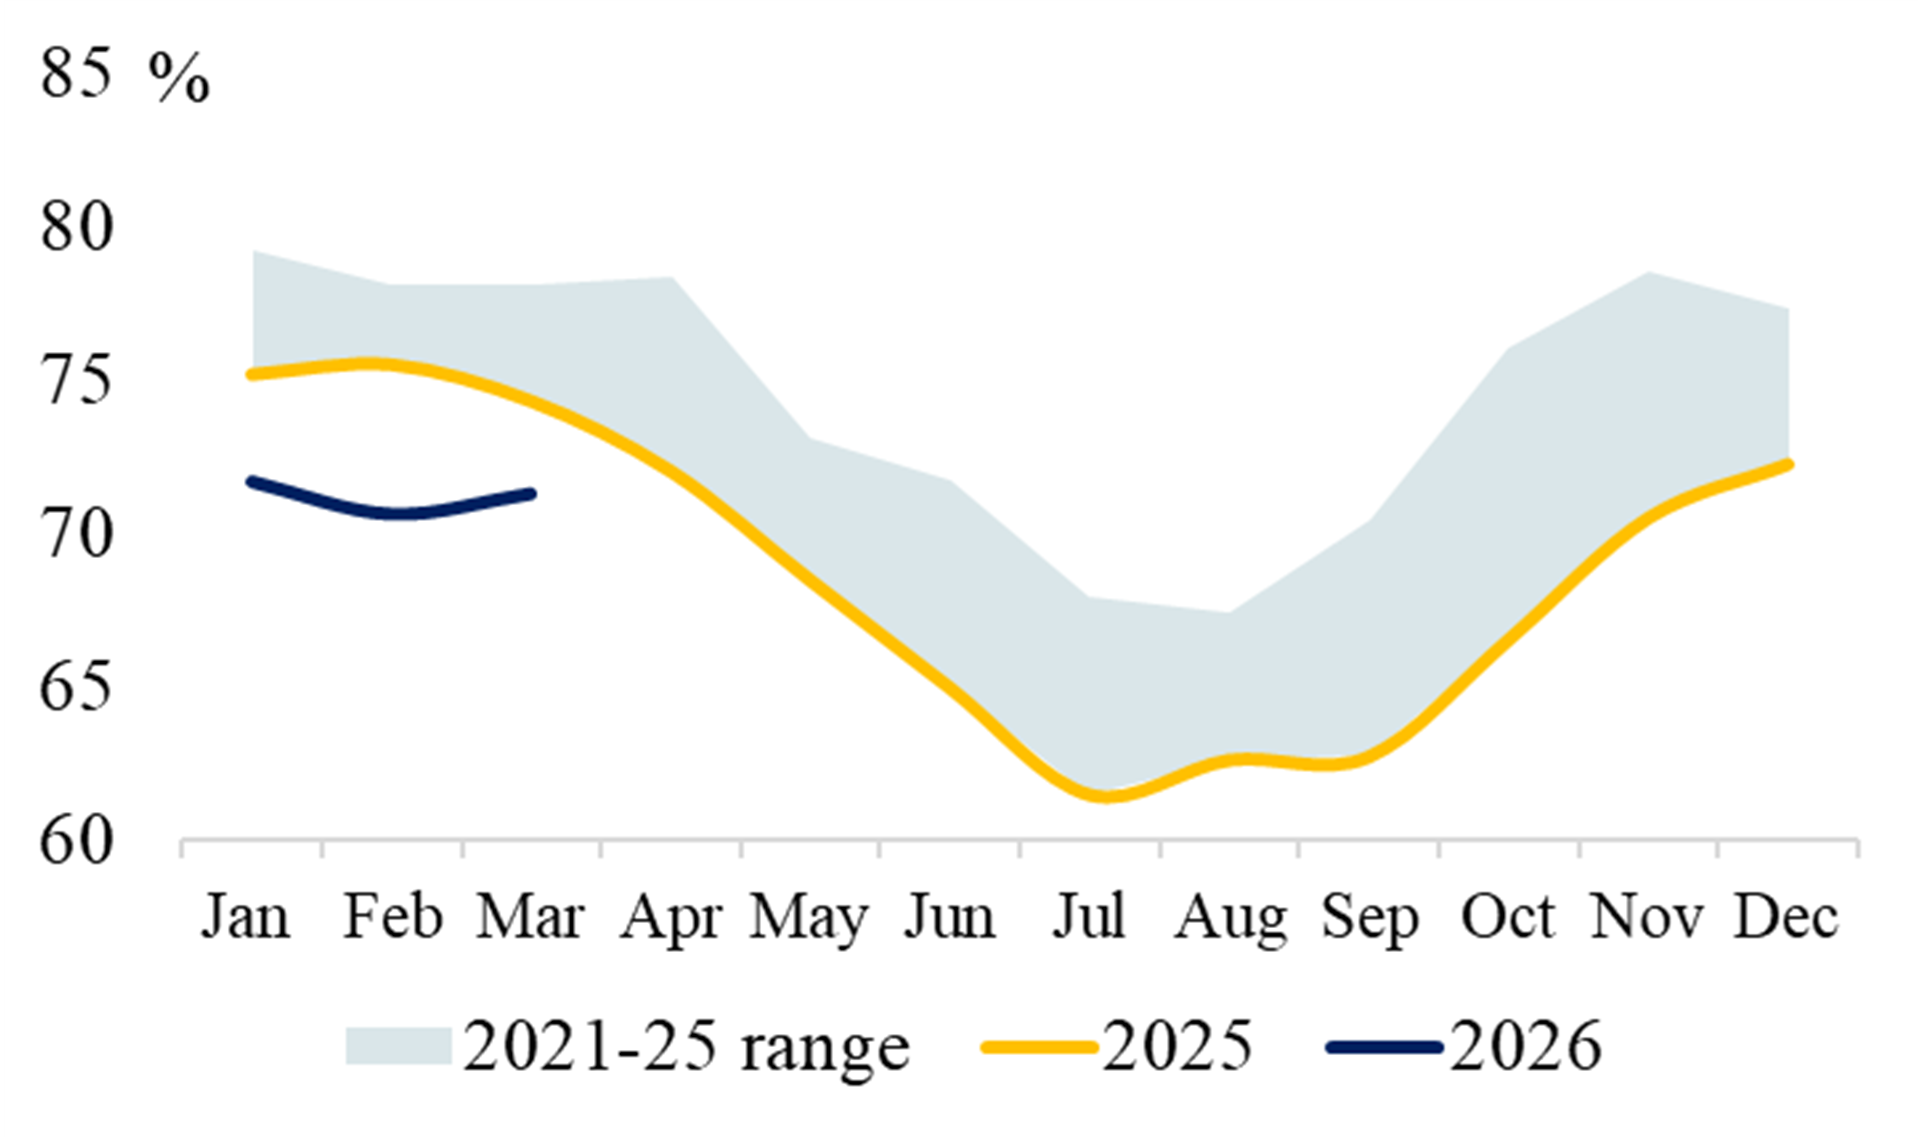
Exhibit 35 Share of Wind & Solar (%) Exhibit 36 Share of Hydro (%) 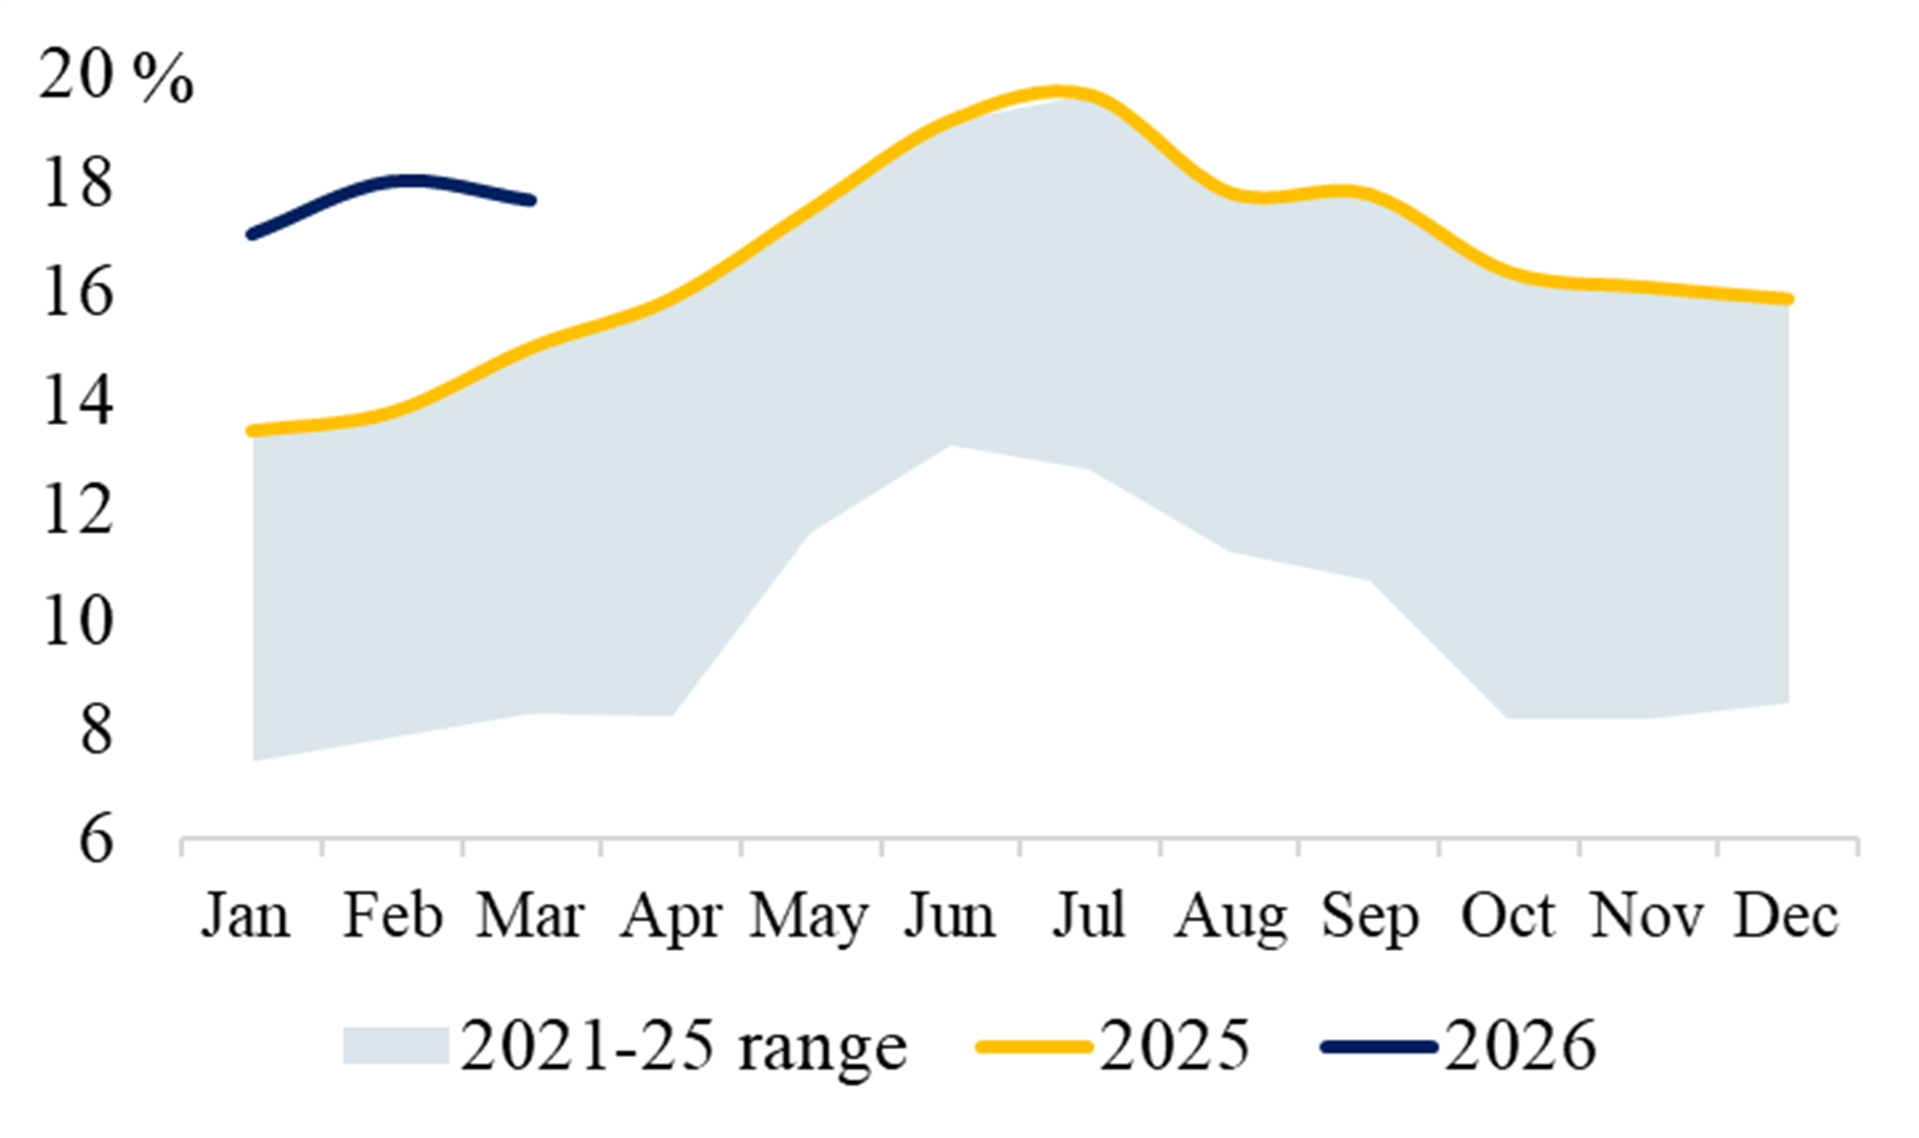
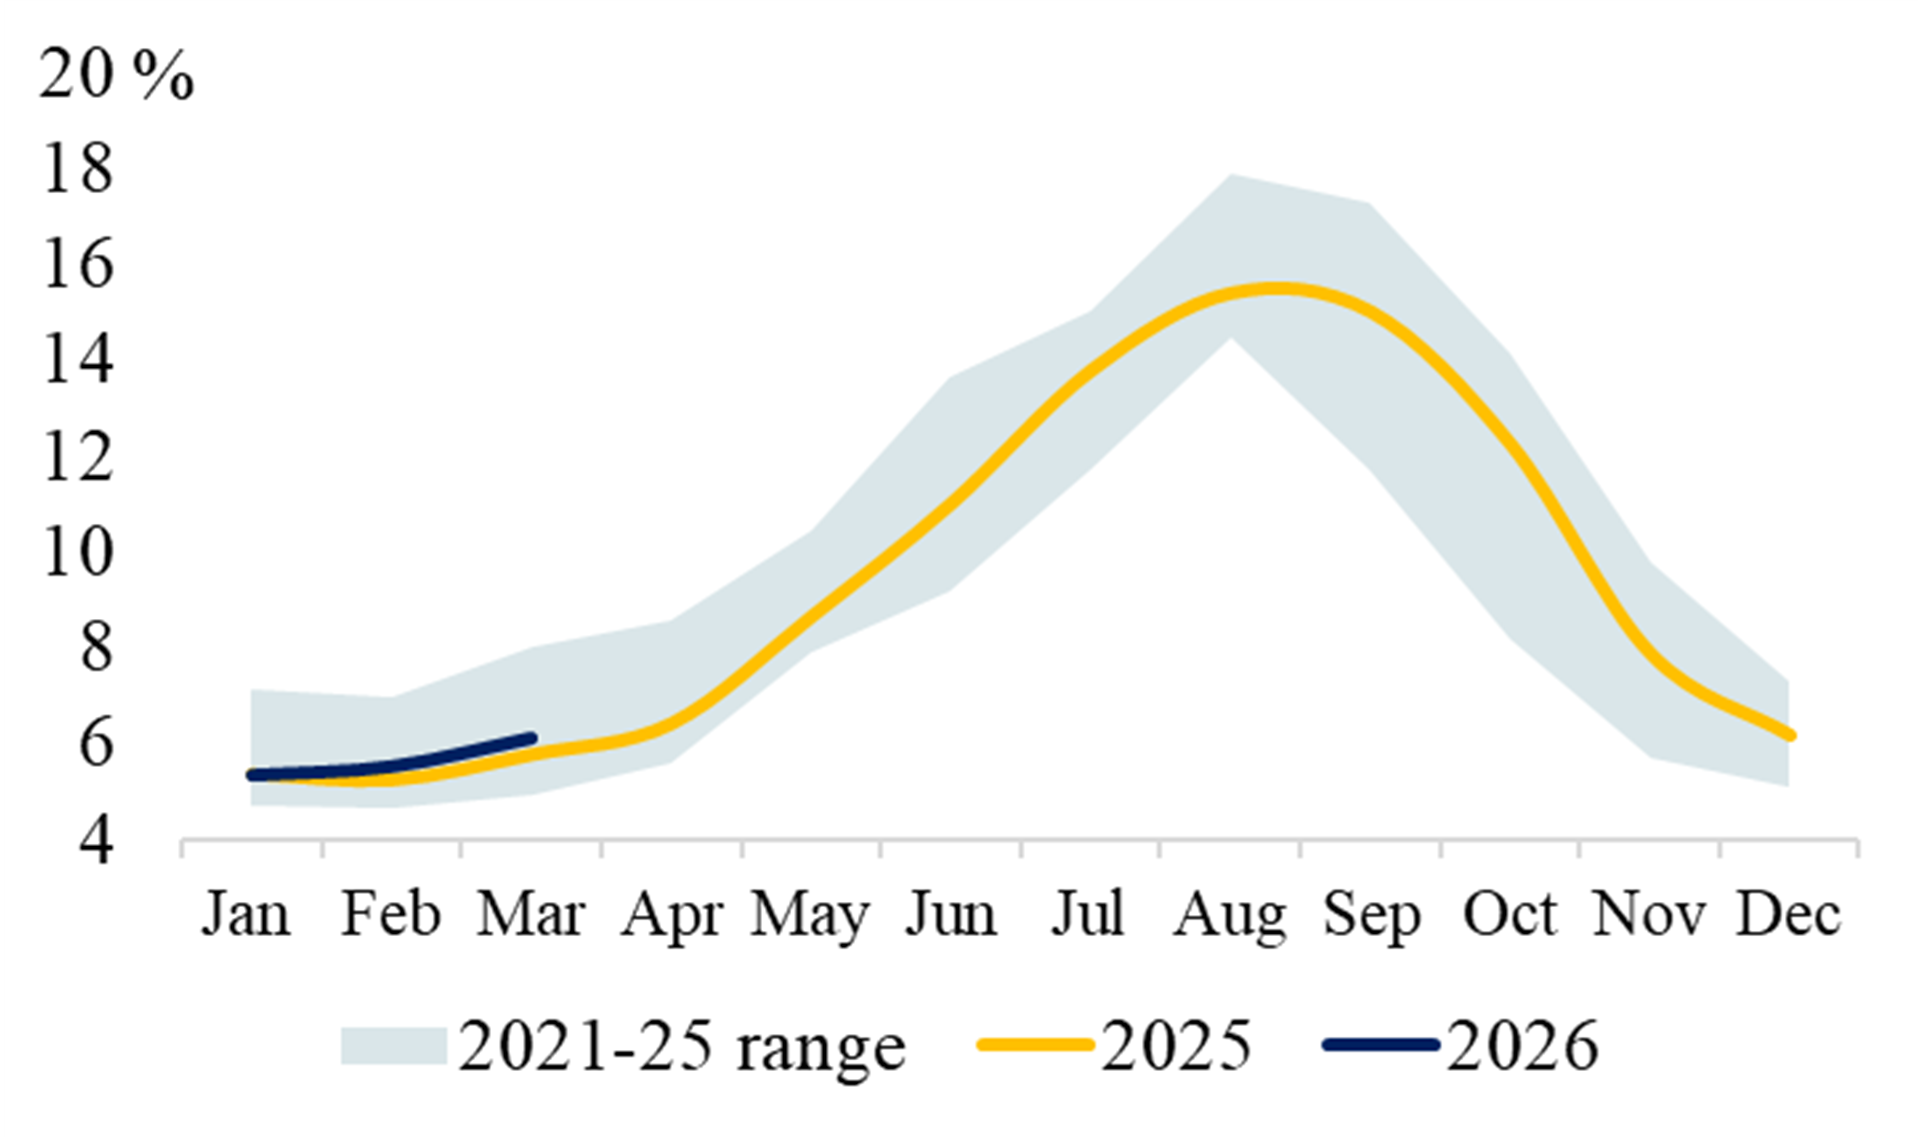
Source: EMBER
CHINA
Exhibit 37 Power Generation Exhibit 38 Share of Coal (%) 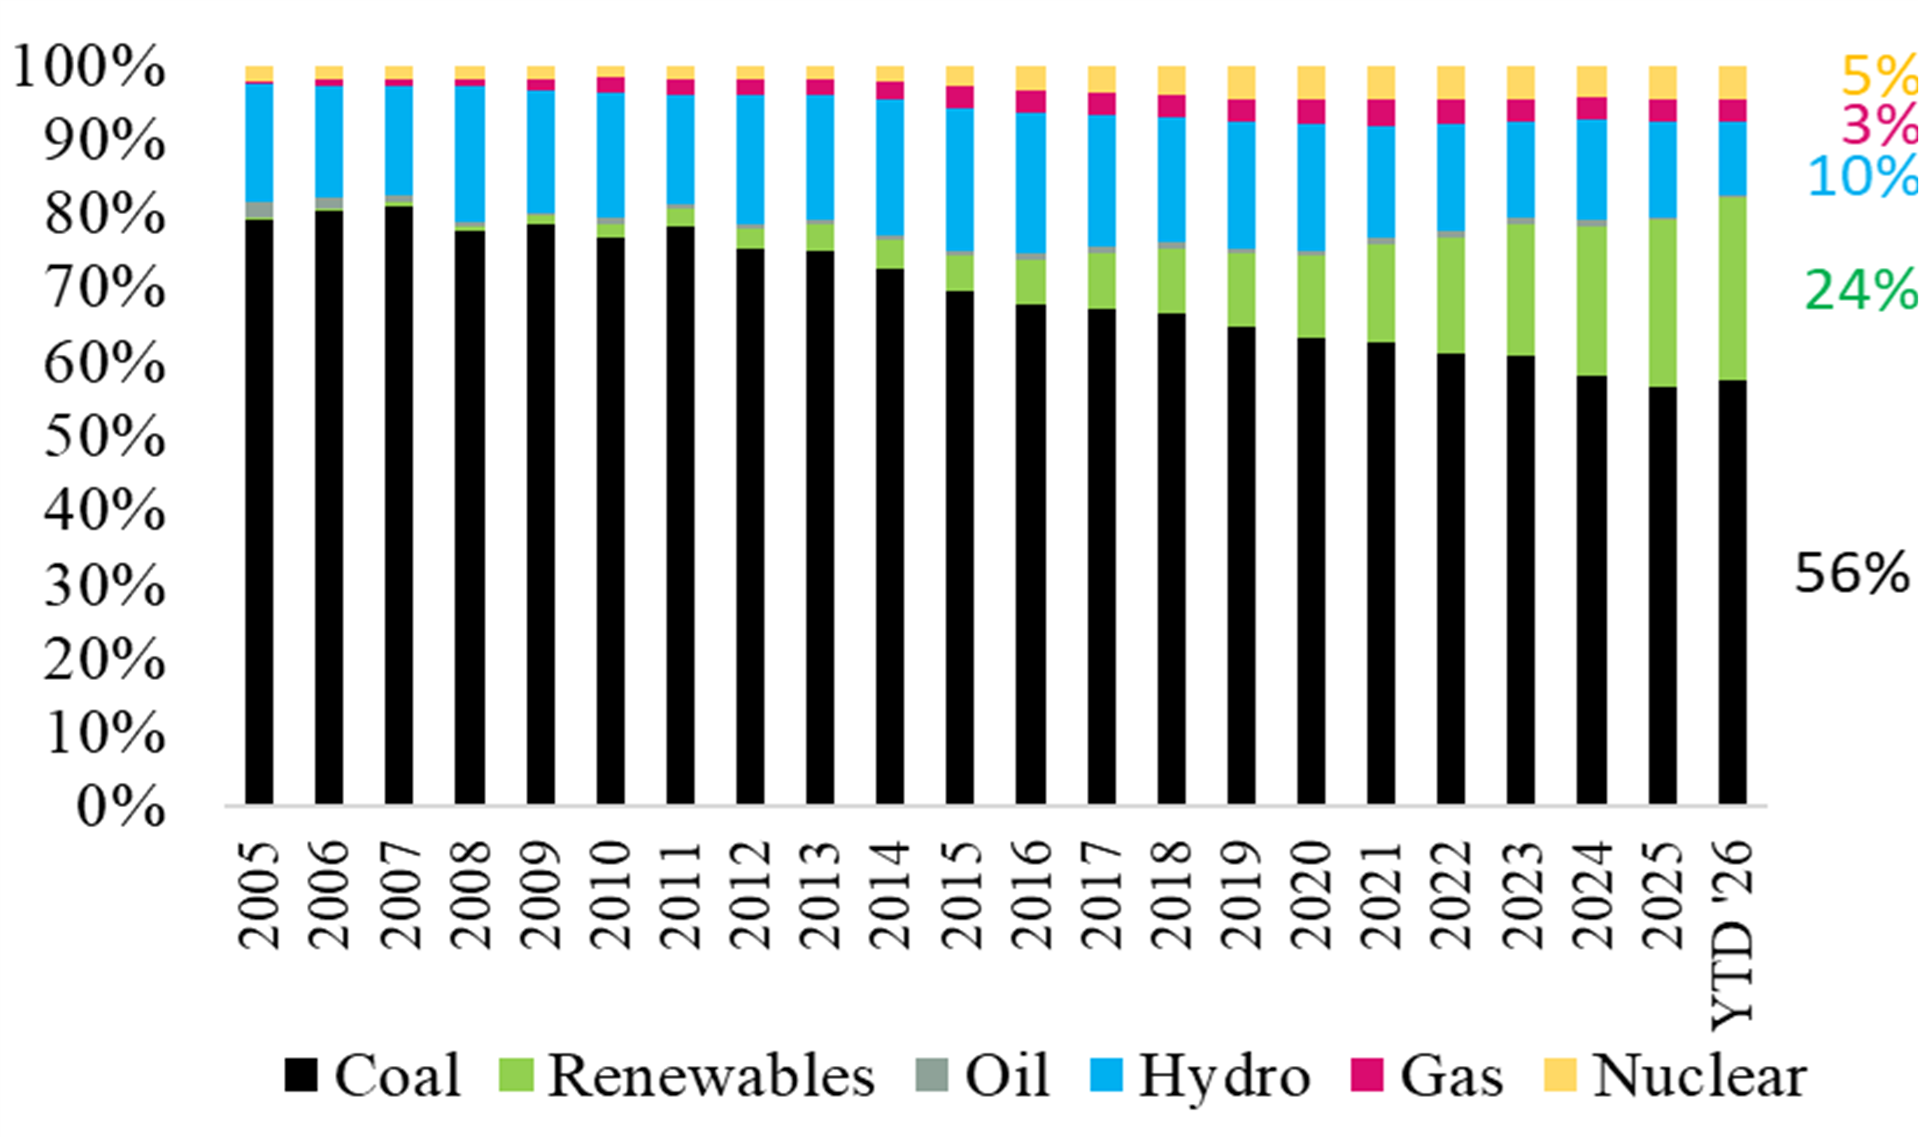
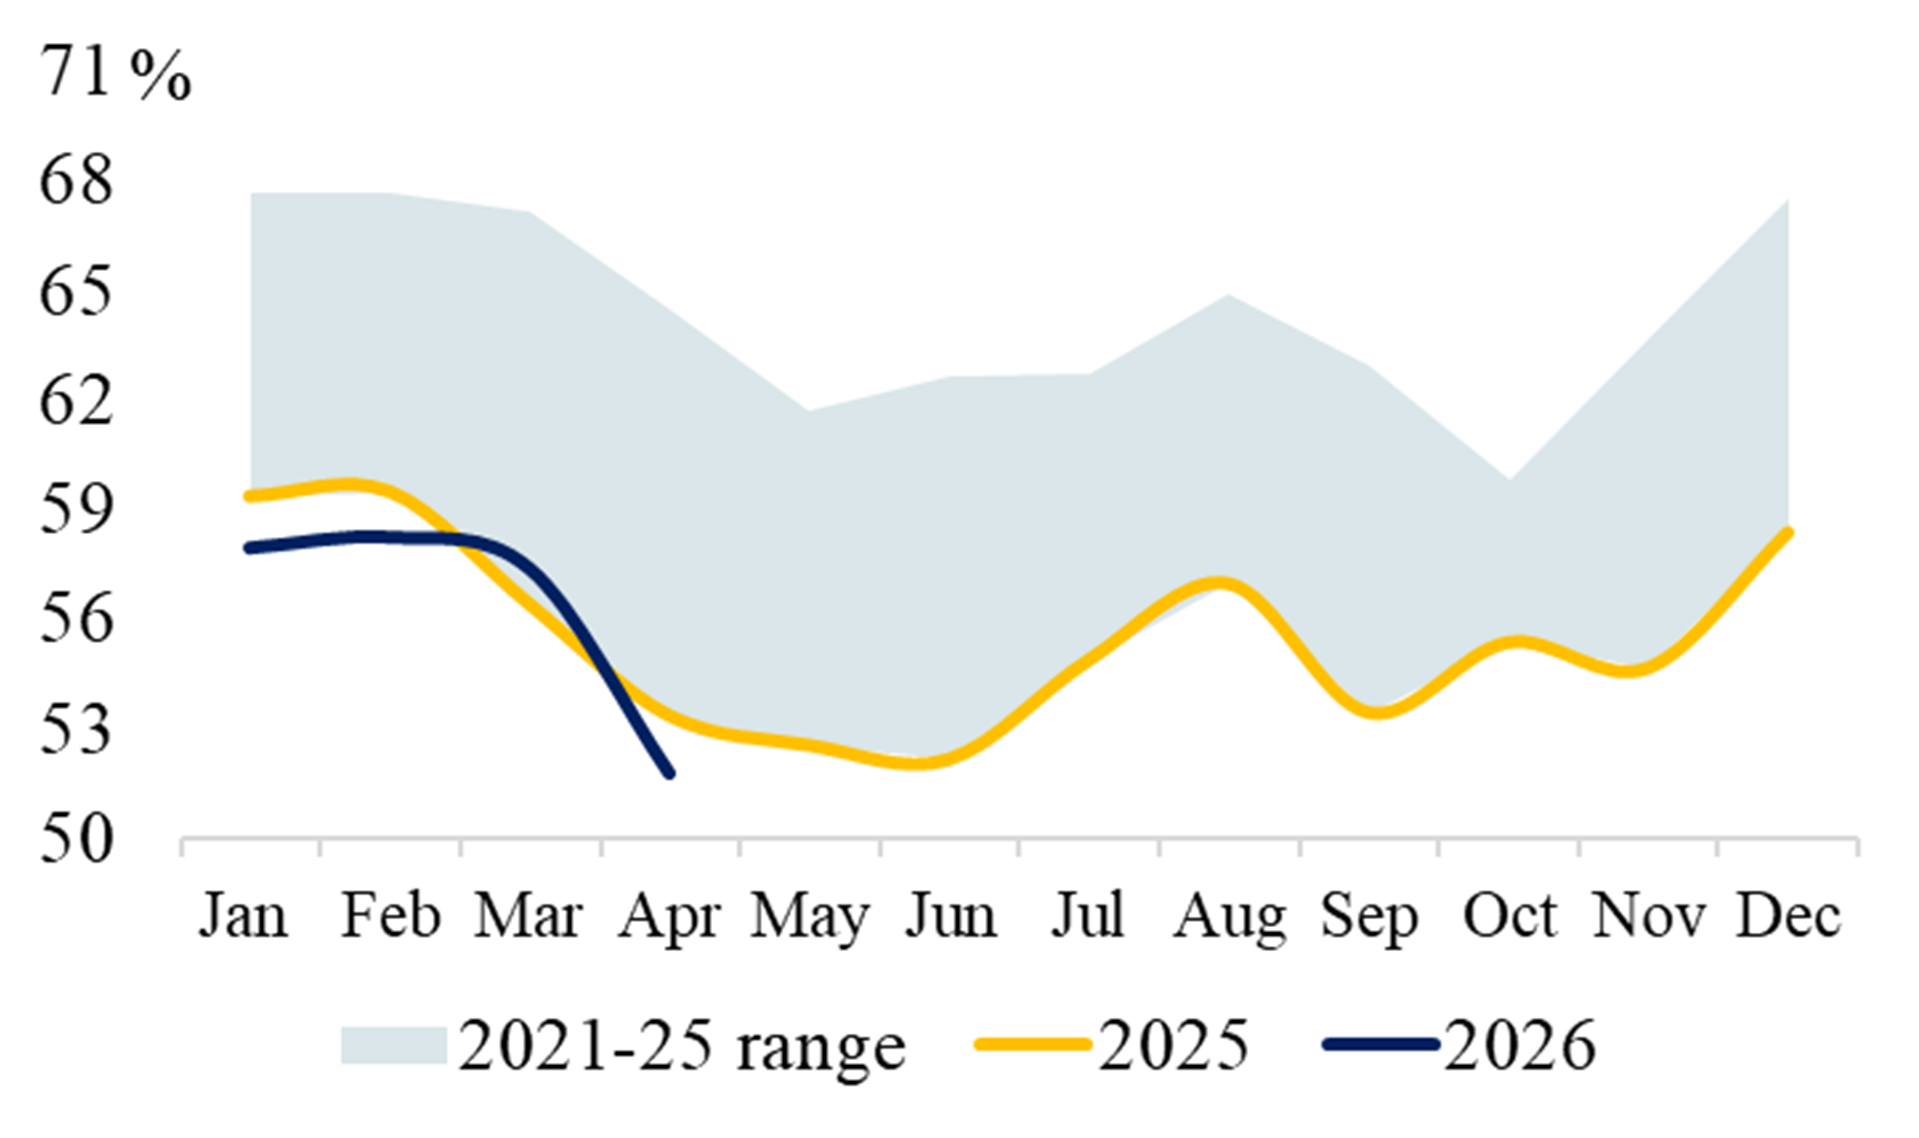
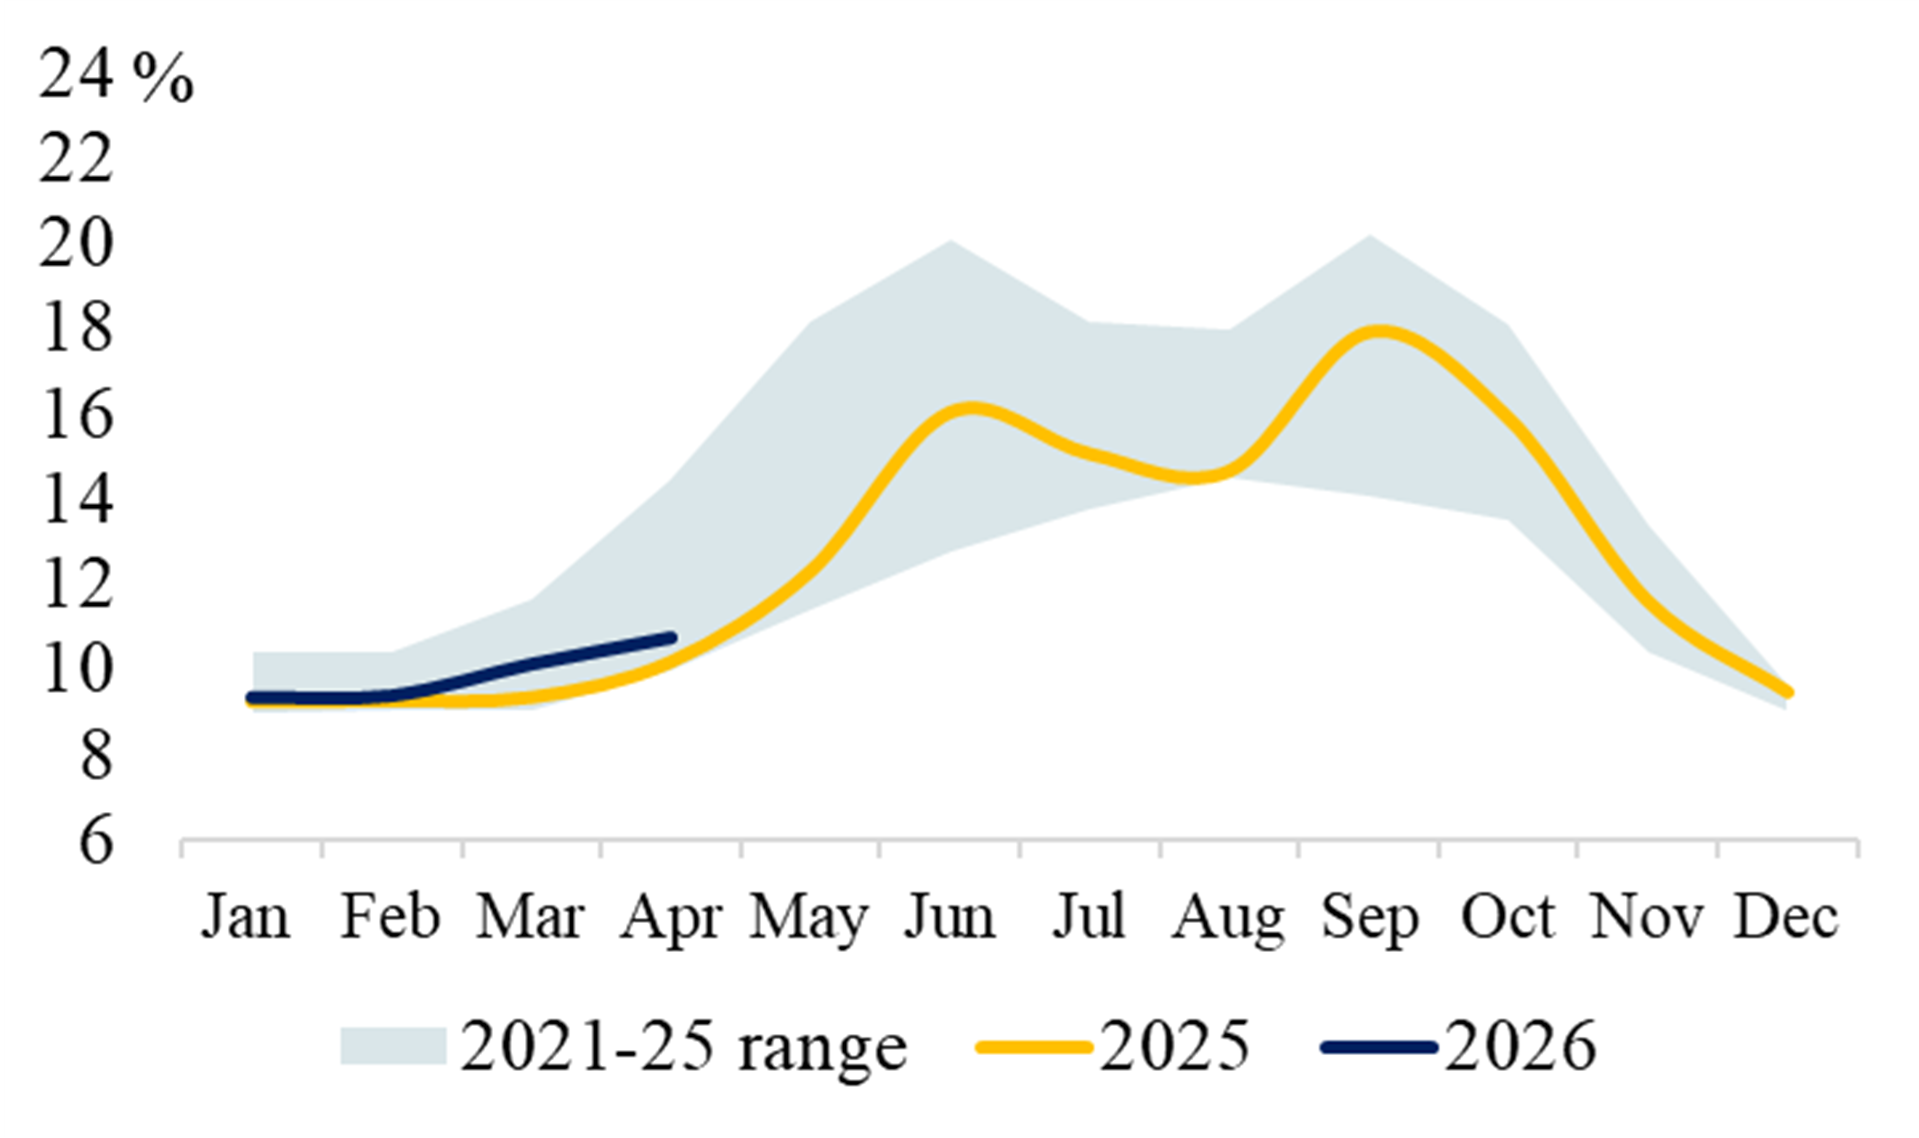
Exhibit 39 Share of Wind & Solar (%) Exhibit 40 Share of Hydro (%) 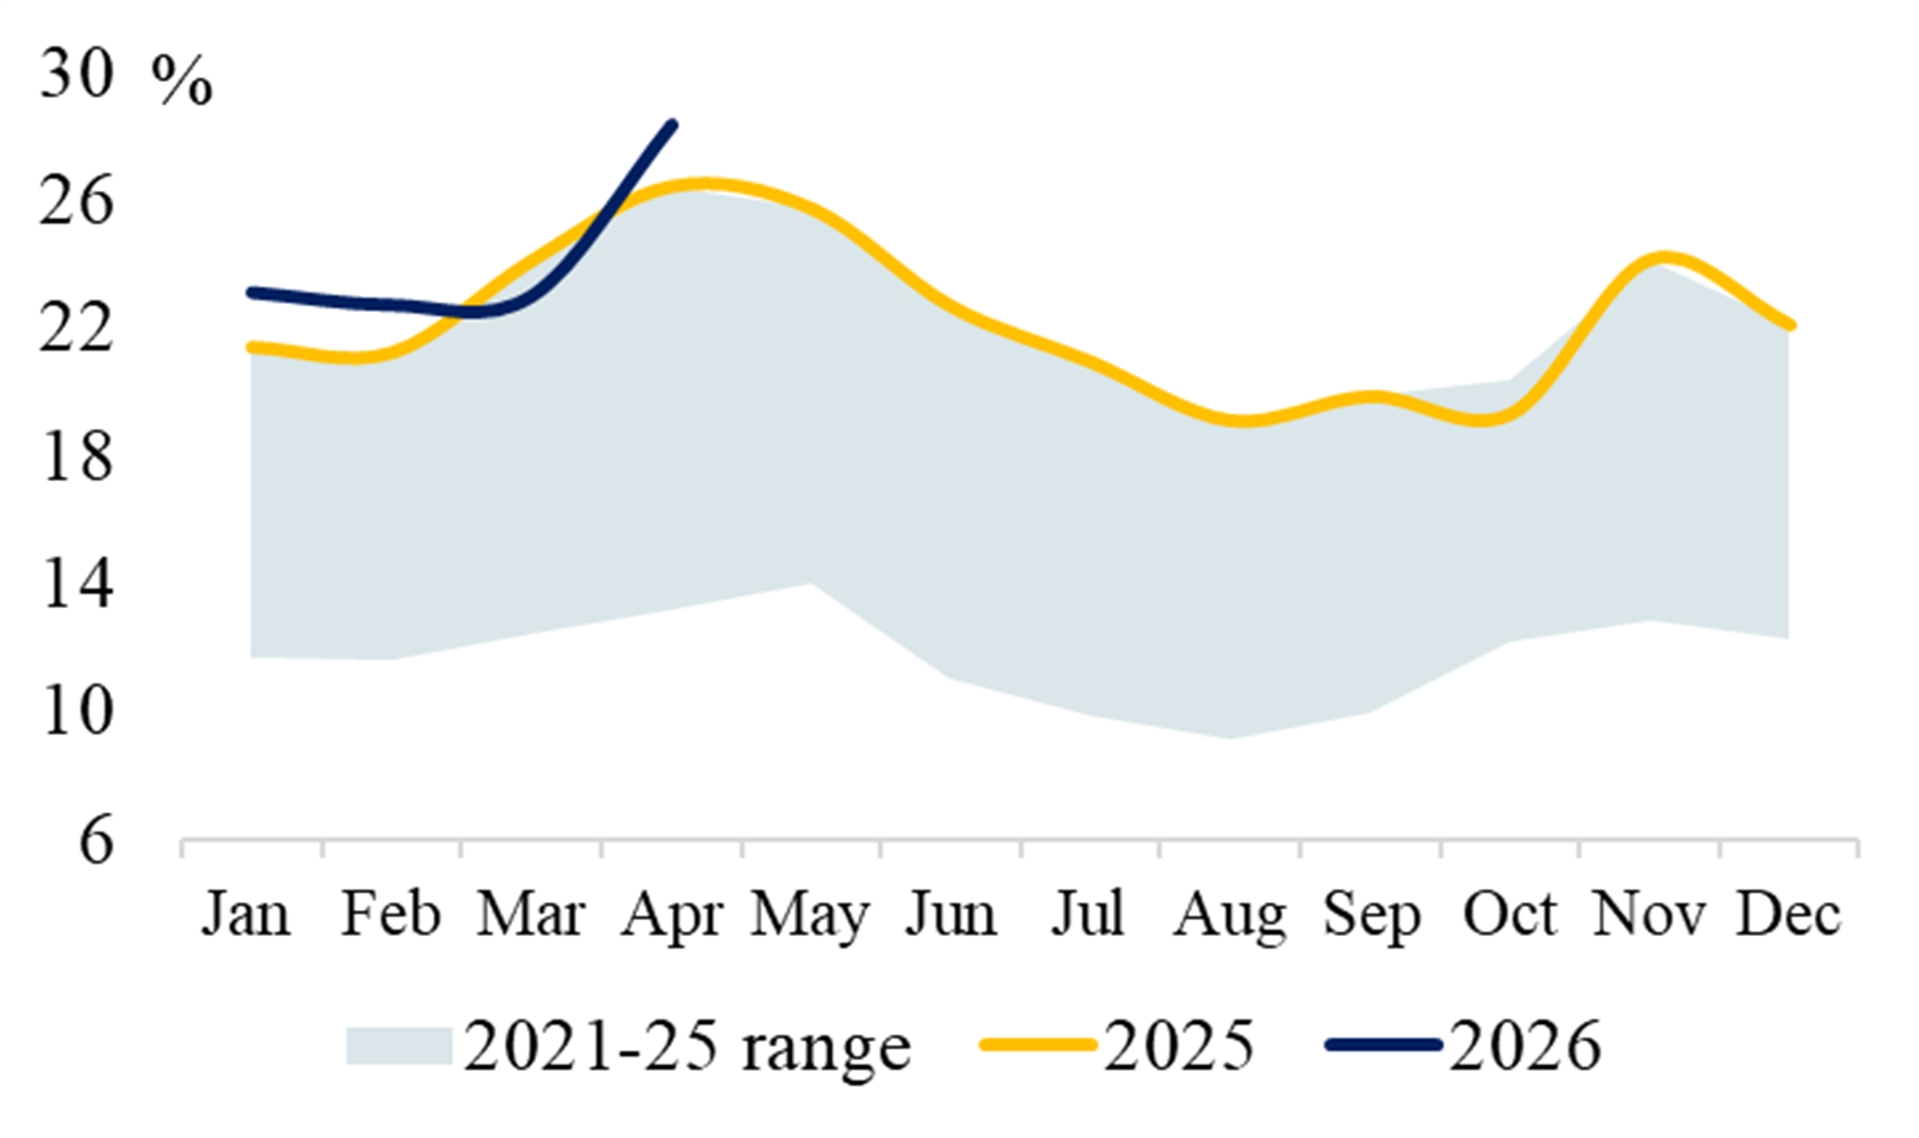
JAPAN
Exhibit 41 Power Generation Exhibit 42 Share of Gas (%)
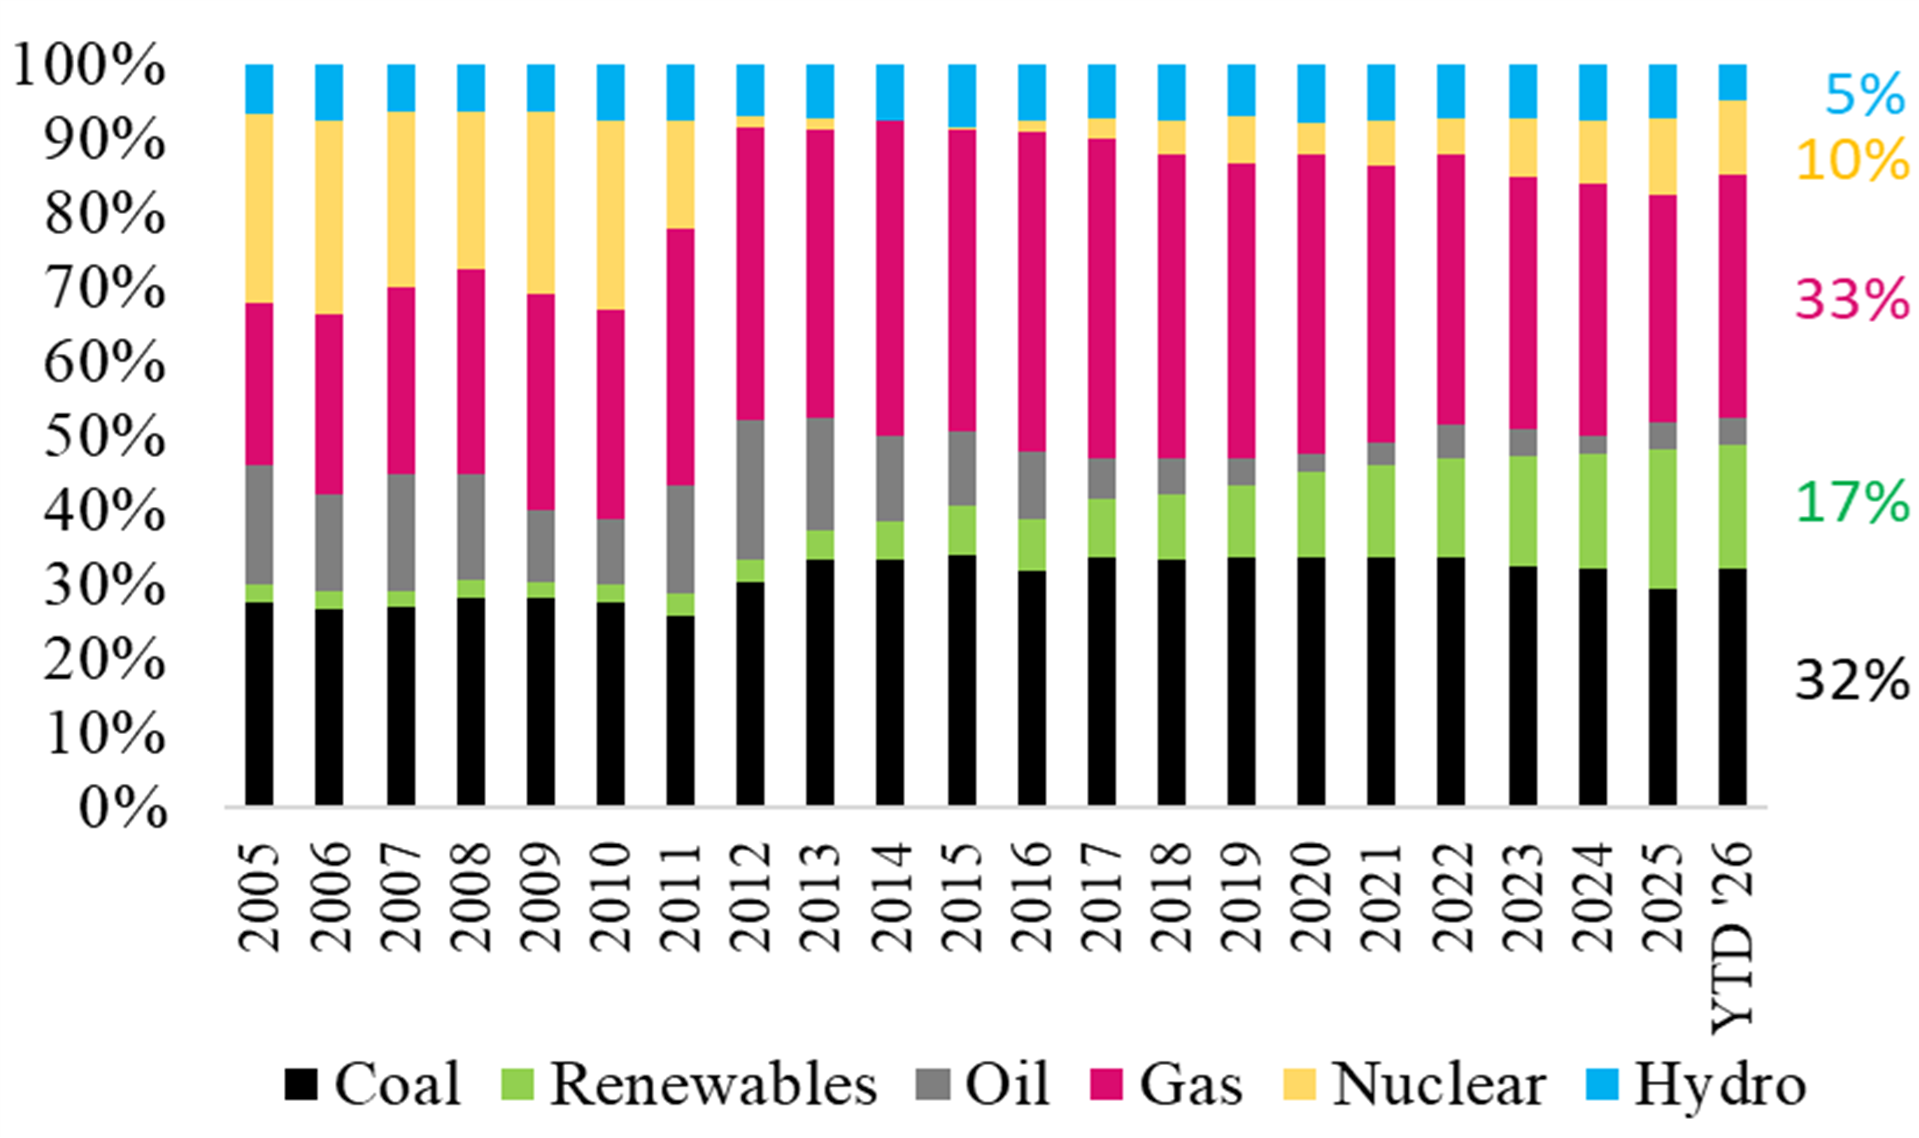
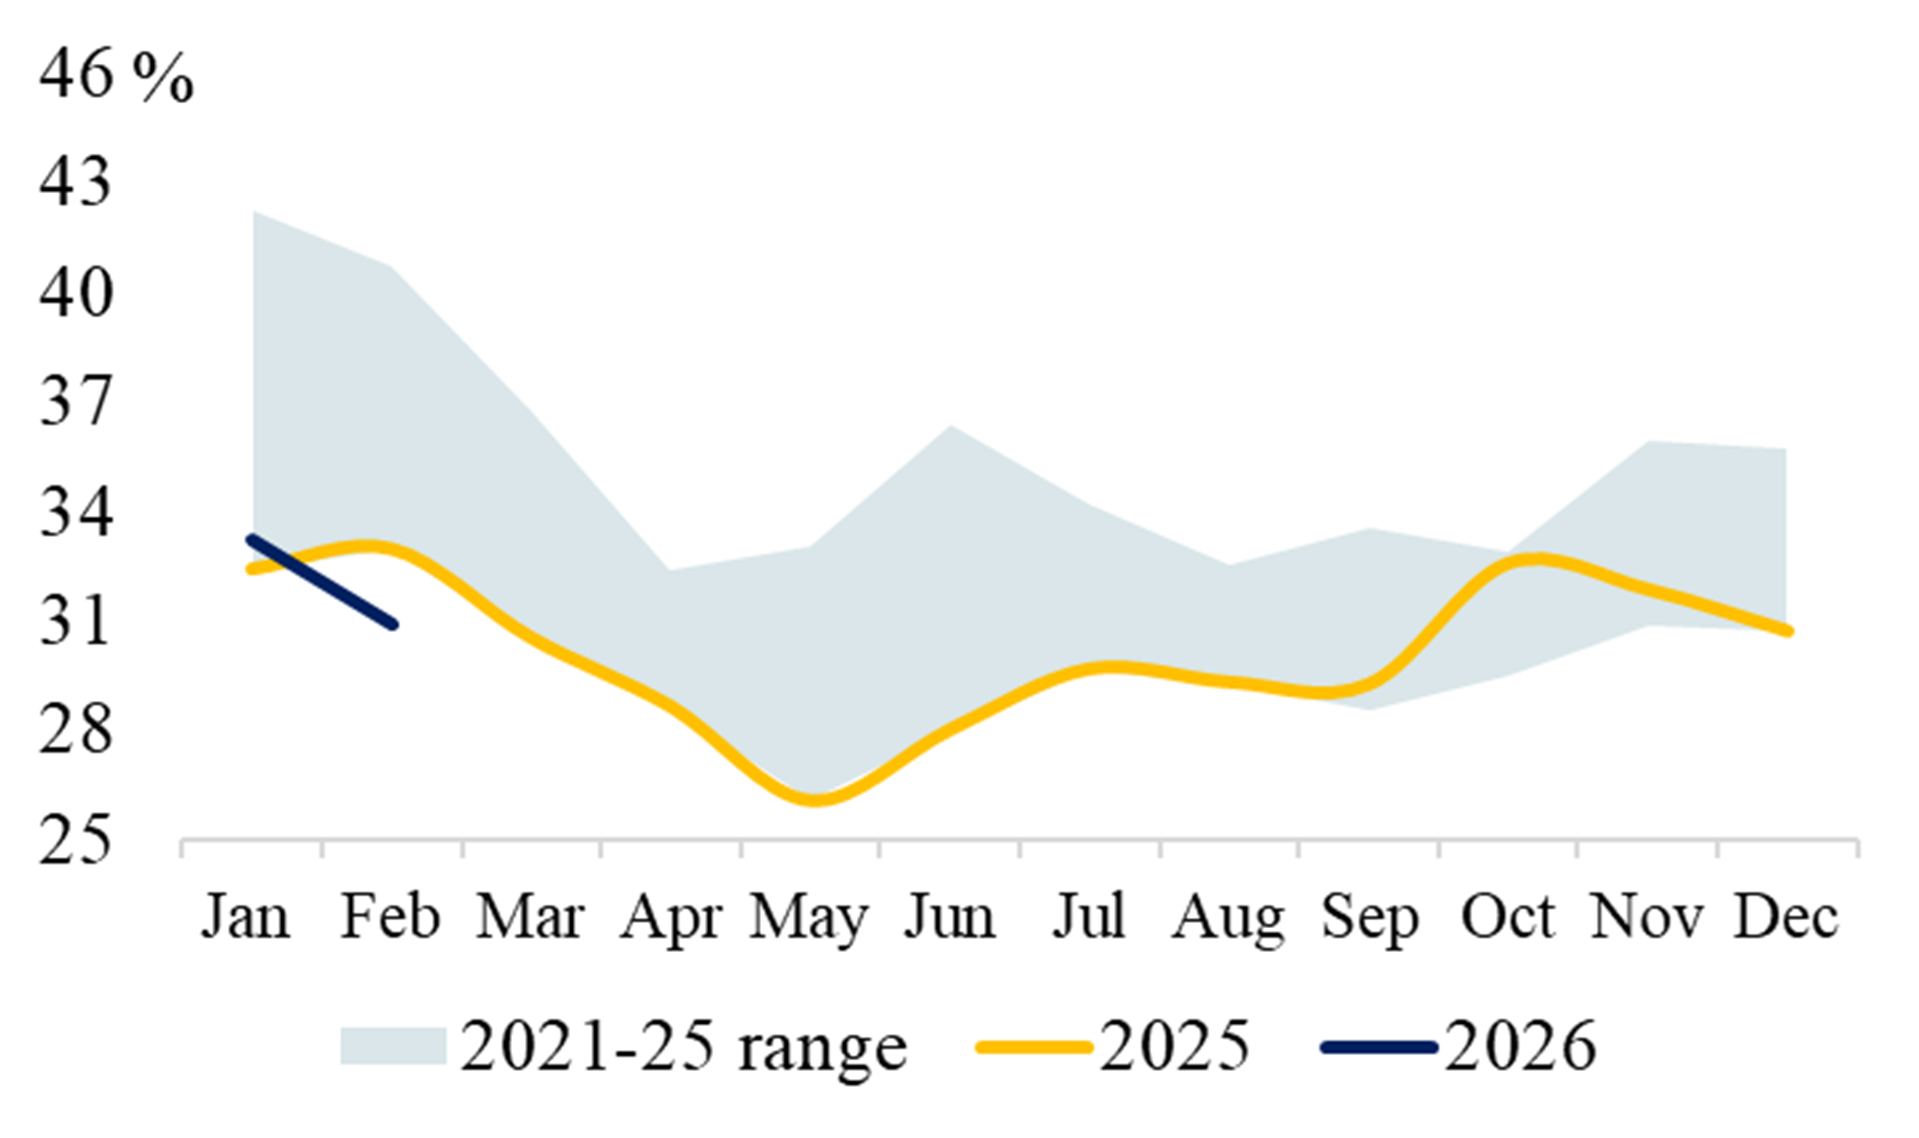
Exhibit 43 Share of Coal (%) Exhibit 44 Share of Wind & Solar (%)
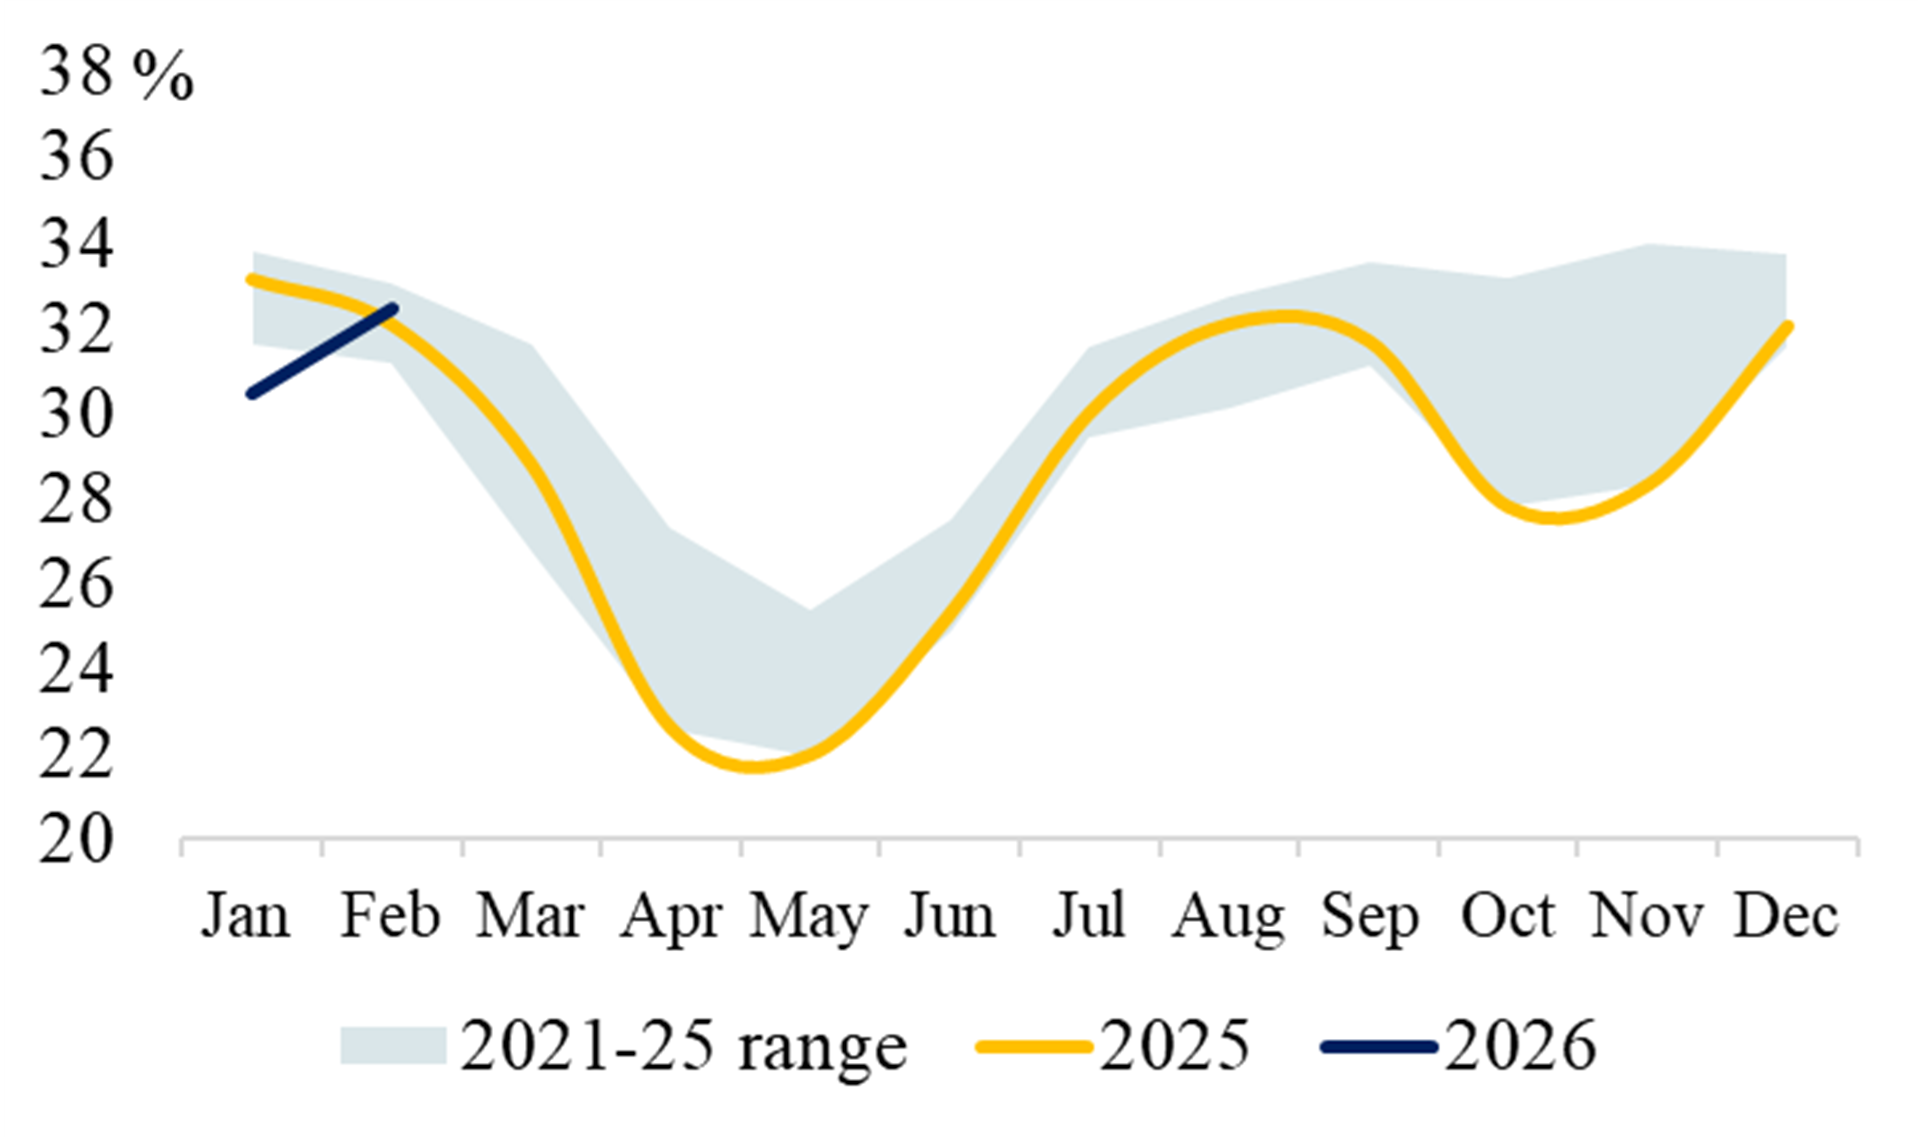
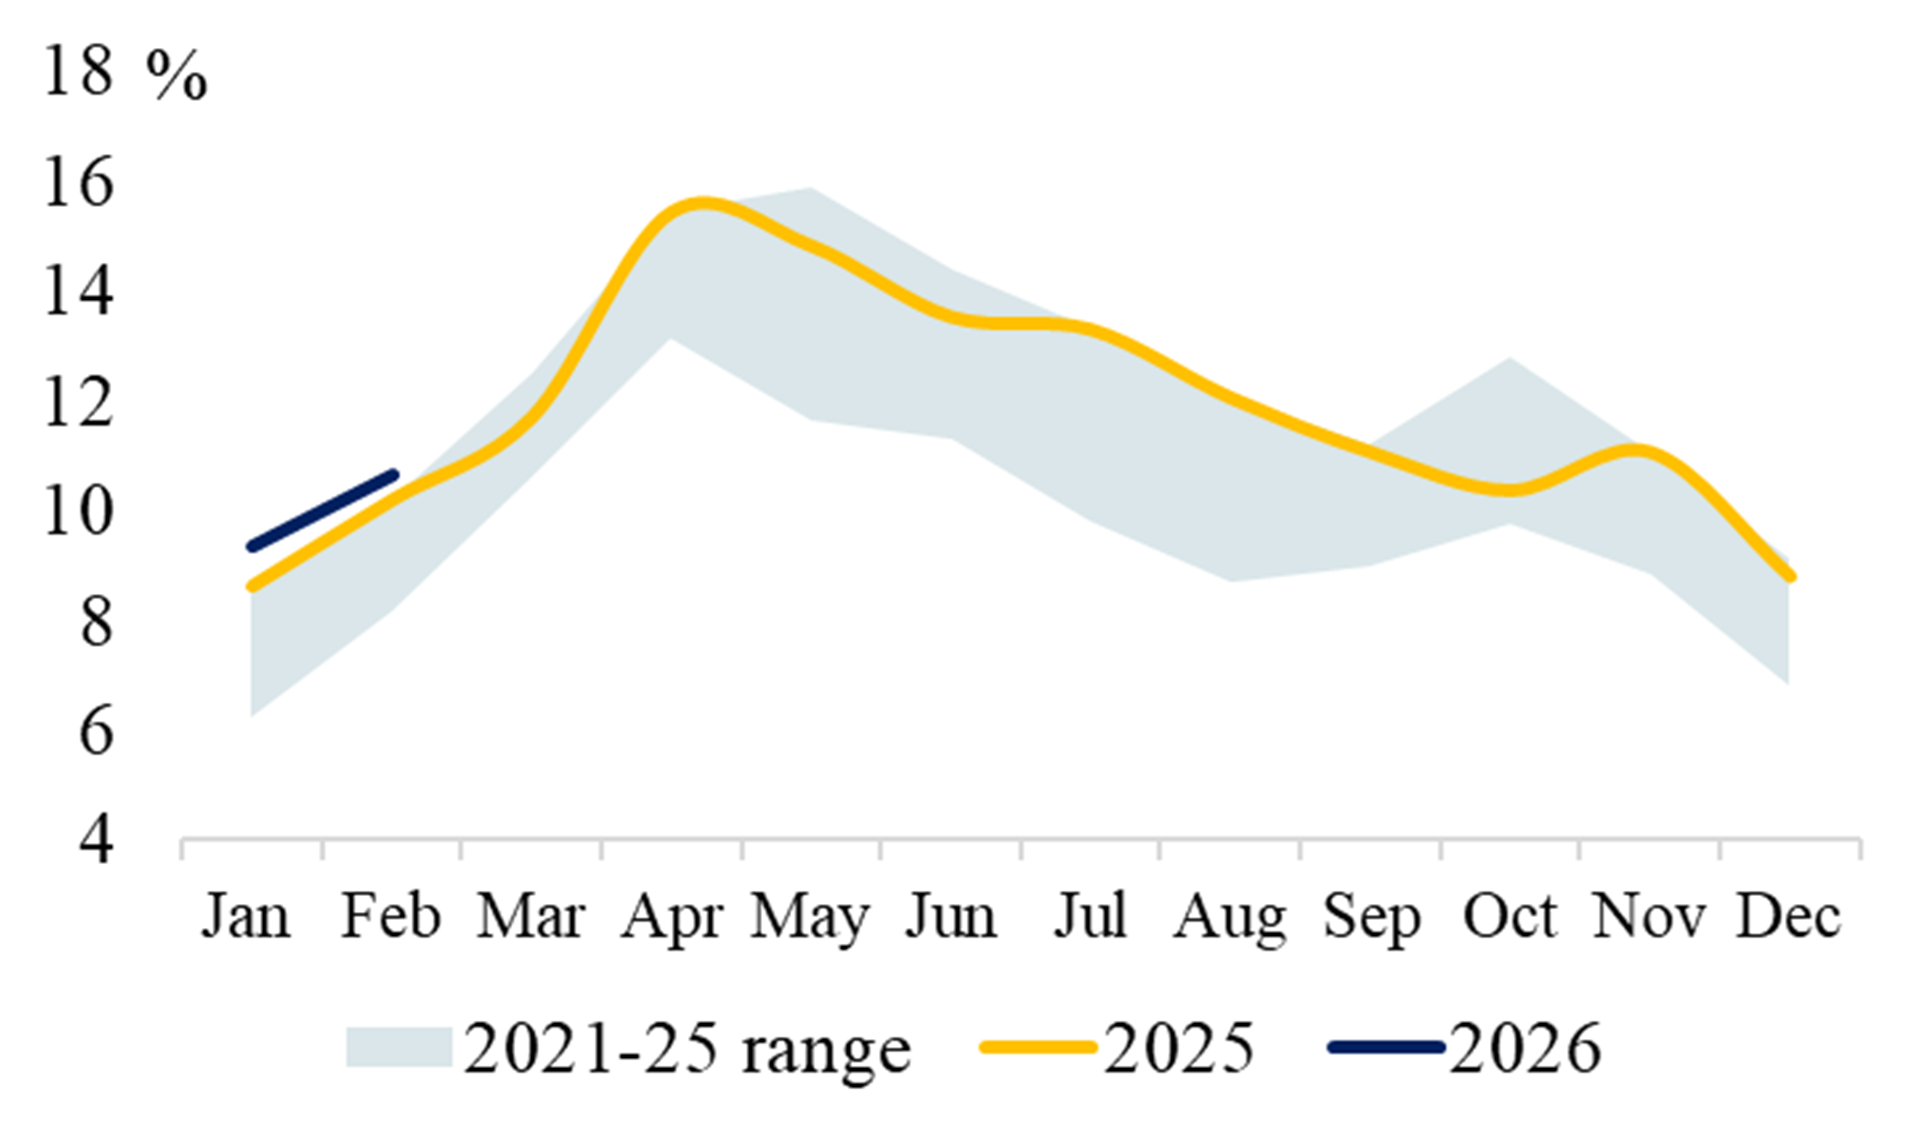
Source: EMBER
MIDDLE EAST – Energy Mix in Six Gulf Cooperation Council (GCC) Countries
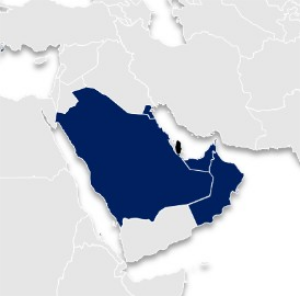
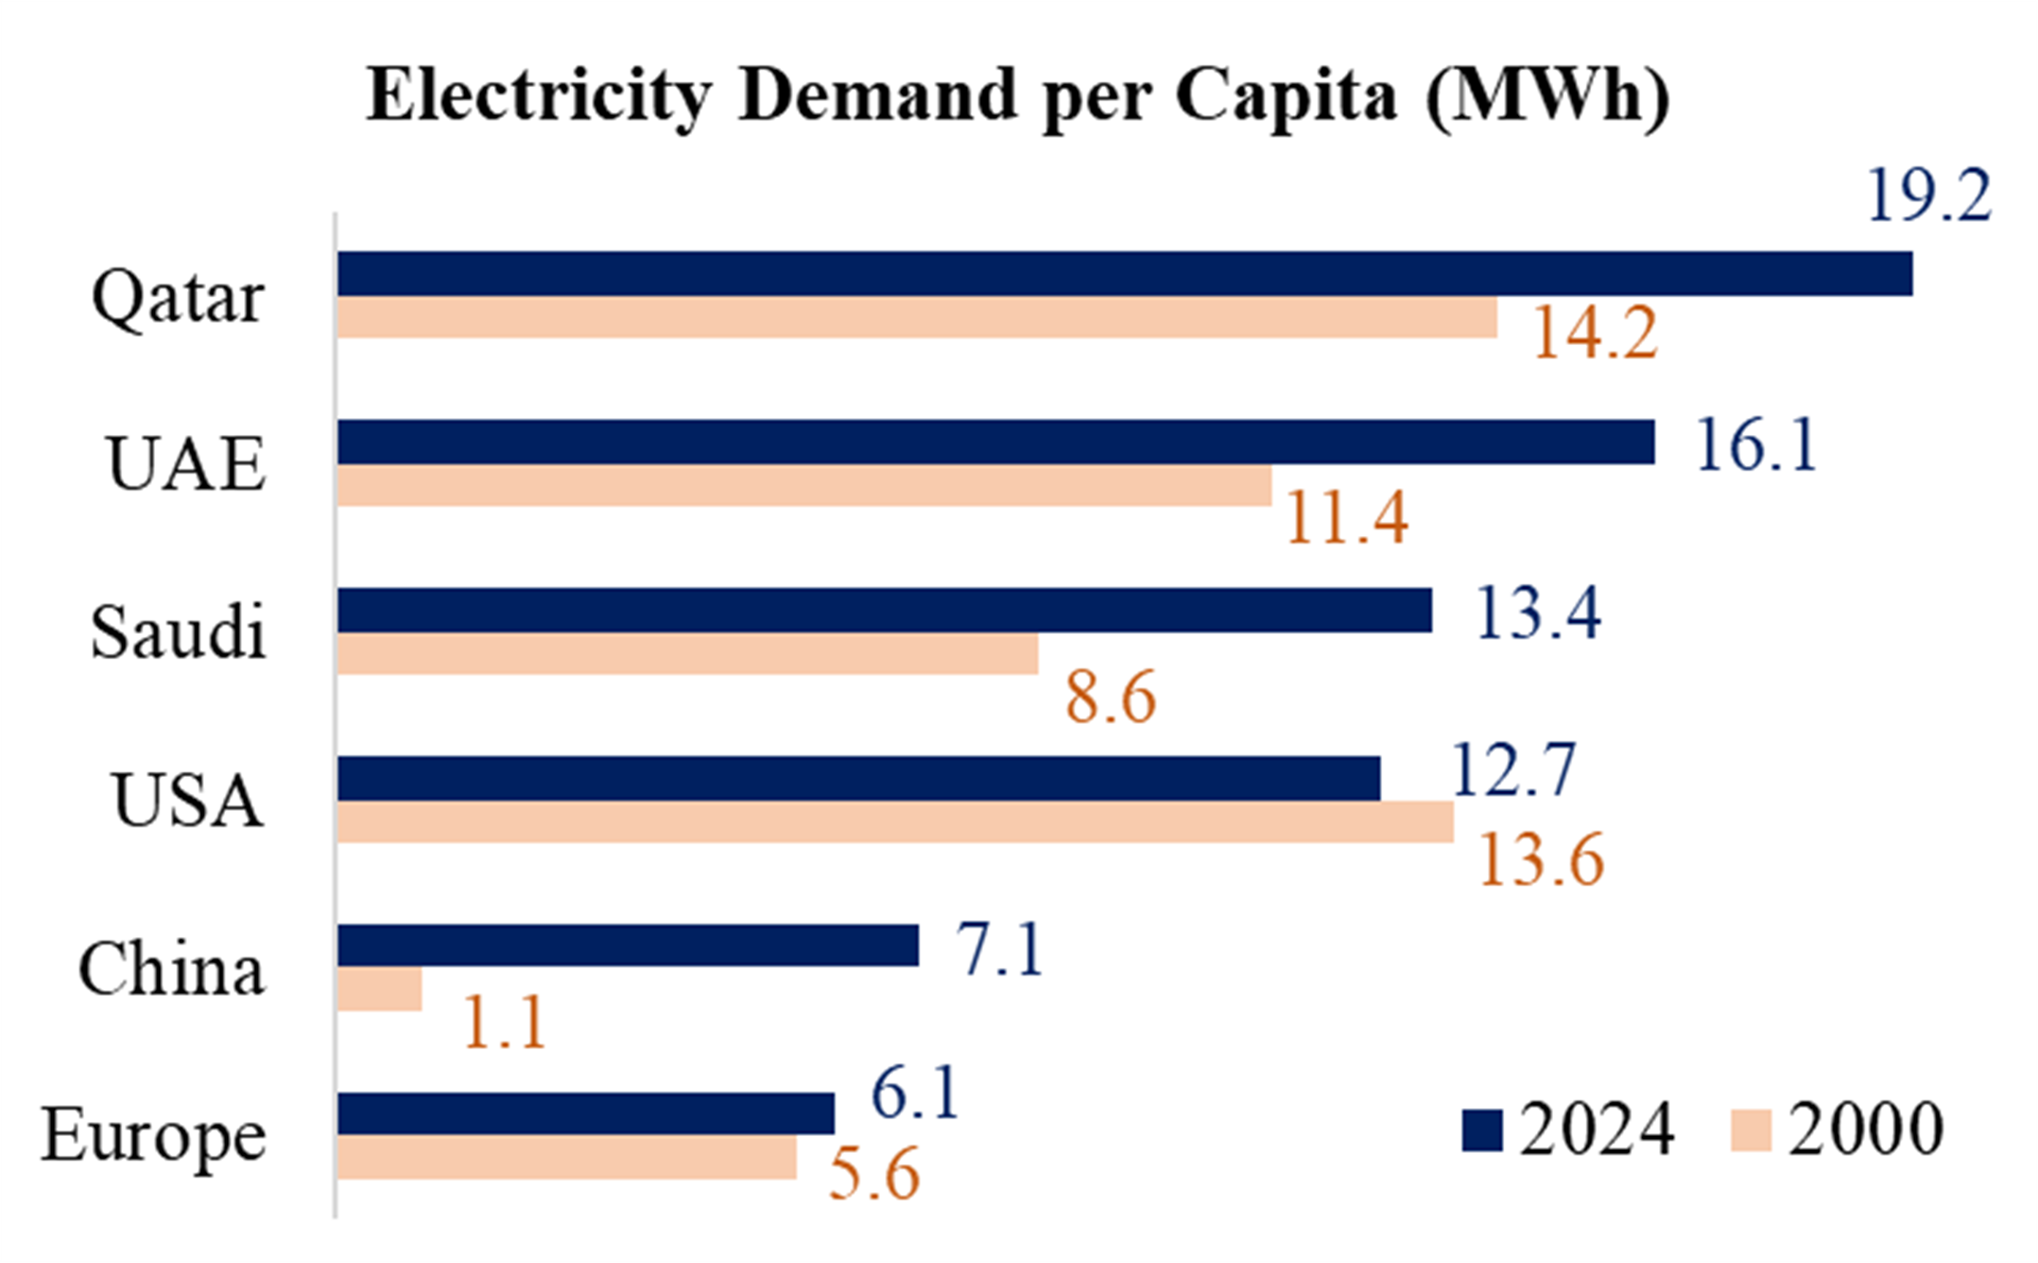
Exhibit 45 Saudi Arabia Power Gen (TWh) Exhibit 46 UAE Power Gen (TWh)
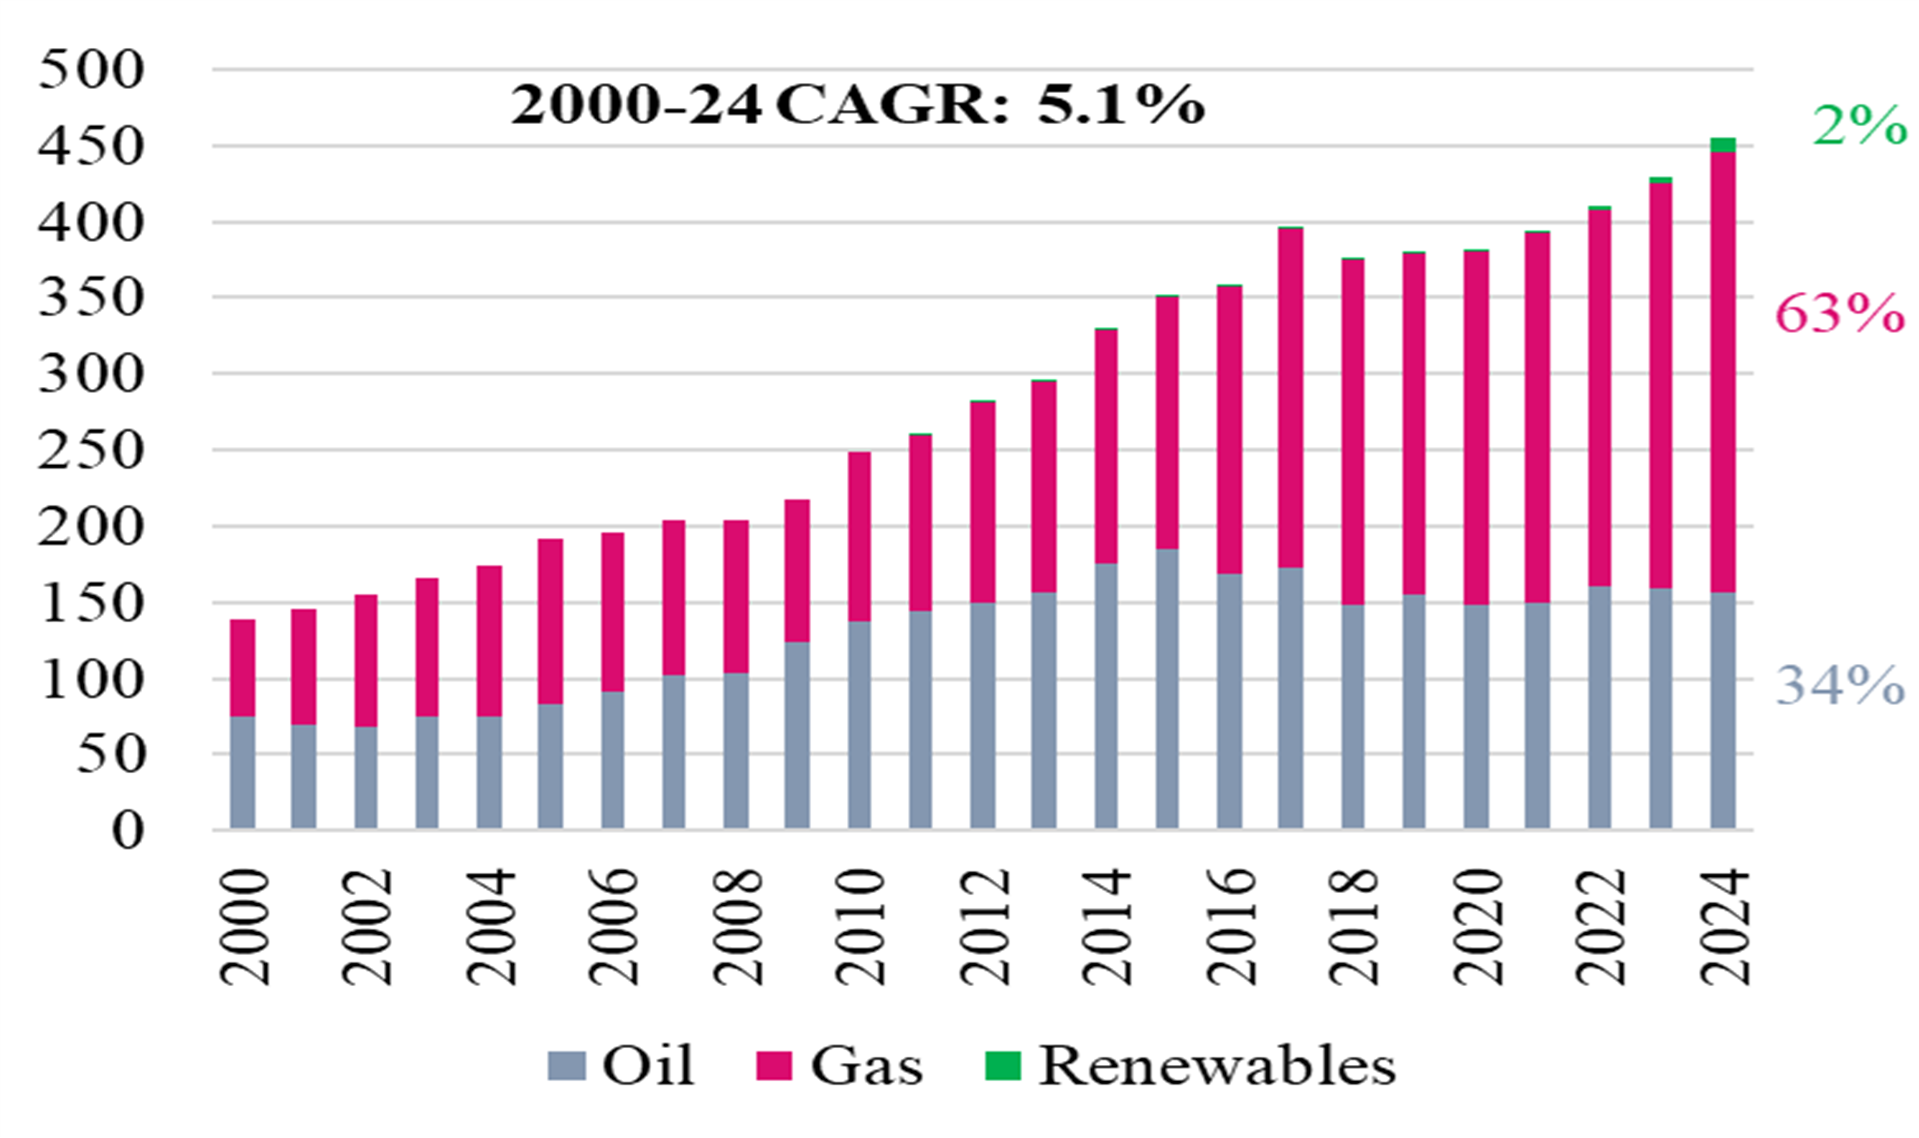
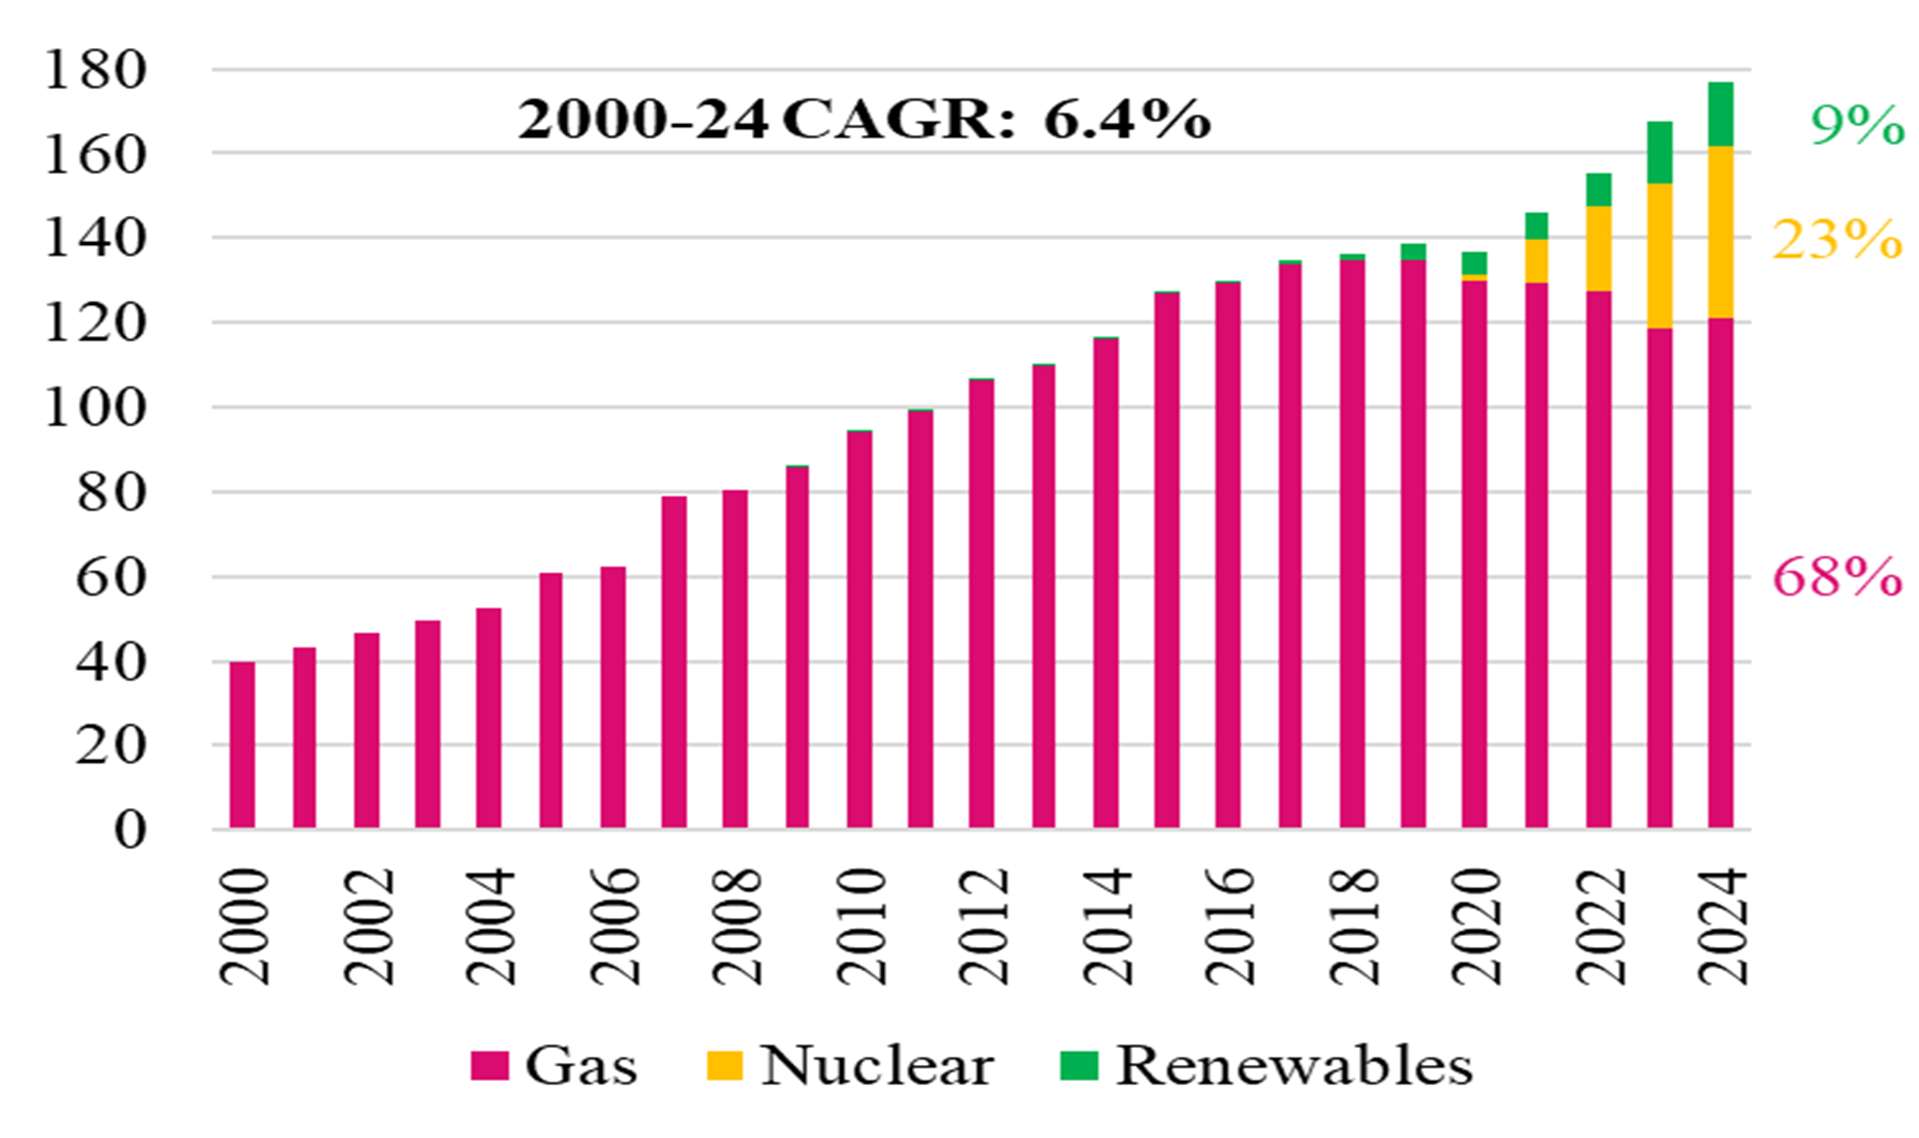
Exhibit 47 Qatar Power Gen (TWh) Exhibit 48 Kuwait Power Gen (TWh)
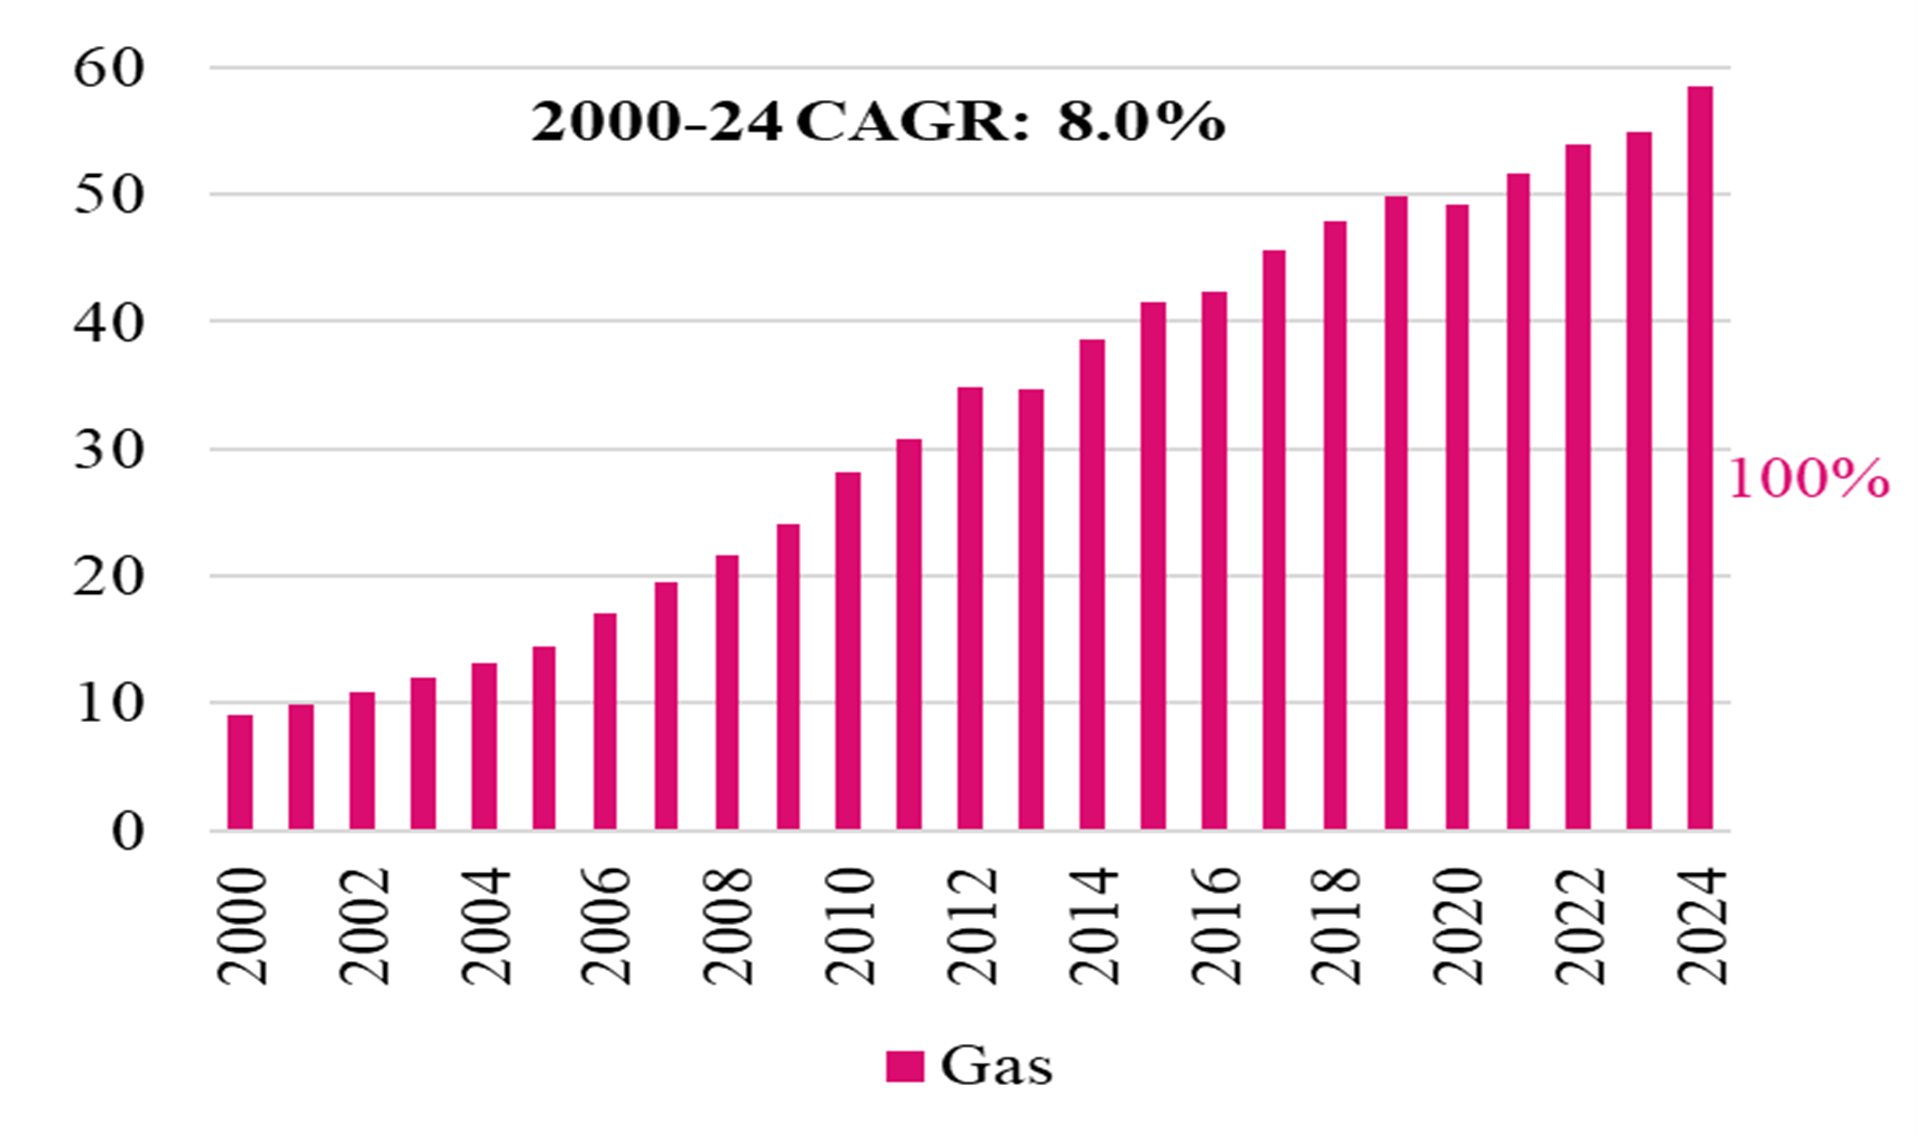
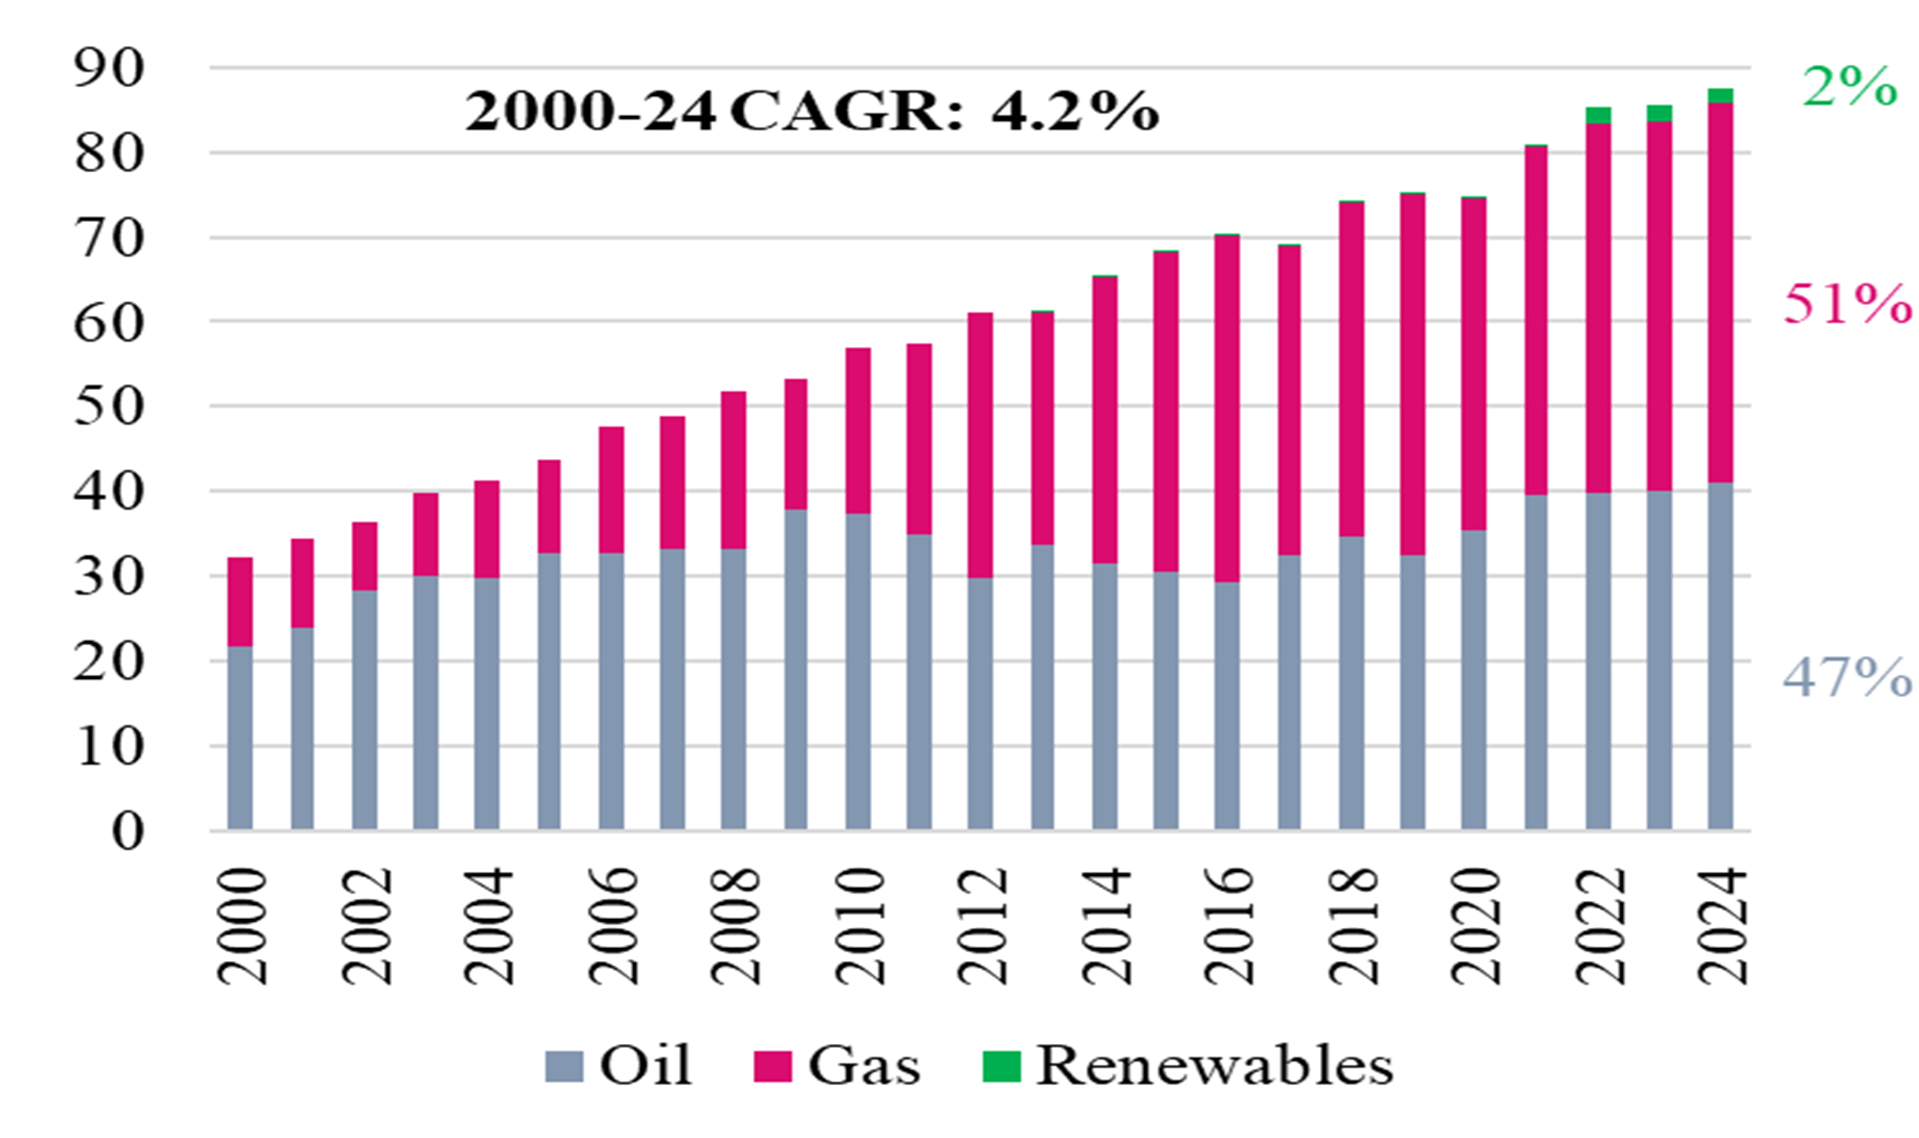
Exhibit 49 Oman Power Gen (TWh) Exhibit 50 Bahrain Power Gen (TWh)
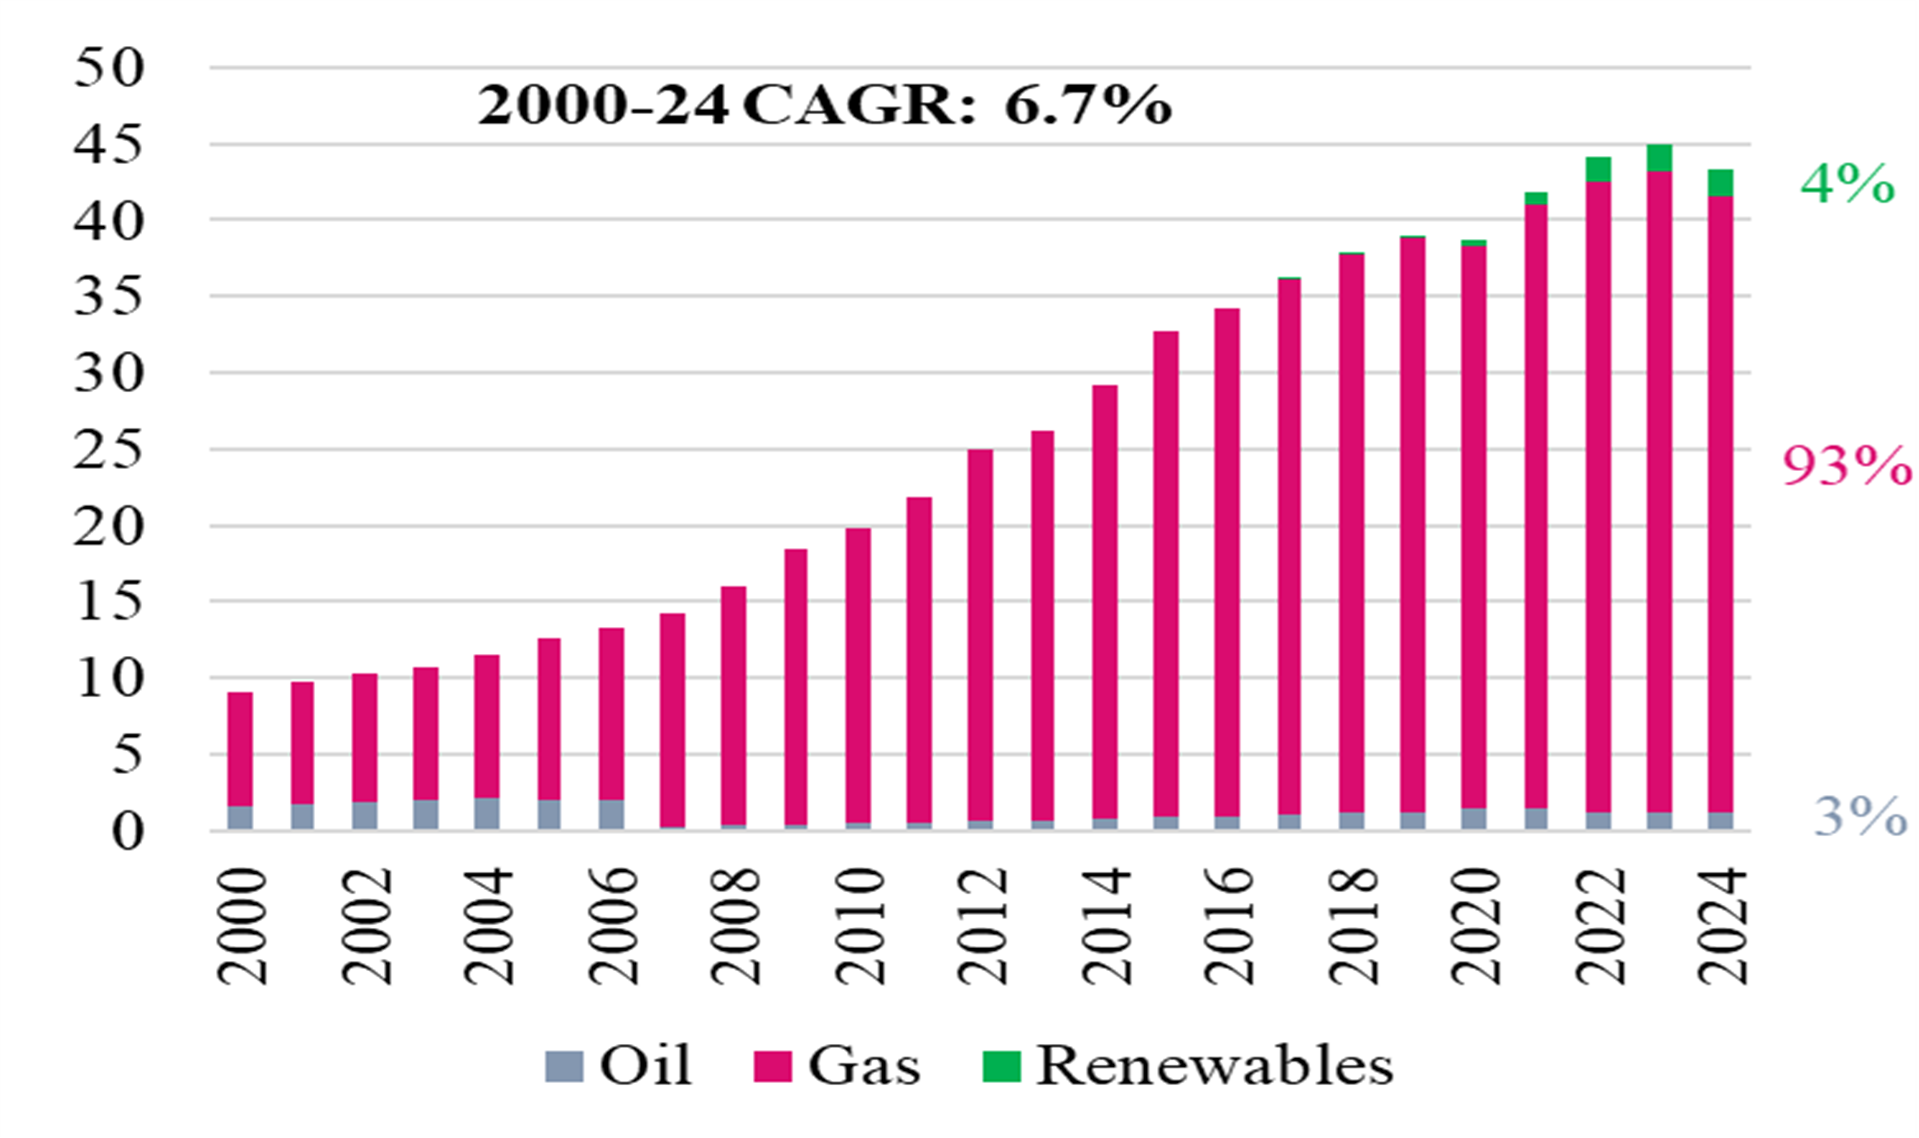
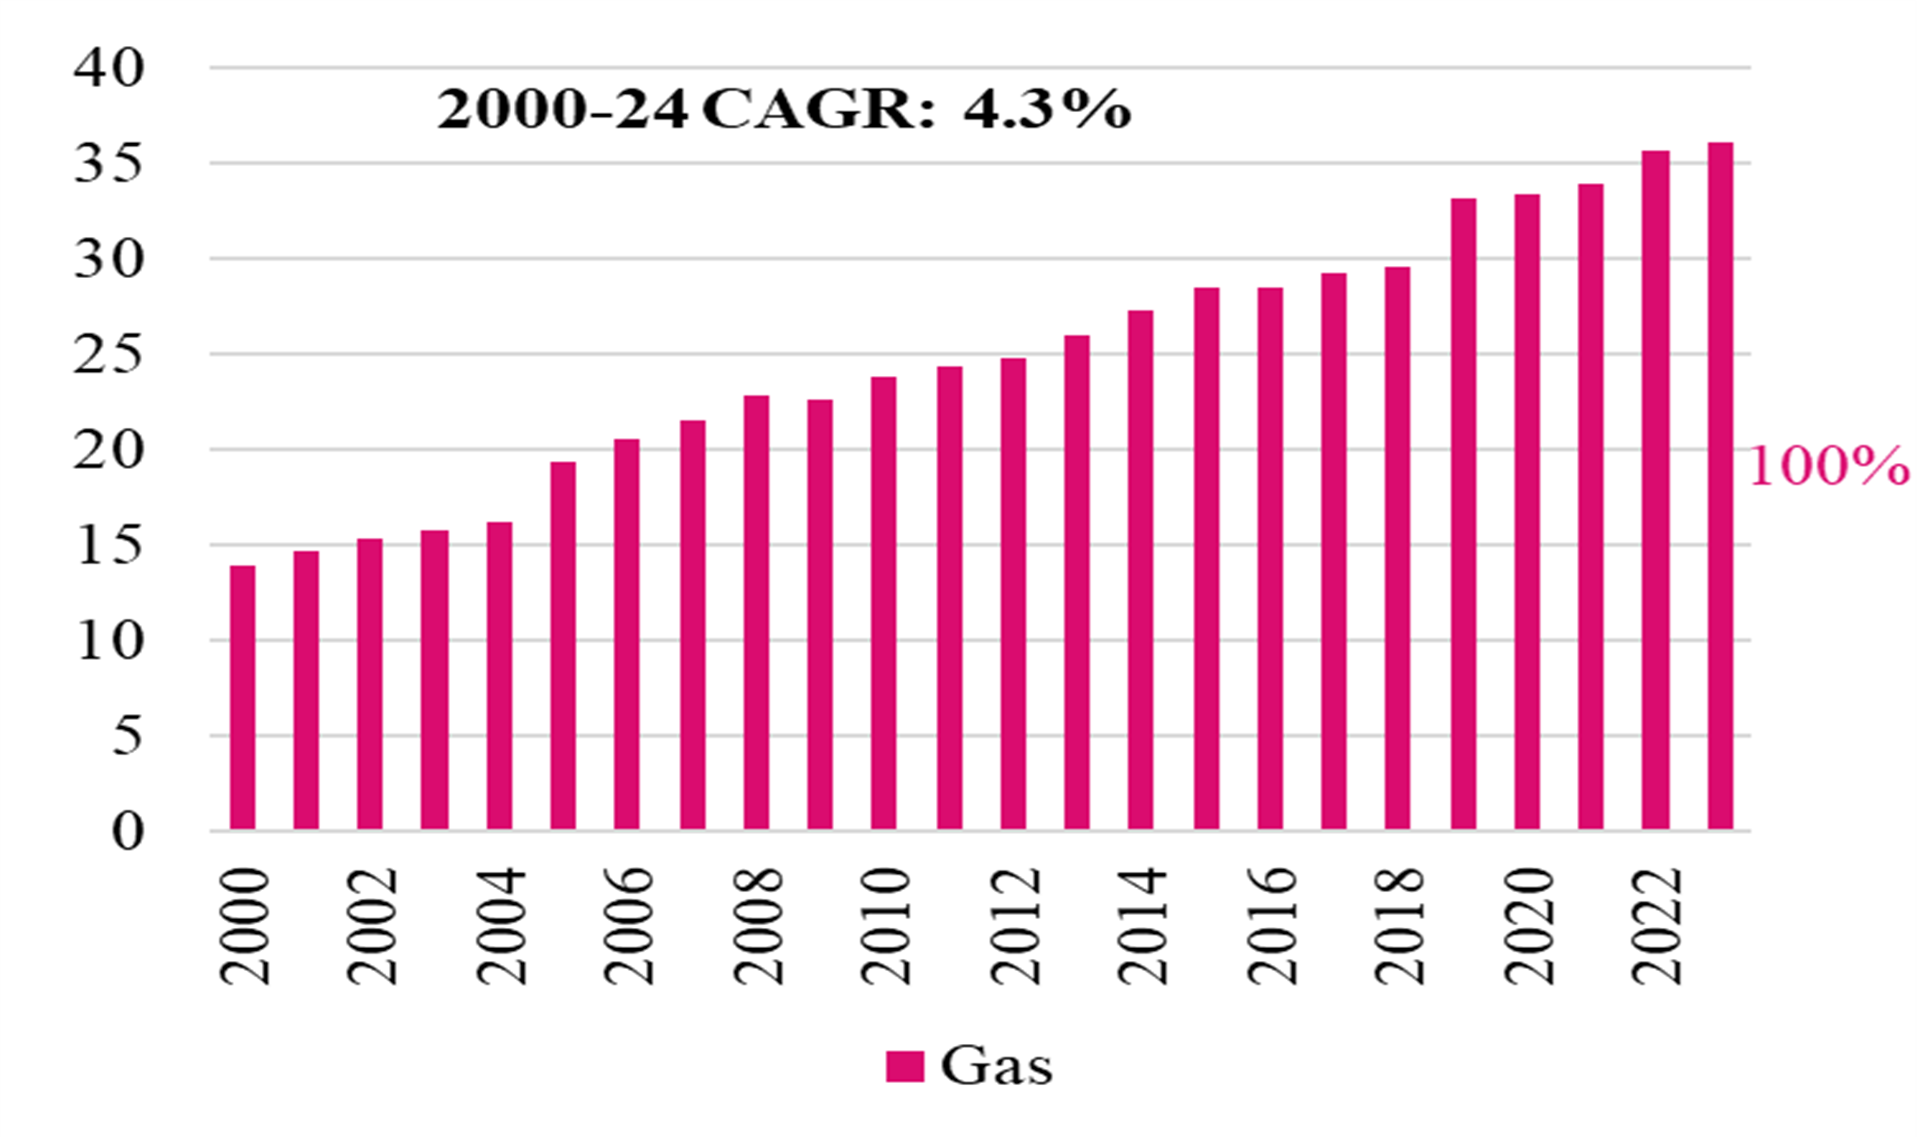
Source: EMBER
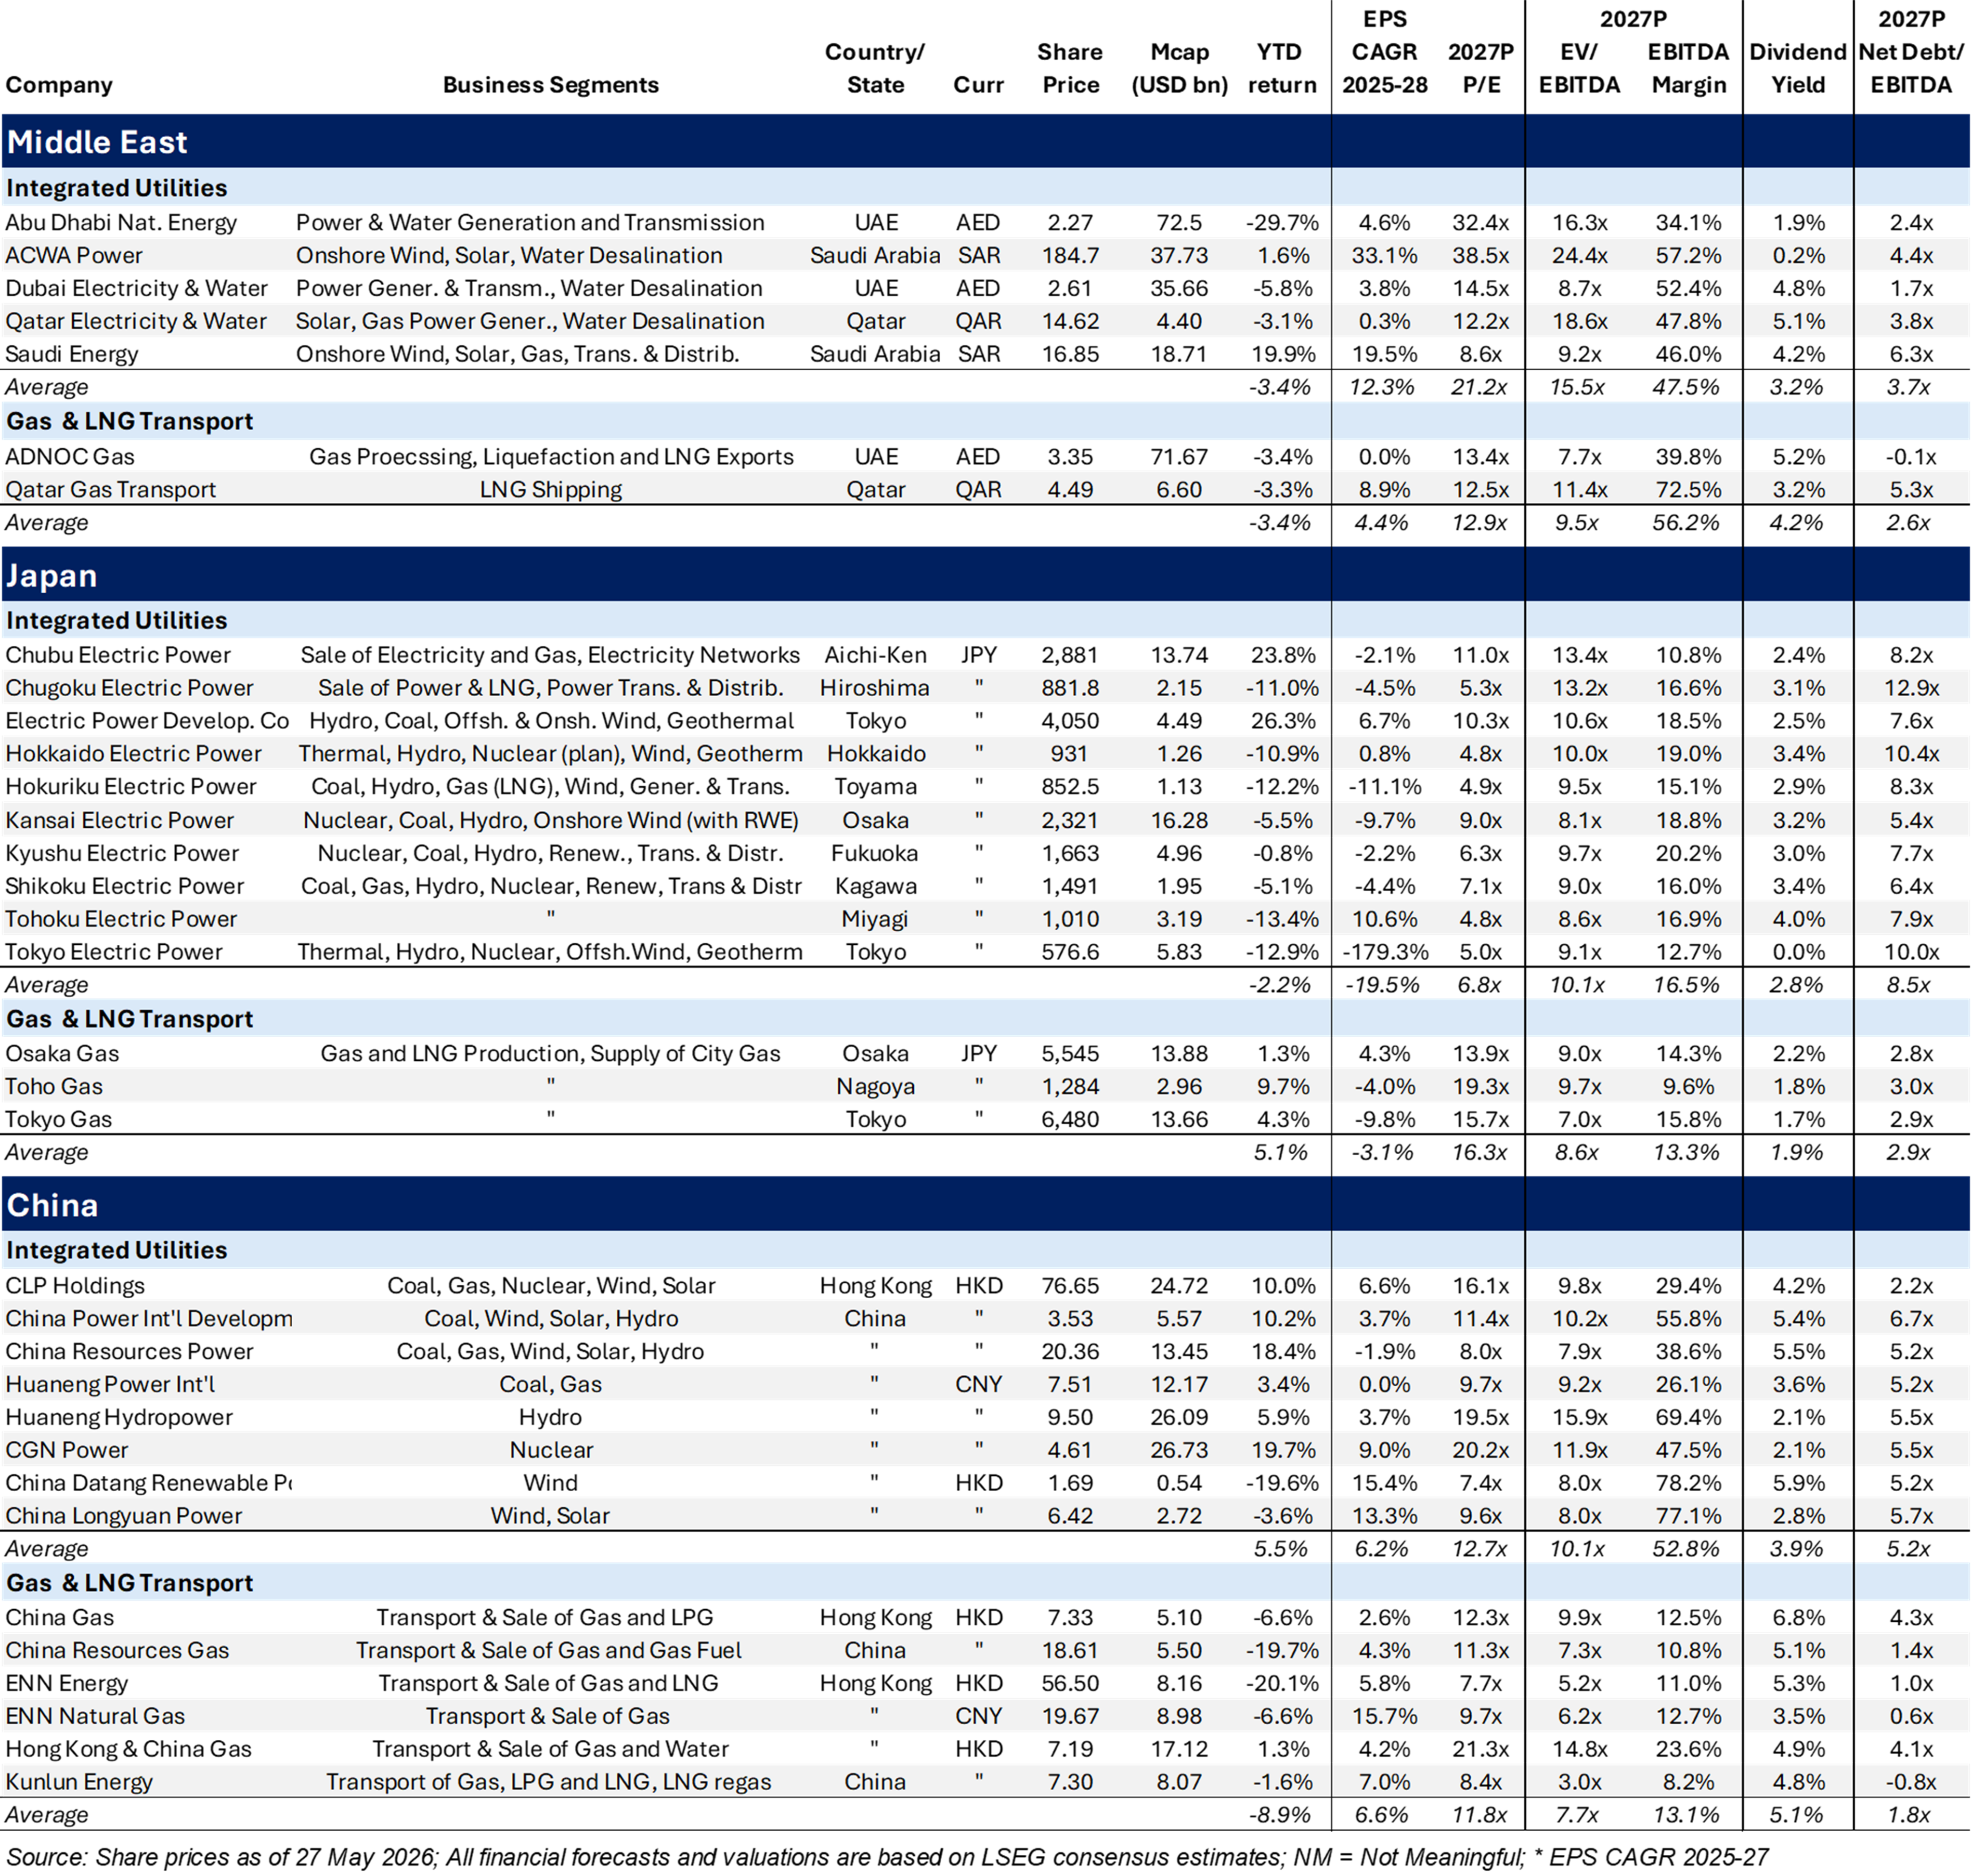
Table 4 Performance and Valuation Comps Table
249 Royal Palm Beach Way, Palm Beach, FL 33480 Gabelli Funds TEL (561) 671-2100
This whitepaper was prepared by Jens Zimmermann, CFA, by Ashish Sinah, CFA, and by Chong-Min Kang. The examples cited herein are based on public information and we make no representations regarding their accuracy or usefulness as precedent. The Research Analysts’ views are subject to change at any time based on market and other conditions. The information in this report represent the opinions of the individual Research Analysts’ as of the date hereof and is not intended to be a forecast of future events, a guarantee of future results, or investments advice. The views expressed may differ from other Research Analyst or of the Firm as a whole.
As of March 31, 2026, affiliates of GAMCO Investors, Inc. beneficially owned less than 1% of all companies mentioned.
Funds investing in a single sector, such as utilities, may be subject to more volatility than funds that invest more broadly. The utilities industry can be significantly affected by government regulation, financing difficulties, supply or demand of services or fuel and natural resources conservation. The value of utility stocks changes as long-term interest rates change
Investors should carefully consider the investment objectives, risks, charges and expenses of the Fund before investing. The prospectus, which contains more complete information about this and other matters, should be read carefully before investing. To obtain a prospectus, please call 800 GABELLI or visit www.gabelli.com
Returns represent past performance and do not guarantee future results. Current performance may be lower or higher than the performance data quoted. Investment return and principal value will fluctuate so, upon redemption, shares may be worth more or less than their original cost. To obtain the most recent month end performance information and a prospectus, please call 800-GABELLI or visit www.gabelli.com
Distributed by G.distributors, LLC., a registered broker dealer and member of FINRA.
This whitepaper is not an offer to sell any security nor is it a solicitation of an offer to buy any security.
For more information, visit our website at: www.gabelli.com or call: 800-GABELLI
800-422-3554 • 914-921-5000 • Fax 914-921-5098 • info@gabelli.com
Gabelli Funds, LLC is a registered investment adviser with the Securities and Exchange Commission and is a wholly owned subsidiary of GAMCO Investors, Inc. (OTCQX: GAMI).