August 2026: 1H 2026 results mostly meet or beat in Europe, guidance confirmed or raised
What You Need to Know
Last Friday, the Iran war reached its six-month mark, and while oil flows through the Strait of Hormuz have improved, they remain at roughly half of prewar levels. Commodity prices are therefore still elevated — European gas prices have hit their highest level since the war began in February — pushing up inflation expectations and lifting 10-year bond yields to their highest levels since the conflict started (UK above 5%, US at 4.7% and Germany at 3.3%). Against this backdrop, energy stocks have erased their 2Q losses, incurred when hopes for a peace deal were high: quarter-to-date through 26 August, the MSCI World Energy index has outperformed the broader MSCI World by more than 10%. Rising rates, by contrast, have weighed on global utilities, which fell in both July and August. Since the start of the Iran war, the MSCI World Utilities index has lost 7.6% as of 26 August 2026, against a 9.3% gain for MSCI World Energy and an 8.8% rise in the broader MSCI World. The decline since February has hit every region, led by US utilities (-8.8%), followed by Asia (-7.1%) and Europe (-4.6%), see Table 1.
Table 1 Index Performances

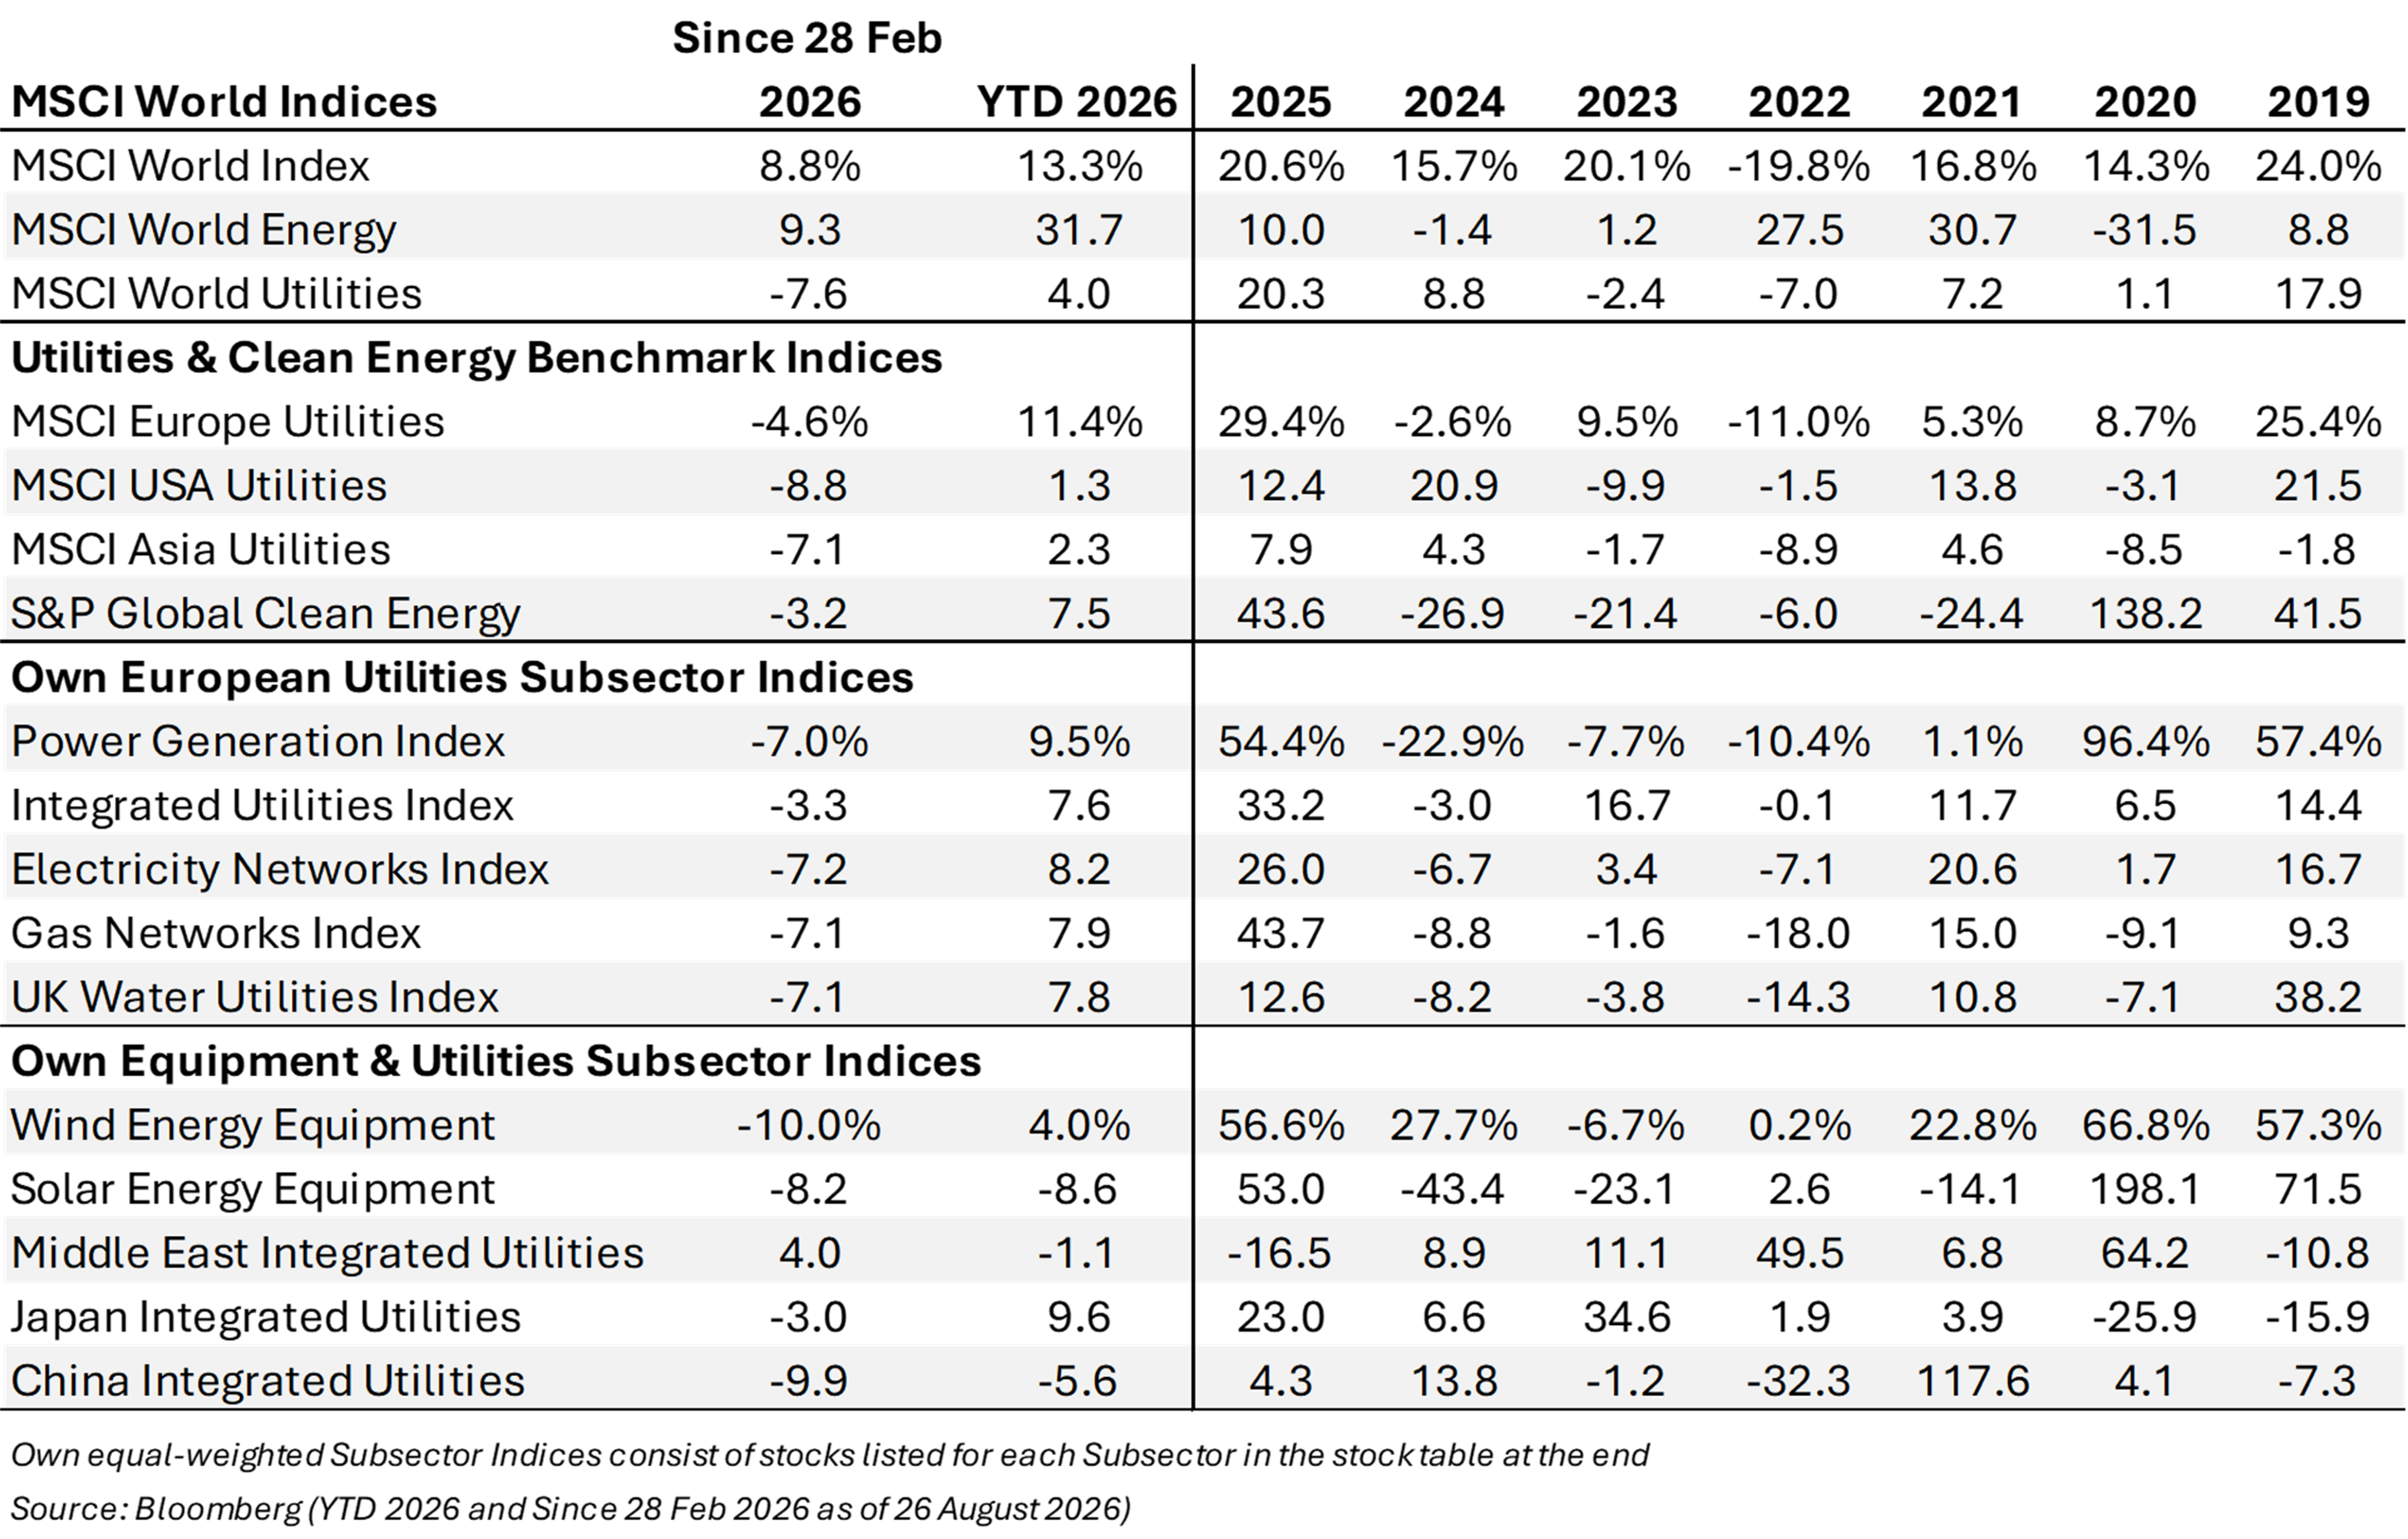
The war losses have eaten into utilities’ year-to-date performance: the MSCI World Utilities index is now clinging to a 4% gain for 2026, underperforming the MSCI World Energy index and the broader MSCI World by wide margins of 27 and 9 percentage points, respectively. Utilities in every region have likewise given back a large share of their earlier gains, though all remain in positive territory year-to-date, led by Europe with 11.4%, Asia with 2.3% and the US with just 1.3% (as of 26 August). Europe’s still-solid gain is echoed in our five equal-weighted utilities subsector indices, all of which are up between 7.5% and 9.5% year-to-date, led by “Power Generation” and “Electricity Networks”. Even our UK water utilities index is posting a solid 7.8% year-to-date gain despite the ongoing political uncertainty regarding water stocks in the country. Among the equal-weighted utilities indices in other regions, only Japanese utilities have held on to their year-to-date gains throughout the Iran conflict, while utilities in the Middle East and China are now sitting on 2026 losses of 1.1% and 5.6% respectively (see Figure 1).

Exhibit 1 Short-Term PERFORMANCE Exhibit 2 Long-Term VALUATION
(rebased since 2025) (1-yr Forward EV/EBITDA since 2017)
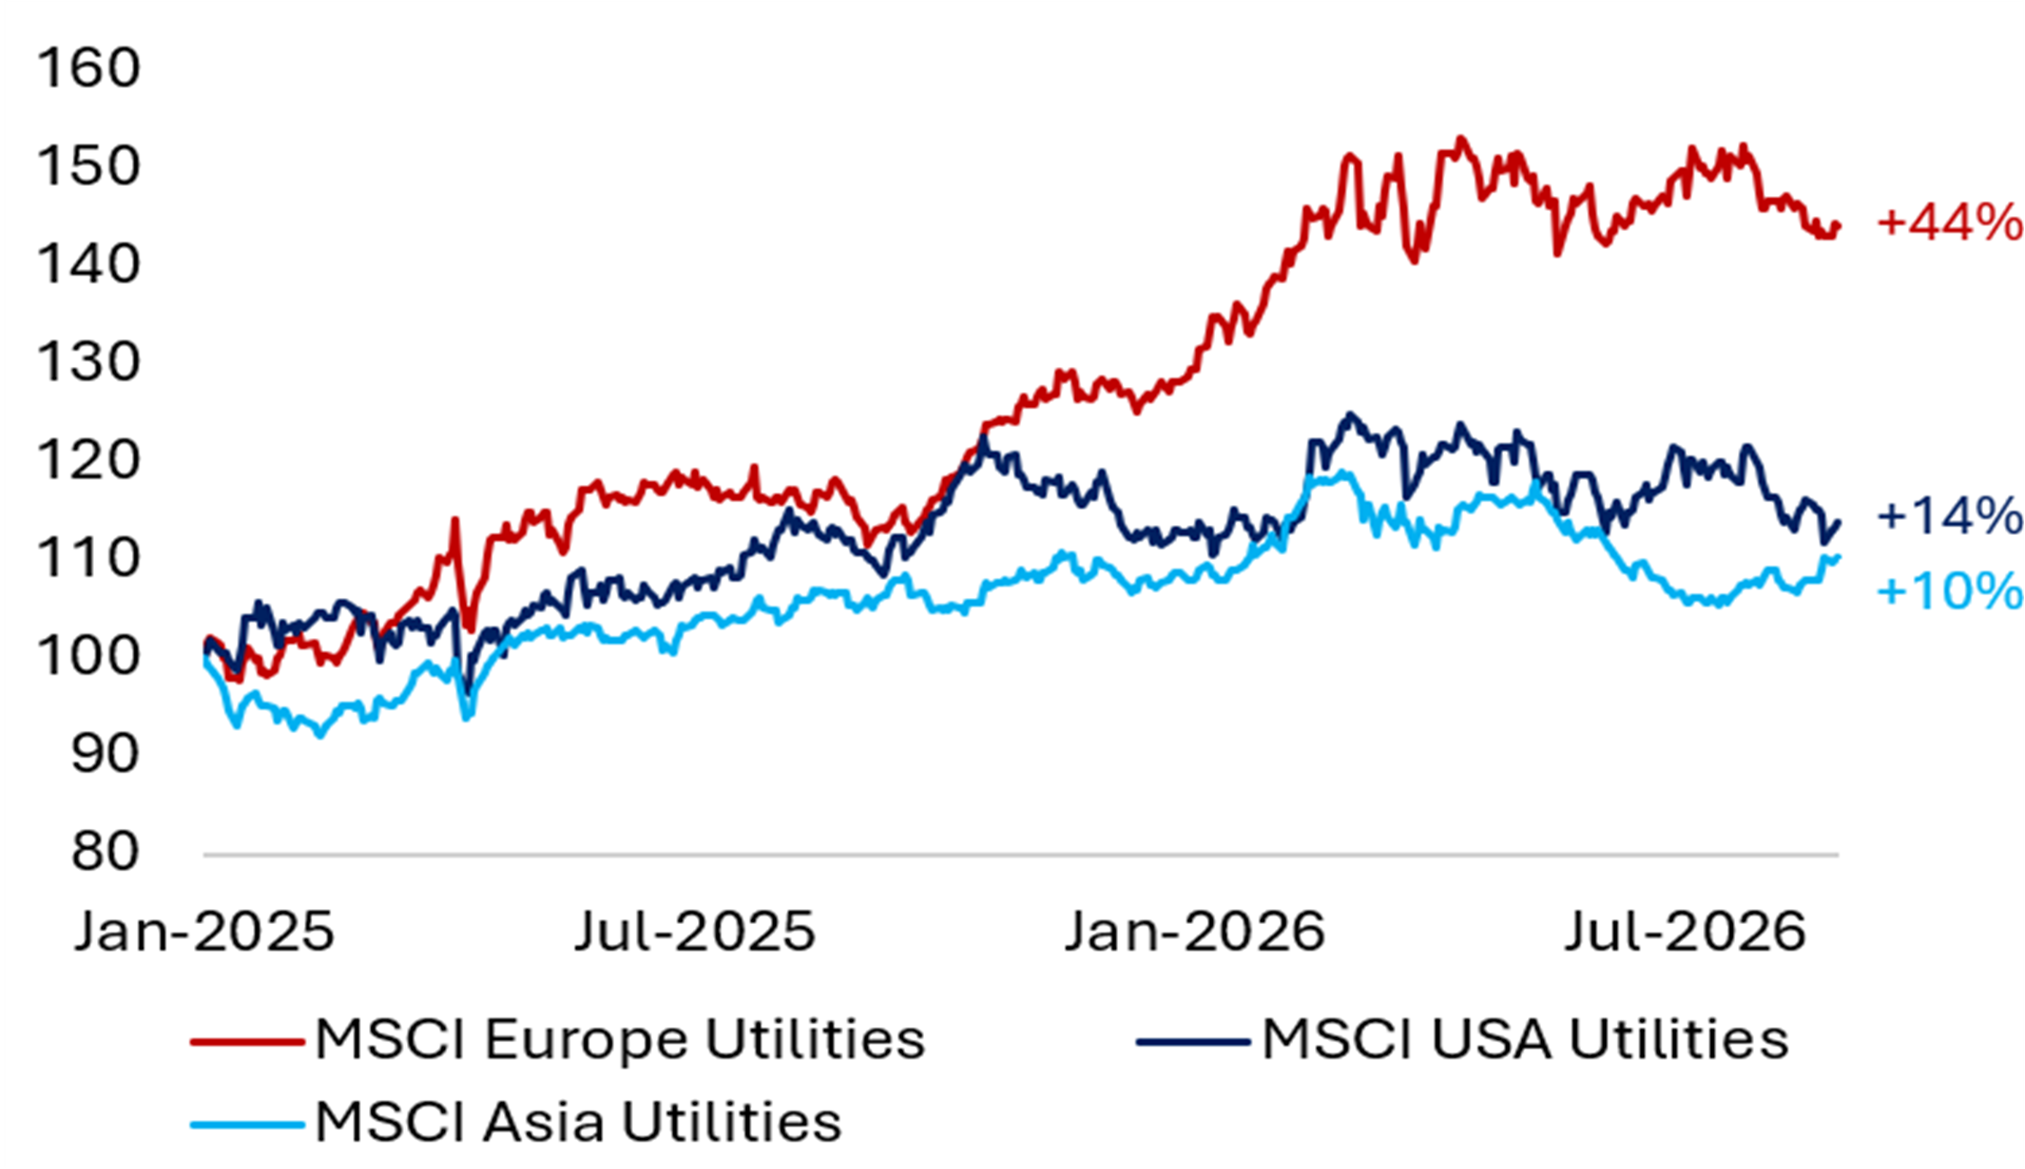
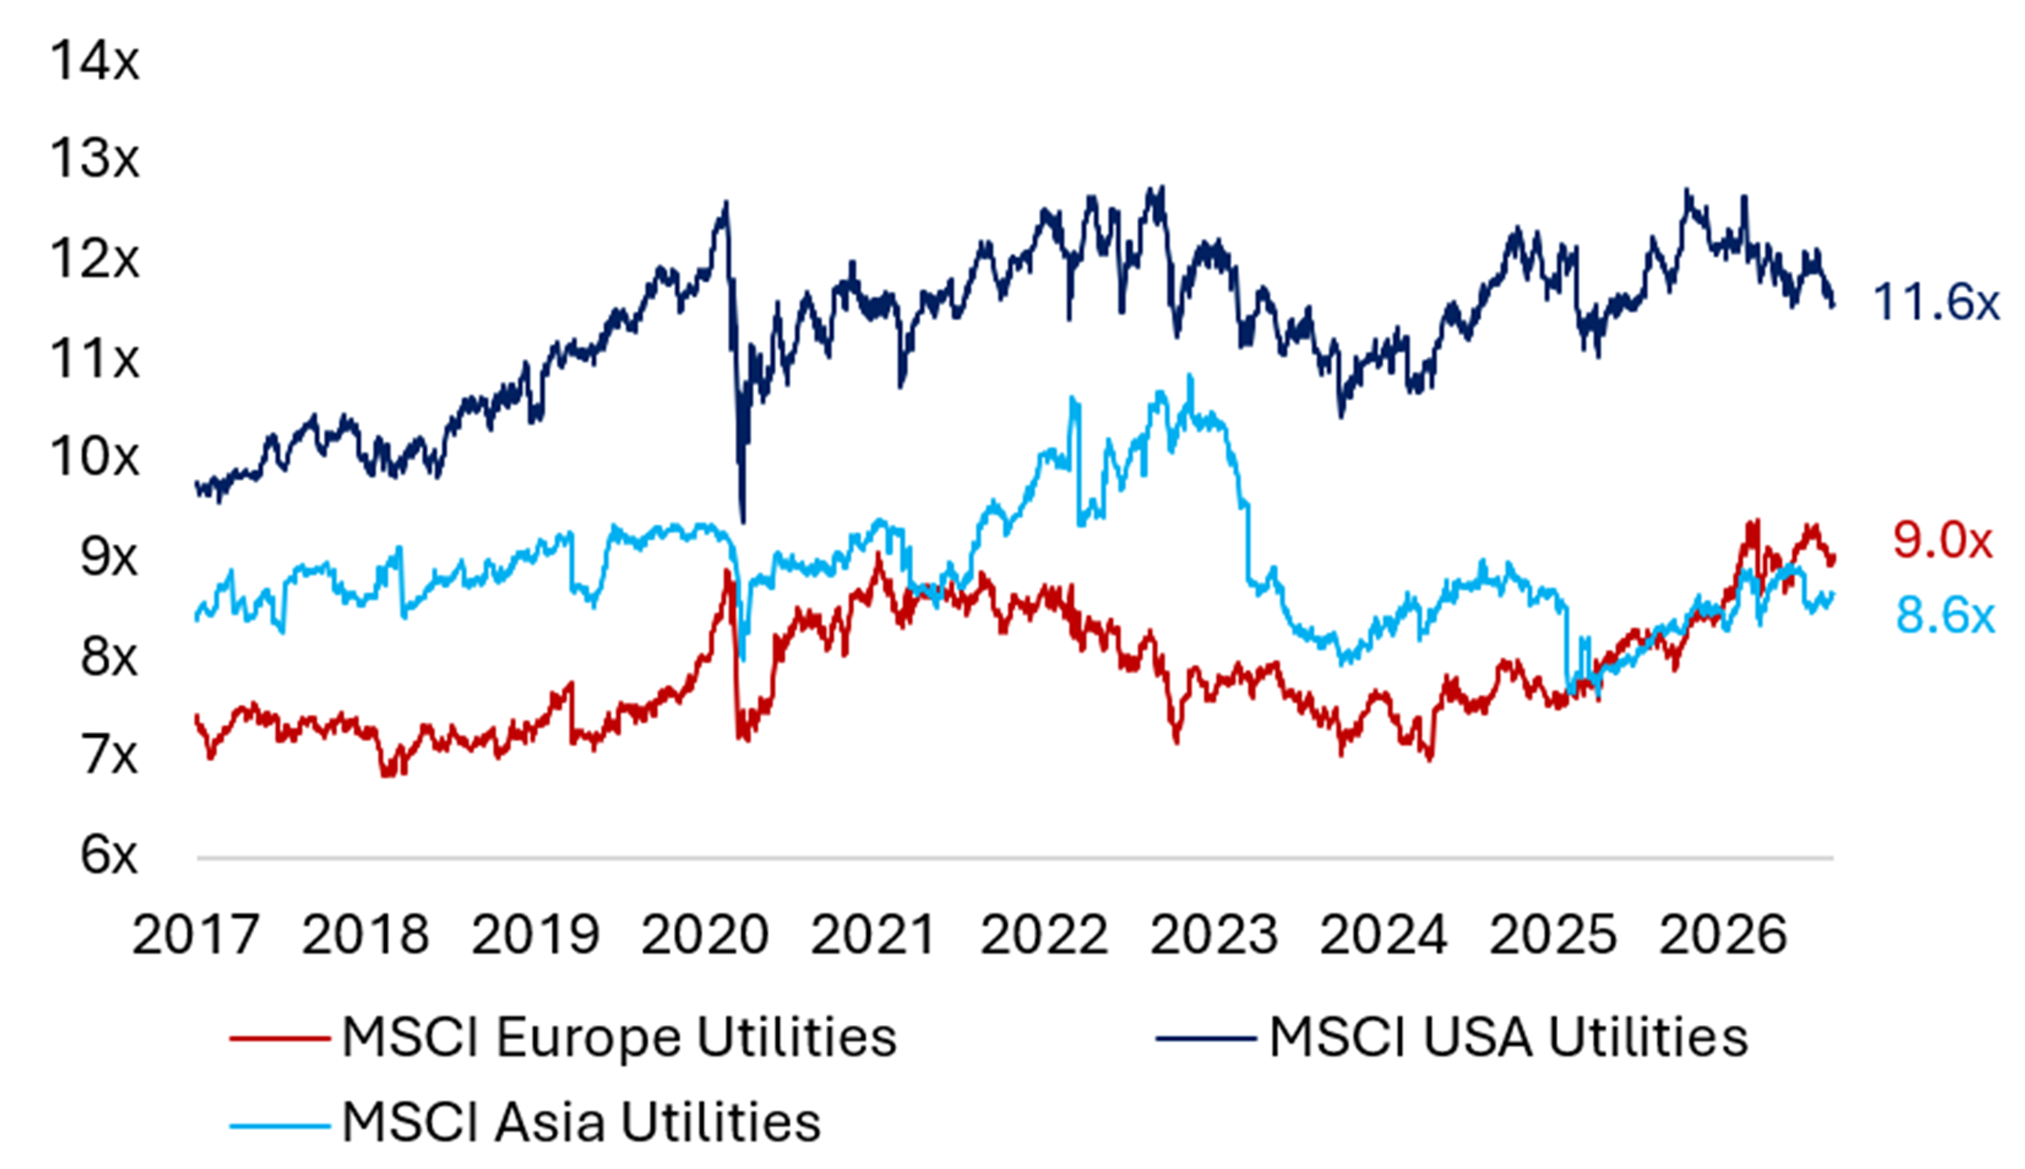

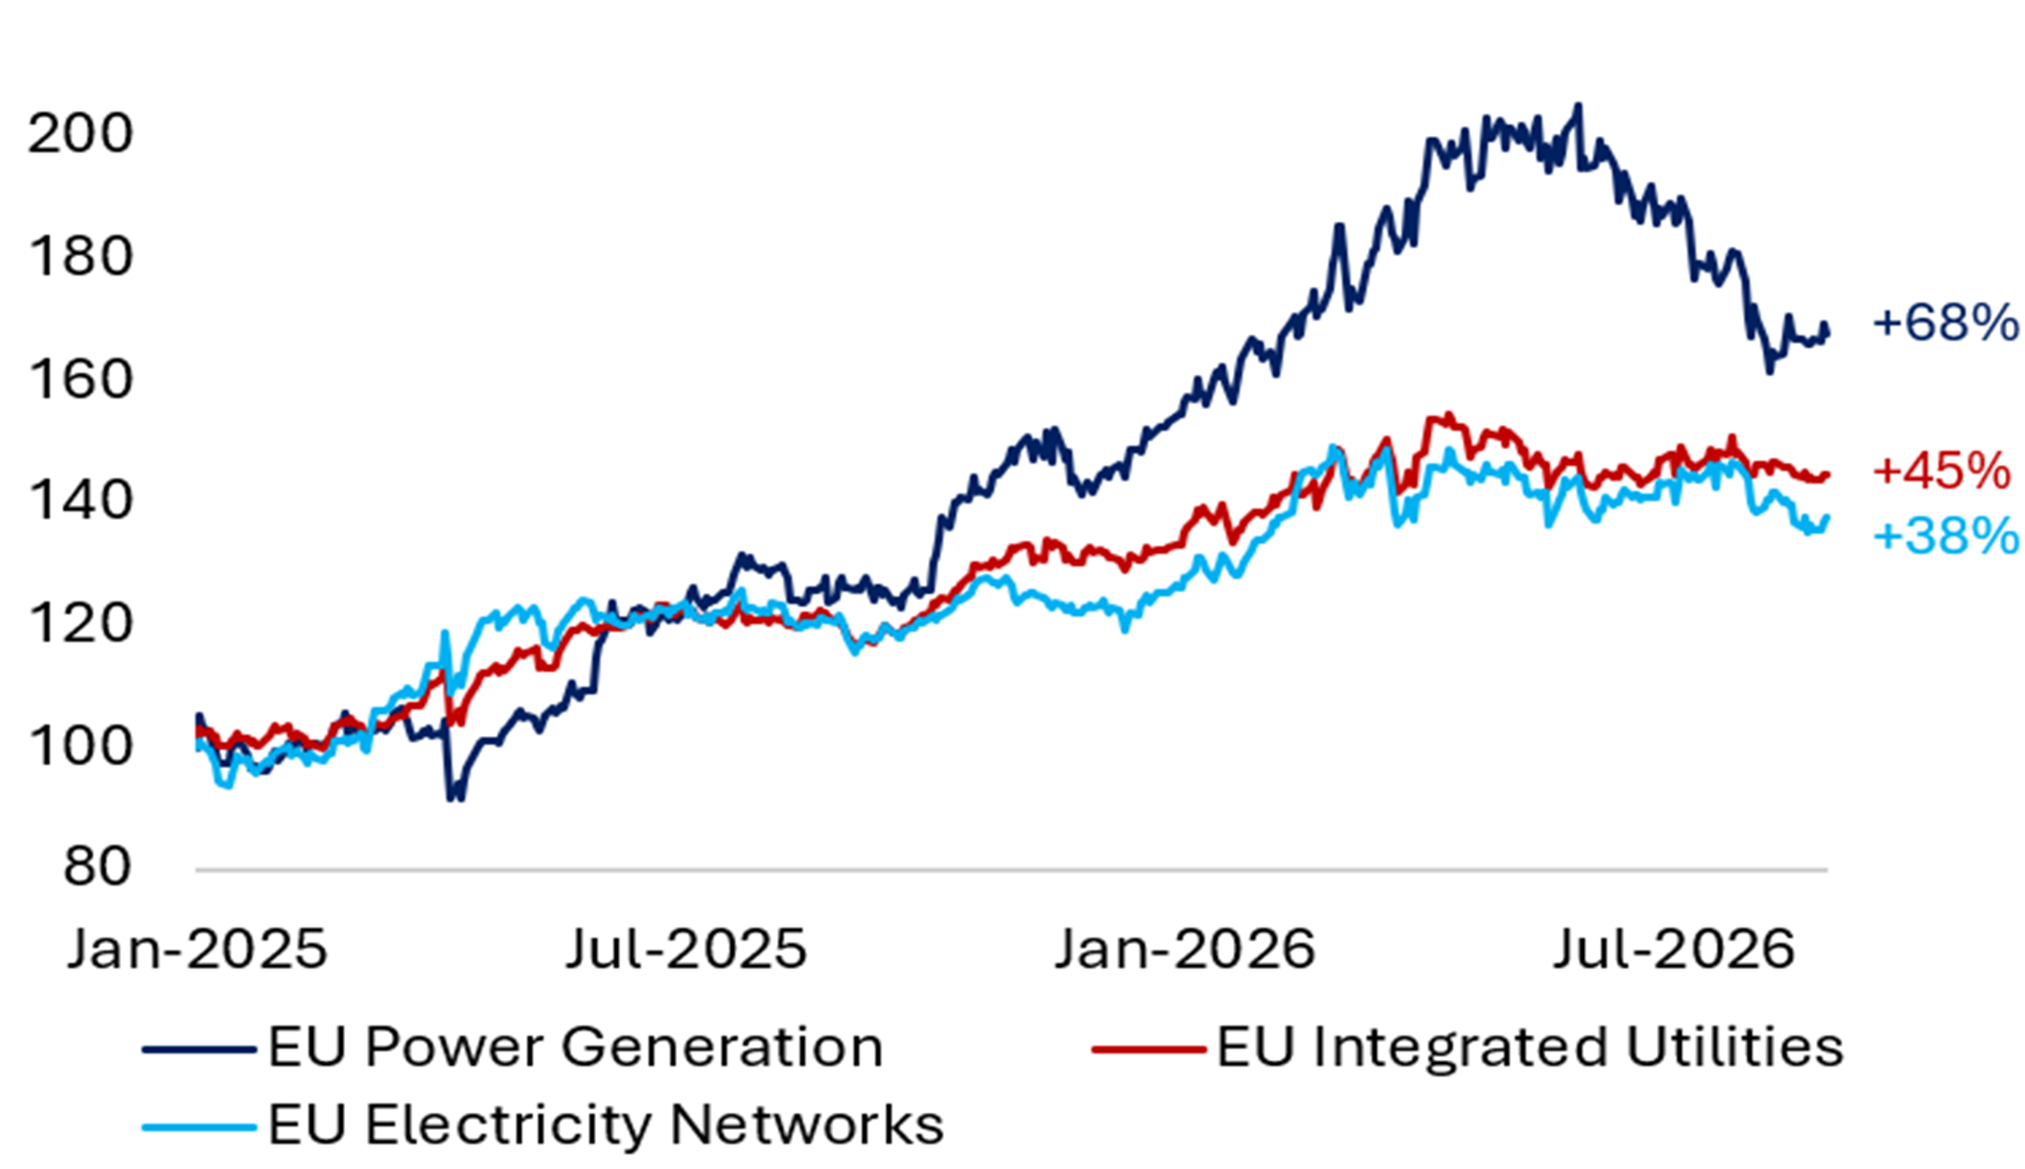
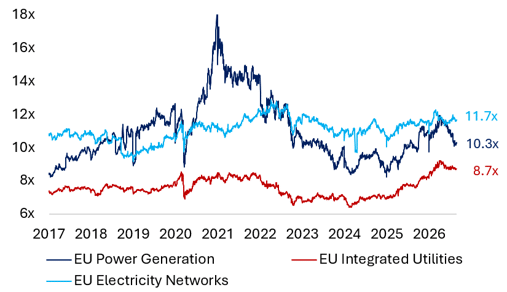

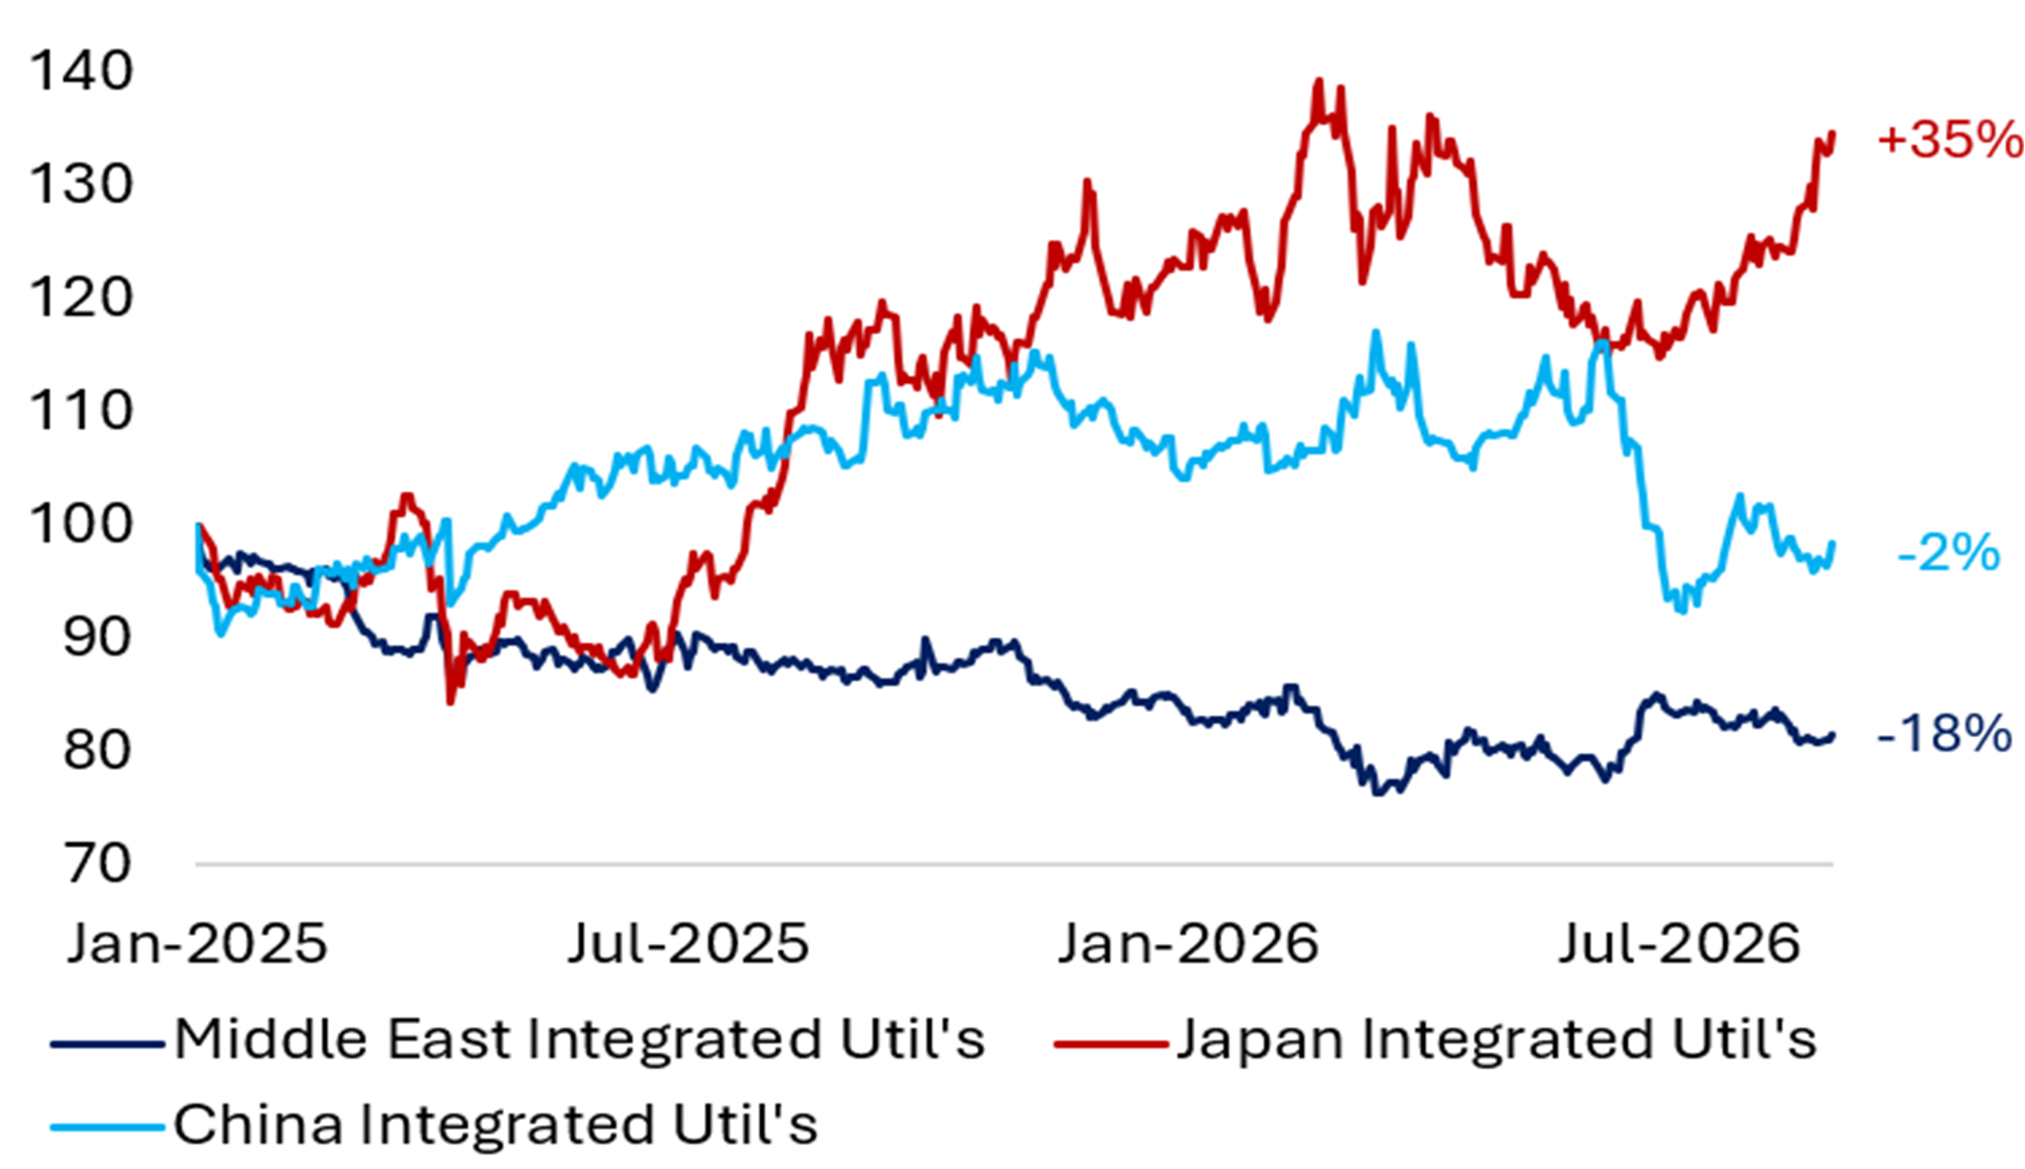
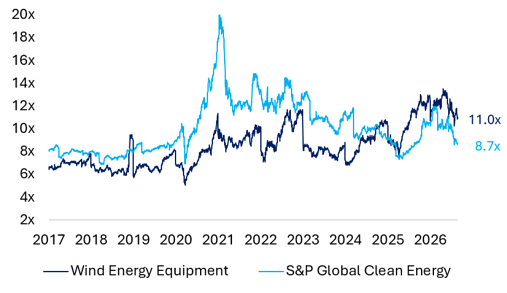

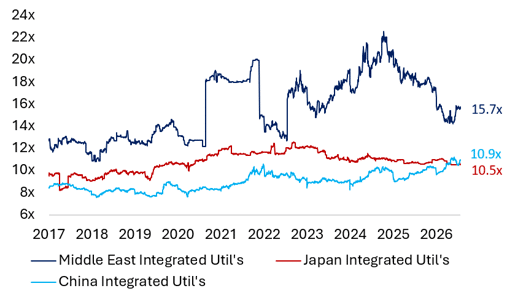
Source: Bloomberg (Prices as of 26 August 2026) Source: Bloomberg (Valuations as of 26 August 2026)
Monthly Focus: European Utilities 1H 2026 Results Wrap
Full-year 2026 outlook: broad-based upgrades without guidance cuts
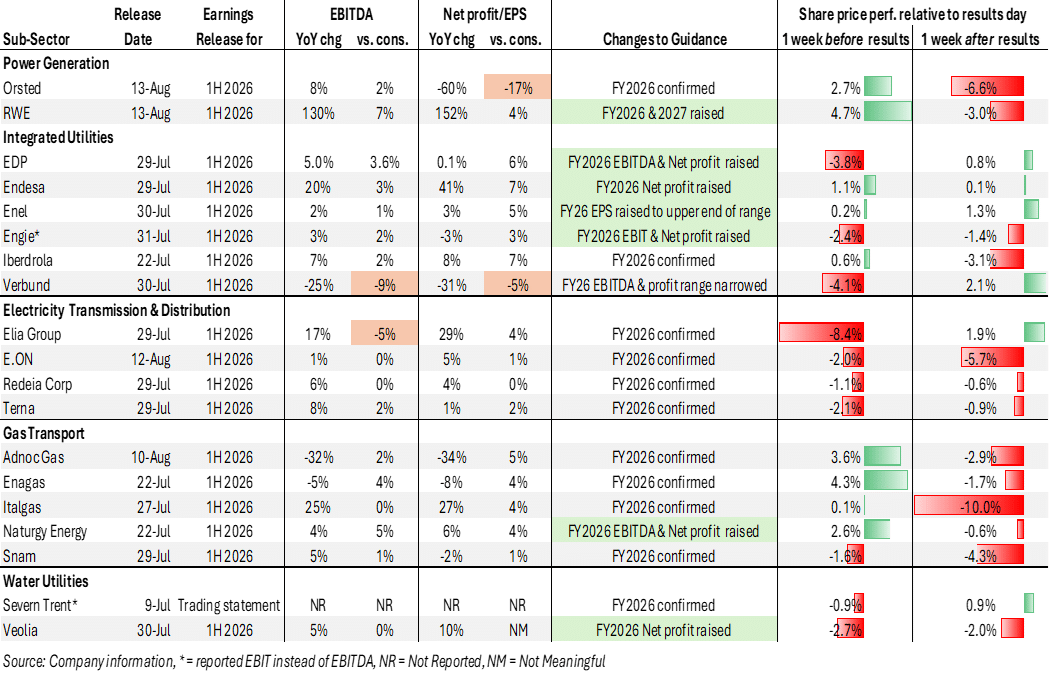
The balance of guidance updates in 1H 2026 was clearly positive: of the 19 companies we track, 7 raised FY2026 guidance and 11 reiterated it, while Verbund trimmed the upper end of its EBITDA range but raised the lower end of its net profit guidance (see Exhibit 3). Thus, no company lowered its full-year outlook outright. The upgrades were concentrated in integrated utilities, as Endesa, Enel, Engie, and Naturgy raised for the first time this year, and EDP for the second consecutive time. Iberdrola left in place the guidance it had already raised at 1Q 2026 but flagged several sources of potential upside in 2H 2026.
Almost all the utilities we track met or beat expectations in 1H 2026, with only a handful missing consensus — Verbund and Elia Group on EBITDA, Ørsted and Verbund on net profit. Integrated utilities delivered most of the beats, driven by higher-than-expected wholesale power prices, above-average hydro conditions in Iberia, and positive M&A contributions: EDP benefited from asset-rotation gains, Engie closed its UKPN acquisition ahead of expectations and Enel’s brownfield renewable deals took its project pipeline above 15 GW. Elia was the clear exception. Alongside its 1H 2026 EBITDA miss, the company trimmed FY2026 capex guidance in Germany by 4% — a modest cut in group terms, but enough to trigger a 6% sell-off on the day of results. The shares were down 8.4% from a week before the release but stabilized and recovered part of the loss in the following week (see Exhibit 3).
Table 1 European Utilities – 1H 2026 Results, FY 2026 Guidance and Share Price Reactions
Long-term capex guidance: No upgrades, M&A becomes the growth driver
There were no organic grid capex upgrades in 1H 2026, only the minor downgrade noted above, when Elia trimmed its previous capex plan by €300m on phasing, payment schedules, and efficiencies. We read this as a sign that supply-chain pricing pressure for utilities has stabilized, shifting the burden onto companies to actually deliver on their growth plans. With organic capex flat, M&A could become the main source of asset-growth upside — as seen in Iberdrola’s purchase of an 80% stake in Caruna, Engie’s UKPN consolidation and Enel’s brownfield acquisitions. For electricity networks, market attention has moved from allowed returns to RAB growth, making any capex cuts or delays a key downside risk.
Power and gas trading remains difficult despite rising commodity prices
Trading remained a mixed-to-negative story in 1H 2026, even as commodity prices continued to move higher. RWE’s trading result rebounded in 2Q and Engie benefited from stronger gas and LNG trading, though it explicitly flagged that power trading remains challenging. The constraint appears to be structural: oil can be moved globally, but gas and LNG face volume limits, while backwardation (spot above forward prices) makes storage trades unattractive and sharp volatility raises mark-to-market risk. Renewed Middle East tensions have lifted European gas and power prices again, creating upside for power generators with unhedged exposure in 2H 2026 and for FY2027 earnings.
Power demand still misses the AI catalyst
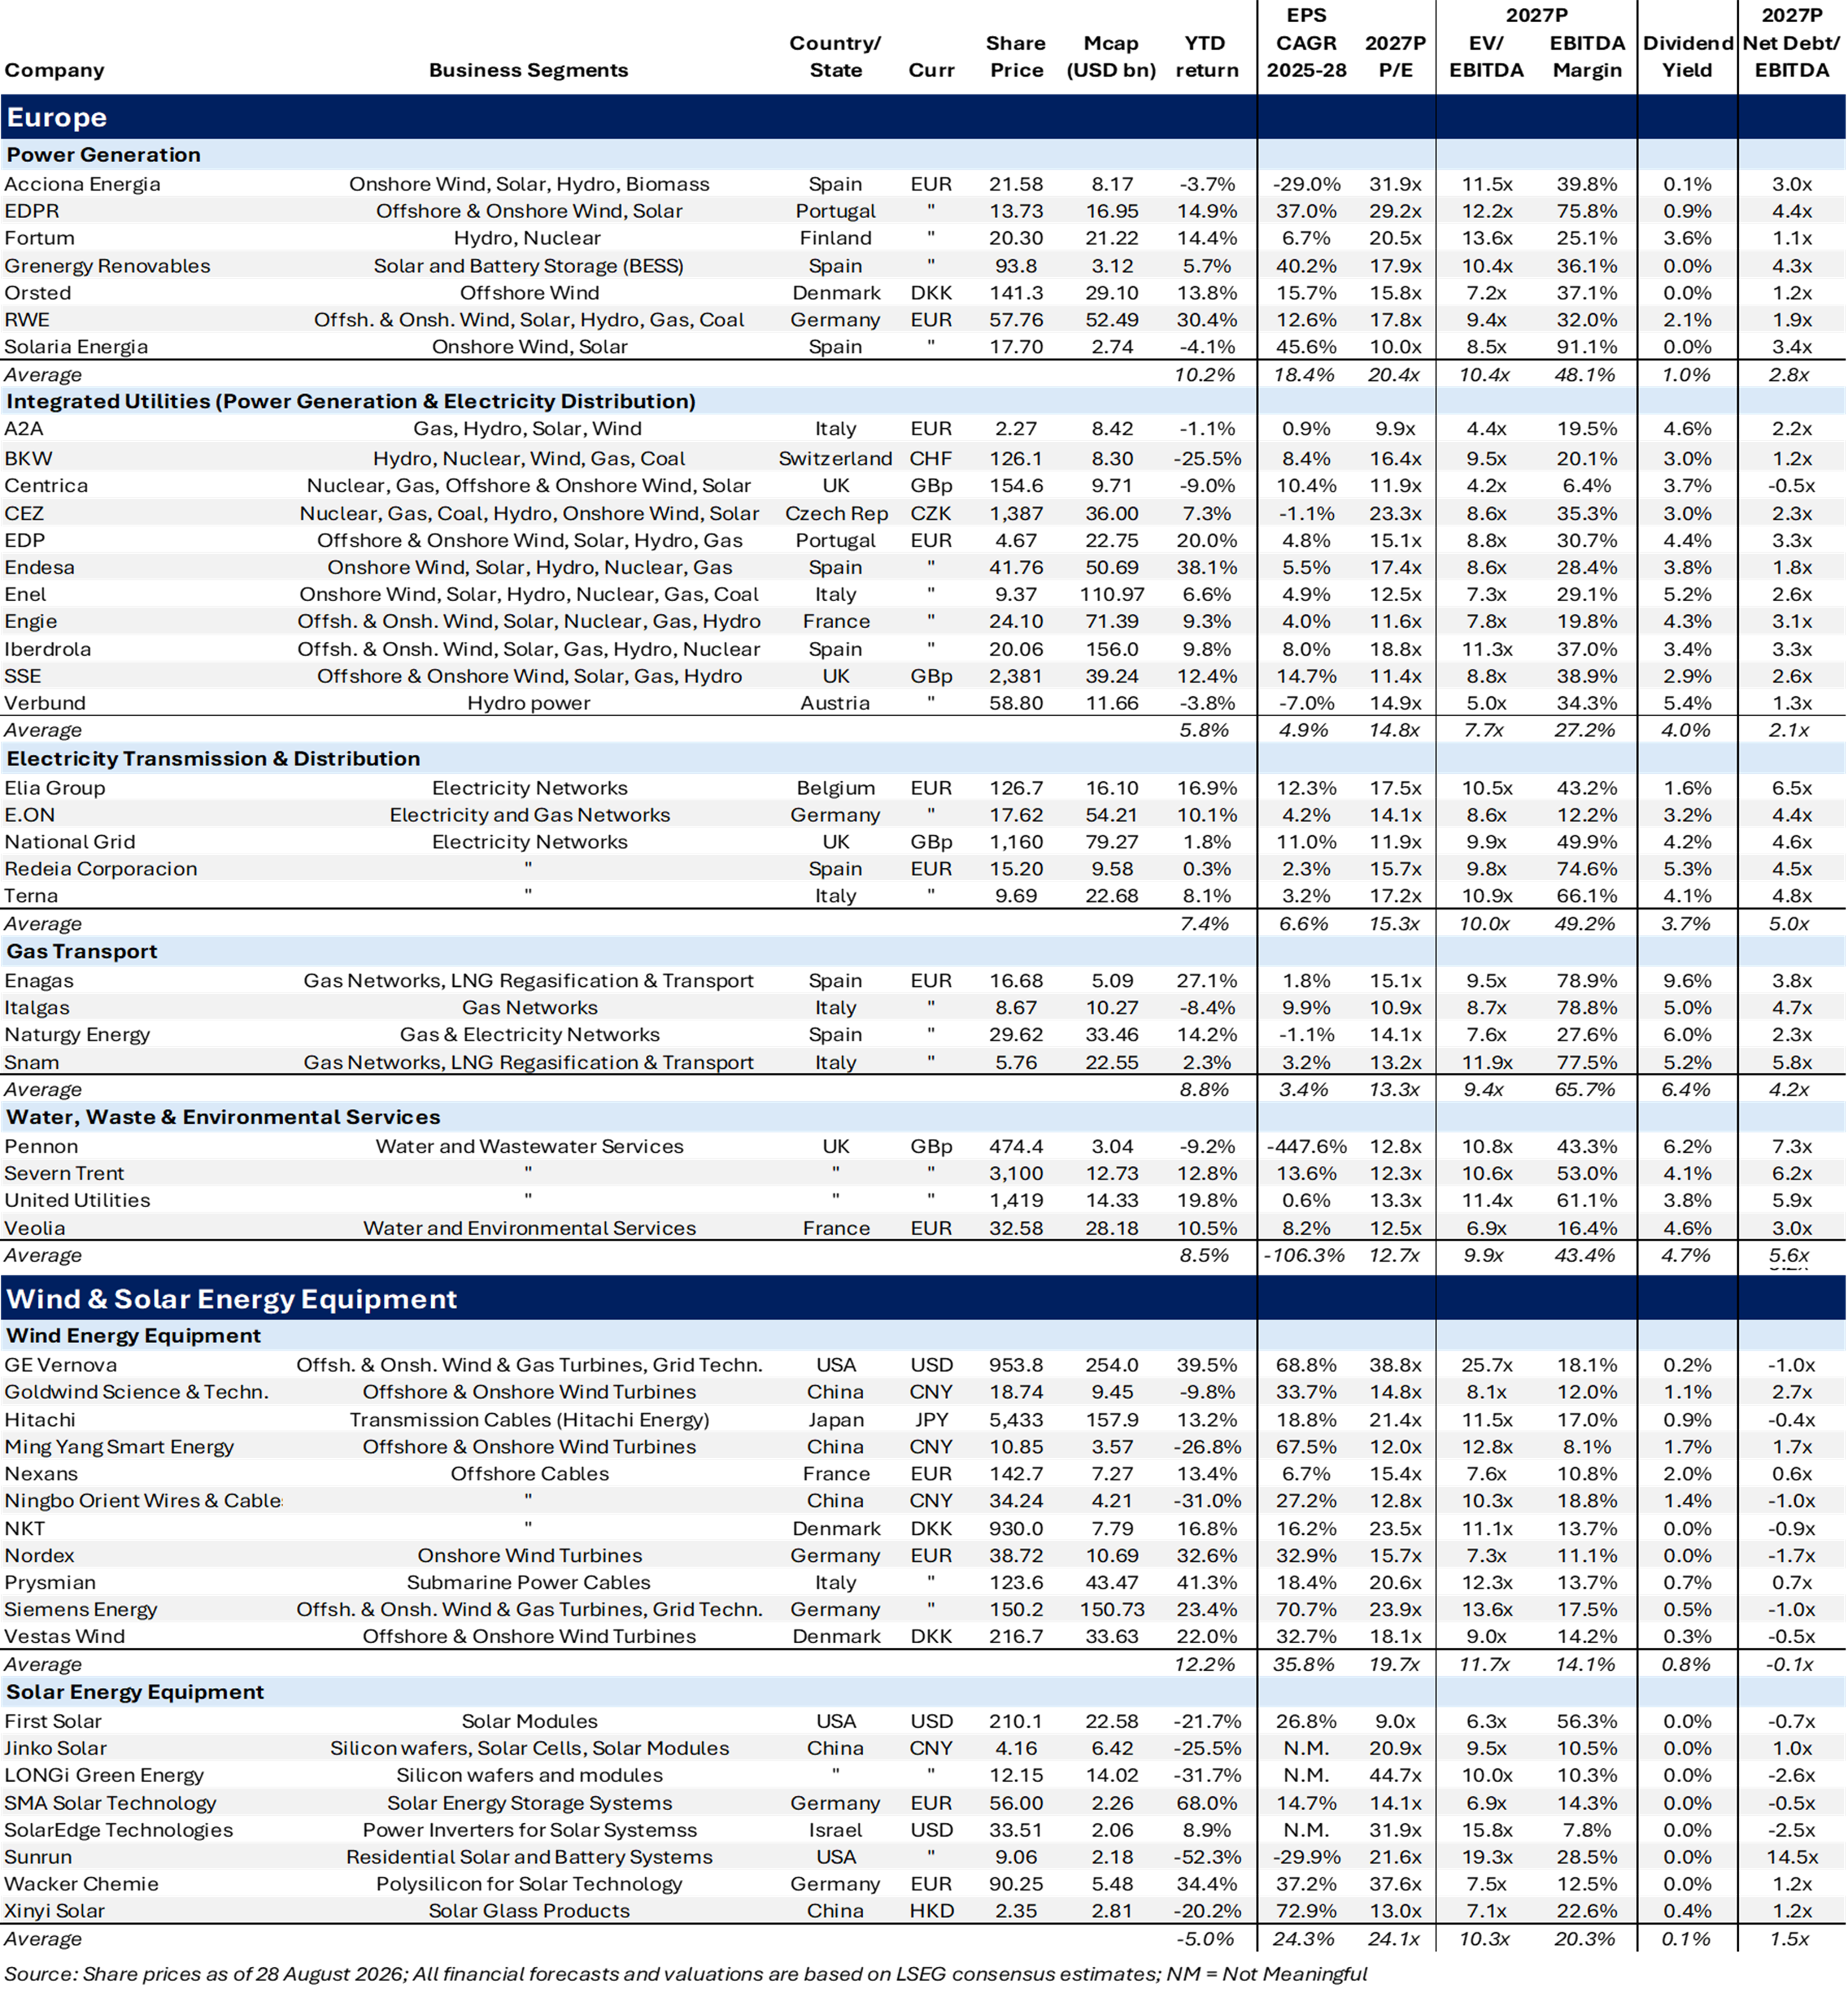
Investors are still waiting for a tangible AI/data-center catalyst in Europe (similar to RWE’s €225 million land deal last November 2025) and management commentary in the earnings calls was less focused on data centers in this quarter compared to prior quarters. EDP was the positive exception, with two Portuguese projects under construction that could push demand to a 4.5% CAGR through 2035. In addition, Engie lifted its advanced-stage data center load pipeline to 4 GW — some of that is expected to materialize within 12 months — and Iberdrola mentioned power demand from data centers for grid upside in Finland regarding its recent distribution networks acquisition (Caruna). Fortum has yet to show material AI contributions and Finnish regulatory changes remain a swing factor. Thus, while European power demand is projected to grow, this near-term growth should be more driven by the electrification of the building and transport sectors and less by data centers until 2035. Crucially, the projected 2025-28 EPS CAGR of 5-10% of European Utilities sector (see Valuation Table 4 at the end of the report) does not depend on a bullish data center build-out scenario as AI remains rather an optionality than the base case in Europe.
Regulatory developments provide catalysts for 2H 2026 and FY 2027
With significant AI news flow absent, investors have turned to regulation as the near-term catalyst. In mid-August, as part of its regulatory review for German gas networks, the German regulator proposed a pre-tax ROE of 5.76%, well below the 7%-plus the market had expected. The consultation closes in the second half of September, with the final rate-of-return determination due by the end of 2026. The equivalent proposal for power networks is expected in mid-August 2027, with the final determination by the end of next year. We see limited read-across from gas to power, and the distinction is structural rather than procedural: gas networks face declining volumes and stranding risk, so a lower allowed return is defensible on assets the regulator does not need to see expanded, whereas power networks sit on a growing RAB that requires substantial investment, which the regulator can only incentivize through an adequate return. Germany’s first CCGT auction also takes place on 8 September, with results on 3 November, which RWE expects to offer double-digit IRRs.
Inflation and interest rate risks continue to flare up
Rising bond yields, not fundamentals, explain most of the recent share price weakness in European utilities and the sector’s underperformance since the start of the Iran war in February 2026. With rates and yields now expected to stay structurally higher, utilities remain vulnerable given how widely they are treated as bond proxies. Rate-sensitive renewable generators, however, continue to earn healthy spreads over WACC, helped by reduced competition for new projects and improving project economics — solar-plus-storage IRRs, for example, are in double digits and comfortably clear hurdle rates. Regulated grid operators are similarly insulated: allowed returns are reset periodically to reflect changes in risk-free rates, and RAB is indexed annually to national inflation in the UK and Italy. The bond-proxy read therefore looks increasingly wrong: both sub-sectors pass higher rates through to returns rather than absorbing them, which makes the current share price declines a mispricing rather than a re-rating.
Private Market Value (PMV) Watch – Deals, Deals and more Power Sector Deals
WIND & SOLAR Assets
Acciona Energía sells more Spanish wind farms (28 July 2026): Acciona Energía sold a portfolio of 15 onshore wind farms in Spain, totalling 361 MW, to Galp New Energies. The assets have an average life of 21 years and are spread across six provinces. The portfolio was sold for an equity value of €432 million with no debt attached, implying an EV/MW multiple of €1.2 million in this private-market transaction. Our take: Acciona divested a similarly sized Spanish onshore wind portfolio earlier in July at exactly the same multiple, and that portfolio likewise consisted of older assets selling into the wholesale market. Acciona’s multiples therefore sit well below the €1.6-2.2 million per MW paid for wind assets with fixed long-term revenue streams.
EDP announced a solar asset rotation at a very attractive multiple (29 July 2026): EDP’s renewables subsidiary EDPR sold an 80% stake in a 384 MW solar-and-battery portfolio in California to an Ares Infrastructure Equity fund. The portfolio comprises 200 MW of solar and 184 MW of battery energy storage (BESS). The solar capacity is contracted under a 20-year power purchase agreement (PPA), and the storage under a 20-year capacity tolling agreement. The private market transaction implies an EV of $800 million for 100% of the assets, or an EV/MW multiple of $2.08 million (€1.83 million). EDP will receive close to $450 million in cash proceeds for the 80% equity stake and expects a 40% capital gain, or around $180 million (€158 million). Our take: An attractive multiple, at the upper end of the range of recent asset rotations, justified by the long-term contracted revenue stream on both the solar and the storage capacity. It may also put upward pressure on EDP’s FY2026 guidance, which assumed €200-300 million of asset-rotation gains — roughly half of which this single transaction has now delivered.
Enel acquires wind farm in Italy (31 July 2026): Enel’s subsidiary Enel Green Power Italia bought from WEB Windenergie AG an 84 MW wind farm located in the Campania region of Italy. Enel paid an EV of €145 million for the wind farm and expects to generate an EBITDA of €16 million annually from the acquisition. Accordingly, the private market transaction implies deal multiples of EV/MW of €1.73 million and EV/EBITDA of 9x. Our take: The EV/MW multiple looks a little higher for a relatively small wind farm compared to the deal multiples of 1.2x-1.65x that were recently paid for onshore wind in Germany, France, Spain and Greece.
EDP sells onshore wind portfolio in Greece (31 July 2026): EDP’s renewable energy subsidiary EDPR sold two wind farms in Greece with a total capacity of 58 MW, of which one wind farm is already operating with a capacity of 23 MW and one is still under construction with 35 MW. Both projects benefit from 10-year Power Purchase Agreements. The estimated EV of the private market transaction is €0.12 billion, which implies an EV/MW deal multiple of €2.07 million. Our take: The valuation appears high, even for onshore wind assets, as it is one of the highest deal multiples that has recently been paid for an onshore wind farm.
EDP sells wind and solar assets in Poland (31 July 2026): EDP’s subsidiary EDPR also announced the sale of a 166 MW wind-and-solar portfolio in Poland to Public Power Corporation for an estimated EV of €250 million. The portfolio comprises three wind farms (131 MWac) with an average asset life of 10 years, operating under green certificates and on a merchant basis, and two solar plants (45 MWdc or 33-37MWac) in their first year of operation, benefiting from 15-year contracts for difference (CfD) and power purchase agreements of 3.0-5.5 years. Our take: The asset rotation implies an EV/MW multiple of €1.51 million, between the merchant and fully contracted ends of the recent transaction range. The CfDs cover only the smaller solar component, so the premium over merchant-level pricing likely reflects the hybridization pipeline and the value of existing grid connections.
TotalEnergies sells European wind and solar portfolio to KKR (3 August 2026): TotalEnergies sold a 50% stake in a 1.2 GW onshore wind and solar portfolio to an insurance account managed by KKR. The assets are located in Germany, Spain, France and Poland, and carry an enterprise value of €1.8 billion, implying an EV/MW multiple of €1.5 million in this private market transaction. Our take: The press release does not break out the split between onshore wind and solar, but the multiple is close to the €1.51 million EDPR received for its 166 MW Polish portfolio (see above). Both sit between merchant and fully contracted pricing, which points to a mixed revenue profile rather than a portfolio secured under long-term contracts.
Power Points
EUROPE
Veolia: 1H 2026 results – Strong results meet expectations, FY 2026 guidance marginally improved
Veolia reported an EBITDA of €3.55 billion in 1H 2026, which increased by 5% YoY and met the consensus of €3.54 billion, along with a 10% YoY increase in recurring net profit to €837 million. As a result, Veolia’s EBITDA margin increased from 15.3% in 1H 2025 to 16.0% in 1H 2026. The company also upgraded its FY 2026 guidance: while EBITDA is still projected to grow between 5% and 6%, the company slightly raised its net income guidance, which is now expected to grow by >8% YoY including the Clean Earth acquisition (which will be earnings-accretive from 2027). Previously, Veolia was guiding for net income to grow >8% before the Clean Earth acquisition. The dividend is still targeted to grow in line with current EPS. Management highlighted that the small improvement of the FY 2026 net income guidance is driven by several factors including the strong 1H results with stable financial charges and a modest improvement in the tax, along with enhanced local efficiency plans.
EDP: 1H 2026 results – Solid beat with the second guidance raise in a row
EDP reported a 5% YoY increase in 1H 2026 EBITDA to €2.73 billion, which beat consensus expectations by 4%, while net profit of €753 million was flat YoY vs. an expected decline (thereby also 6% above the consensus of 712 million). The solid earnings beat in 1H 206 was driven by 14% YoY EBITDA growth in the networks business (both Iberia and Brazil) and 9% YoY EBITDA growth in EDPR (the wind and solar power generation subsidiary). In addition, the FY 2026 guidance was raised for the second time this year on strong 1H results and a positive outlook for power prices in 2H 2026: the EBITDA guidance was lifted to €5.3 billion from €5.2 billion in May 2026 (with the 1Q results release), which compares to the original guidance of €4.95 billion at the CMD in November 2025; the net profit was raised to €1.4 billion from €1.3 billion in May 2026, which compares to €1.25 billion initially in November 2025. The medium-term 2027-28 outlook sounded also more optimistic based on the positive development of forward power and gas prices, the Iberian hydro market dynamics and better-than-expected regulatory outcomes for electricity networks.
E.ON: 1H 2026 results – In line results and guidance re-iterated
E.ON reported uneventful results with EBITDA of €5.40 billion rising 1.3% YoY and marginally beating the consensus of €5.38 billion. Net Income of €1.92 billion grew 5.3% YoY and was also slightly ahead of consensus (€1.90 billion). The small EBITDA increase at the group level was supported by the larger “Energy Networks” segment, which posted a marginal YoY EBITDA increase to €3.81 billion, while EBITDA in the smaller “Energy Retail” segment declined 4.1% to €1.26 billion. The FY 2026 guidance was confirmed with EBITDA in the range of €9.4-9.6 billion and net income in the range of €2.7-2.9 billion. The long-term FY 2030 outlook was also re-iterated with EBITDA at €13 billion and net income at €3.8 billion.
Engie: 1H 2026 results – Slight beat and guidance raise
Engie reported 1H 2026 results slightly ahead of expectations: EBIT of €5.26 billion increased by 3% YoY and beat consensus expectations by 2%, recurring net profit of €3.0 billion declined by 3% YoY but also beat the consensus of 2.86 billion by 3%. The solid EBIT beat was primarily driven by “Electricity Networks” (up 15% YoY) and “Supply & Energy Management” (jumped 44% YoY), which also explains the beat at the bottom line. The FY 2026 guidance was raised at the mid-point of the respective guidance range for EBIT by 5.4% to 9.7 billion (vs. consensus of €9.35 billion) and for recurring net profit by 6% to €5.2bn (vs. consensus of €4.93 bn). FY 2027 and FY 2028 guidance remain unchanged. In the conference call, management highlighted the growing data centre exposure in the US and in Europe with a 6 GW capacity increase in the project pipeline to 7 GW during 1H 2026 (from 1 GW at end of 2025). The company remains committed to its €4 billion asset disposal program over the next two years.
Elia: 1H 2026 results – Profit beat with small capex reduction, guidance confirmed
The company reported strong YoY profit growth in 1H 2026, with EBITDA jumping 17% YoY to €1.06 billion and net profit even soaring 29% YoY to €349 million on lower taxes and minorities (net profit was also 4% ahead of consensus expectations). While Elia confirmed its FY 2026 guidance for net profit of €690-740 million, divisional profit targets were slightly upgraded, which could move FY 2026 net profit to the upper end of the guidance range. Another conference call focus was on the small €300 million capex reduction in Germany (only 4% of total capex), which management justified with project cost savings emphasizing that it will not alter the underlying investment program. While capex beyond 2028 remains unclear as it also depends on the outcome of the ongoing regulatory review in Germany (for its Transmission System Operator 50Hertz), the CFO does not expect capex in Germany to decline beyond 2028.
Orsted: 1H 2026 results – Mixed results, but FY26 and FY27 guidance confirmed
Orsted reported a 3.5% YoY EBITDA decline to DKK 15.0 billion, which was 2% ahead of consensus expectations. The small EBITDA beat was driven by the Offshore segment (DKK 11.9 billion), which grew 3% YoY and was 2% ahead of consensus, while the Onshore EBITDA of DKK 2.3 billion declined 5% YoY and missed consensus expectations by 13%. Net profit of DKK 3.3 billion declined 60% YoY and also missed expectations by 17% due to a DKK 1.2 billion impairment charge for long-dated US bond yields. The FY 2026 guidance was confirmed with EBITDA >DKK 28 billion and gross investment of DKK 50-55 billion as well as the FY 2027 guidance for EBITDA of >DKK 32 billion was confirmed. Orsted will disclose the re-instated dividend with the FY 2026 results next February 2027, with the dividend expected to start at a modest level and then to increase annually.
Redeia: 1H 2026 results – Solid profit growth in line with expectations, guidance confirmed
Redeia reported solid earnings growth in 1H 2026, with adjusted EBITDA increasing 6% YoY to €673 million and net profit rising 4% YoY to €280 million (both results were in line with expectations). Redeia fully reiterated the FY 2026 guidance, with an EBITDA of >€1.25 billion and net profit of >€510 million. Although 1H 2026 results already account for more than 50% of the FY 2026 guidance for EBITDA and net profit, management highlighted that seasonal maintenance costs and higher financing costs due to rising net debt would lead to a slowdown of profit growth in 2H 2026. Finally, the company considers the government announcements about the increased investment cap for electricity transmission and distribution as a positive development for future investments after the completion of its 2026-29 strategic plan.
Terna: 1H 2026 – Small beat and FY 2026 guidance reiterated
Terna reported strong 8% EBITDA growth to €1.47 billion in 1H 2026, which was slightly ahead of consensus expectation (€1.44 billion), while net profit grew only 1% to €591 million but was also 2% above consensus (€577 million). EBITDA growth came from regulated and non-regulated activities, with Regulated Asset Base growth driven by the Rete2 consolidation and record €1.58 billion capex spending. The company confirmed the FY26 guidance of €4.41 billion in revenues, €2.93 billion in EBITDA and €1.12 billion in group net income. The company is on track to deliver its fully funded 2024-28 business plan, including the flagship Tyrrhenian Link project, and connected 3.4GW of renewables and 1.3GWh of BESS in 1H 2026. The new post-2028 business plan will be presented in 2027 once the post-2028 regulation becomes visible.
RWE: 1H 2026 – Pre-released results and guidance raise confirmed
After RWE had already pre-released key financials along with a raised FY 2026 and FY 2027 guidance on 28 July 2026, the company confirmed these numbers on 13 August, when it released 1H 2026 results: EBITDA of €3.0 billion jumped +41% YoY and net income of €1.26 billion soared 62% YoY. The strong profit growth was driven by all three major business segments: Offshore Wind EBITDA: €810 million (+26% YoY), Onshore Wind & Solar EBITDA: €1.0 billion (+22% YoY) and Flexible Generation EBITDA: €1.0 billion (+72% YoY, which benefited from a one-off payment). In addition, the new full year guidance includes the 55% stake in German transmission network company Amprion: for FY 2026 EBITDA: €5.75–6.35 billion, for FY 2026 net income: €1.95–2.45 billion, for FY 2027 EBITDA: €6.7-7.3 billion and for FY 2027 net income: €2.2-2.7 billion. RWE flagged that its raised FY 2026 and FY 2027 guidance was based on commodity prices as of 30 June 2026 and the company sees further upside to the guidance from the current commodity price environment. Based on sensitivities disclosed by RWE, a €1/MWh change in an achieved power price in Offshore/Onshore has a €6 million impact on FY 2026 EBITDA and a €11 million impact on FY2027 EBITDA.
RWE: Swapping offshore wind for gas in the USA
RWE reached a $1.22 billion settlement with the US Department of the Interior, under which the company will relinquish its offshore wind leases off the coasts of New York, California and Louisiana. RWE Americas redeploys the capital with a financial investment of $900 million to acquire an indirect 16% stake in the Louisiana LNG Project and the signing of a $300 million turbine reservation agreement securing future generating capacity to meet growing US electricity demand. The company is developing a pipeline of 15 natural gas peaking projects across target markets in the US. In addition, RWE Americas plans to invest approximately €17 billion in the US over the next six years to grow its generation capacity from currently about 13 GW across 27 states to 22 GW by 2031.
Iberdrola: Developer of US transmission line in Maine
Iberdrola’s 100% US subsidiary Avangrid has been selected by Maine’s Public Utilities Commission as the preferred developer of a 1,200 MW transmission line connecting northern Maine’s renewable resources to the New England grid. The project comprises a 345kV line with 179km length from Haynesville to Pittsfield plus a 62km extension to Coopers Mills. Financial terms were not disclosed and will be finalised during contractual and regulatory negotiations. Approval by the Federal Energy Regulatory Commission (FERC) is still required. The project is reminiscent of Avangrid’s NECEC line (1,200MW, 233km, USD1.65bn investment), which was brought online earlier this year. Although NECEC’s budget cannot be directly extrapolated to the Maine project, it illustrates the economic scale these projects can reach. The regulator noted that Avangrid holds almost all of the necessary rights-of-way and maximizes the use of existing transmission corridors.
Spain proposes requiring new data centers to get 80% of power consumption from renewables
According to a draft royal decree, the Spanish government is proposing a requirement that data centres have to receive at least 80% of hourly electricity consumption from renewable energy sources. Each new MW consumed must be matched by a new MW of renewable capacity installed within the preceding 18 months, either through self-consumption or power purchase agreements (PPAs). Existing data centres are exempt. The draft royal decree has been launched for public consultation. Failure to meet the requirements could result in penalties such as the loss of grid access and connection permits or fees. If accepted, the decree will be positive for the renewable energy build-out and for PPA demand in Spain, as well as for storage assets given the requirement to match at least 80% of data centre consumption on an hourly basis.
UK WATER
On 13 August 2026, Ofwat, the UK water regulator, published draft determinations for the 2026 Cost Change process, under which companies can apply for additional spending within the five-year regulatory period for costs that were not known at the time of PR24. Of the £4.3 billion requested, Ofwat approved £3.4 billion across 13 water companies to upgrade infrastructure, support growth, and deliver environmental improvements. United Utilities submitted the largest claim at £1,100 million and was awarded £995 million; Severn Trent received £329 million of a £481 million request, and Pennon received £180 million of £239 million requested.
Allowed returns will be in line with the PR24 final determination, except for companies that appealed to the Competition and Markets Authority (CMA), which will receive the CMA-determined returns. On bills, Severn Trent secured an increase of £5 per customer from 2029/30, while United Utilities and Pennon secured none — United Utilities having said it would defer all revenue requests until its licence change is enacted. The consultation closes on 24 September, with final determinations due in December 2026.
MIDDLE EAST
Adnoc Gas: 2Q 2026 – Small beat and FY 2026 guidance confirmed despite 2Q Hormuz disruption
Adnoc Gas reported solid 1H 2026 results with a small beat despite lost LNG export volumes during the Hormuz closure in 2Q 2026: EBITDA and Adjusted net income declined YoY by 32% to $3.02 billion and by 34% to $1.74 billion, respectively, but both were 2-5% ahead of consensus expectations. LNG export volumes were down 54% in 2Q 2026 due to the Strait of Hormuz closure. However, the FY 2026 net income guidance range remains at $3.5 – $4.0 billion, assuming maritime operations are restored by 4Q 2026 and pricing realizations start to normalize. The EBITDA margin guidance remains at about 36% and the capex guidance range is unchanged at $4.5 – $5.0 billion. Finally, the medium-term guidance was raised following the final investment decision (FID) for Rich Gas Development Phases 2 and 3: the EBITDA growth target to about 60% by 2030 vs. 2023, from about 40% by 2029 previously. This is supported by about 45% volume growth, while the 2026-30 capex guidance increases to about $28 billion from about $20 billion before.
DEWA: 2Q 2026 – Slight EBITDA miss from lower power generation
Despite the heightened level of uncertainty in the operating environment across the Gulf region in 2Q 2026, Dubai Electricity and Water Authority (DEWA) reported only a very small 2% YoY EBITDA decline to AED 4.44 billion and even a slight 1% YoY net profit increase to AED 2.29 billion. DEWA generated 15.78 TWh electricity in 2Q 2026 (including renewable energy generation of 3.14 TWh or 20% of the generation mix), which was down around 7% YoY, while desalinated water production fell only 2% to 40.25 billion imperial gallons. DEWA’s installed power capacity stood at around 18 GW, of which around 4 GW was solar and renewable power.
CHINA
China Longyuan: 1H 2026 profit decline reflects China’s rapid renewable capacity build-out
China’s electricity demand grew 5.3% in 1H 2026, but renewable capacity continued to expand significantly faster, with wind capacity increasing 18.5% and solar 15.8%. China added 117 GW of renewable capacity in 1H, representing nearly 74% of all new generating capacity, running ahead of the power system’s ability to economically absorb the incremental generation. One consequence has been rising curtailment, with estimates suggesting that wind and solar generation curtailed in 1H 2026 was sufficient to cover the entire increase in electricity demand during the period. The imbalance between capacity growth and system absorption has contributed to lower capacity utilization and greater pricing pressure, while NDRC/NEA Document 136 is increasing generators’ exposure to these dynamics by moving new wind and solar projects toward market-based electricity pricing.
China Longyuan, China’s largest wind operator, reported 1H 2026 results that reflected these pressures. Revenue declined 6.5% to RMB14.64 billion and net profit fell 28% to RMB2.53 billion, with wind revenue down nearly 10% as wind generation declined 6.7% to 31.27 TWh. The decline reflected weaker wind resources, lower utilization and lower average on-grid tariffs. In contrast, solar generation increased 22.2% and solar revenue rose 20% to RMB2.05 billion, reflecting Longyuan’s rapid expansion of solar capacity from a smaller base. Longyuan’s results highlight a broader industry dynamic: continued capacity additions are supporting renewable generation growth, but weaker utilization and increasing market-based pricing exposure are hampering the translation of capacity growth into revenue and earnings growth.
Chinese wind turbine manufacturers target Europe despite political obstacles
According to the Financial Times, Ming Yang, China’s third-largest wind turbine manufacturer, is pushing into Europe despite being shut out of the UK’s offshore market on national security grounds in May over plans for a £1.5 billion Scottish factory. The company has hired a European chief executive alongside executives from Vestas, Siemens Gamesa and Vattenfall. However, so far, Ming Yang’s presence remains small in Europe, as the company supplied only 446 MW of capacity to Europe last year (which was less than 3% of Europe’s total capacity additions). In response, the EU has launched subsidy probes and is introducing rules to restrict Chinese-made turbines from publicly subsidized projects. In addition, Ming Yang has partnered in the UK with Octopus Energy to explore onshore wind turbines in the UK, with data and firmware kept under British management
JAPAN – Electric Power Companies: 1Q (April-June) FY2026 Review
Overall Results
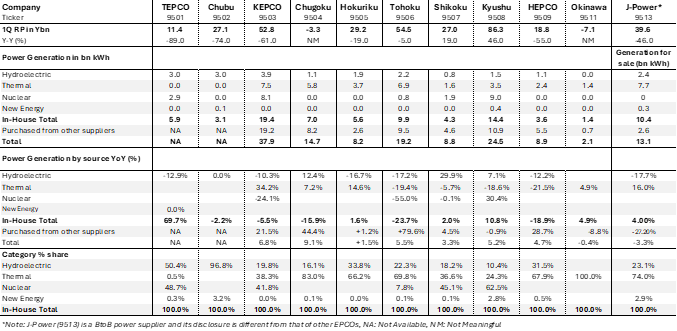
At the recurring profit (RP) level, earnings remained under pressure from higher power generation, transmission and distribution, and maintenance costs. Regional economic conditions, driven by local industrial activity and weather patterns, also influenced results. These headwinds were partially offset by higher nuclear power utilization rates, including the restart of TEPCO’s Kashiwa Zaki-Kariya Unit 6 on April 16, 2026. As a result, power source composition and generation mix emerged as key differentiating factors among utilities in 1Q FY2026, alongside regional macroeconomic and weather conditions.
Highlights regarding nuclear power generation trends
Shikoku Electric Power (9507) and Kyushu Electric Power (9508) benefited from relatively high nuclear utilization rates. Shikoku’s Ikata Unit 3 operated at full capacity, while Kyushu Electric recorded a utilization rate of 103%, up from 79.2% a year earlier, supported by operations at Sendai Units 1 and 2 and Genkai Unit 4.
In contrast, Hokuriku Electric Power (9505) faced a modest headwind from lower hydroelectric output due to reduced water inflows. Kansai Electric Power (9503) experienced operational challenges at Mihama Unit 3, while large-scale maintenance works reduced the overall utilization rate of its nuclear fleet to 59.8% in 1Q FY2026 from 78.8% in 1Q FY2025. Nuclear utilization rates for 1Q FY2026 are summarized in Table 2.
Chubu Electric Power (9502) continues to suspend power generation at the Hamaoka Nuclear Power Plant, which has been offline since January 2026. The suspension follows ongoing investigations into issues related to seismic design data, even after the Nuclear Regulation Authority (NRA) initiated an inquiry into the matter.
Regarding J-Power’s (9513) Oma Nuclear Power Plant project, the company reported in its 1Q results that the 1.38GW ABWR facility remains in the conformity review process, which began in June 2025. The company also plans to construct additional safety-related facilities as part of the reactor installation process.
Hokkaido Electric Power (9509) continues preparations for the restart of Tomari Unit 3, which is expected between late 2027 and early 2028.
Looking ahead to Second Half events of FY2026
The transmission and distribution subsidiaries of the eight regional EPCOs have announced tariff revisions, with network charges scheduled to increase by more than 10% from November 2026. Proposed increases include approximately 18% for Kyushu Electric Power (9508) and 14% for Kansai Electric Power (9503), among others.
These tariff hikes are expected to have a positive impact on earnings, potentially contributing to high single-digit profit growth in FY2026 and double-digit growth in FY2027 among market expectations subjected to timing and final approval rates. The revisions come amid sustained increases in material costs, including copper, aluminum, plastic components, labor expenses, and investments required to replace aging infrastructure. The revised charges are expected to be reflected in both retail and wholesale electricity pricing, depending on the contractual arrangements and supply plans offered by individual utilities.
Table 2 1Q (April-June) FY 2026 results and Power Generation

European Power Prices and Global Electricity Demand Growth
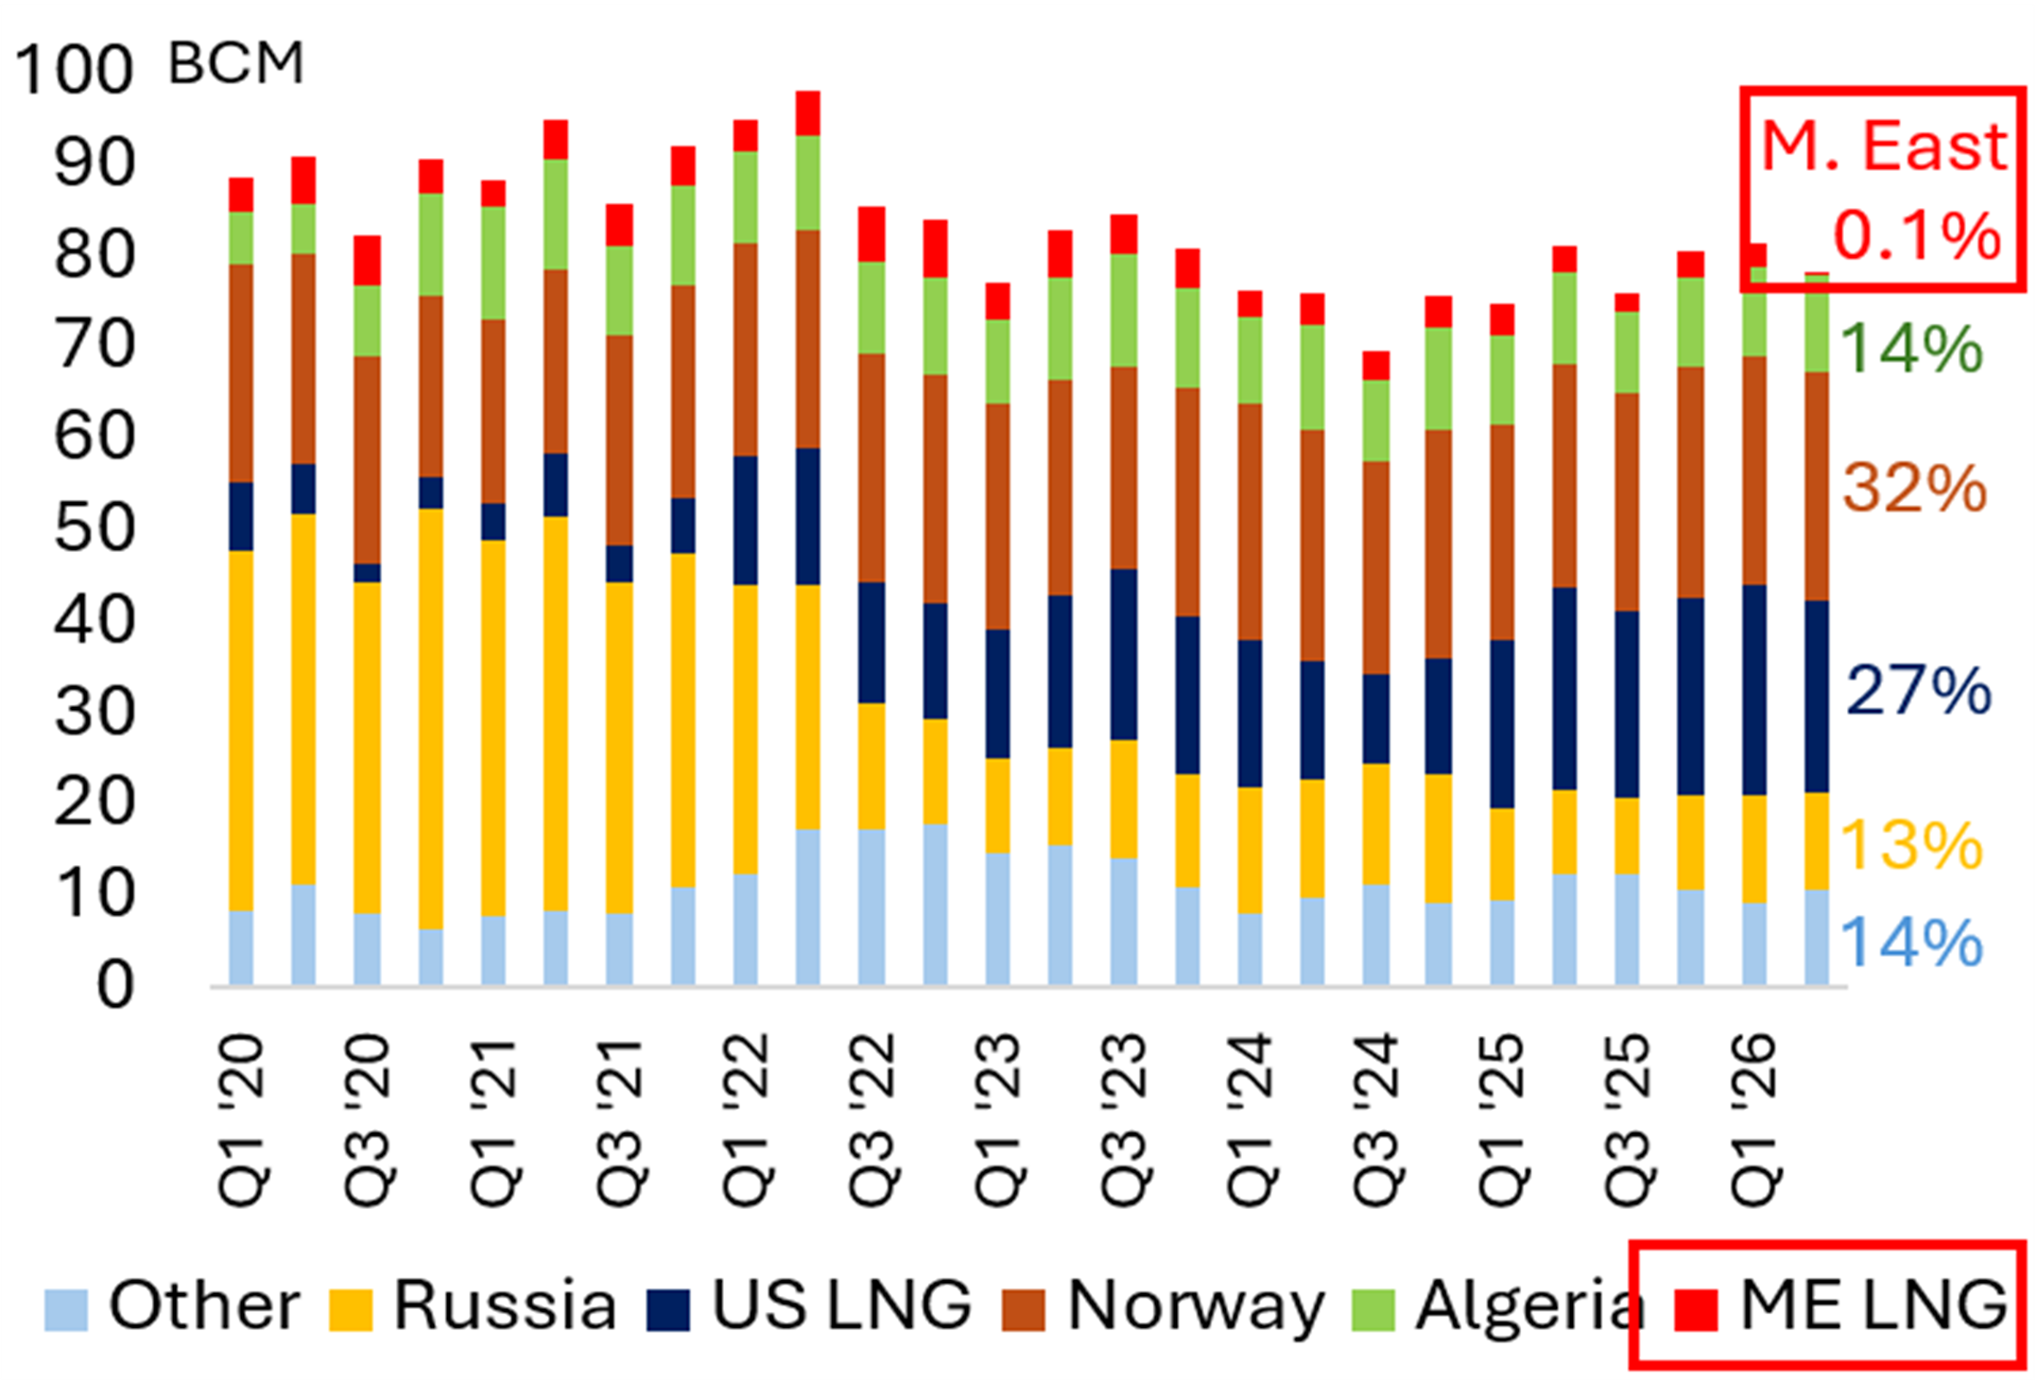
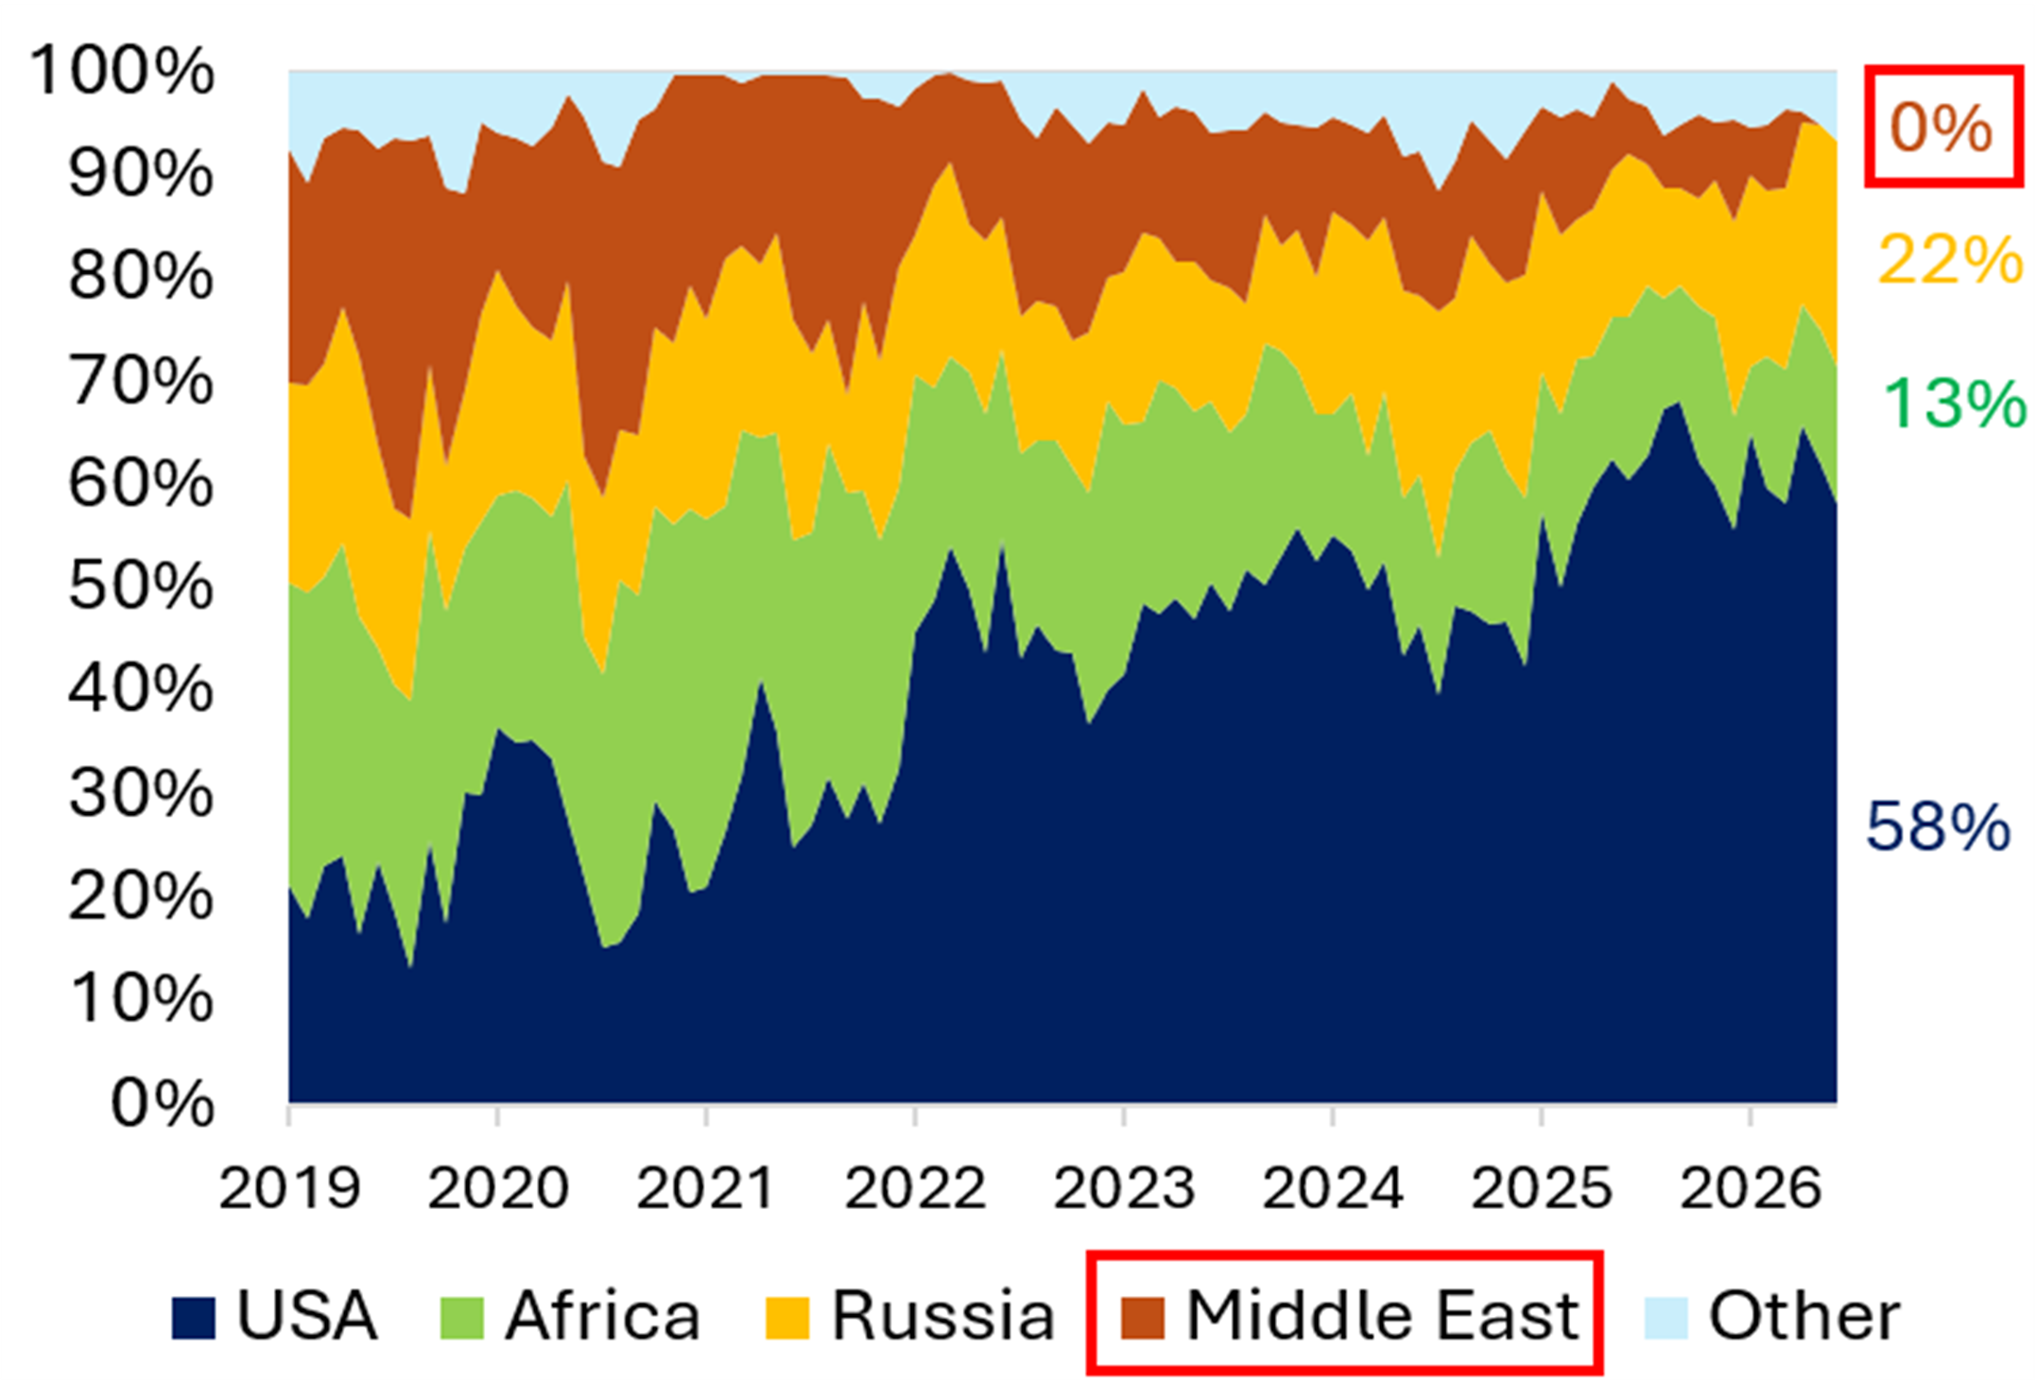
The Iran conflict has pushed Europe into its second energy crisis in four years and has put the focus back on European gas and power prices. Unlike the 2022 crisis, when Russia cut pipeline gas supplies, Europe faces limited volume risk this time: only around 0.1% of total gas imports in the second quarter of 2026 came from the Middle East (see Exhibit 9), with the last LNG cargoes delivered in April before monthly LNG imports from the Middle East stopped entirely in May 2026 (see Exhibit 10). However, as Europe failed to replenish depleted gas storage through LNG purchases from the US this summer, EU gas storage is just 64% full at the end of August, below the lowest level for that time of year since 2021, just before the 2022 energy crisis started (see Exhibit 7). As European buyers compete with Asian buyers in the spot market to refill storage ahead of next winter, LNG prices – and, by extension, European gas prices – are likely to remain elevated for the rest of 2026. With average LNG prices already running 36% above last year’s level on a year-to-date basis, European gas prices have moved higher as well. Average EU gas prices are up 28% versus 2025, while average UK gas prices are 19% higher year-to-date than in 2025 (see Table 2).
Table 3 Megawatts & Molecules: Average Annual Electricity, Carbon, Coal and Gas Prices

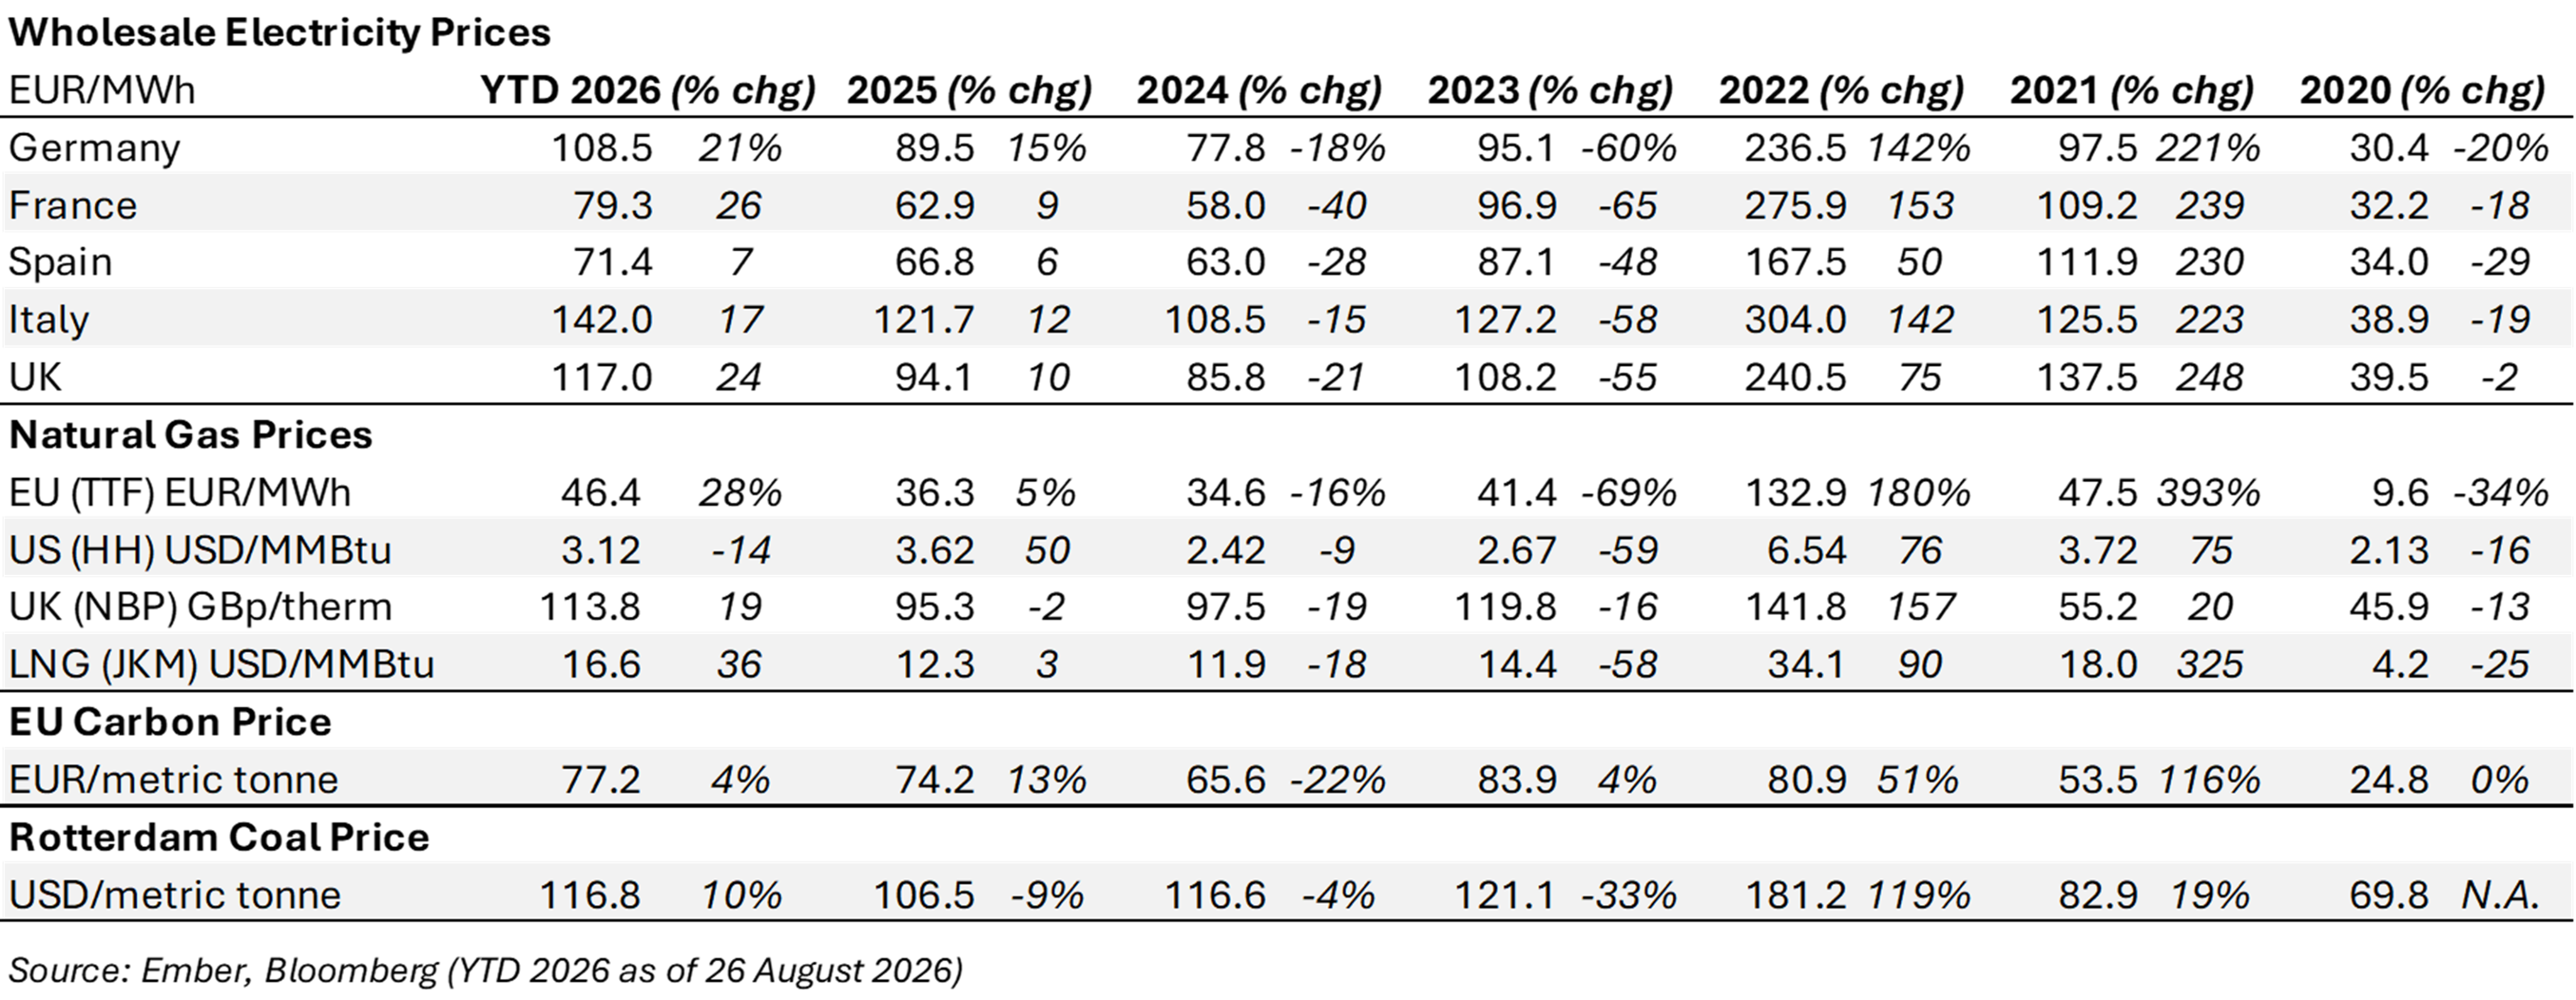
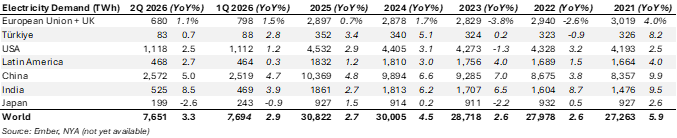
Rising gas prices have also pushed up power prices in countries that rely heavily on gas-fired generation, as gas-fired plants are typically the marginal producers under Europe’s merit-order system and therefore set wholesale electricity prices. Accordingly, average wholesale power prices in Germany, Italy, and the UK have already exceeded their 2025 averages by 21%, 17%, and 24%, respectively, on a year-to-date basis in 2026 (see Table 2). By contrast, prices in Spain have risen less (+7%) as the country is less dependent on gas for power generation. Despite elevated power prices across Europe, it is encouraging that “EU plus UK” electricity demand continued to grow, rising 1.5% in the first quarter and by 1.1% in the second quarter of 2026 after several years of declining consumption driven by efficiency gains in response to high power prices (see Table 3).
Table 4 Annual Electricity Demand (TWh)

Gas Storage and LNG Flows
Exhibit 3 US Gas Storage Exhibit 4 US LNG Exports 
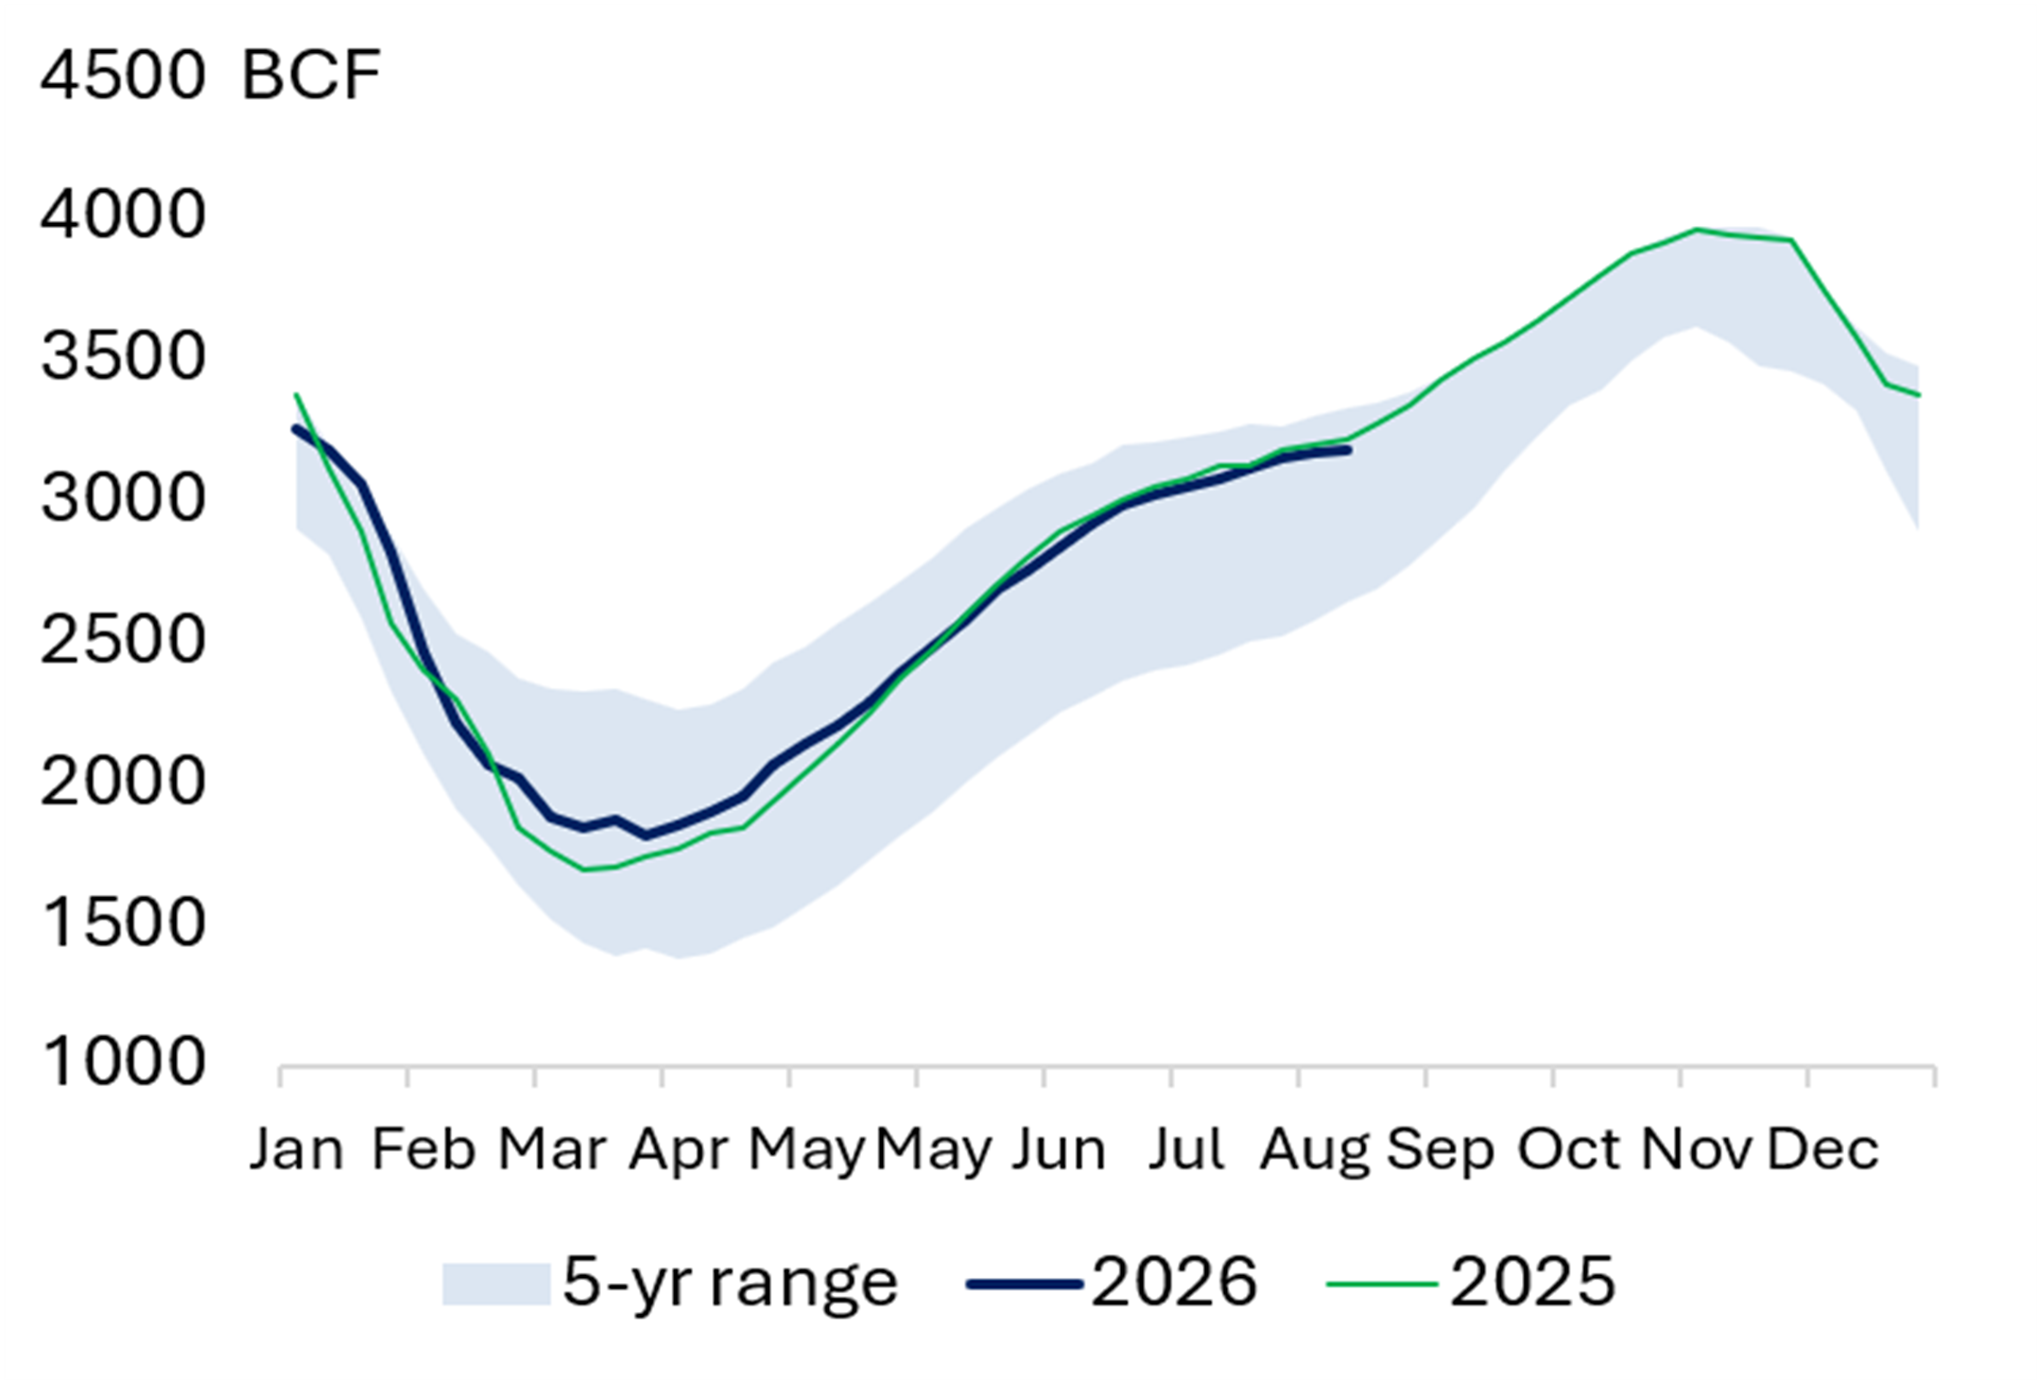
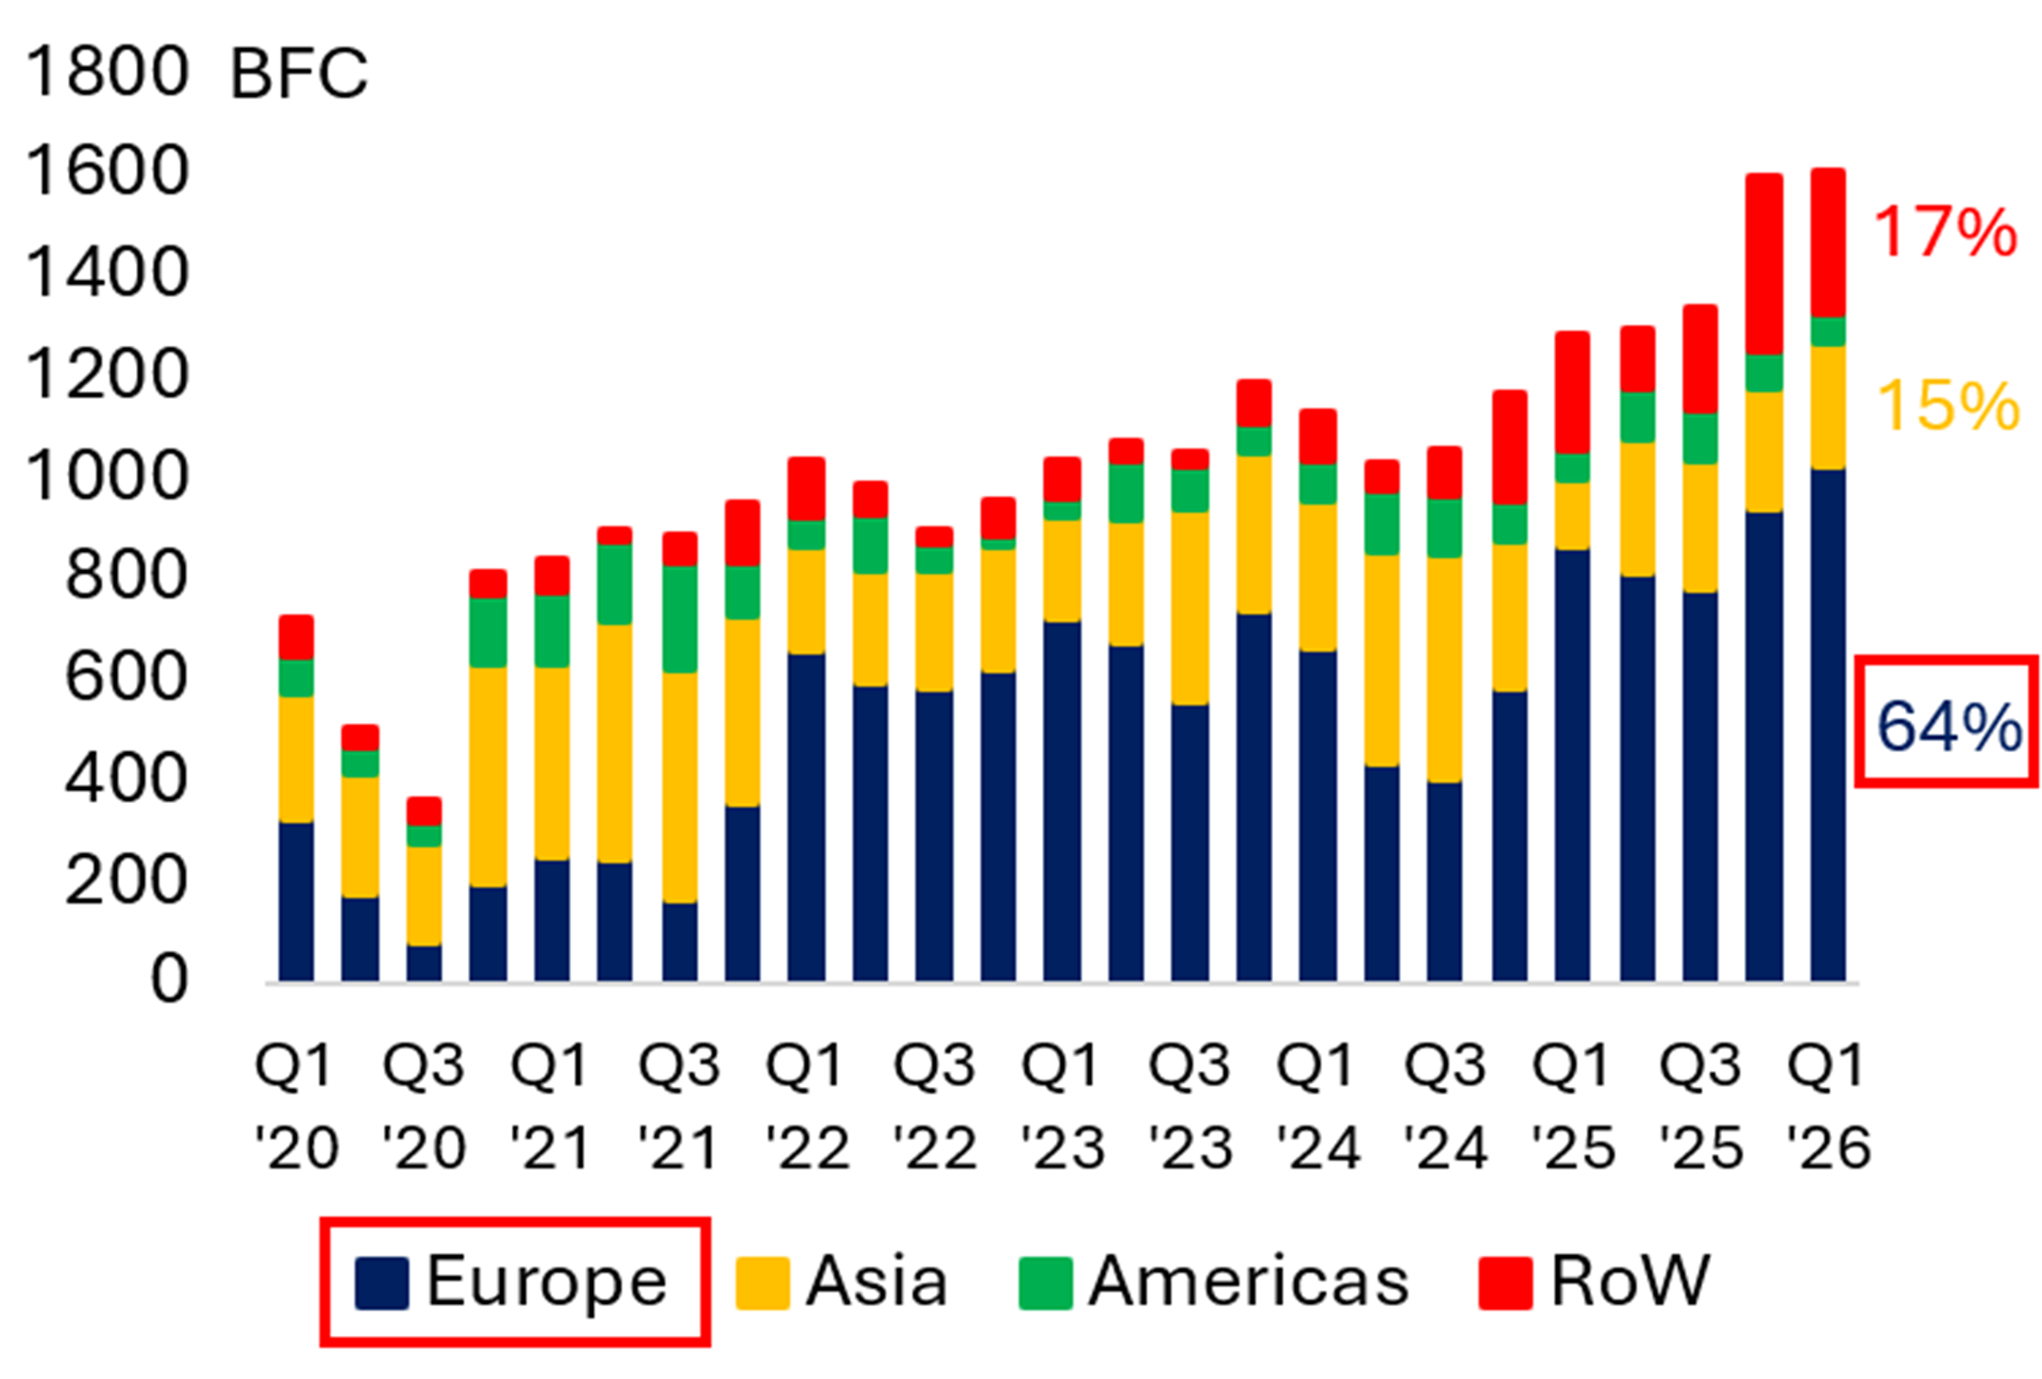

Source: US Energy Information Administration Source: US Energy Information Administration
Exhibit 5 EU Gas Storage (% full) Exhibit 6 EU Gas Demand 

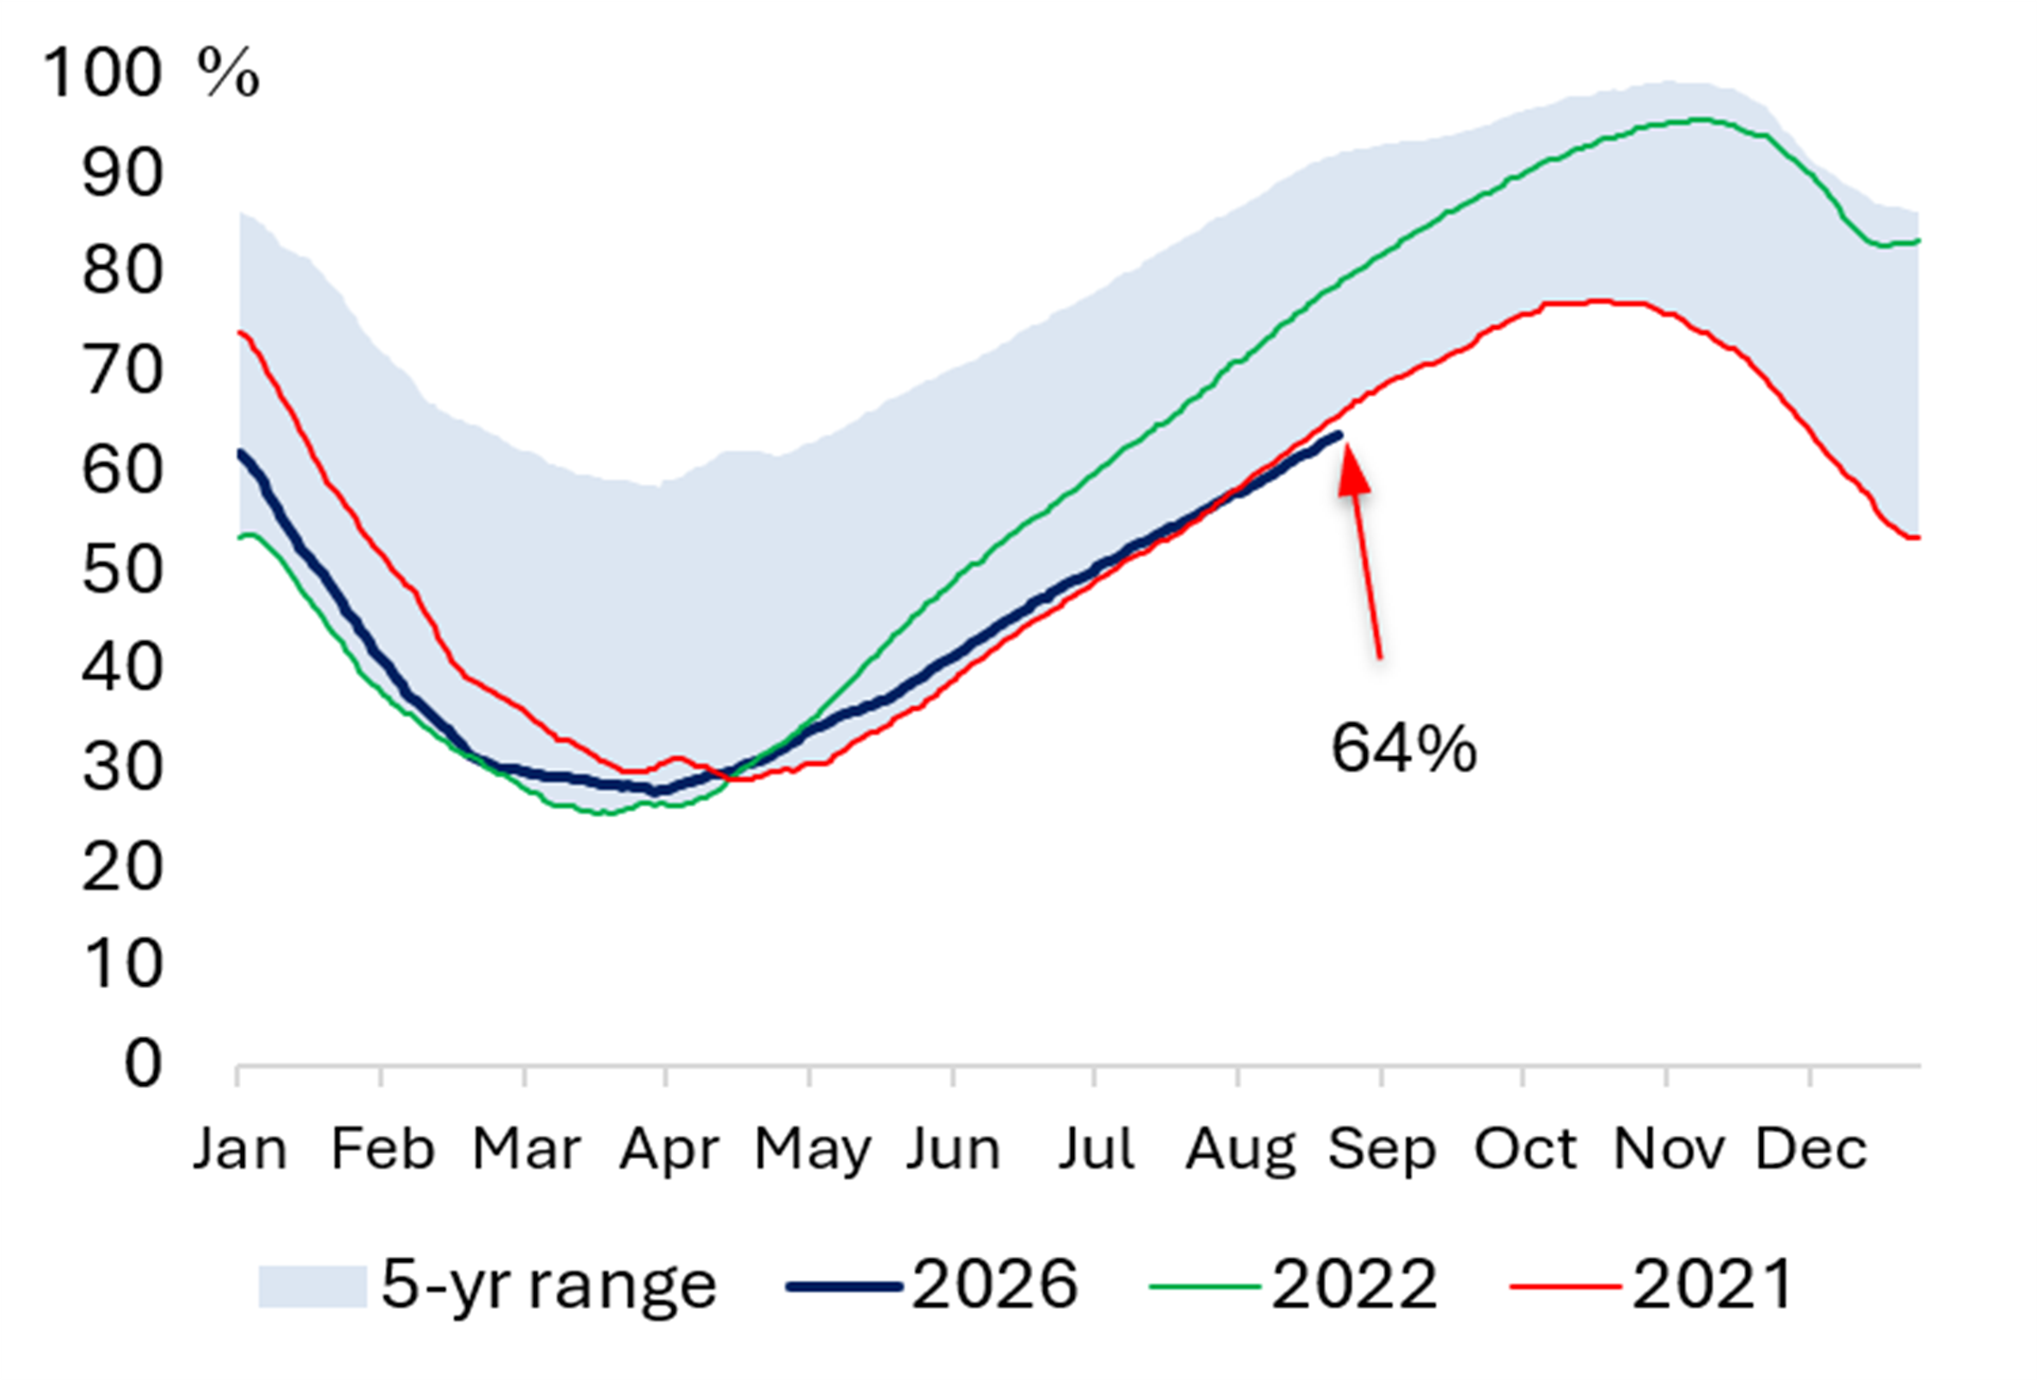
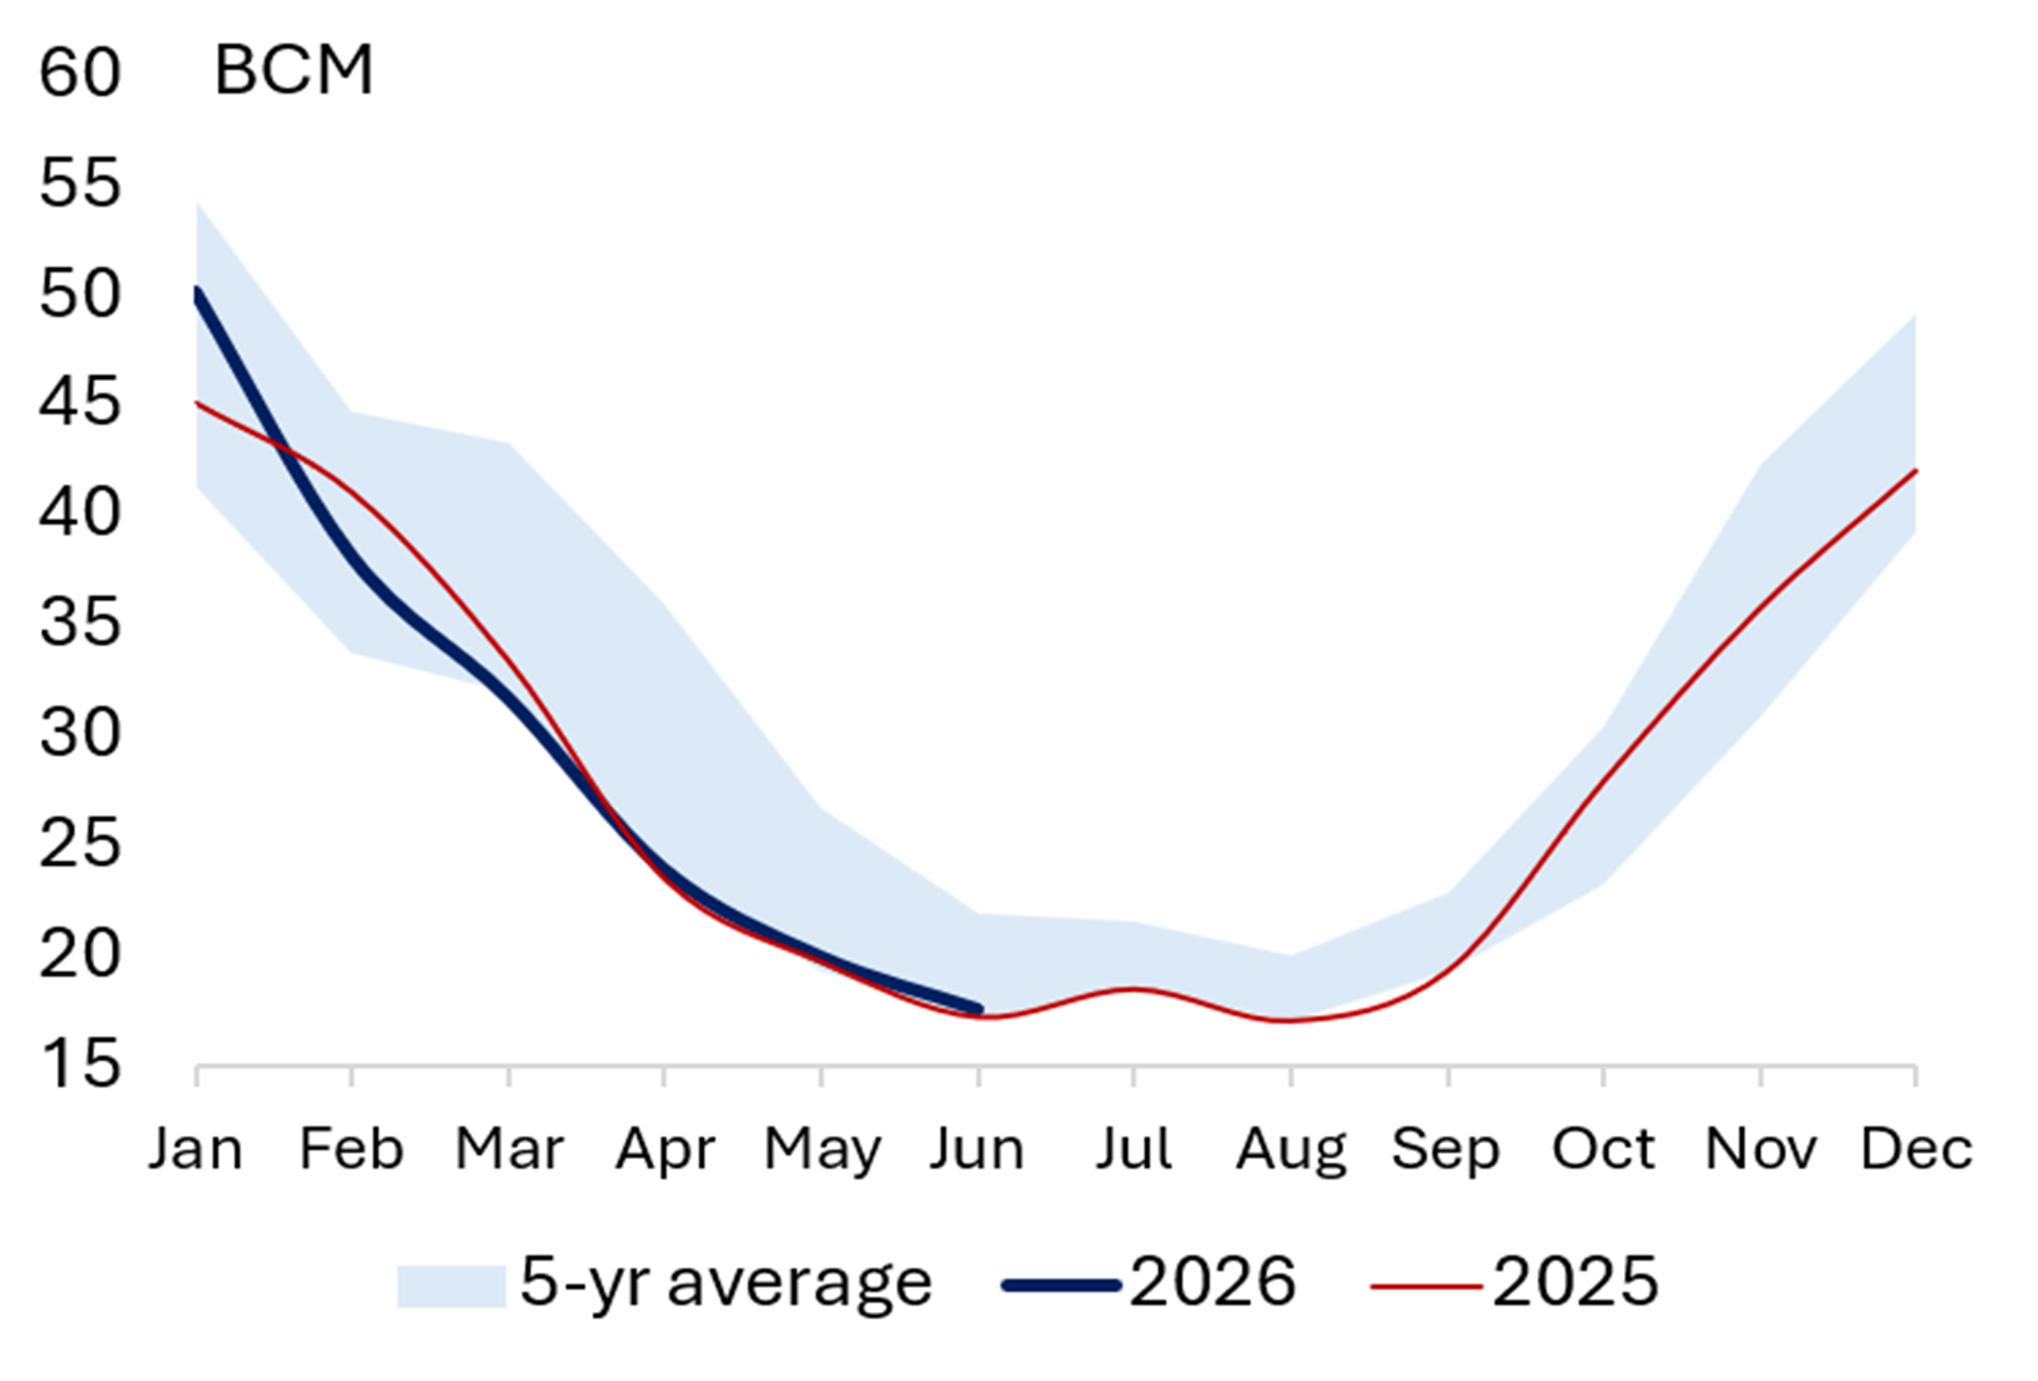
Source: Gas Infrastructure Europe Source: Eurostat
Exhibit 7 EU Quarterly Gas Imports by Source Exhibit 8 EU Monthly LNG Imports 

Source: Bruegel Source: Bruegel
Global Electrification Trends (Power Demand in TWh)
Exhibit 9 Europe Electricity Demand Exhibit 10 USA Electricity Demand 
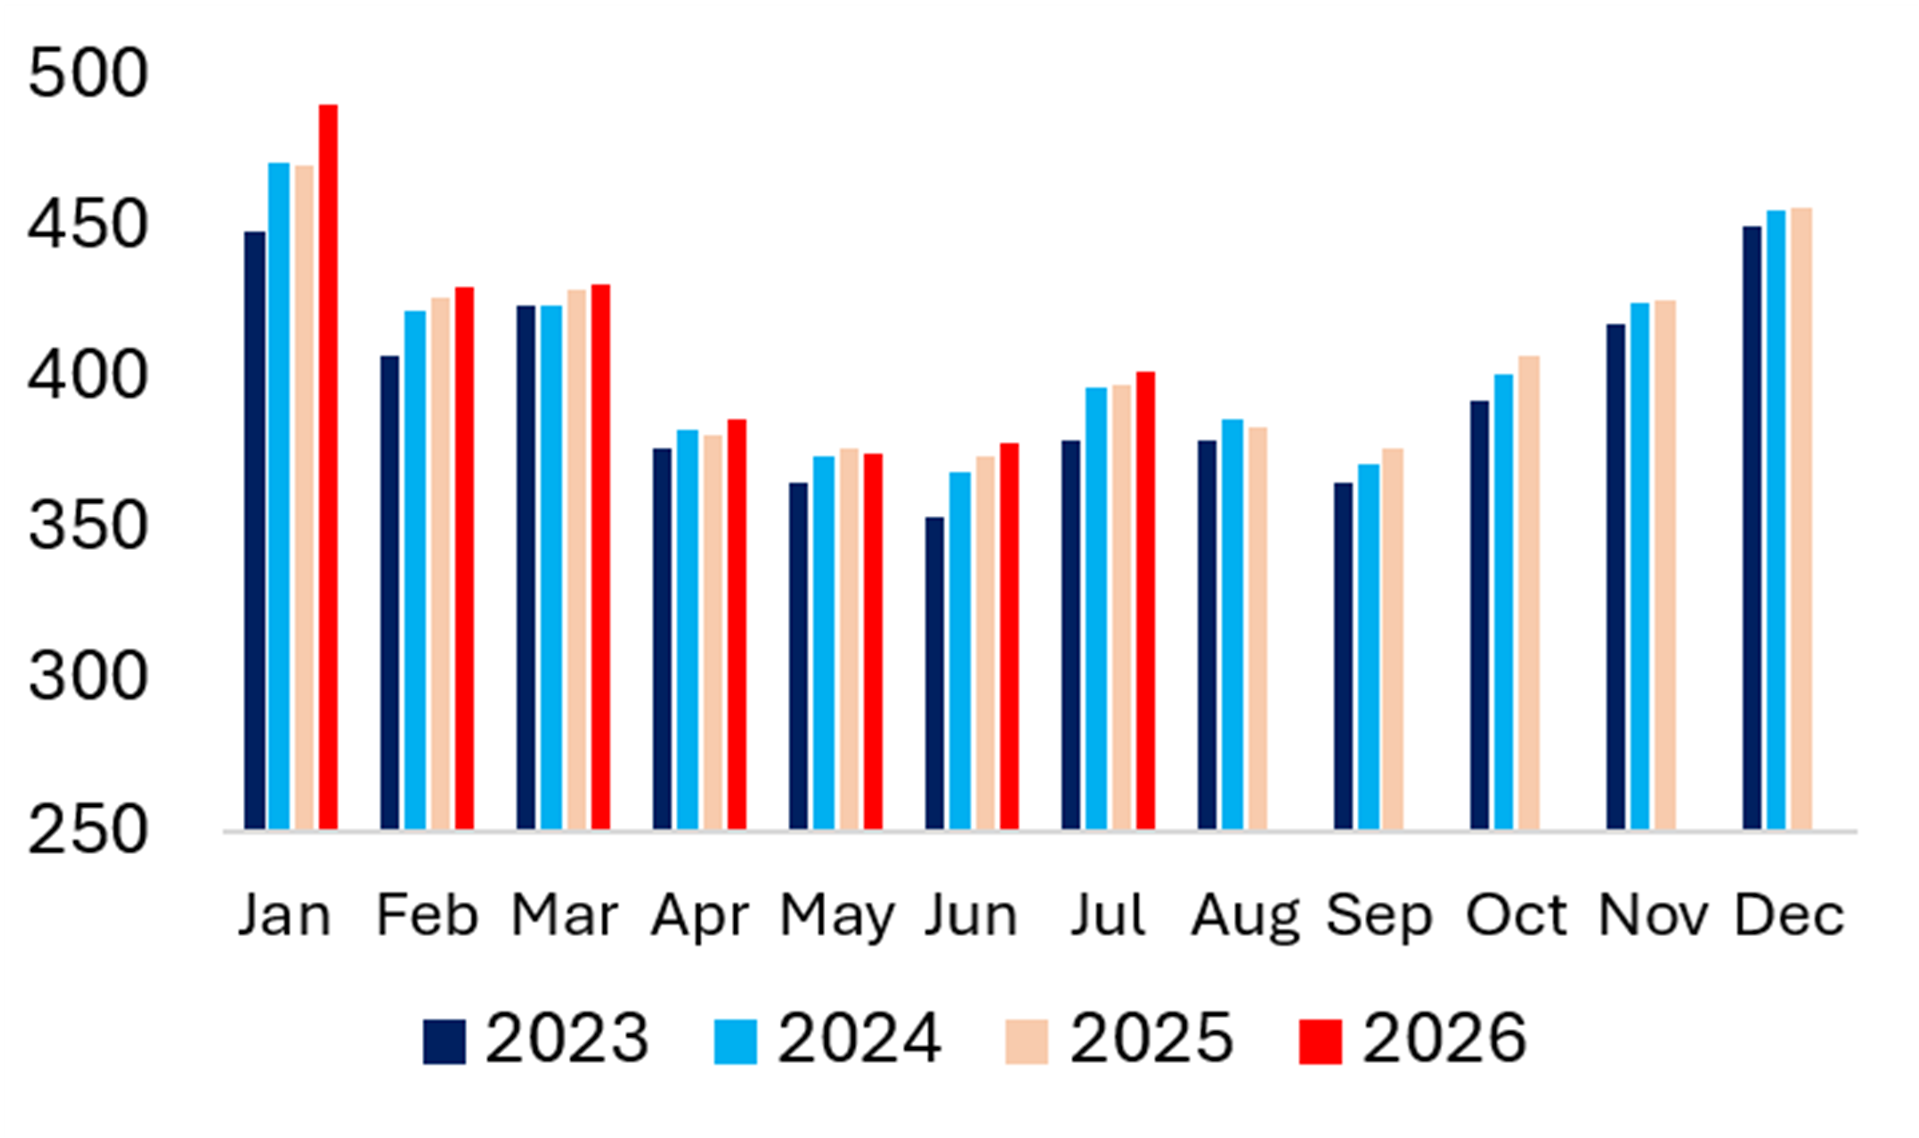

Exhibit 11 Türkiye Electricity Demand Exhibit 12 LatAm Electricity Demand 

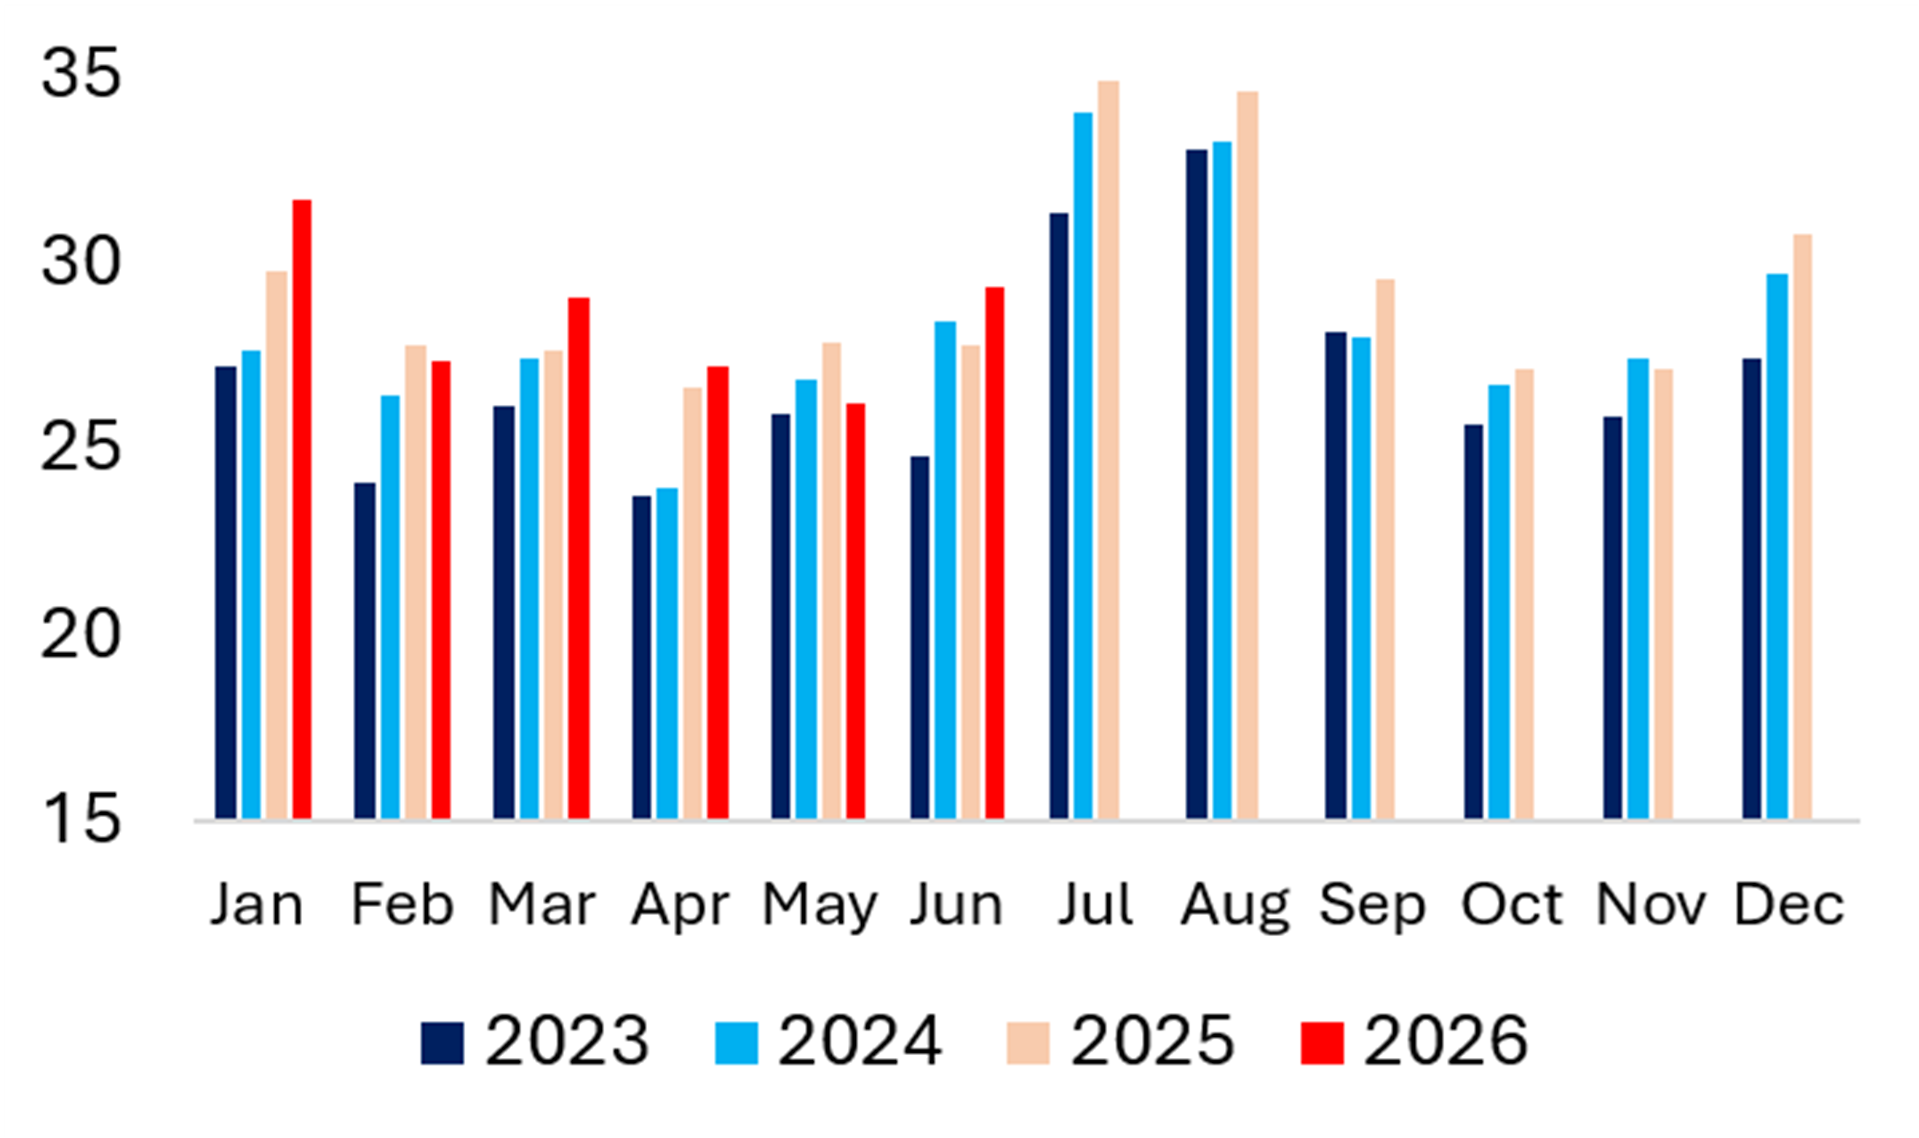
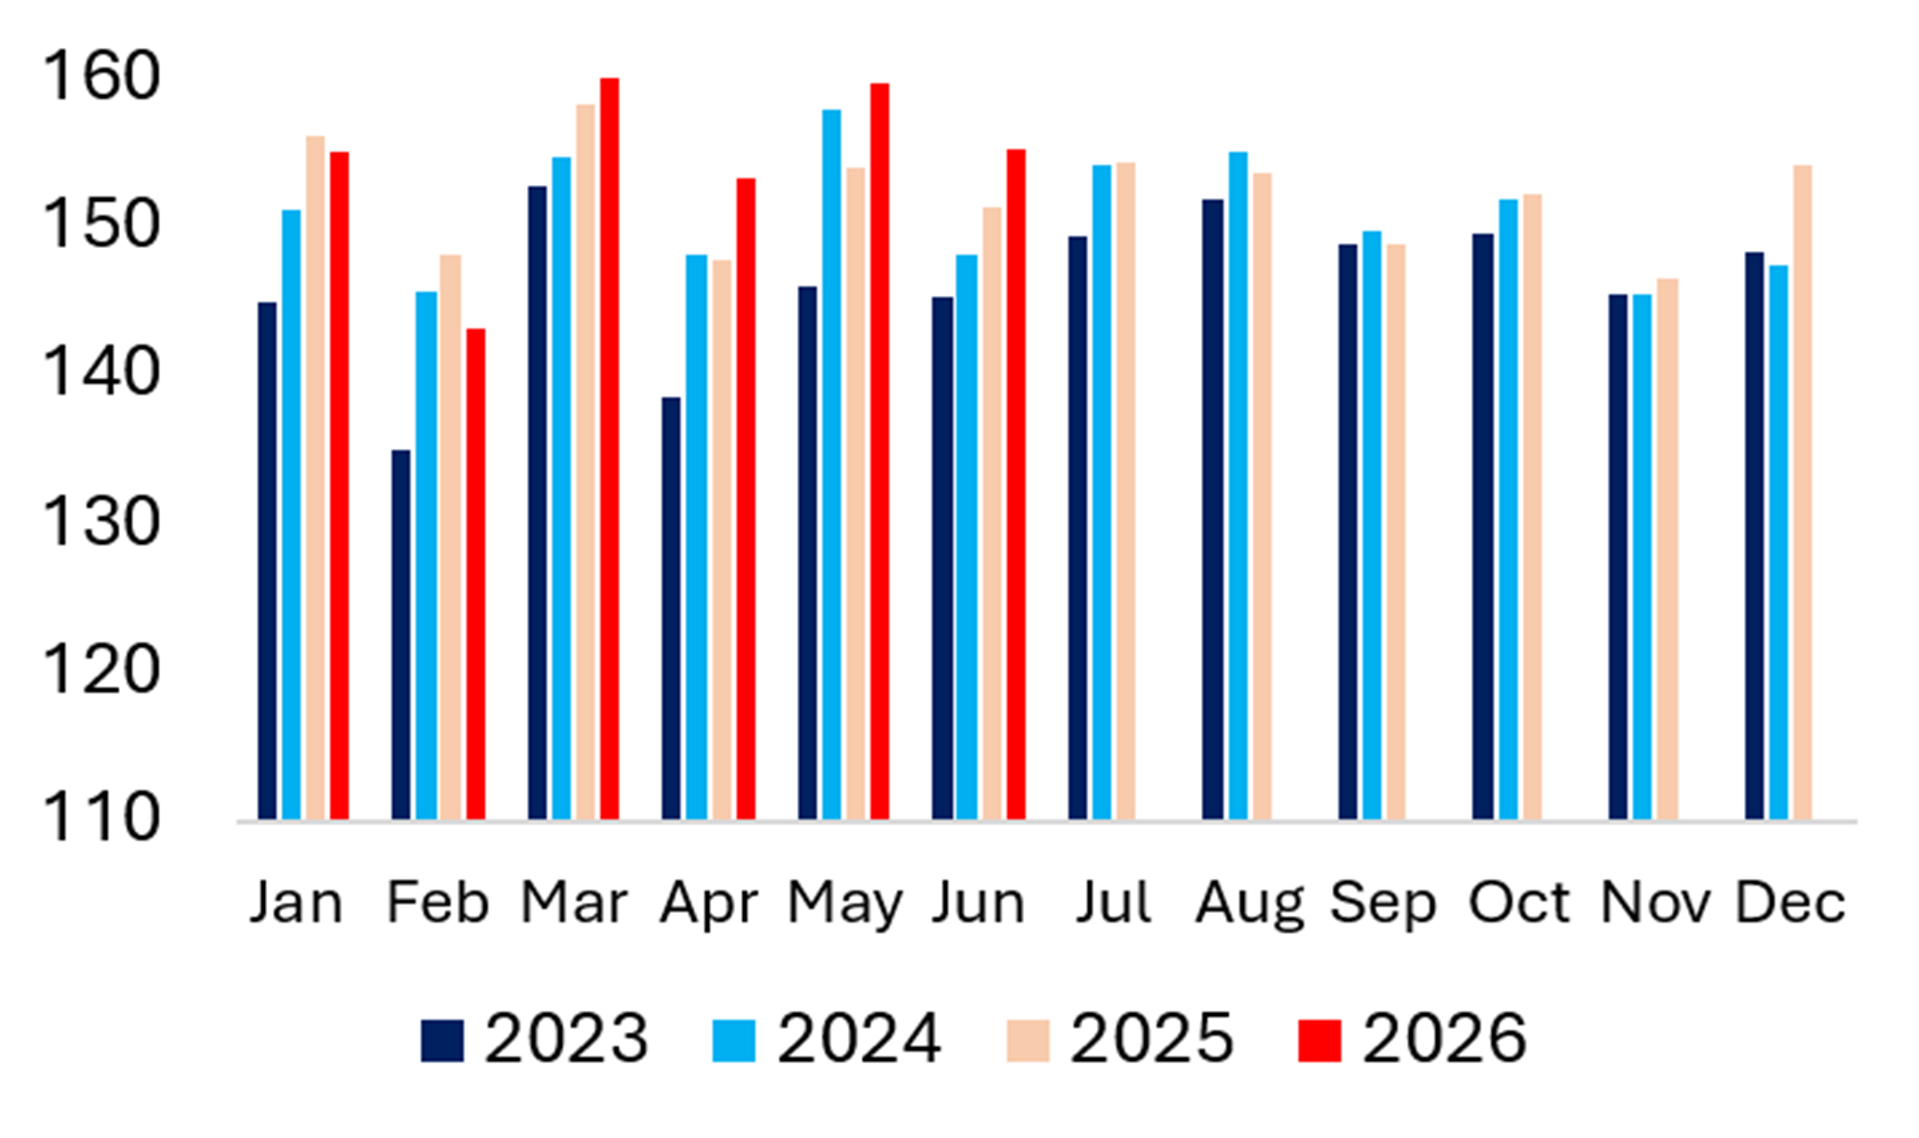
Exhibit 13 China Electricity Demand Exhibit 14 Japan Electricity Demand 

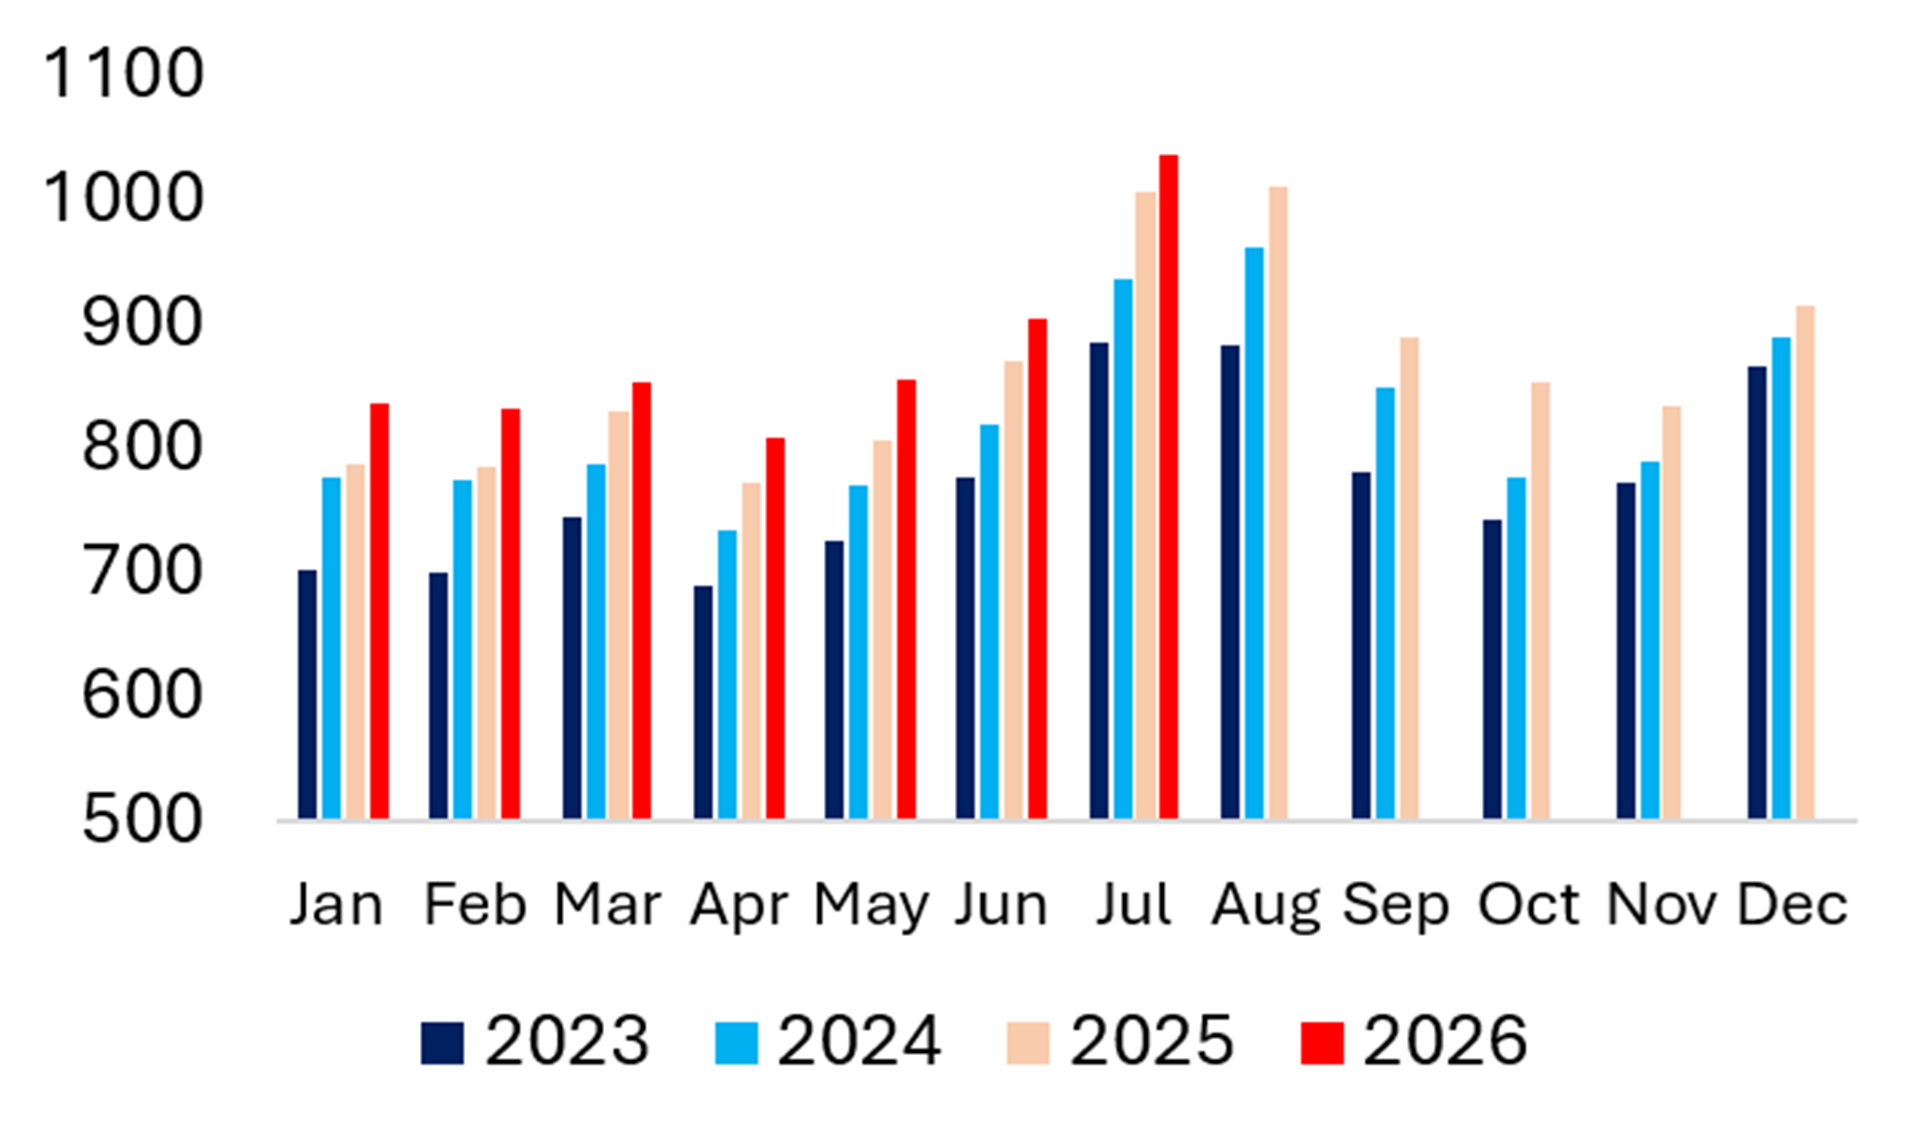
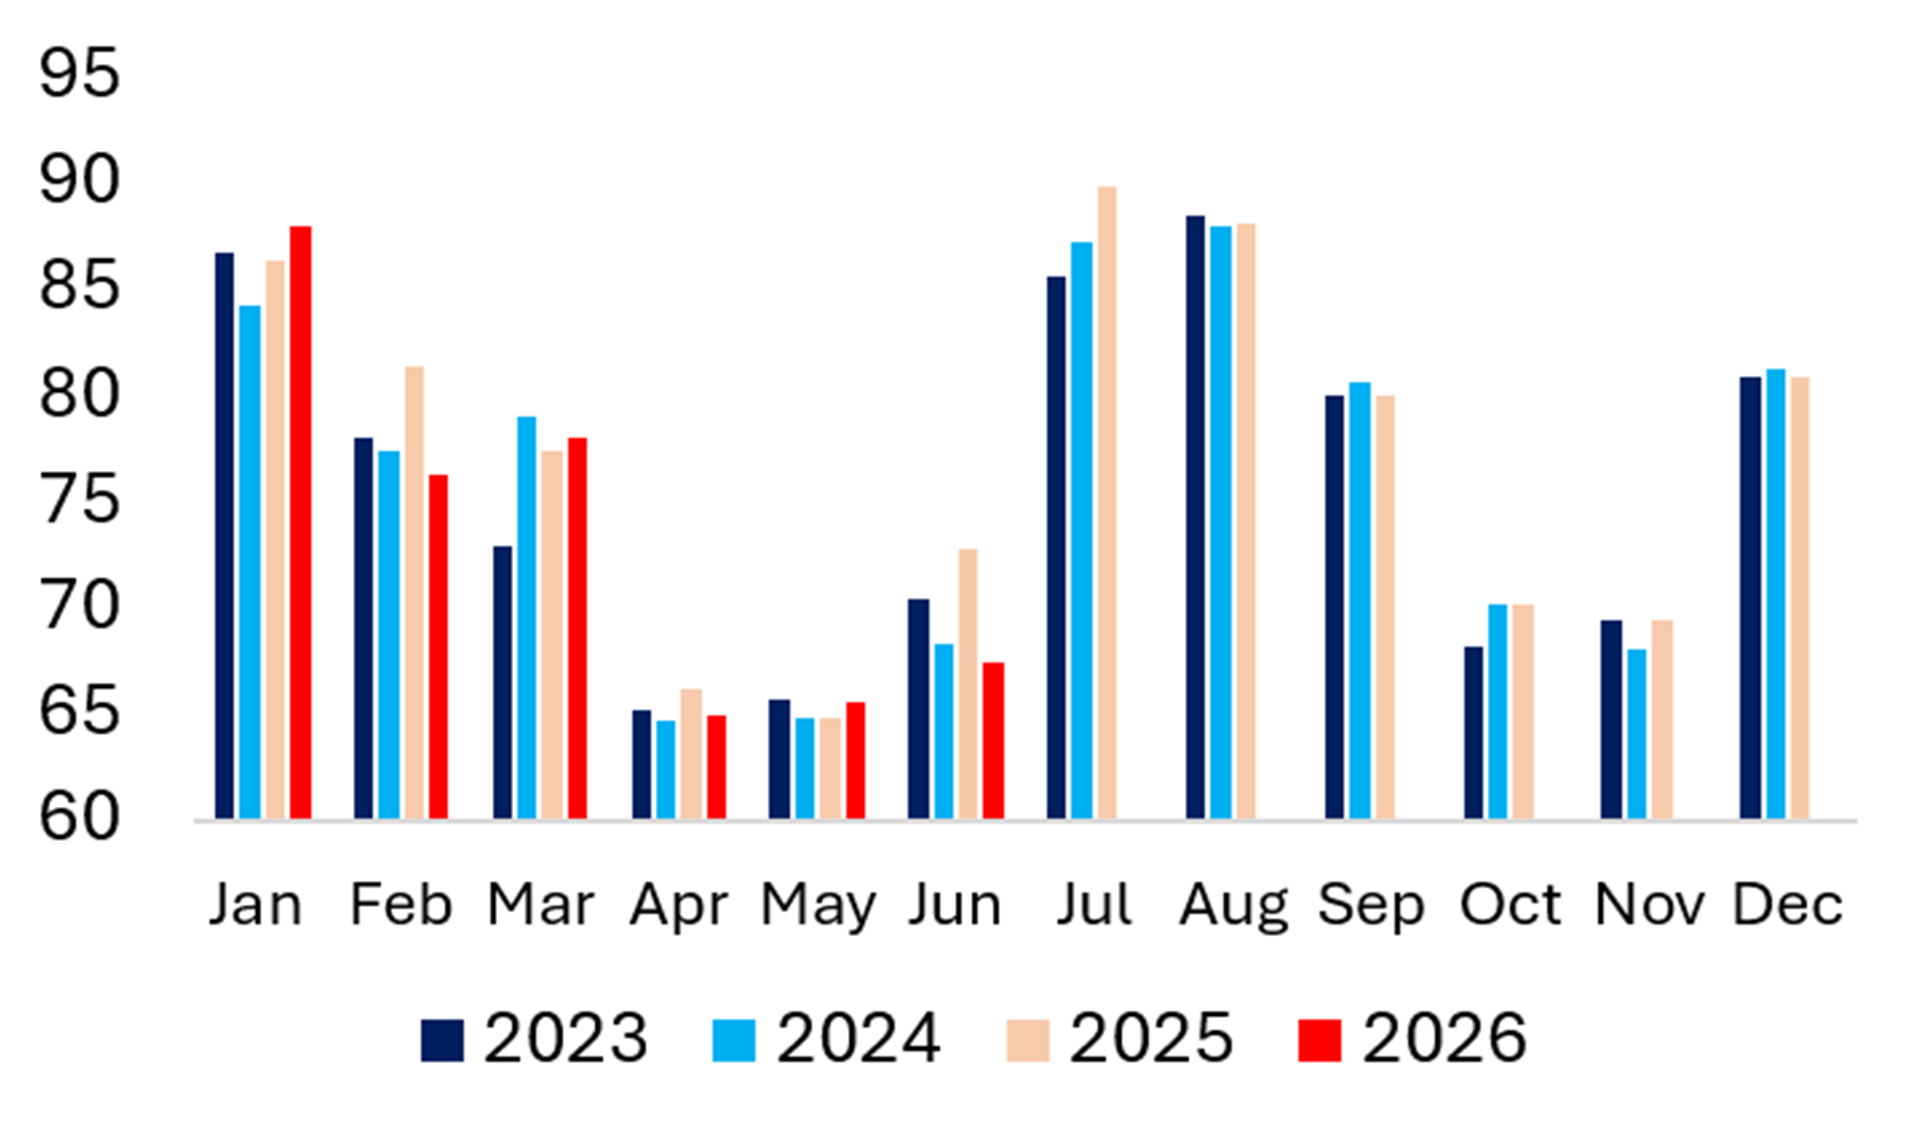
Exhibit 15 India Electricity Demand Exhibit 16 World Electricity Demand

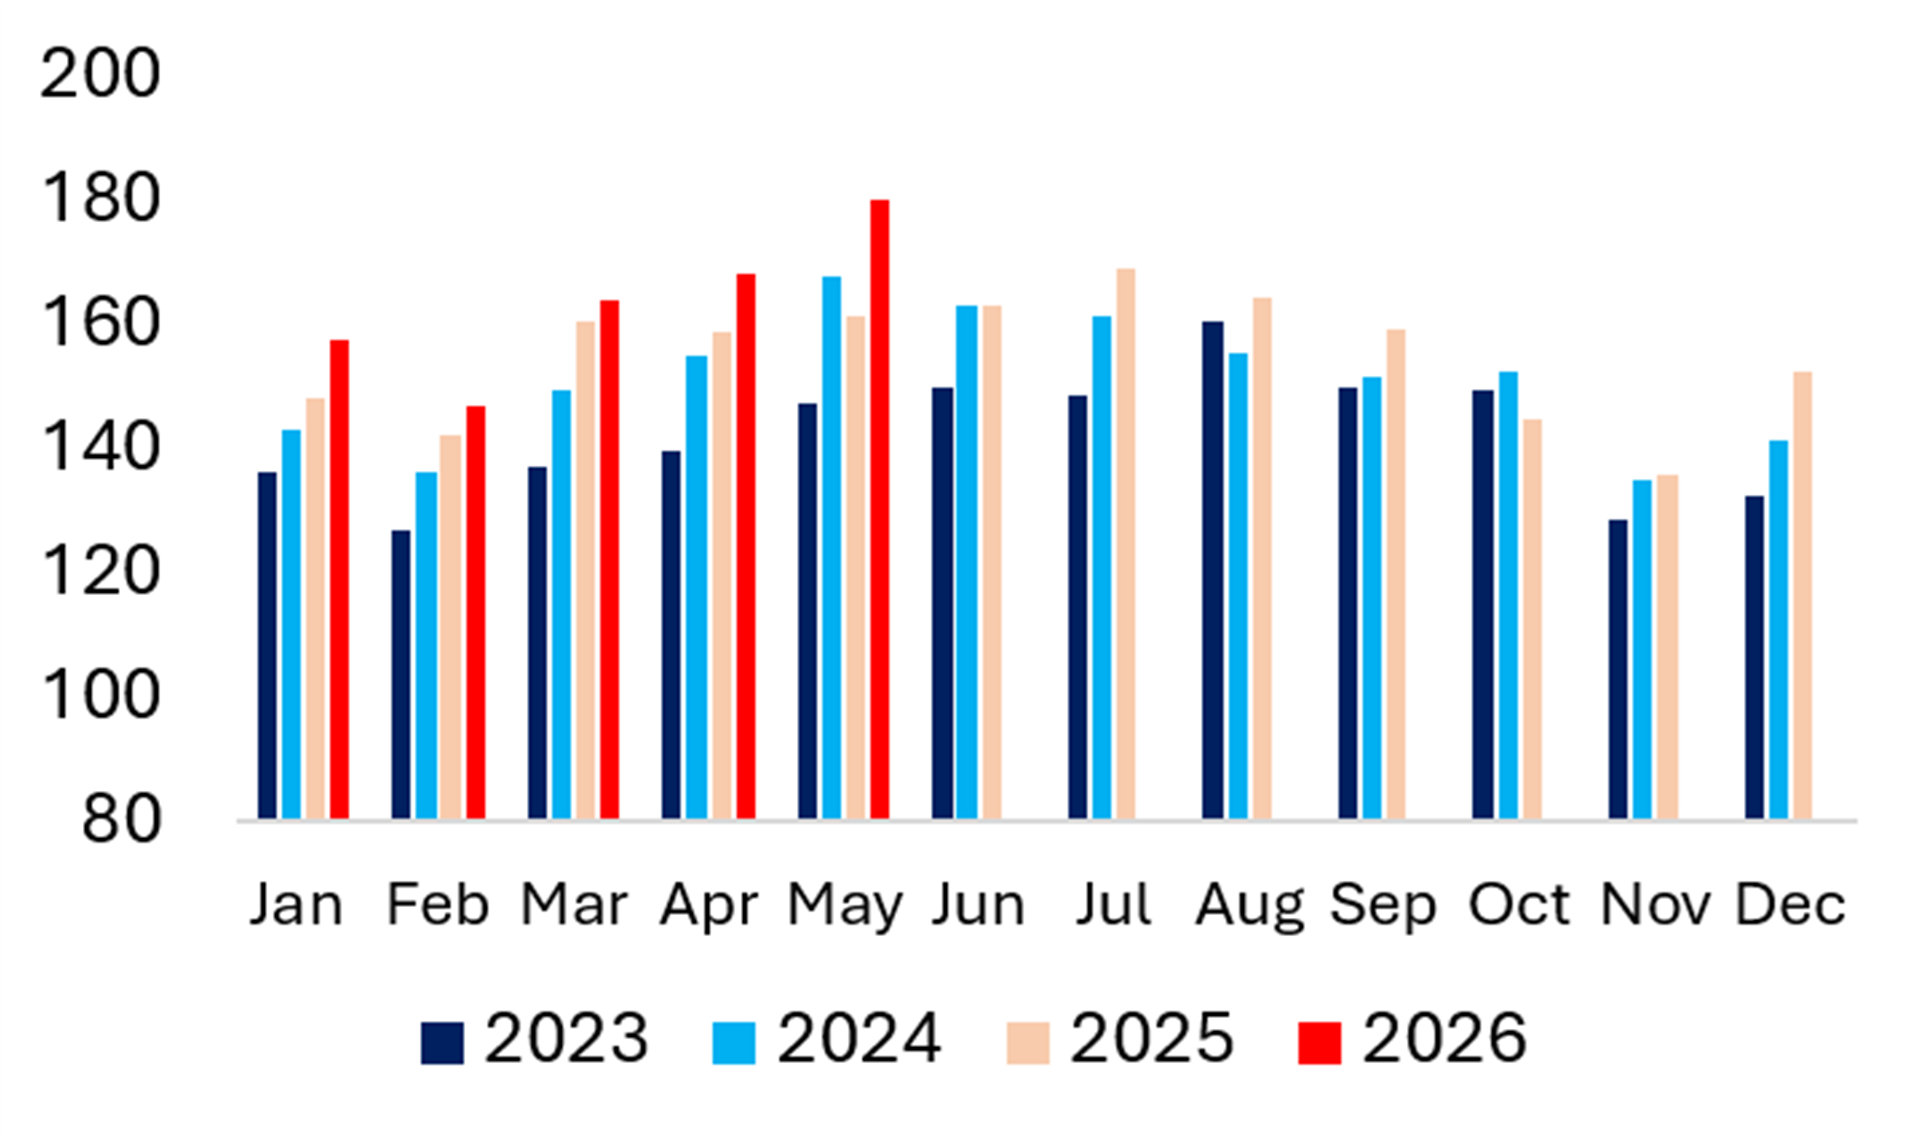
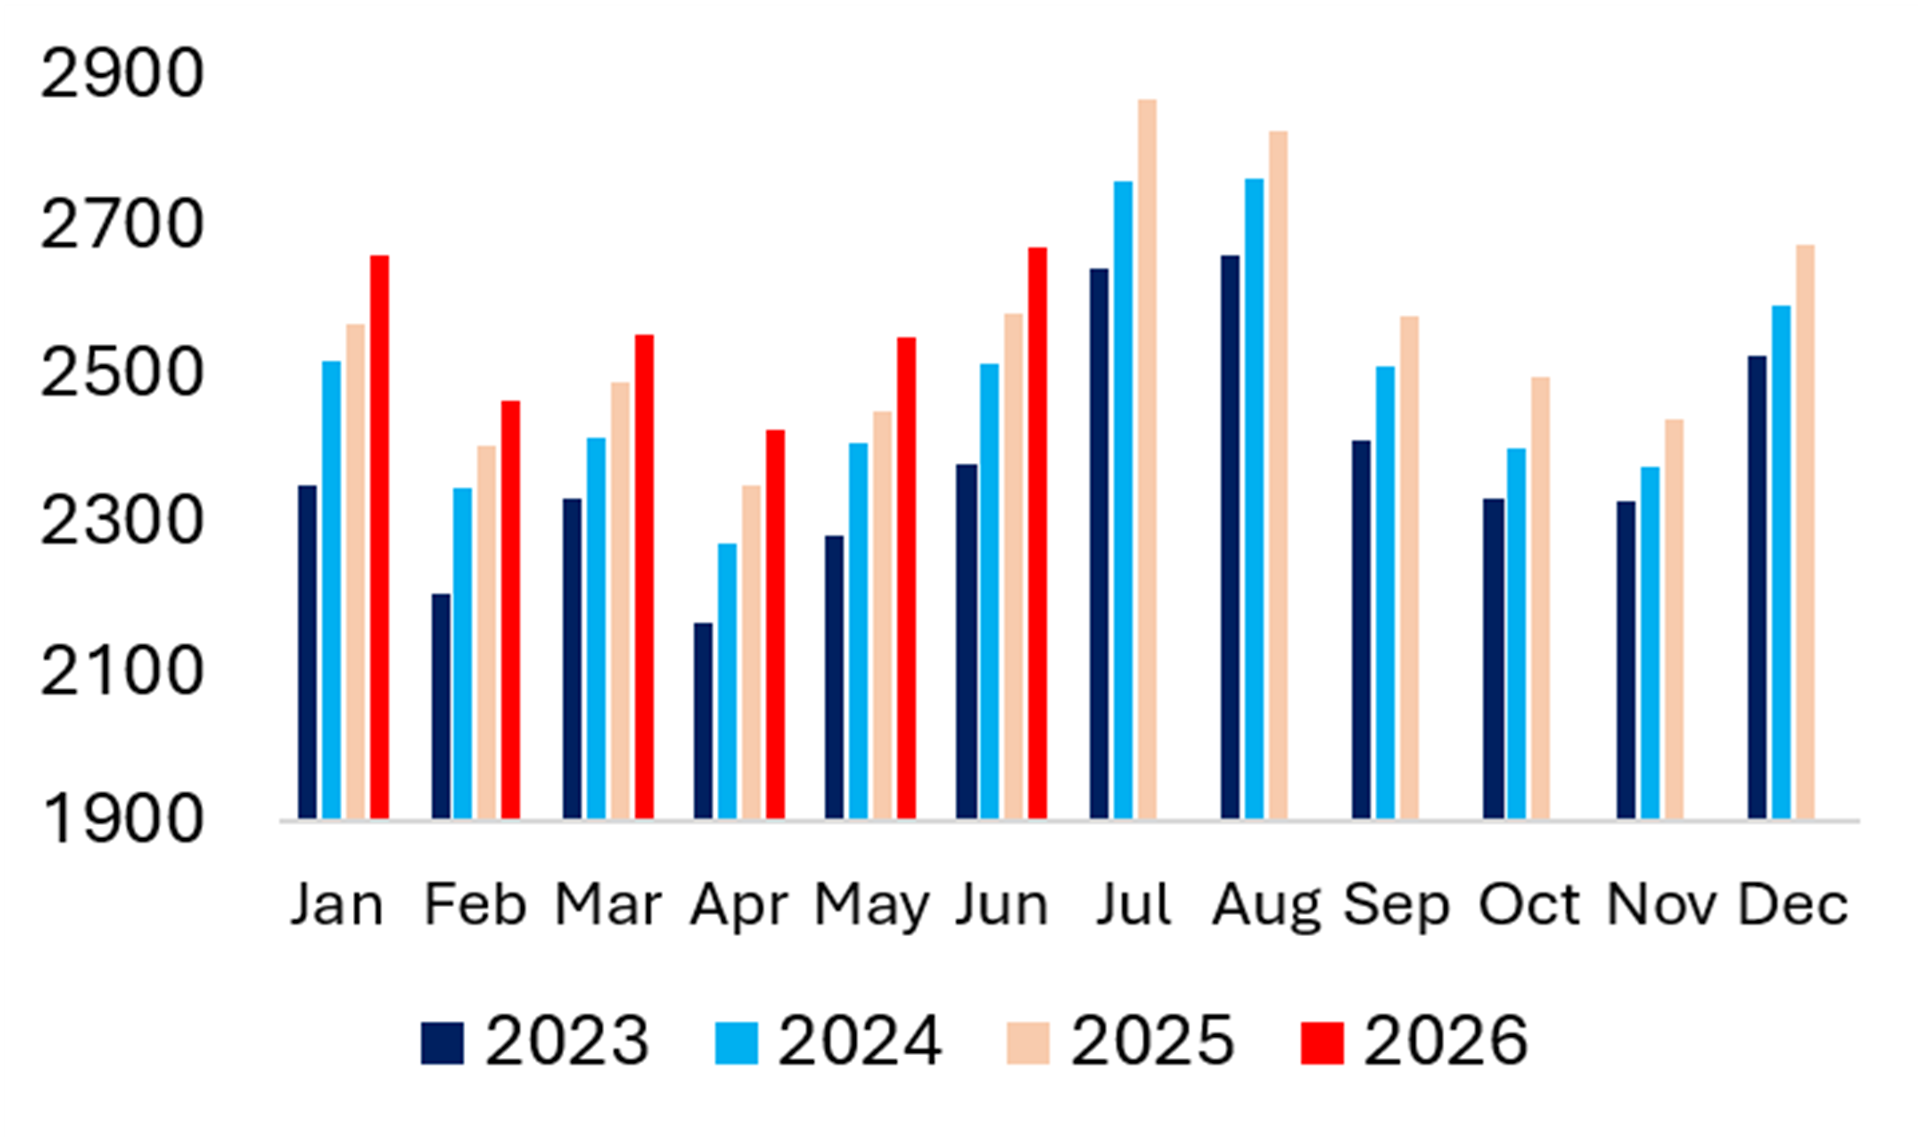

Source: EMBER
Power Tracker: Changing Fuel Mix and 3 Biggest Sources of Power Generation
EUROPE
Exhibit 17 Europe: Biggest Source of Electricity in Each Country
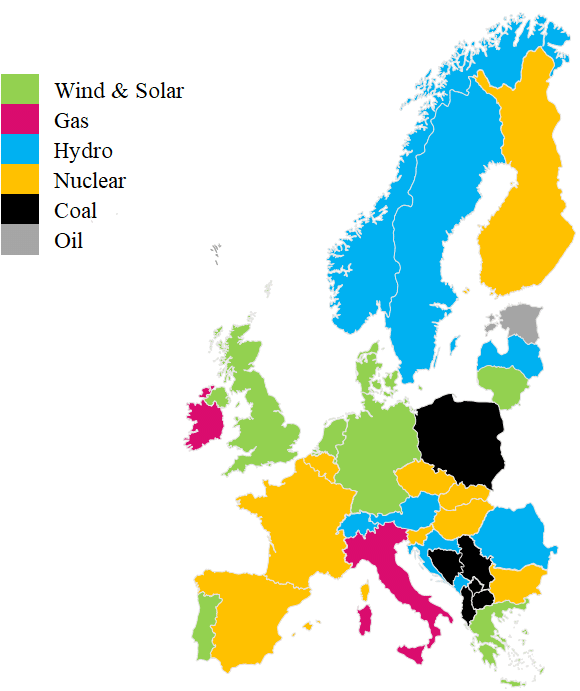
Exhibit 18 Power Generation Exhibit 19 Share of Wind & Solar (%) 
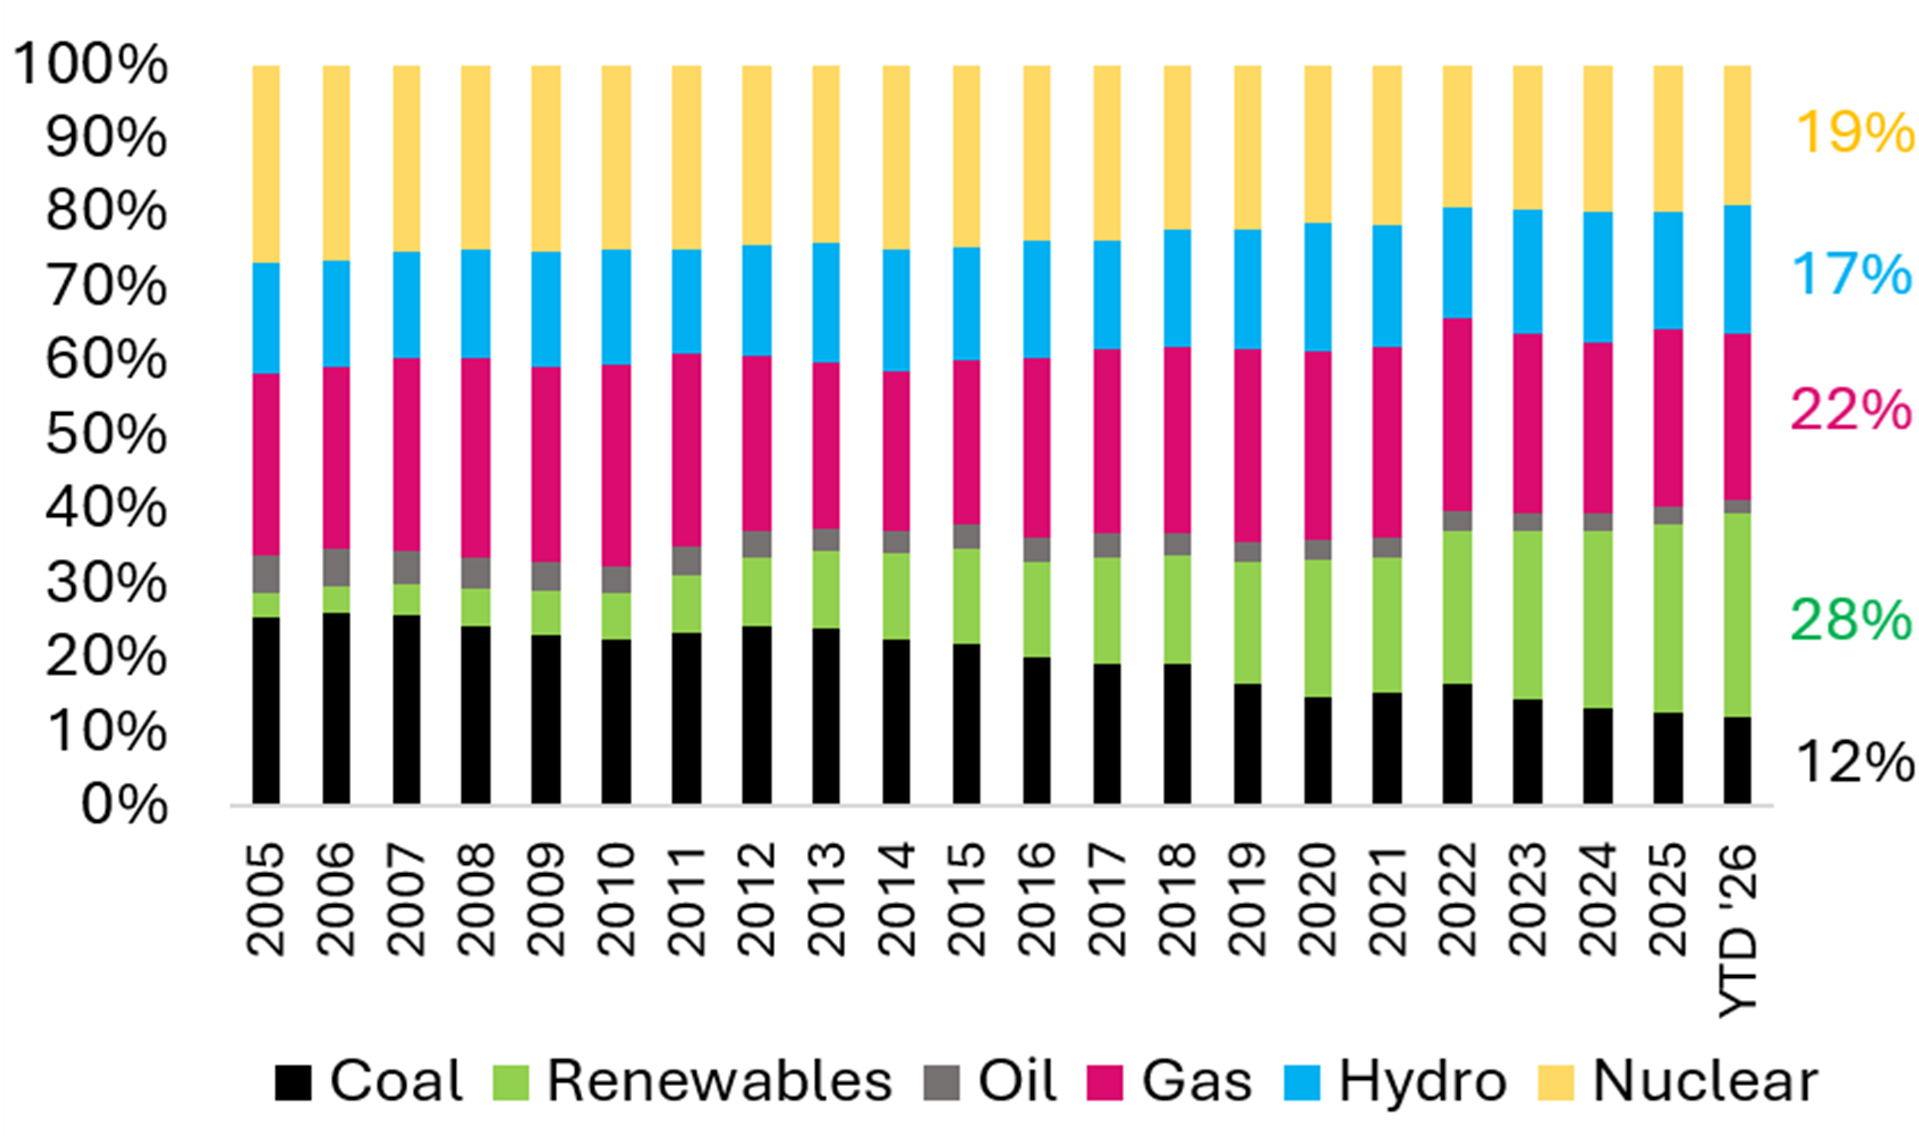
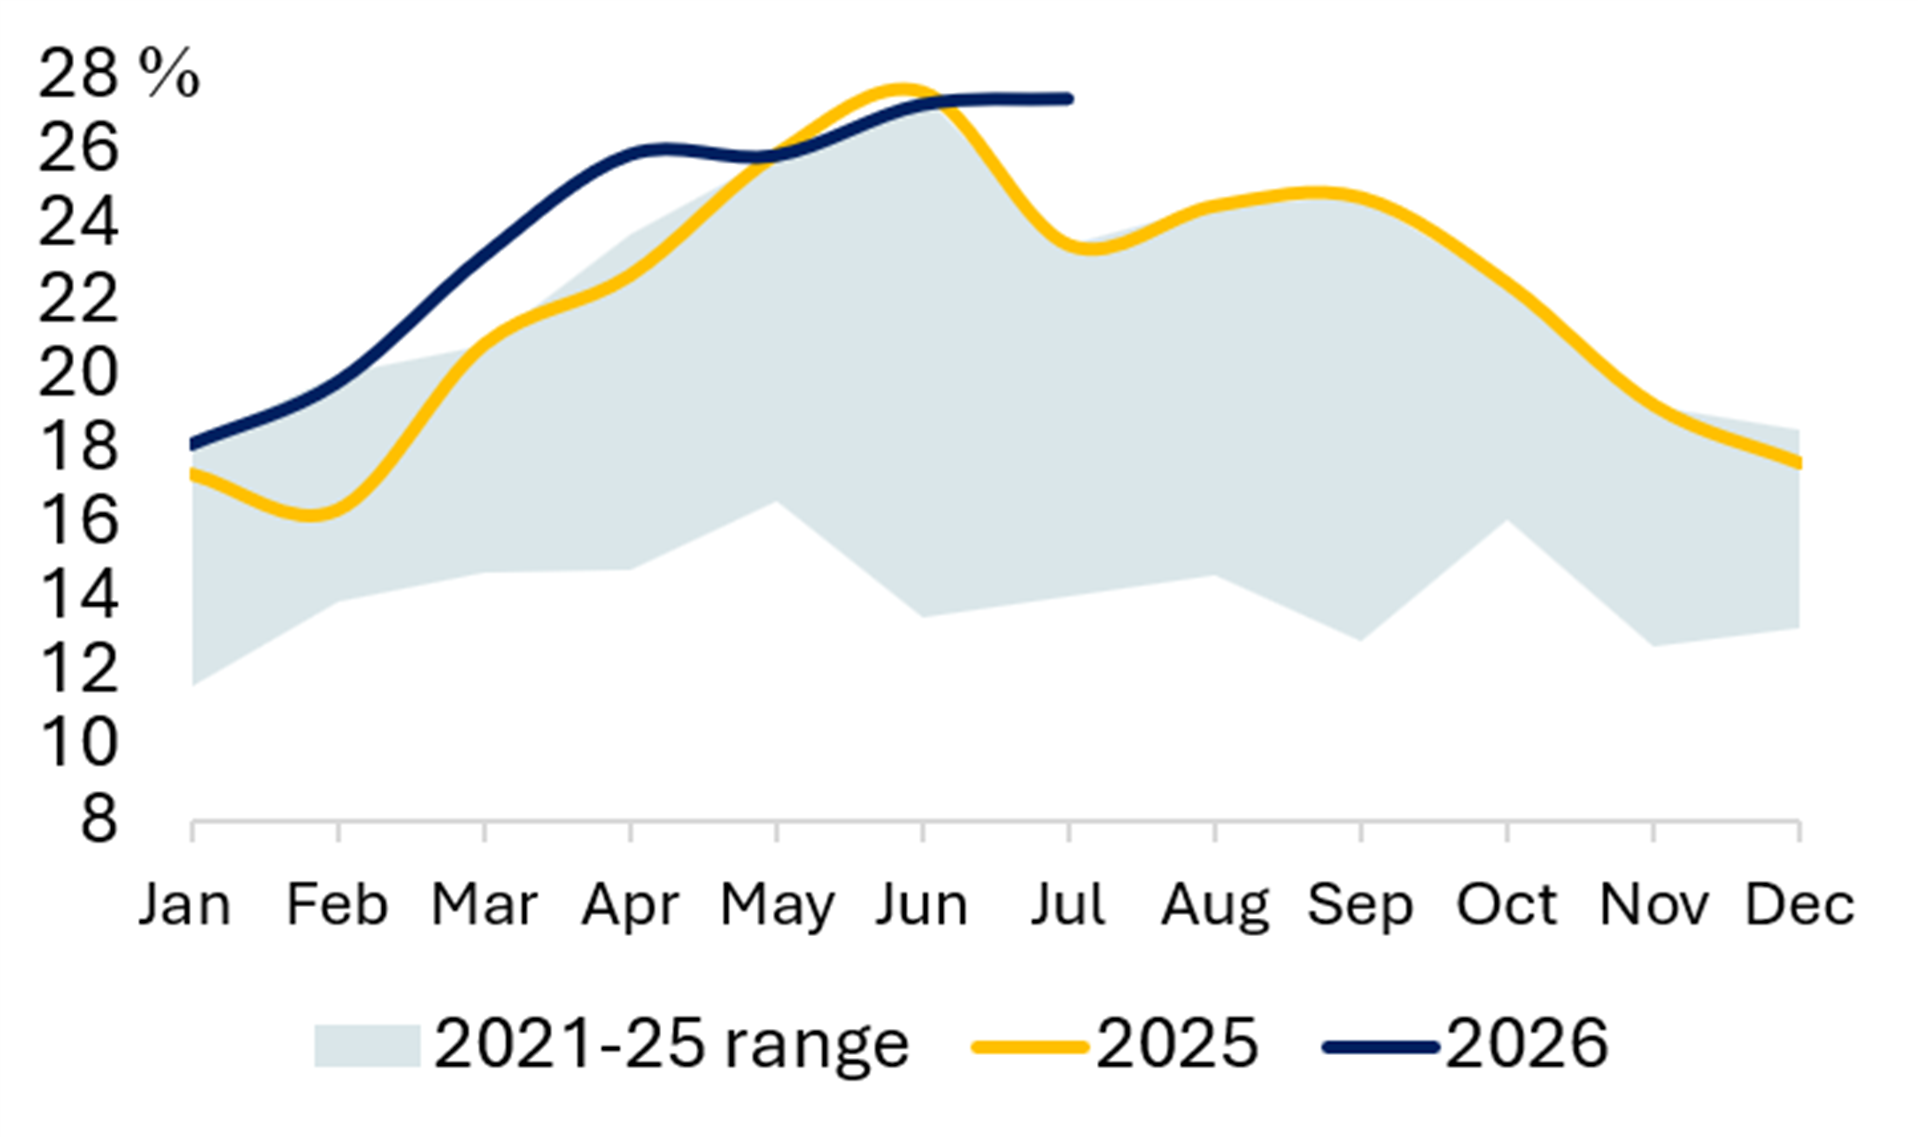

Exhibit 20 Share of Gas (%) Exhibit 21 Share of Nuclear (%) 

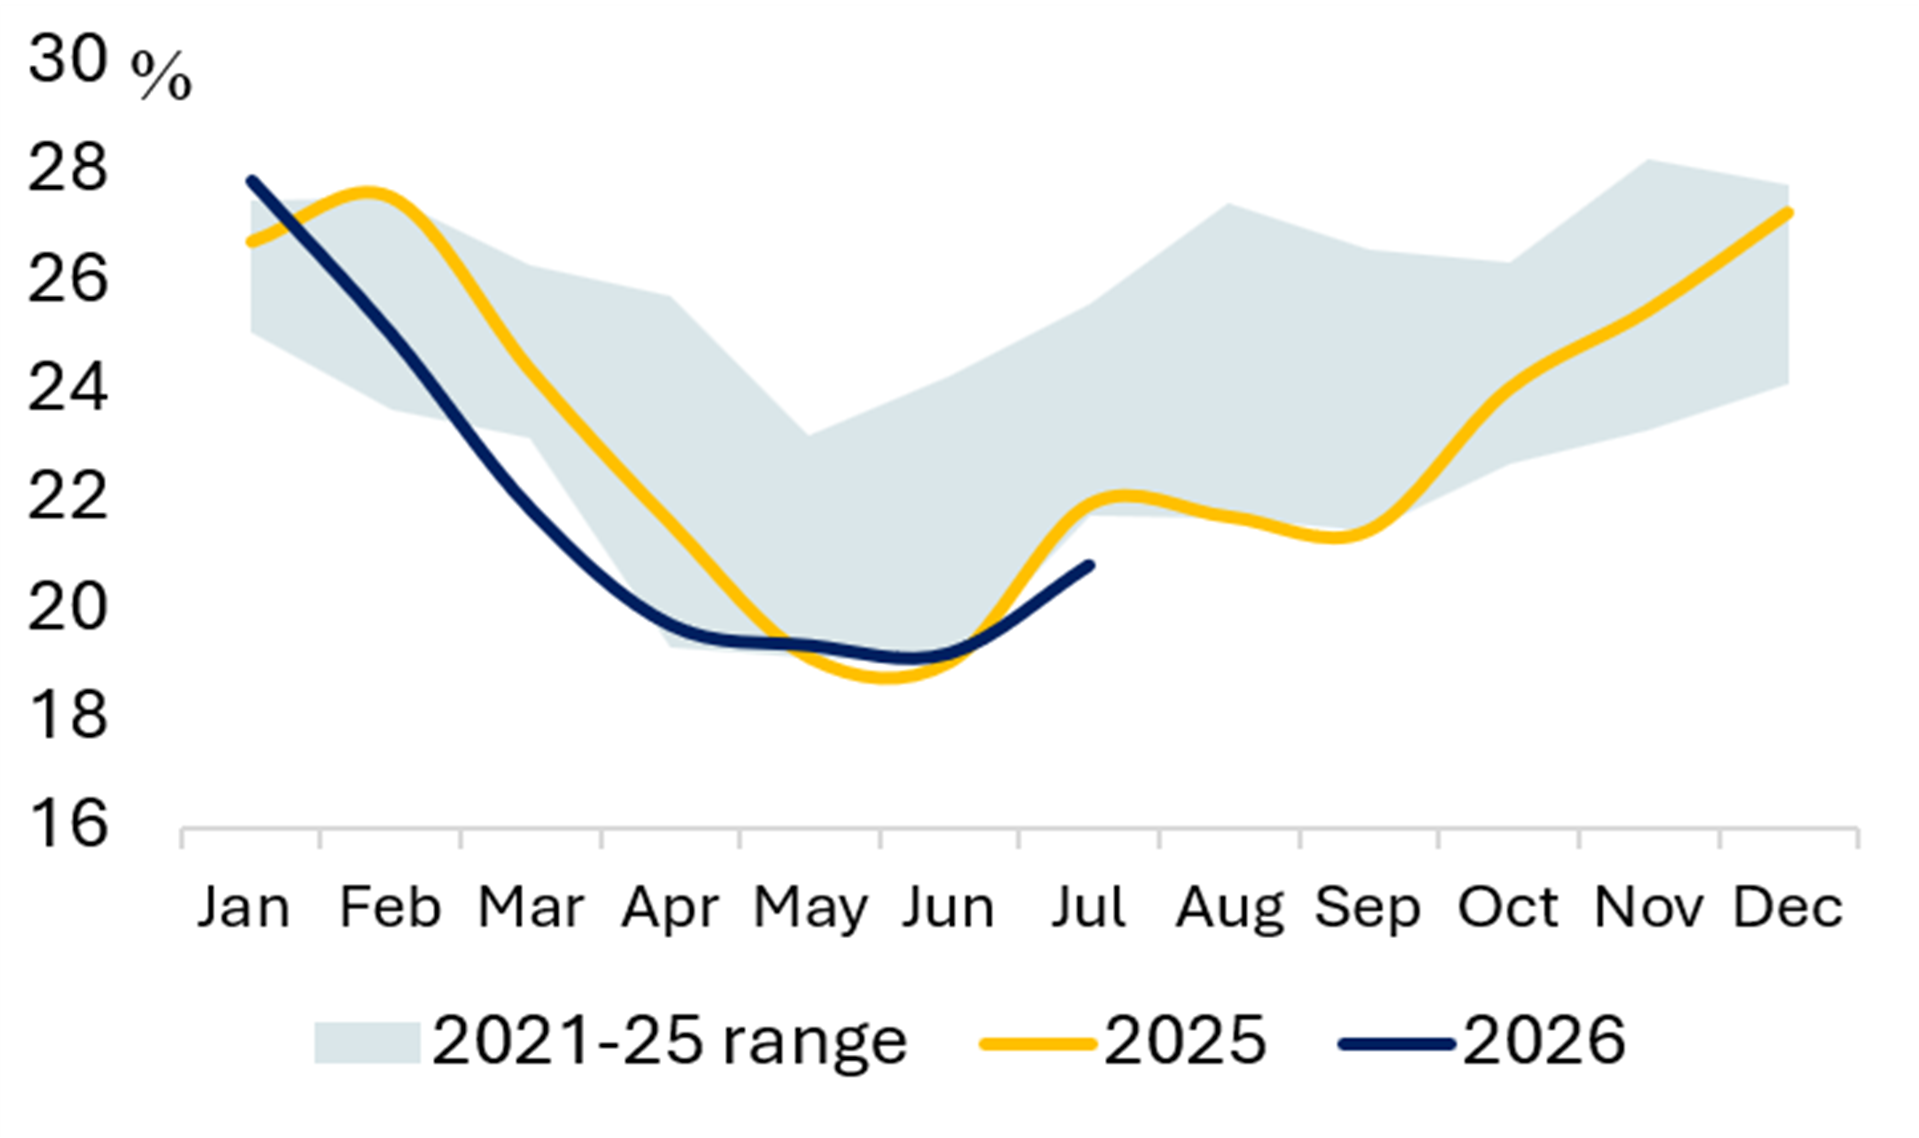
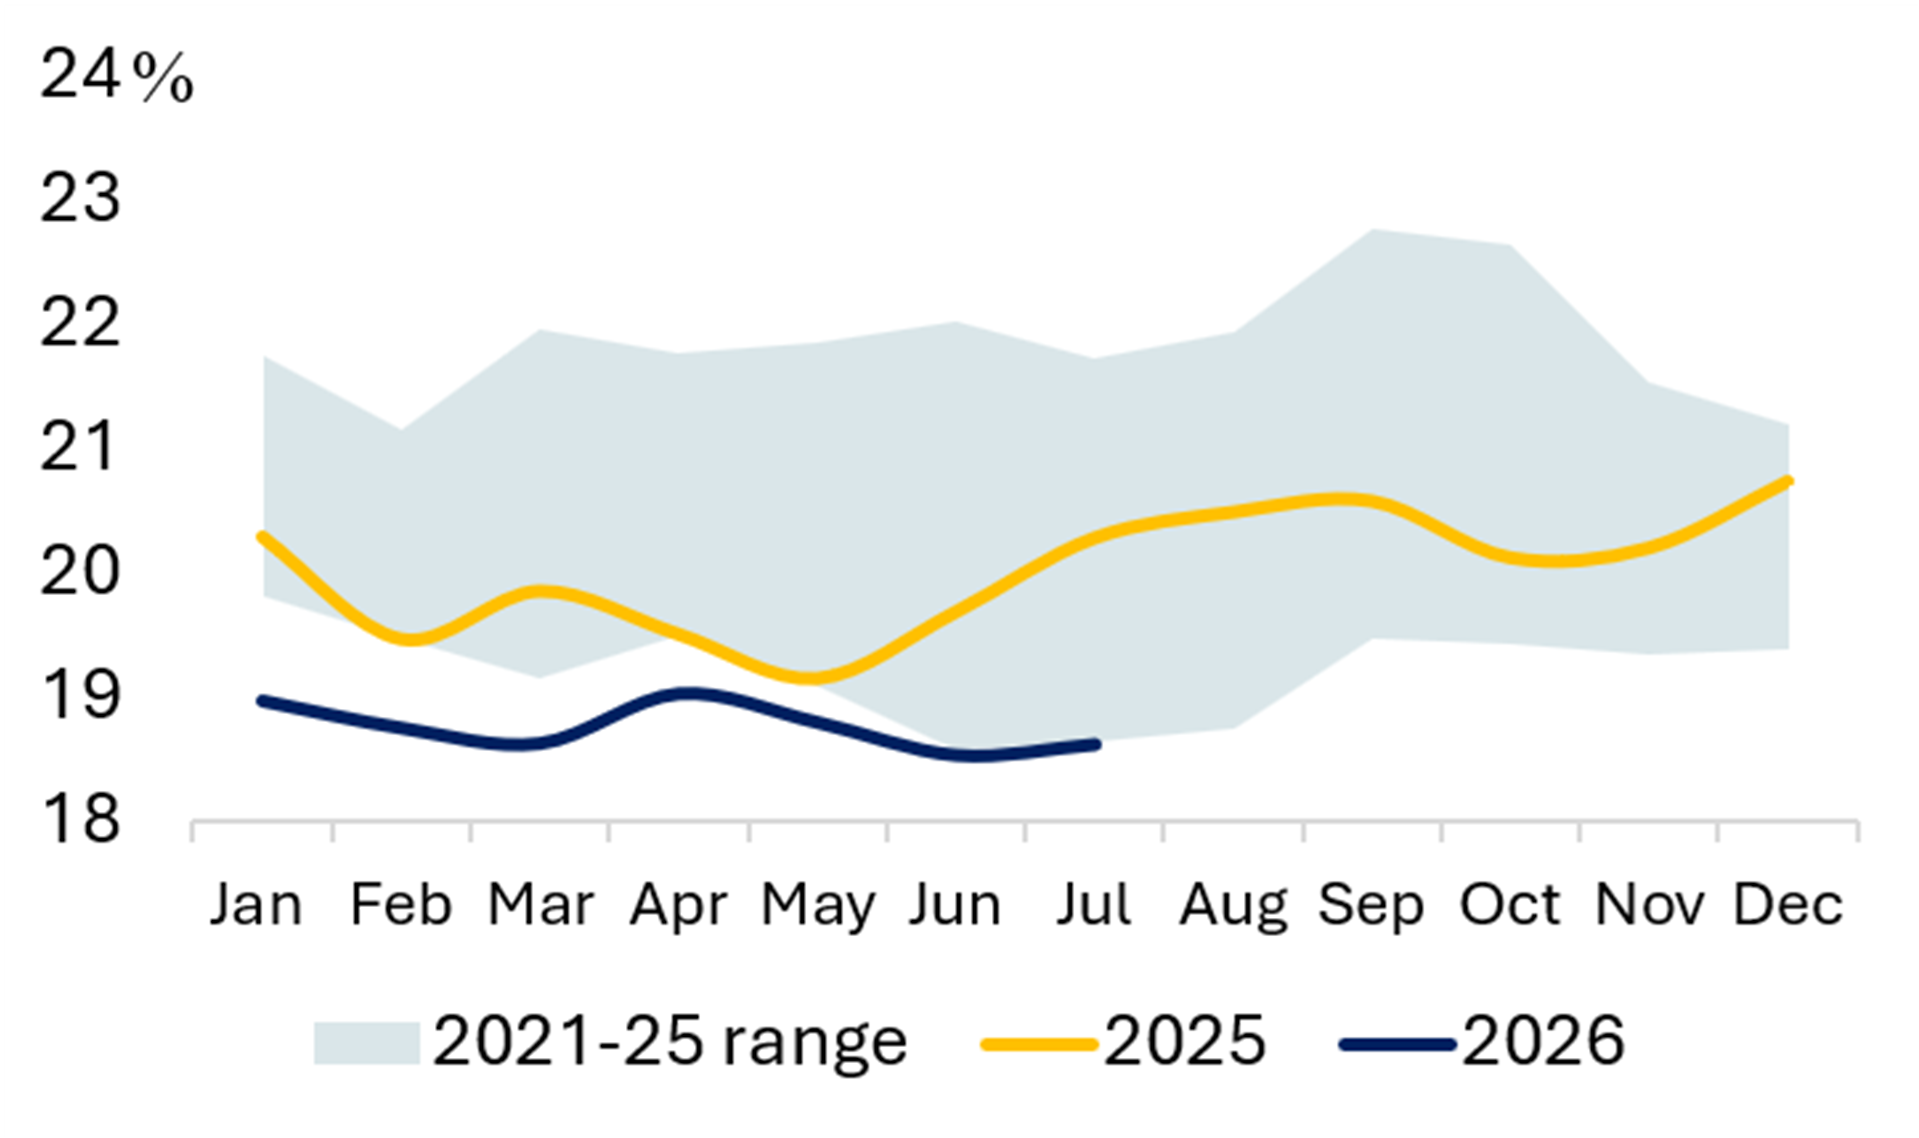
Source: EMBER
USA
Exhibit 22 USA: Biggest Source of Electricity in each State
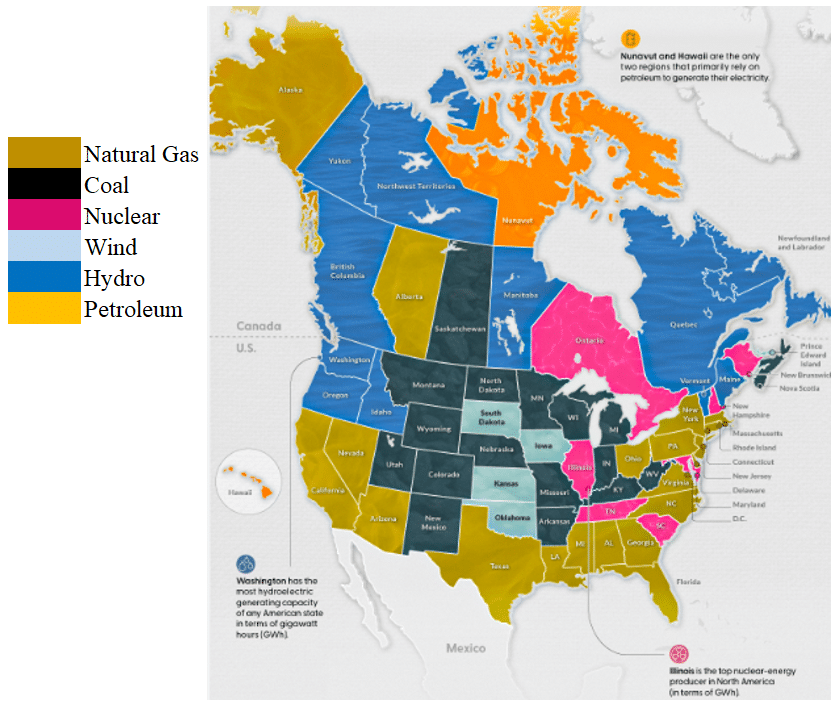
Exhibit 23 Power Generation Exhibit 24 Share of Gas (%) 
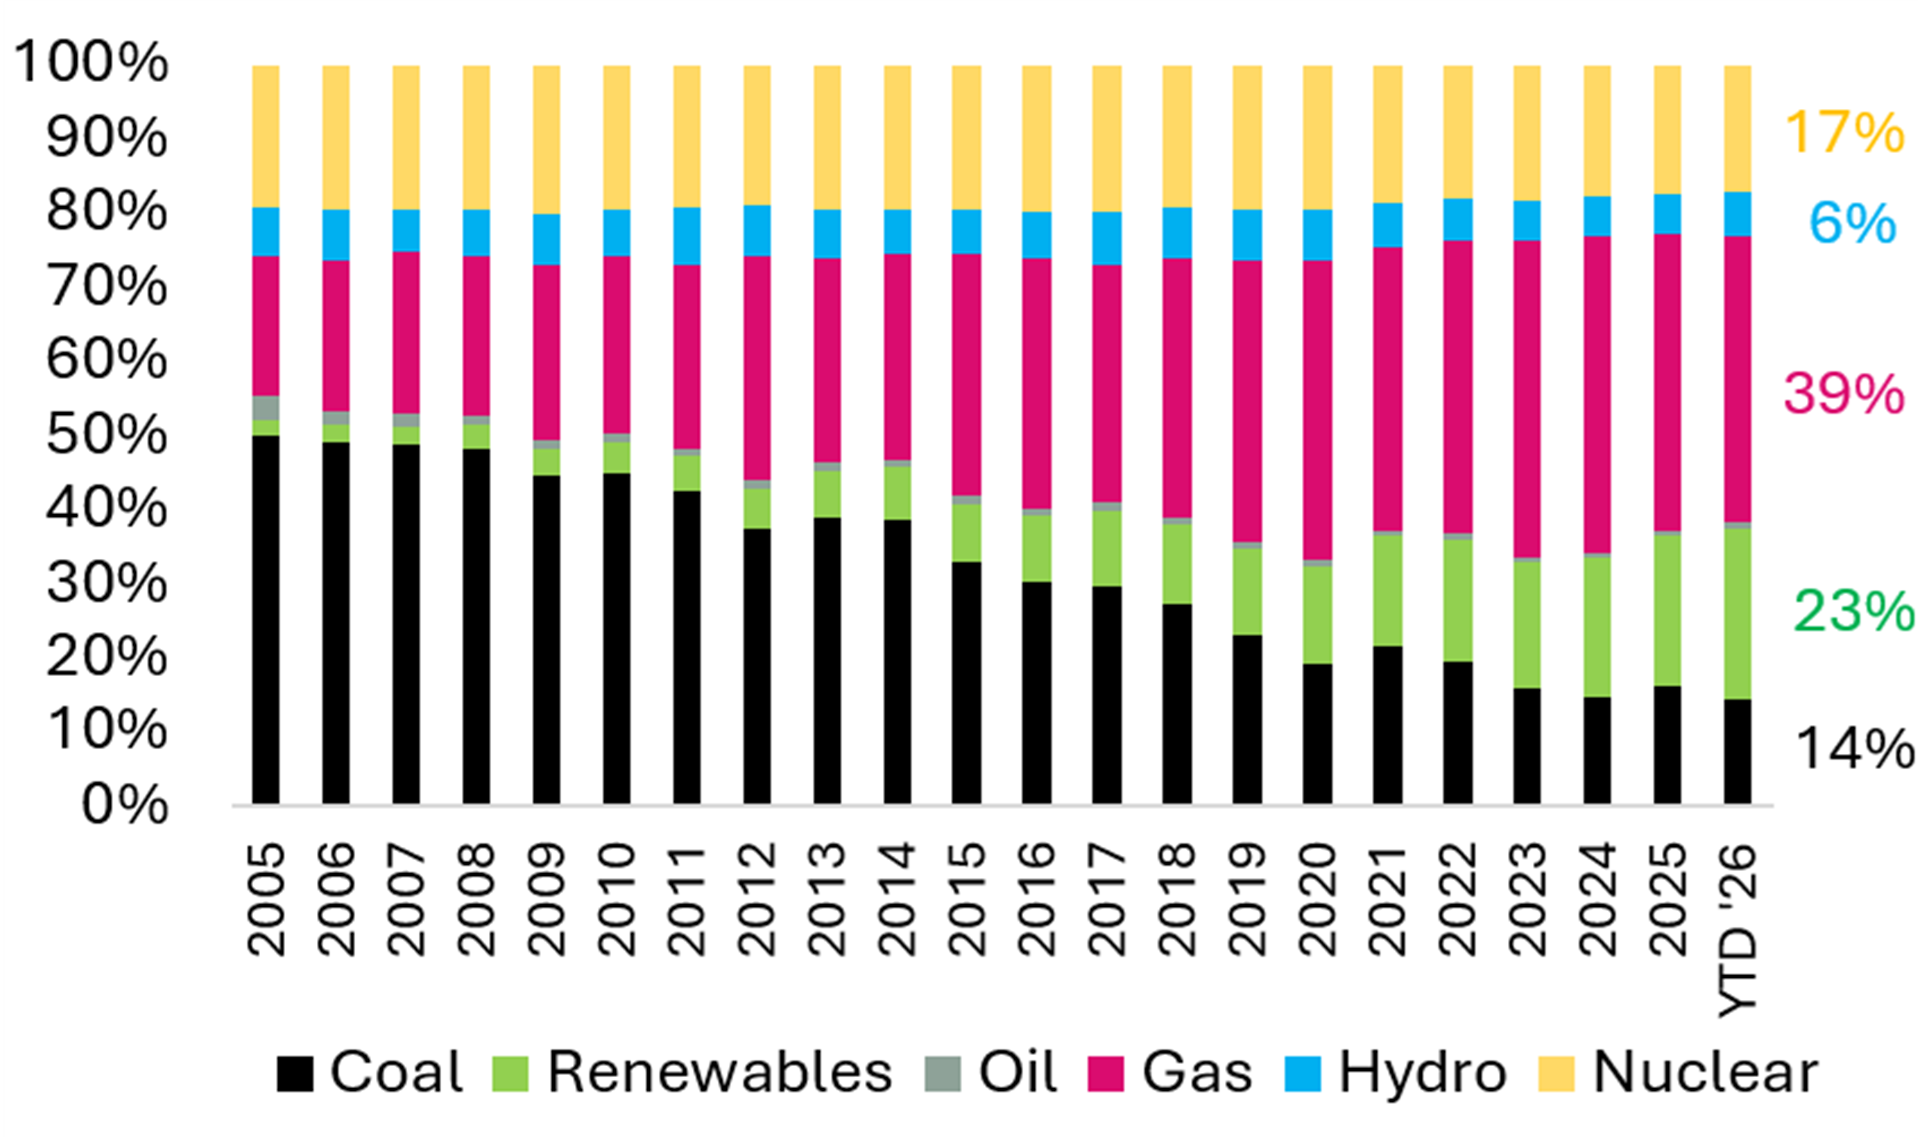
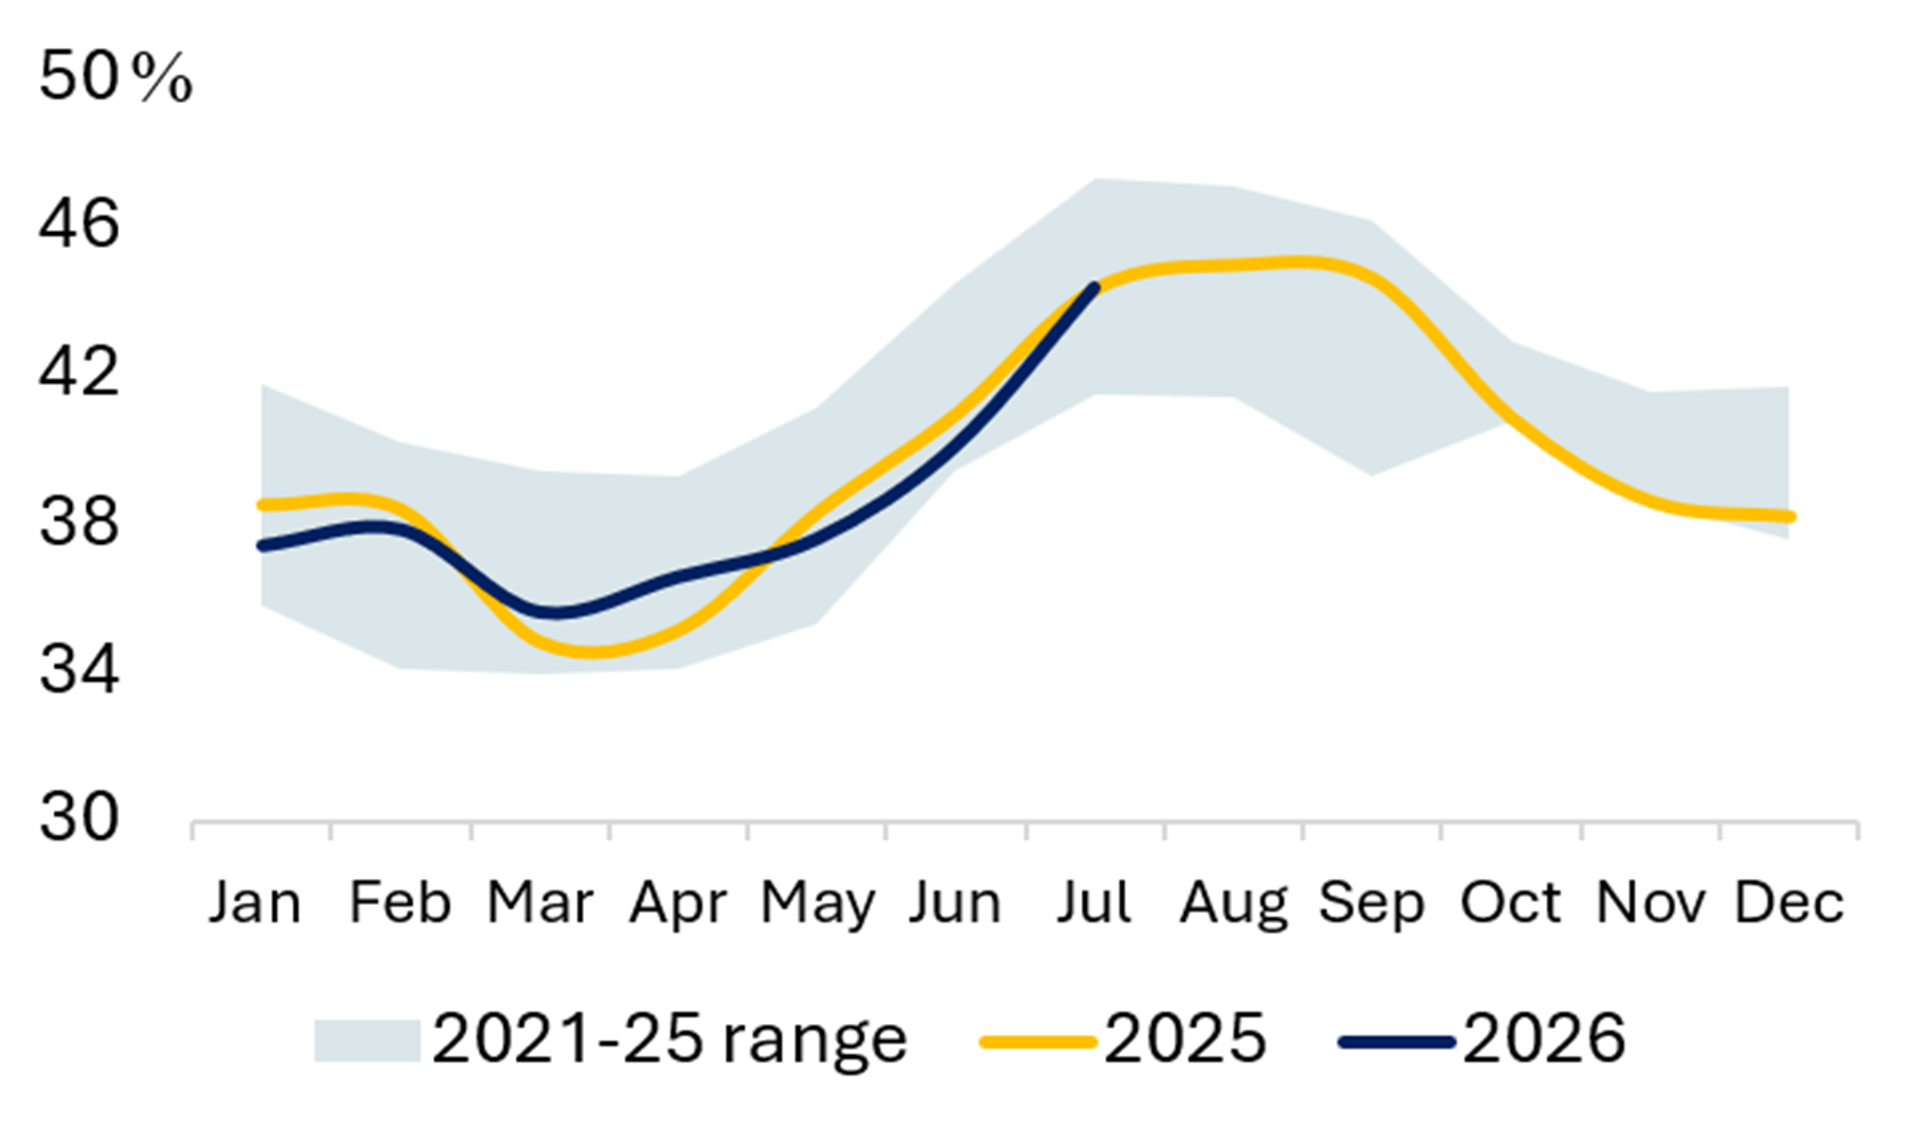

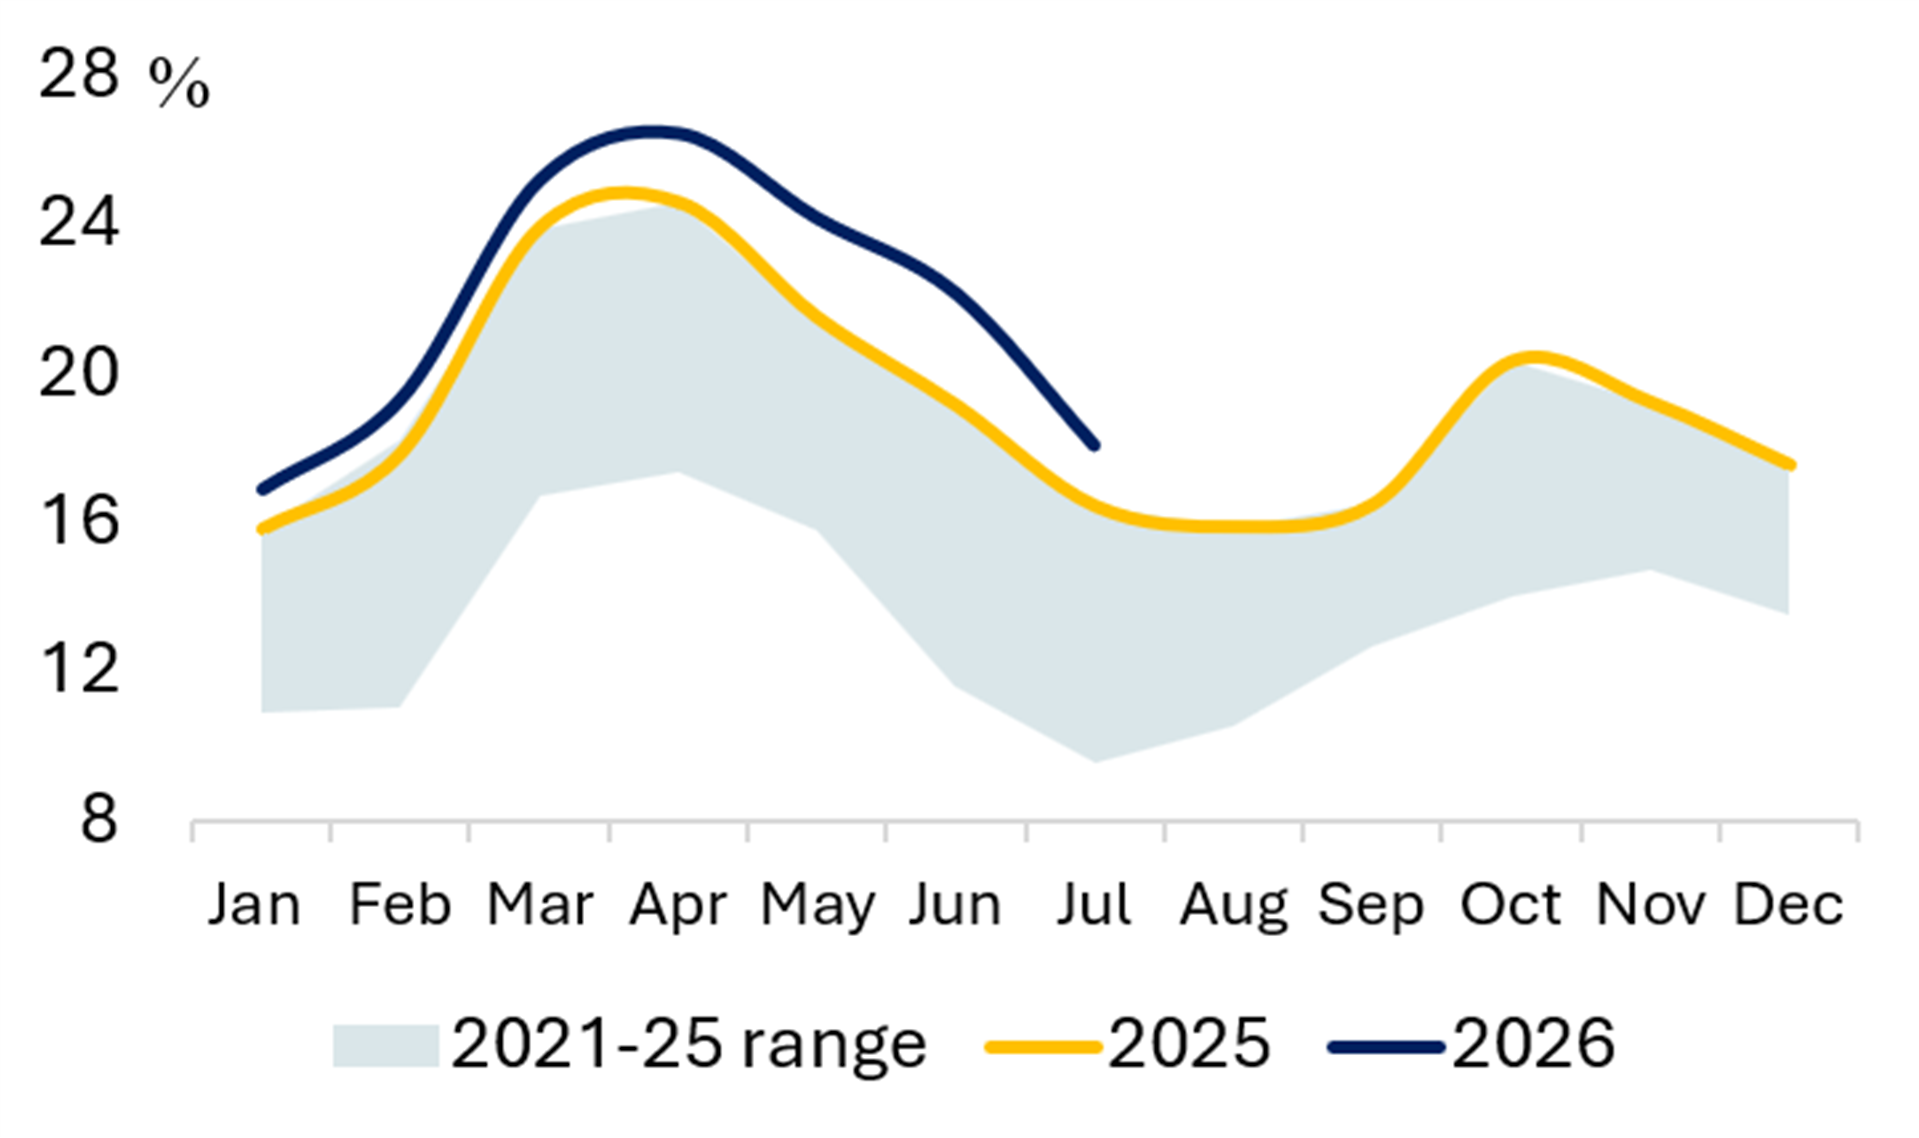
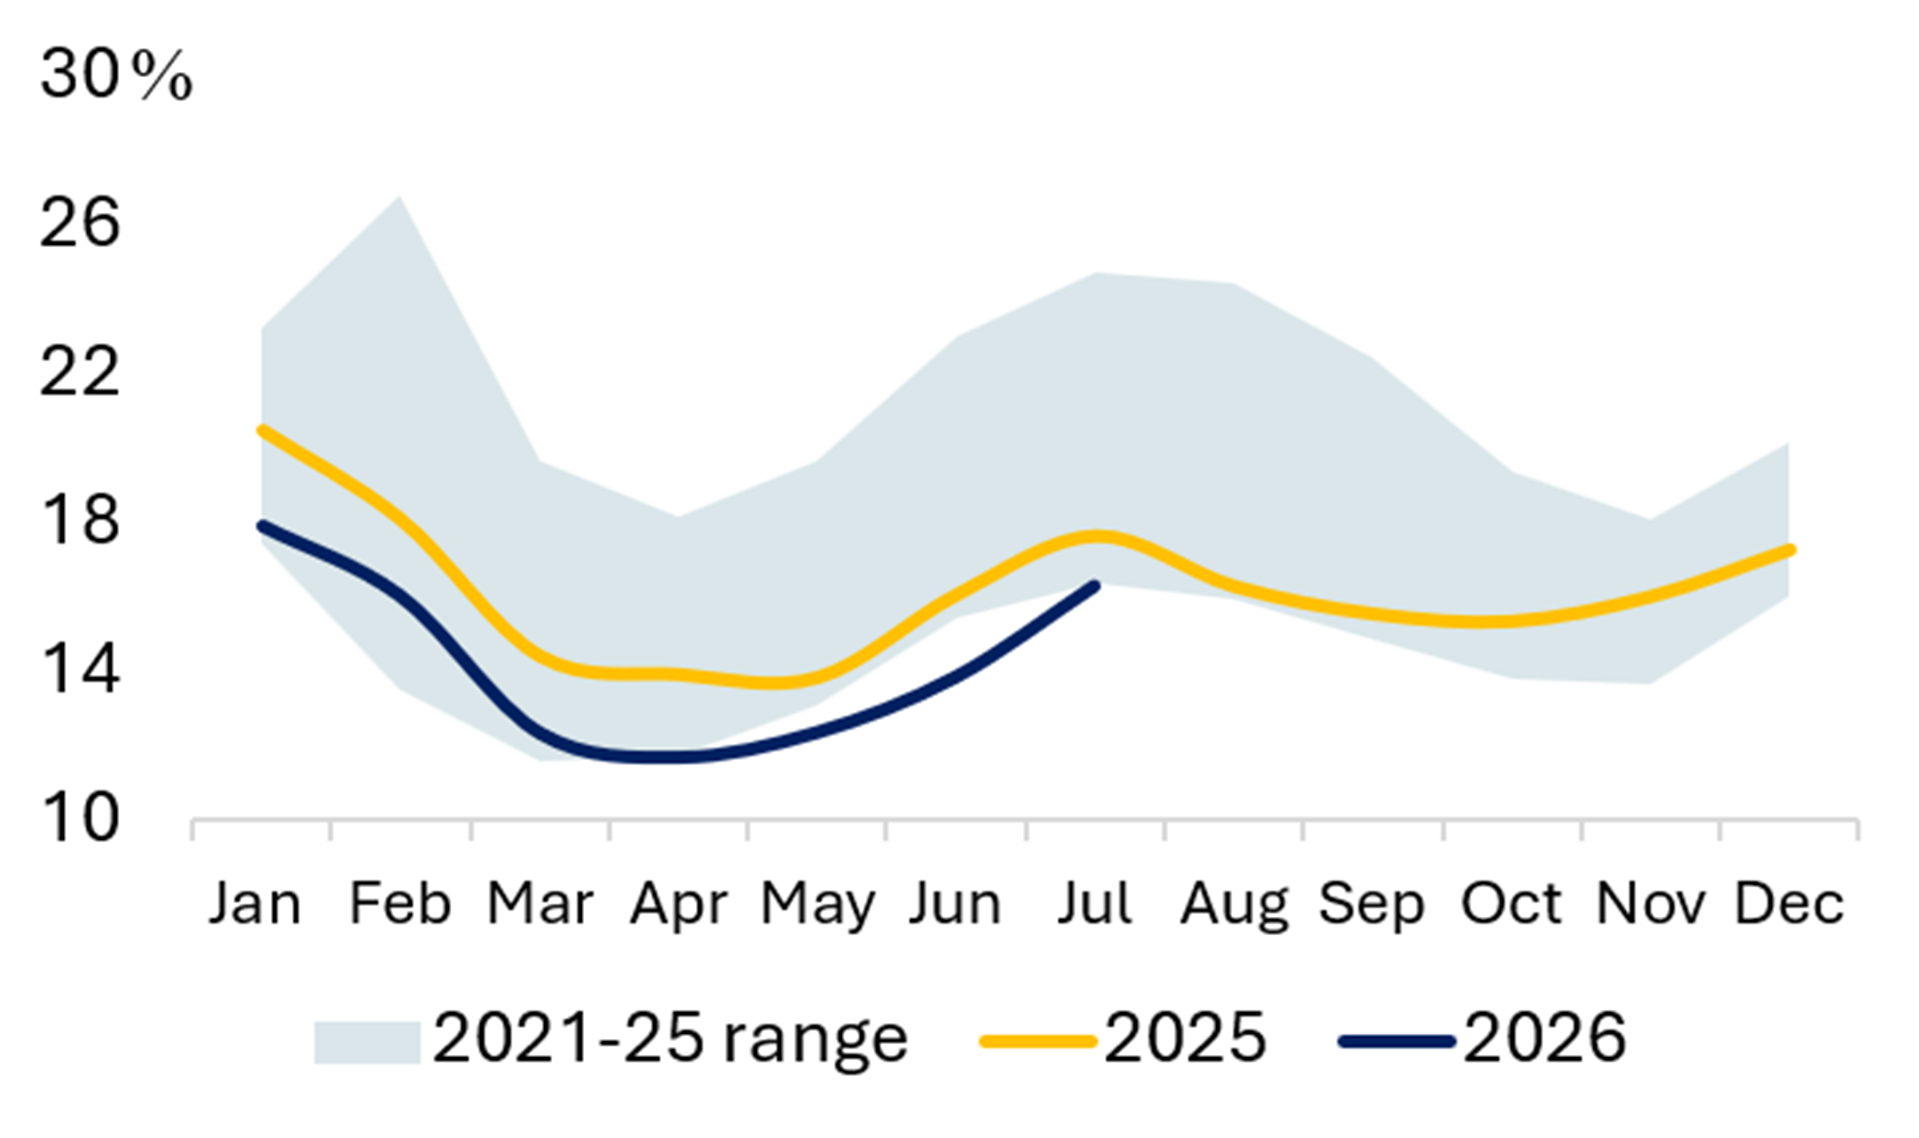
Exhibit 25 Share of Wind & Solar (%) Exhibit 26 Share of Coal (%) 

Source: EMBER
TÜRKIYE
Exhibit 27 Power Generation Exhibit 28 Share of Coal (%) 

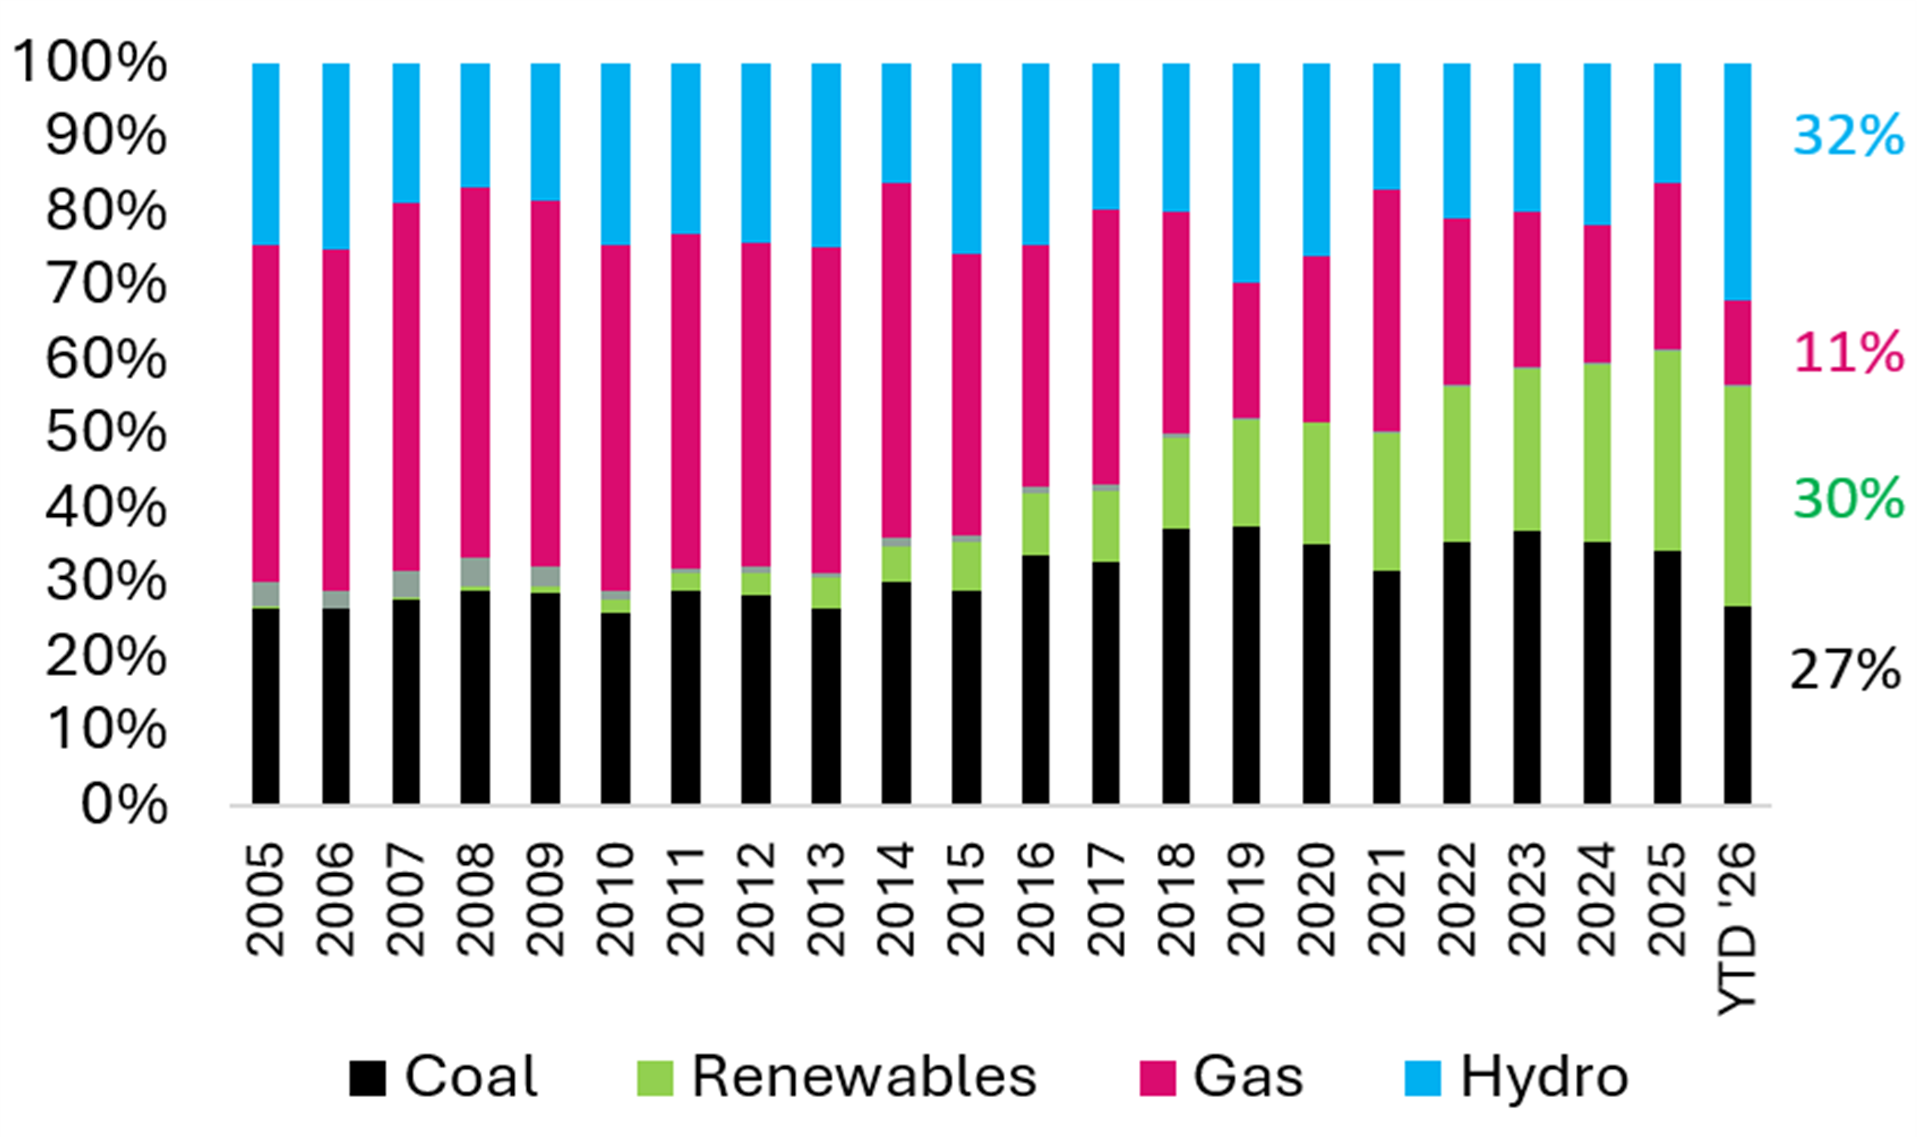
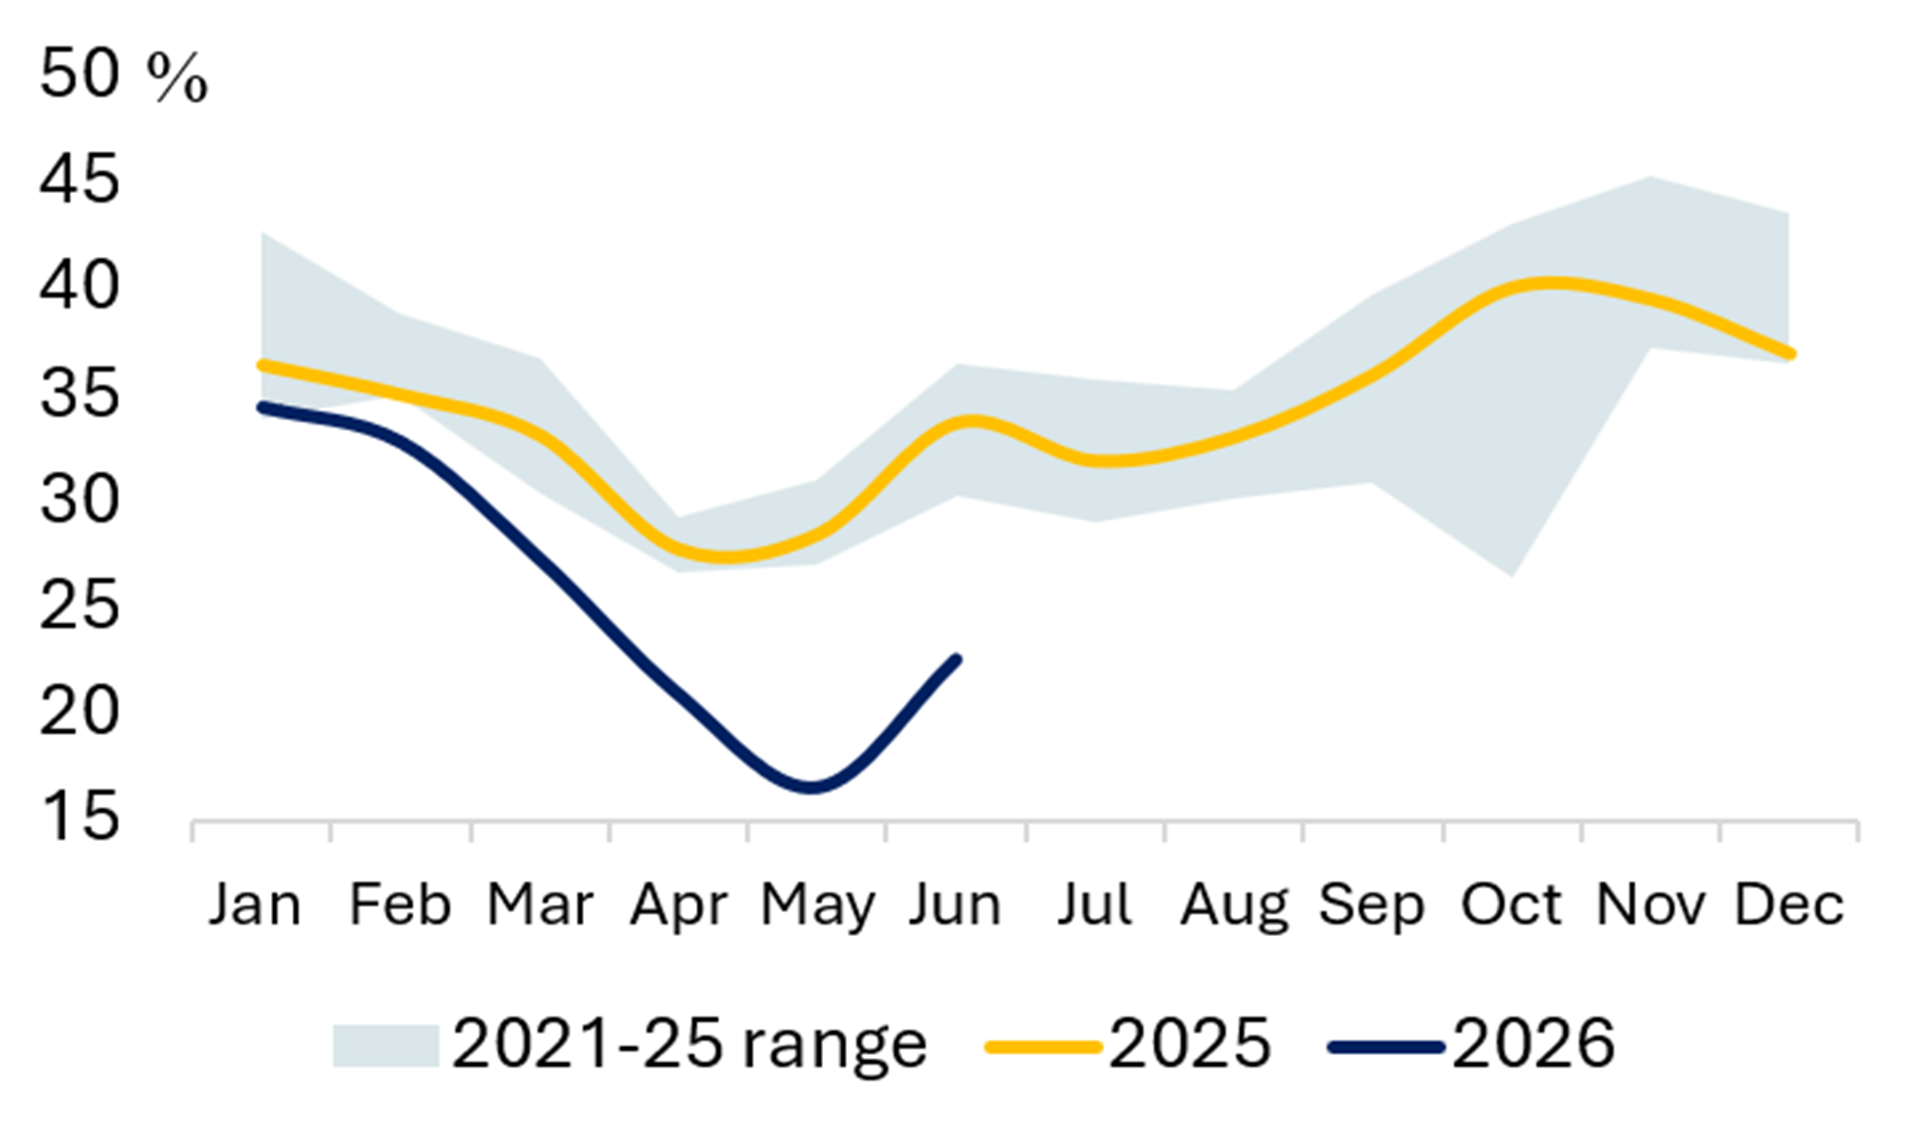
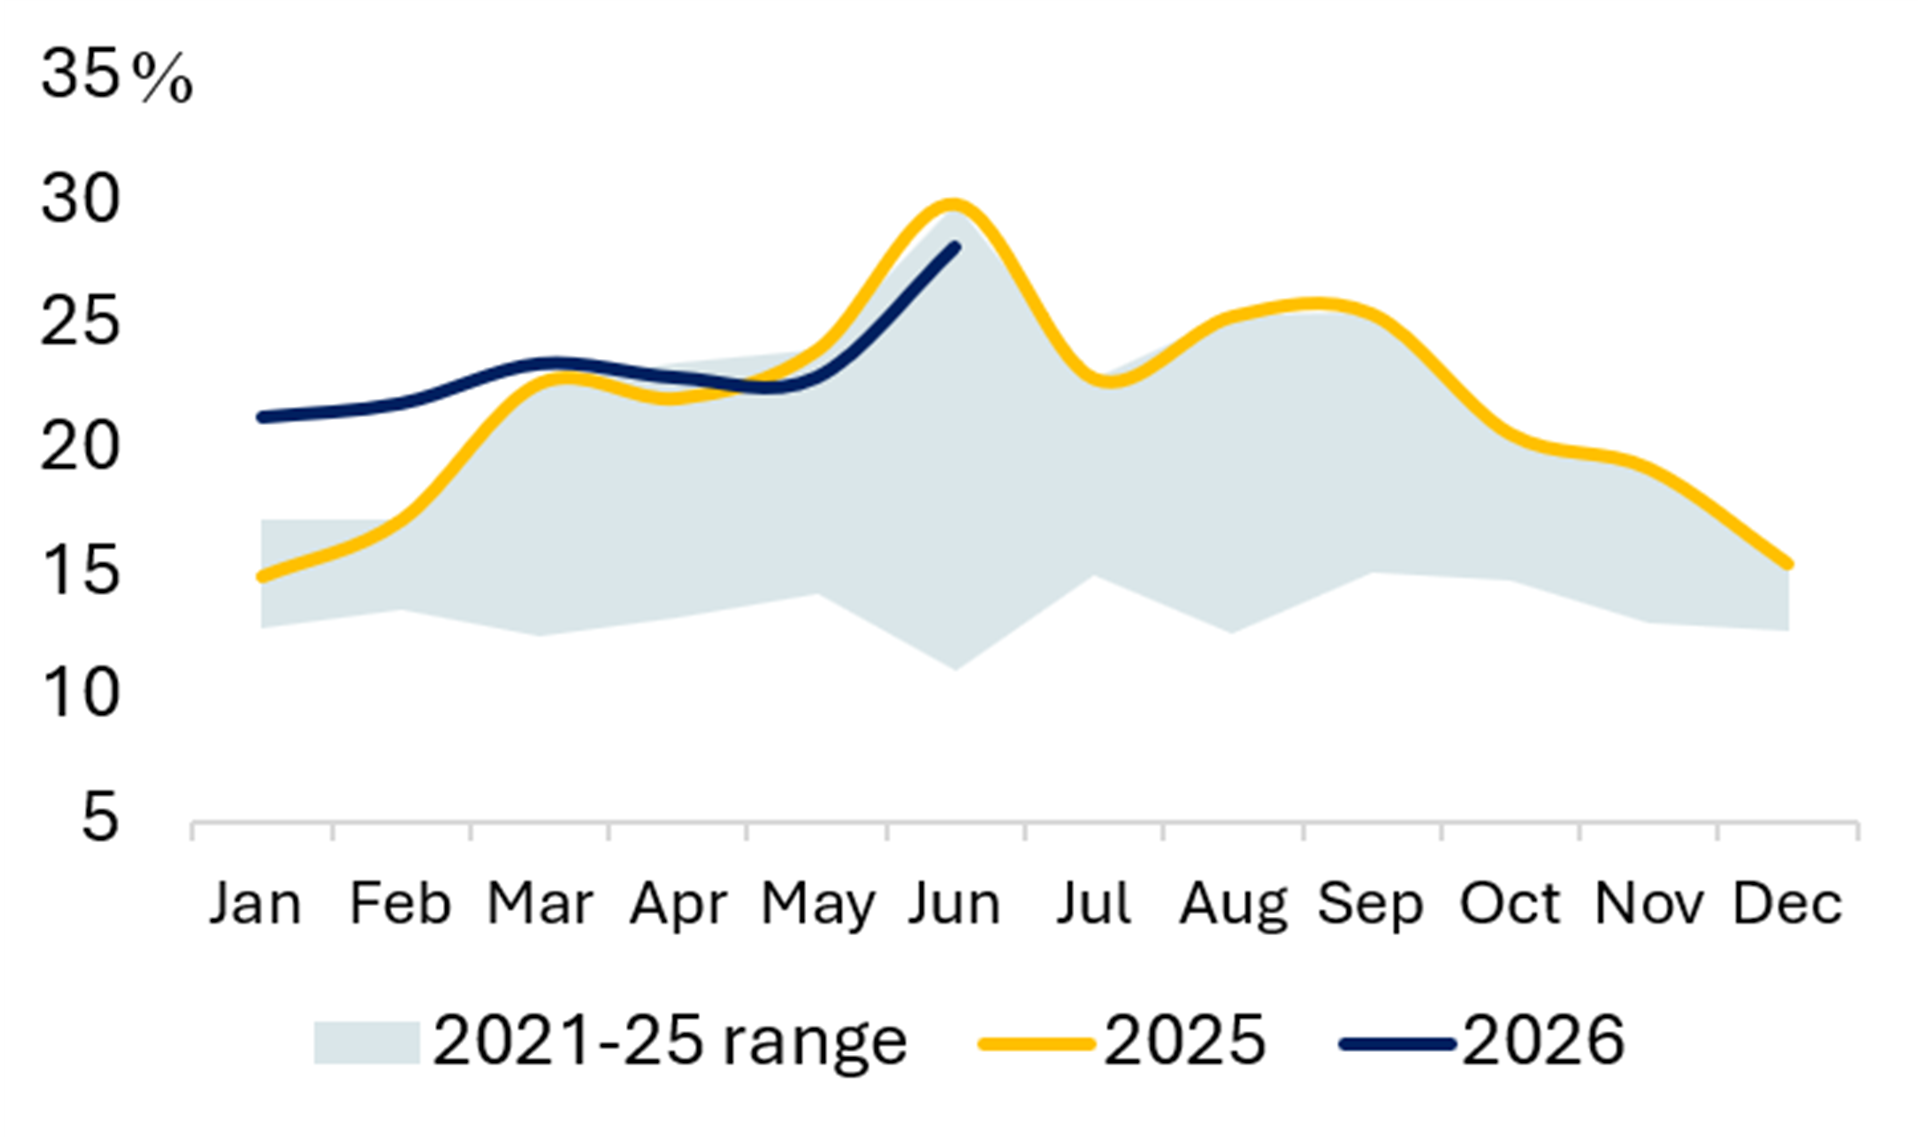
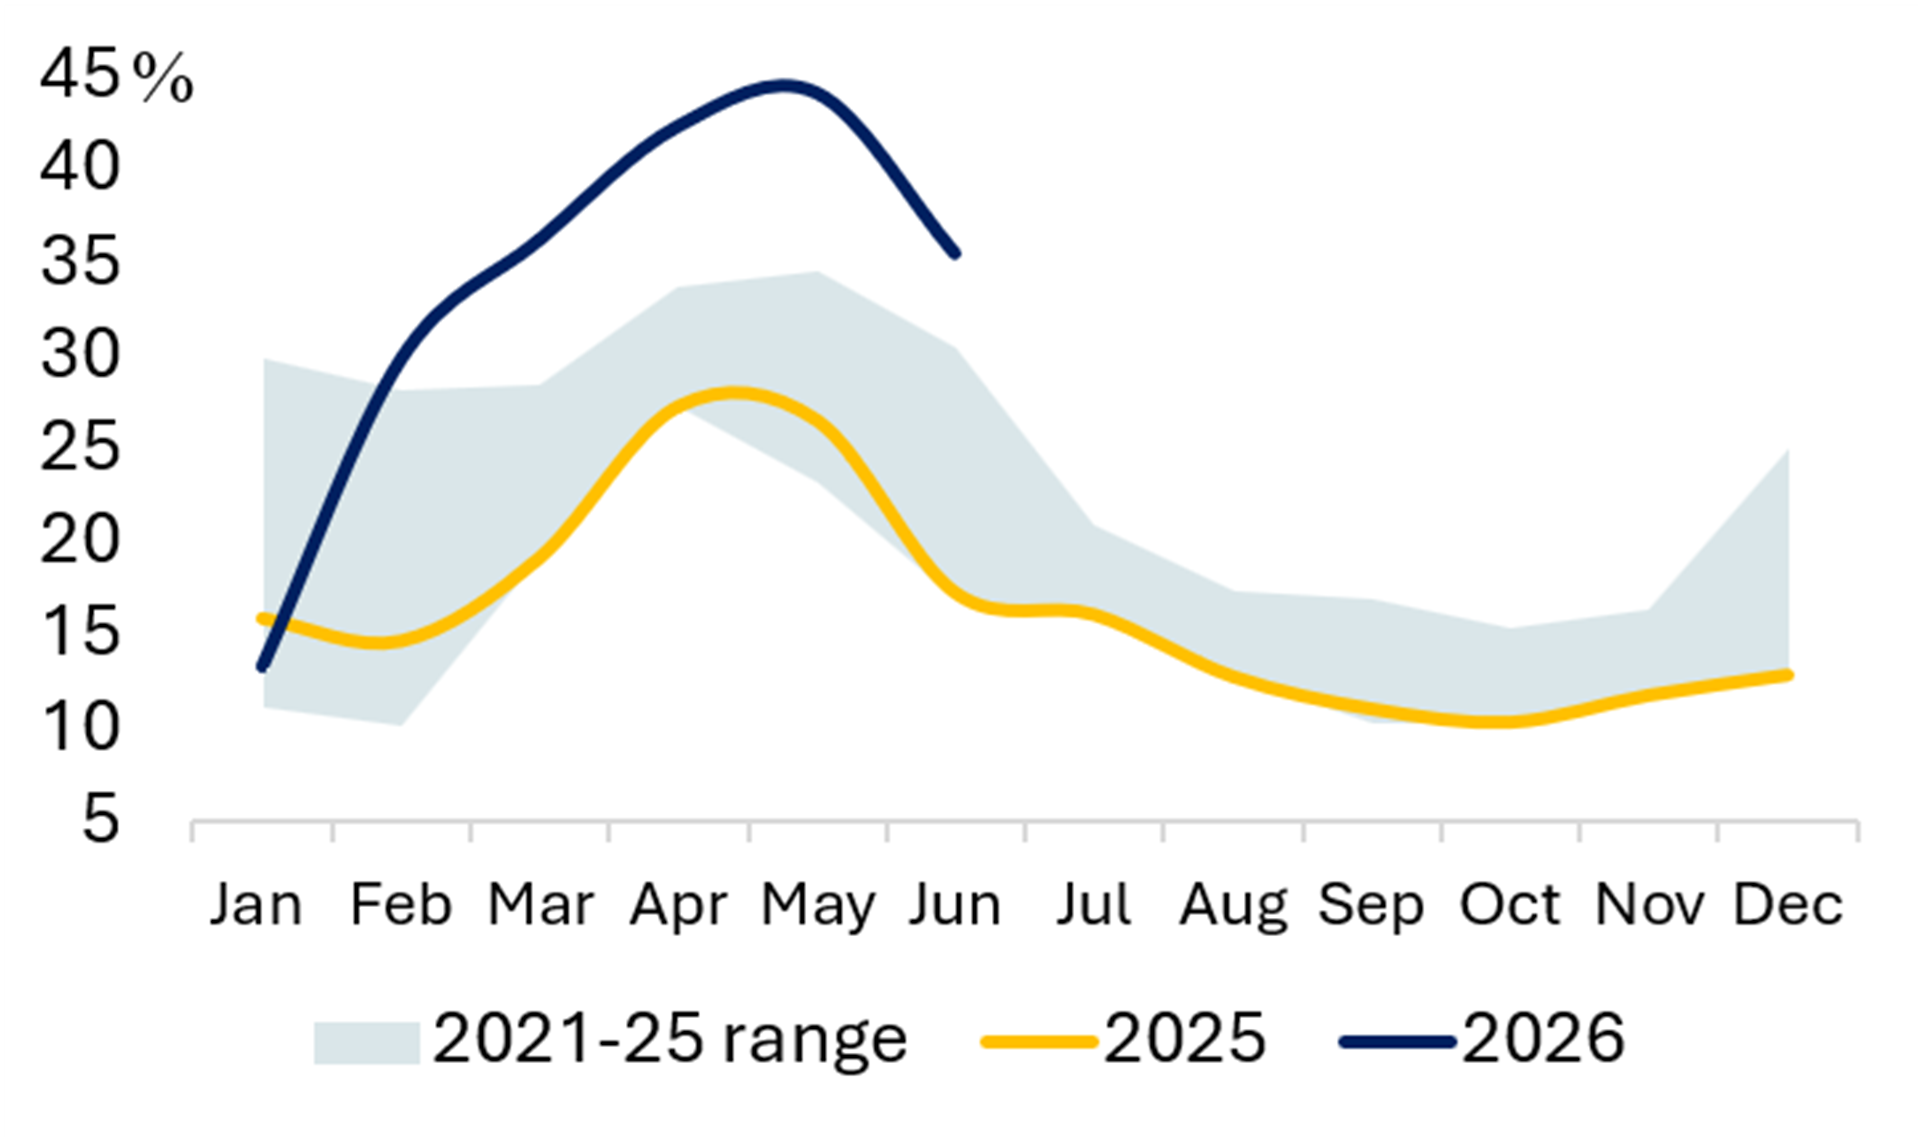
Exhibit 29 Share of Wind & Solar (%) Exhibit 30 Share of Hydro (%) 

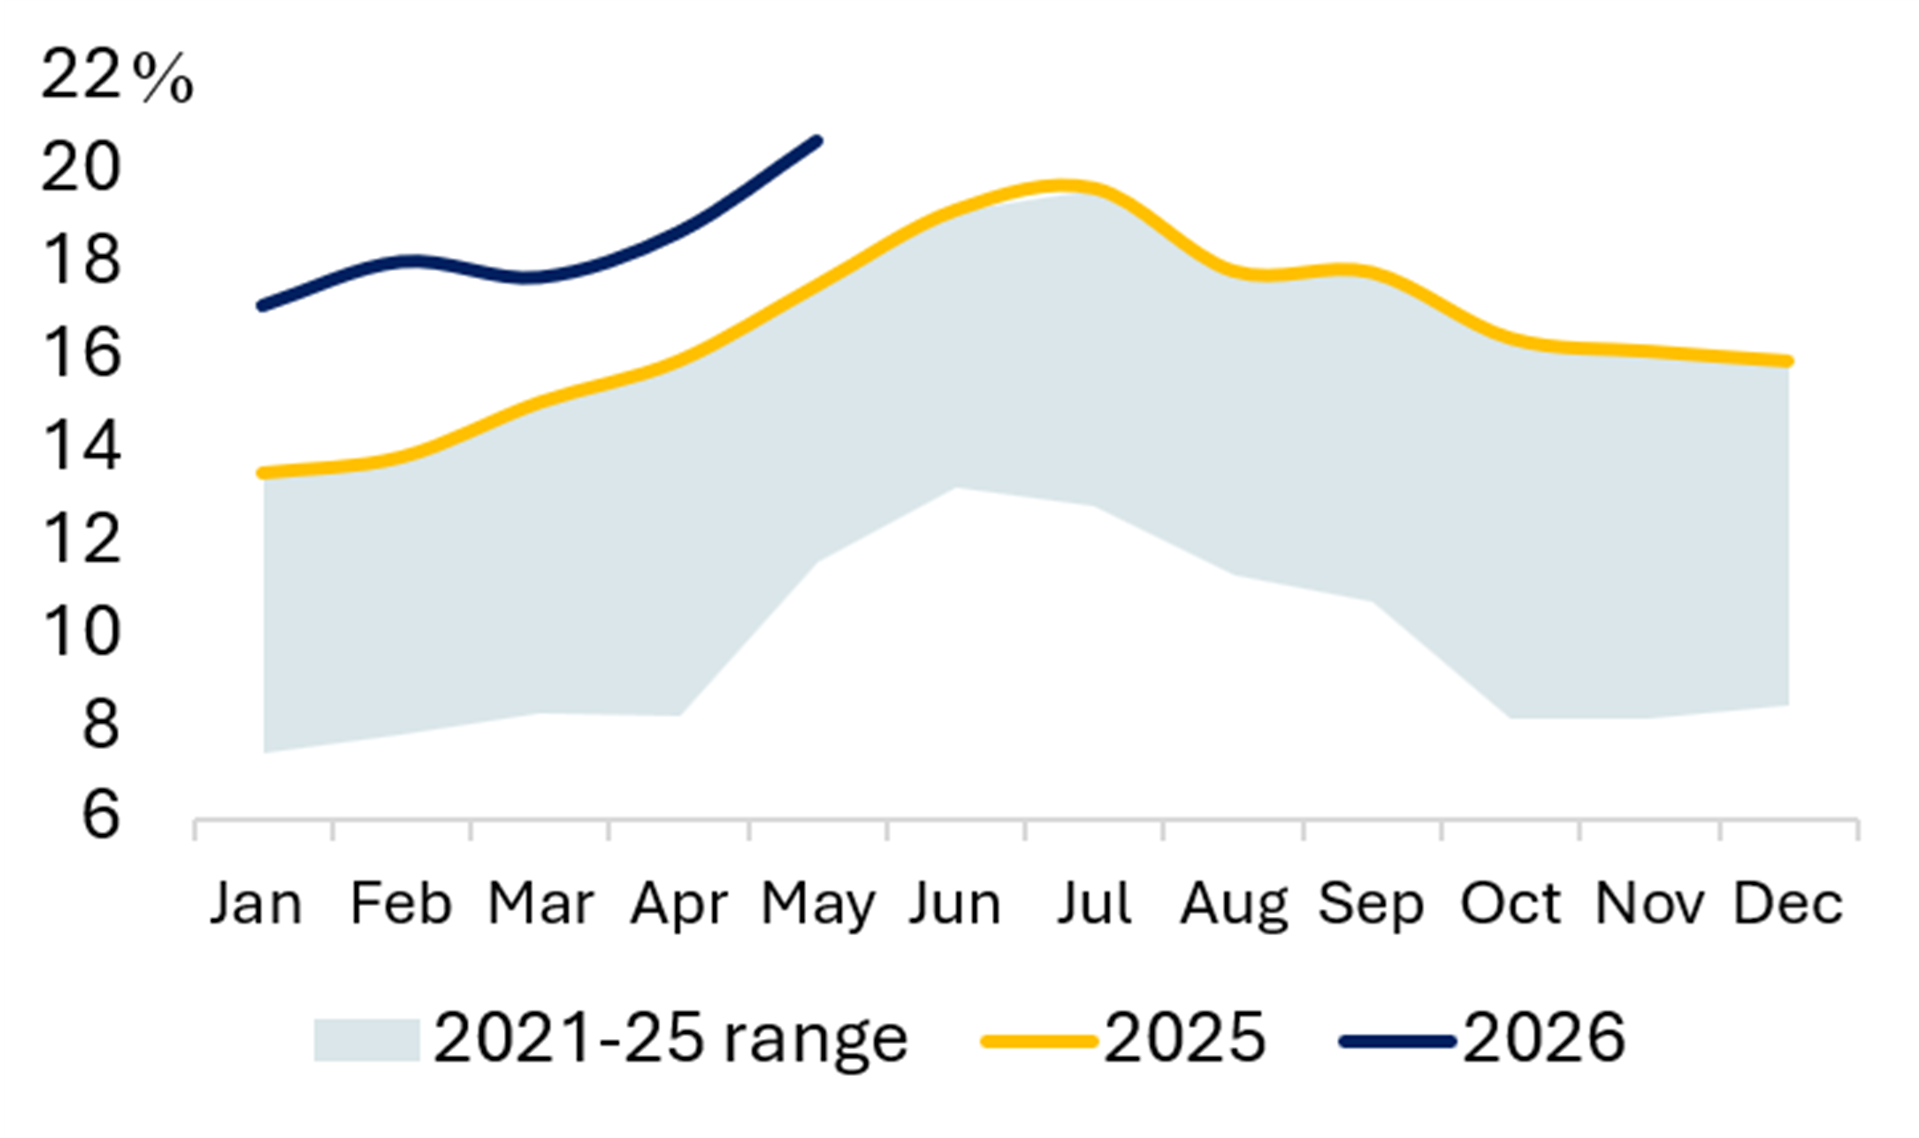
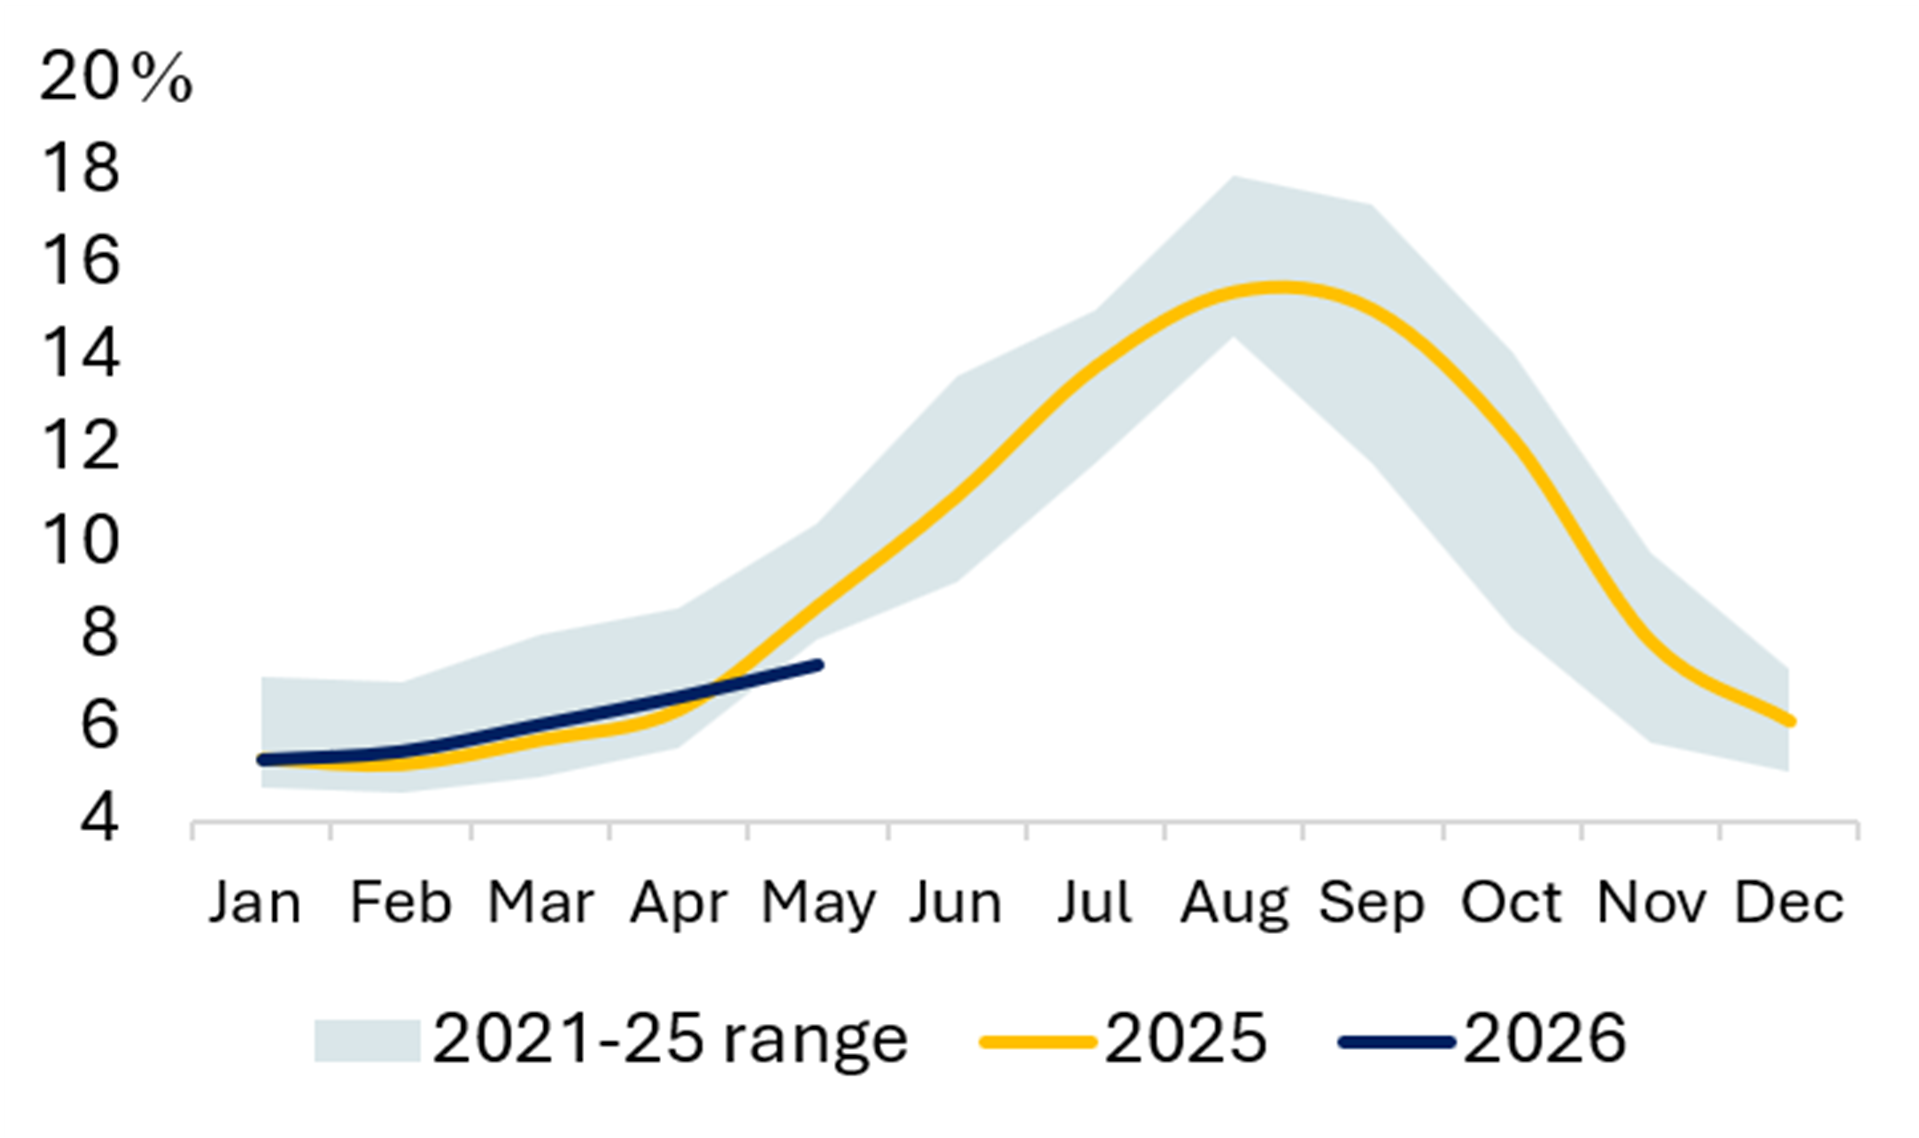
INDIA
Exhibit 31 Power Generation Exhibit 32 Share of Coal (%) 

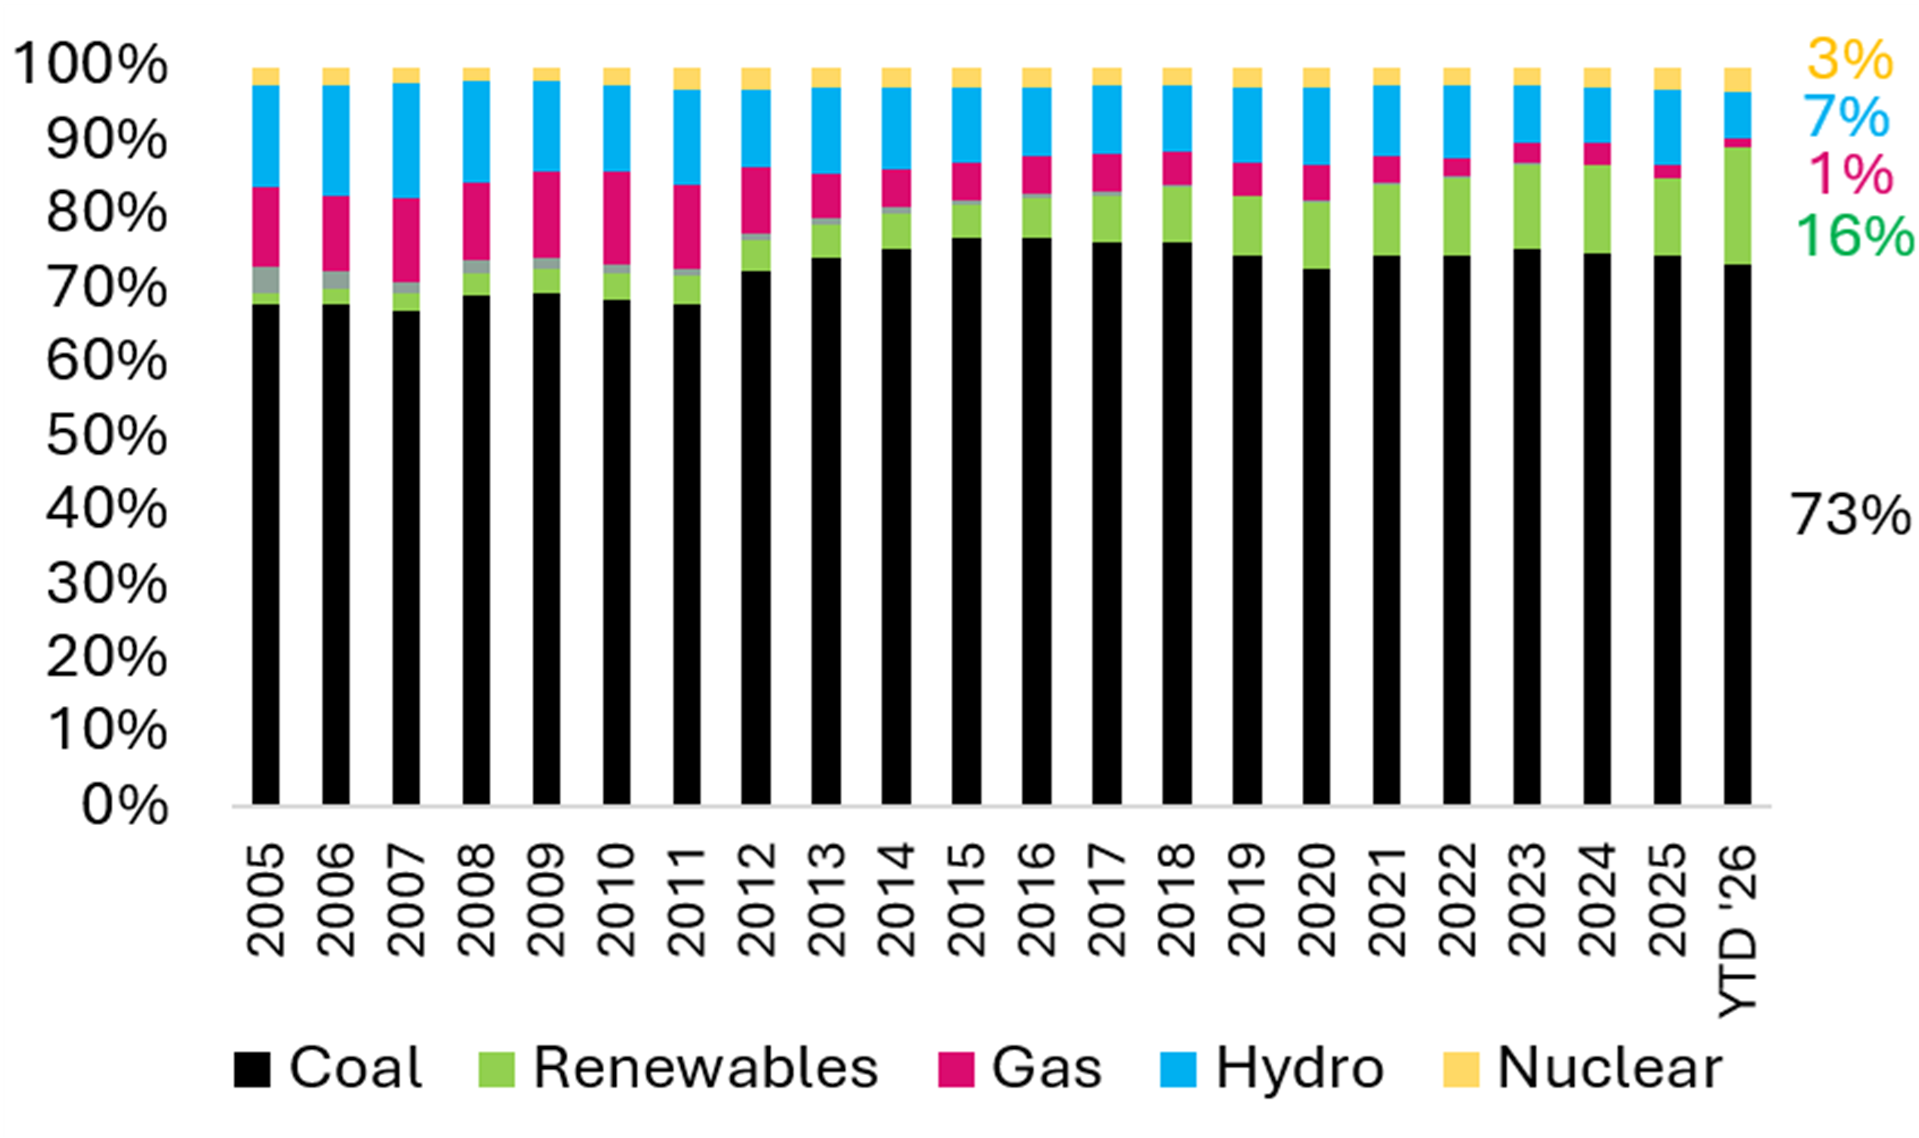
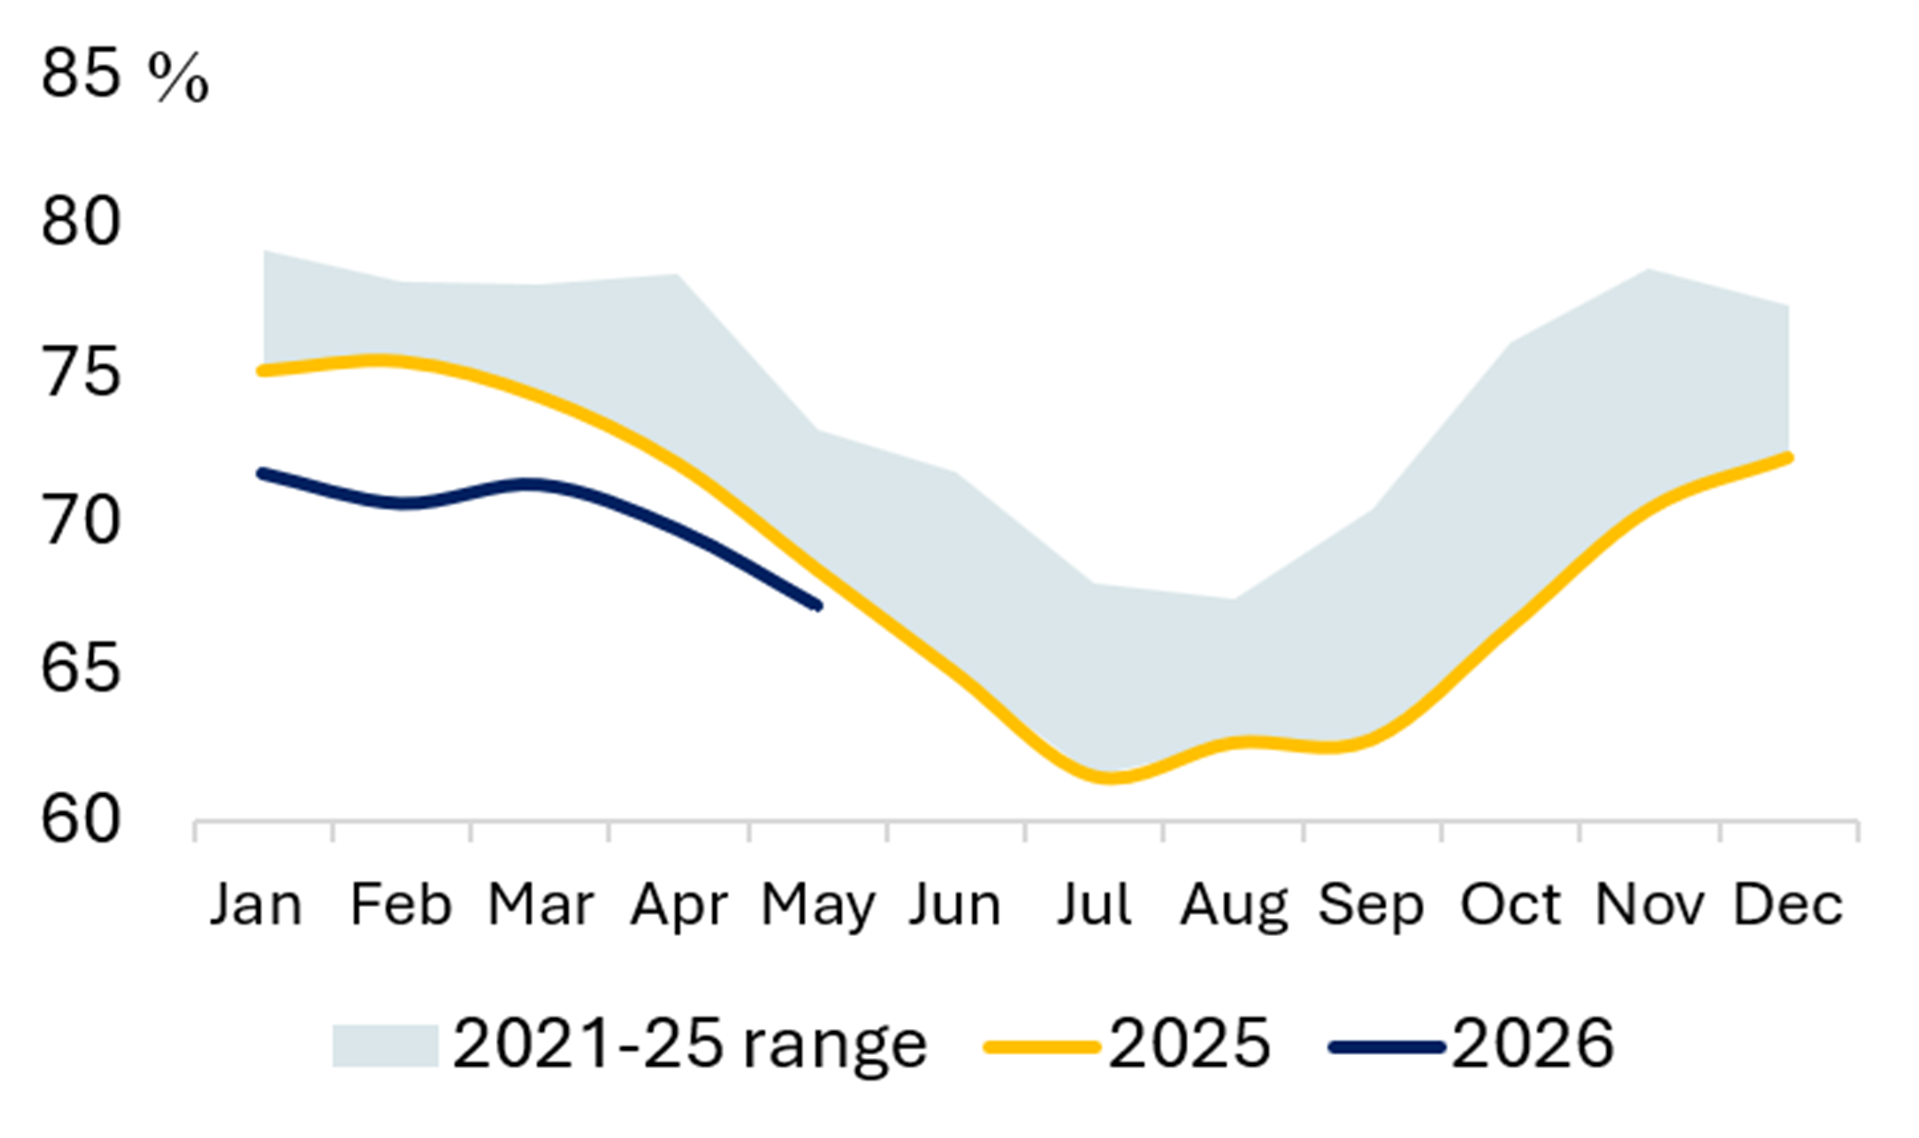
Exhibit 33 Share of Wind & Solar (%) Exhibit 34 Share of Hydro (%) 

Source: EMBER
CHINA
Exhibit 35 Power Generation Exhibit 36 Share of Coal (%) 

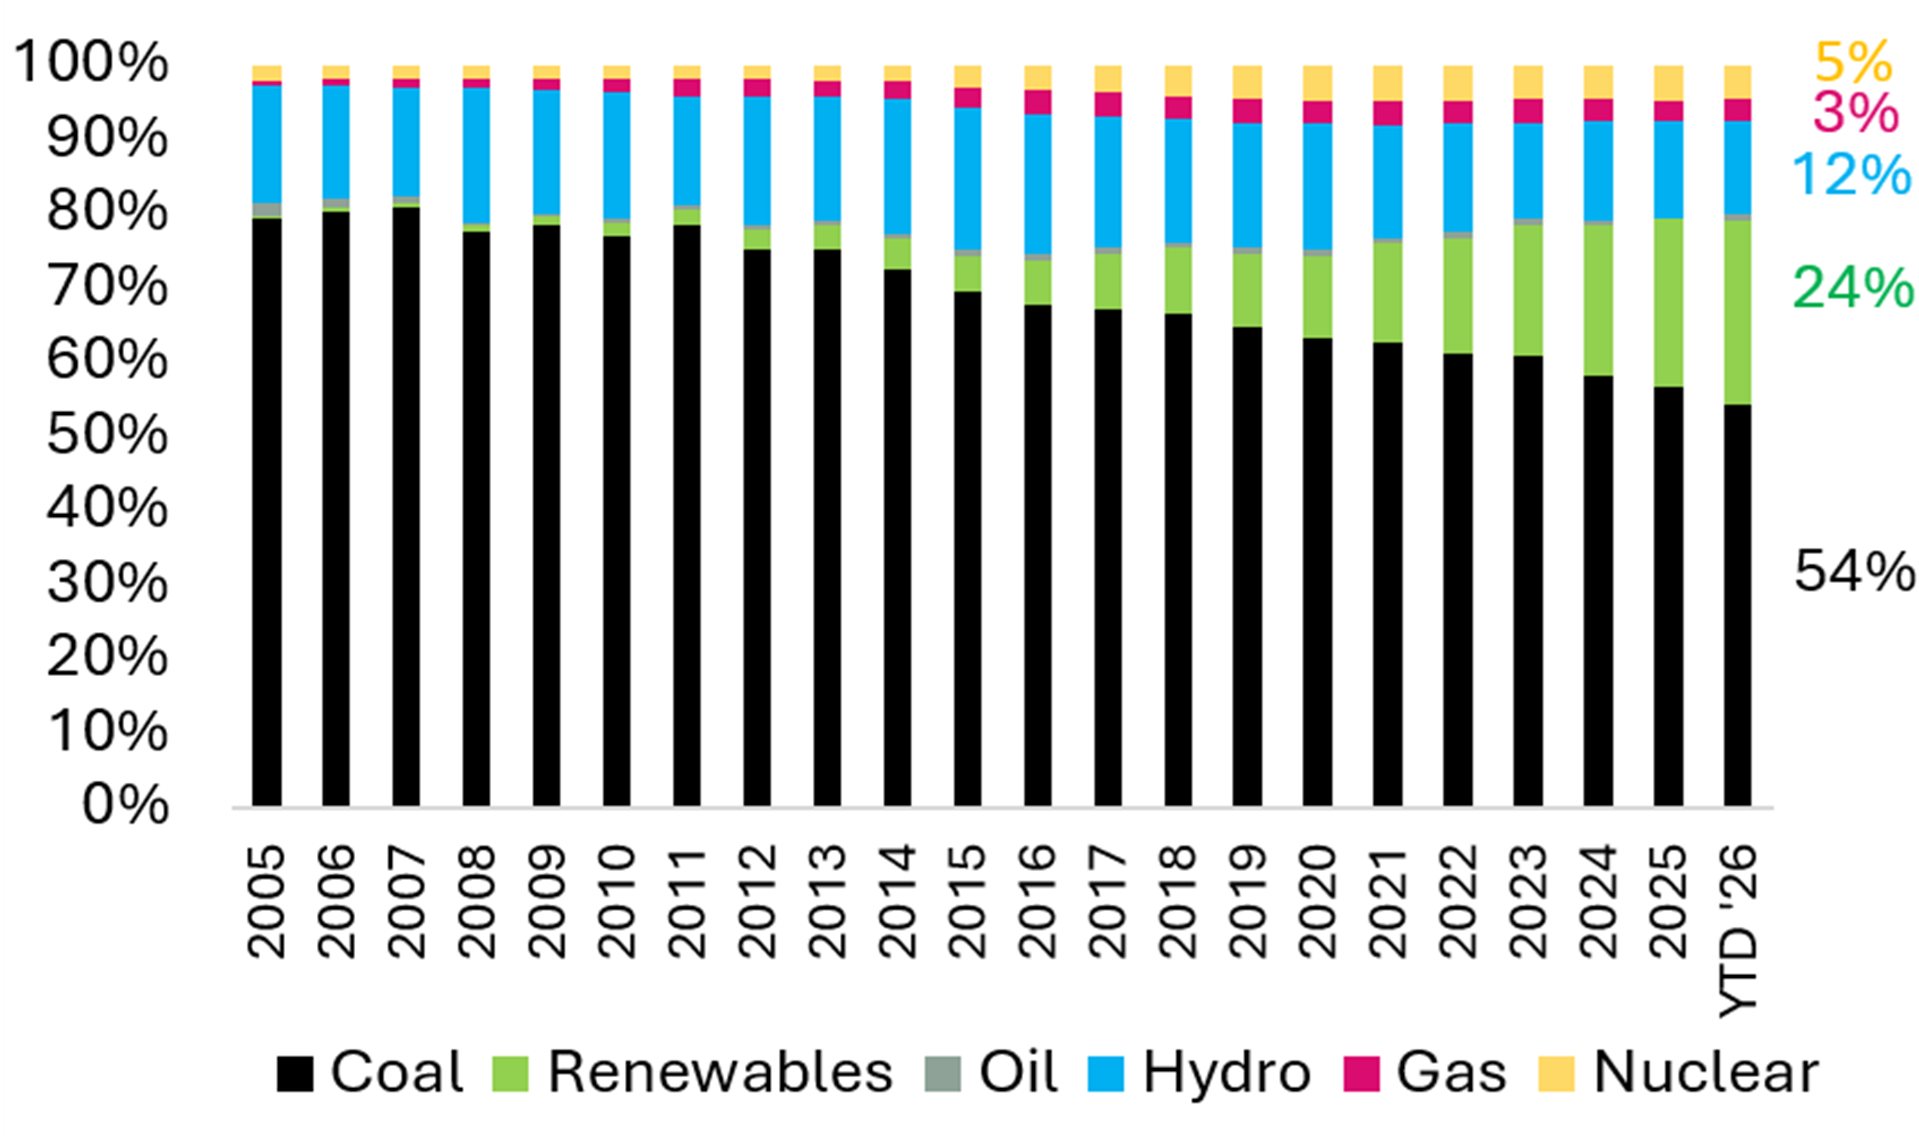
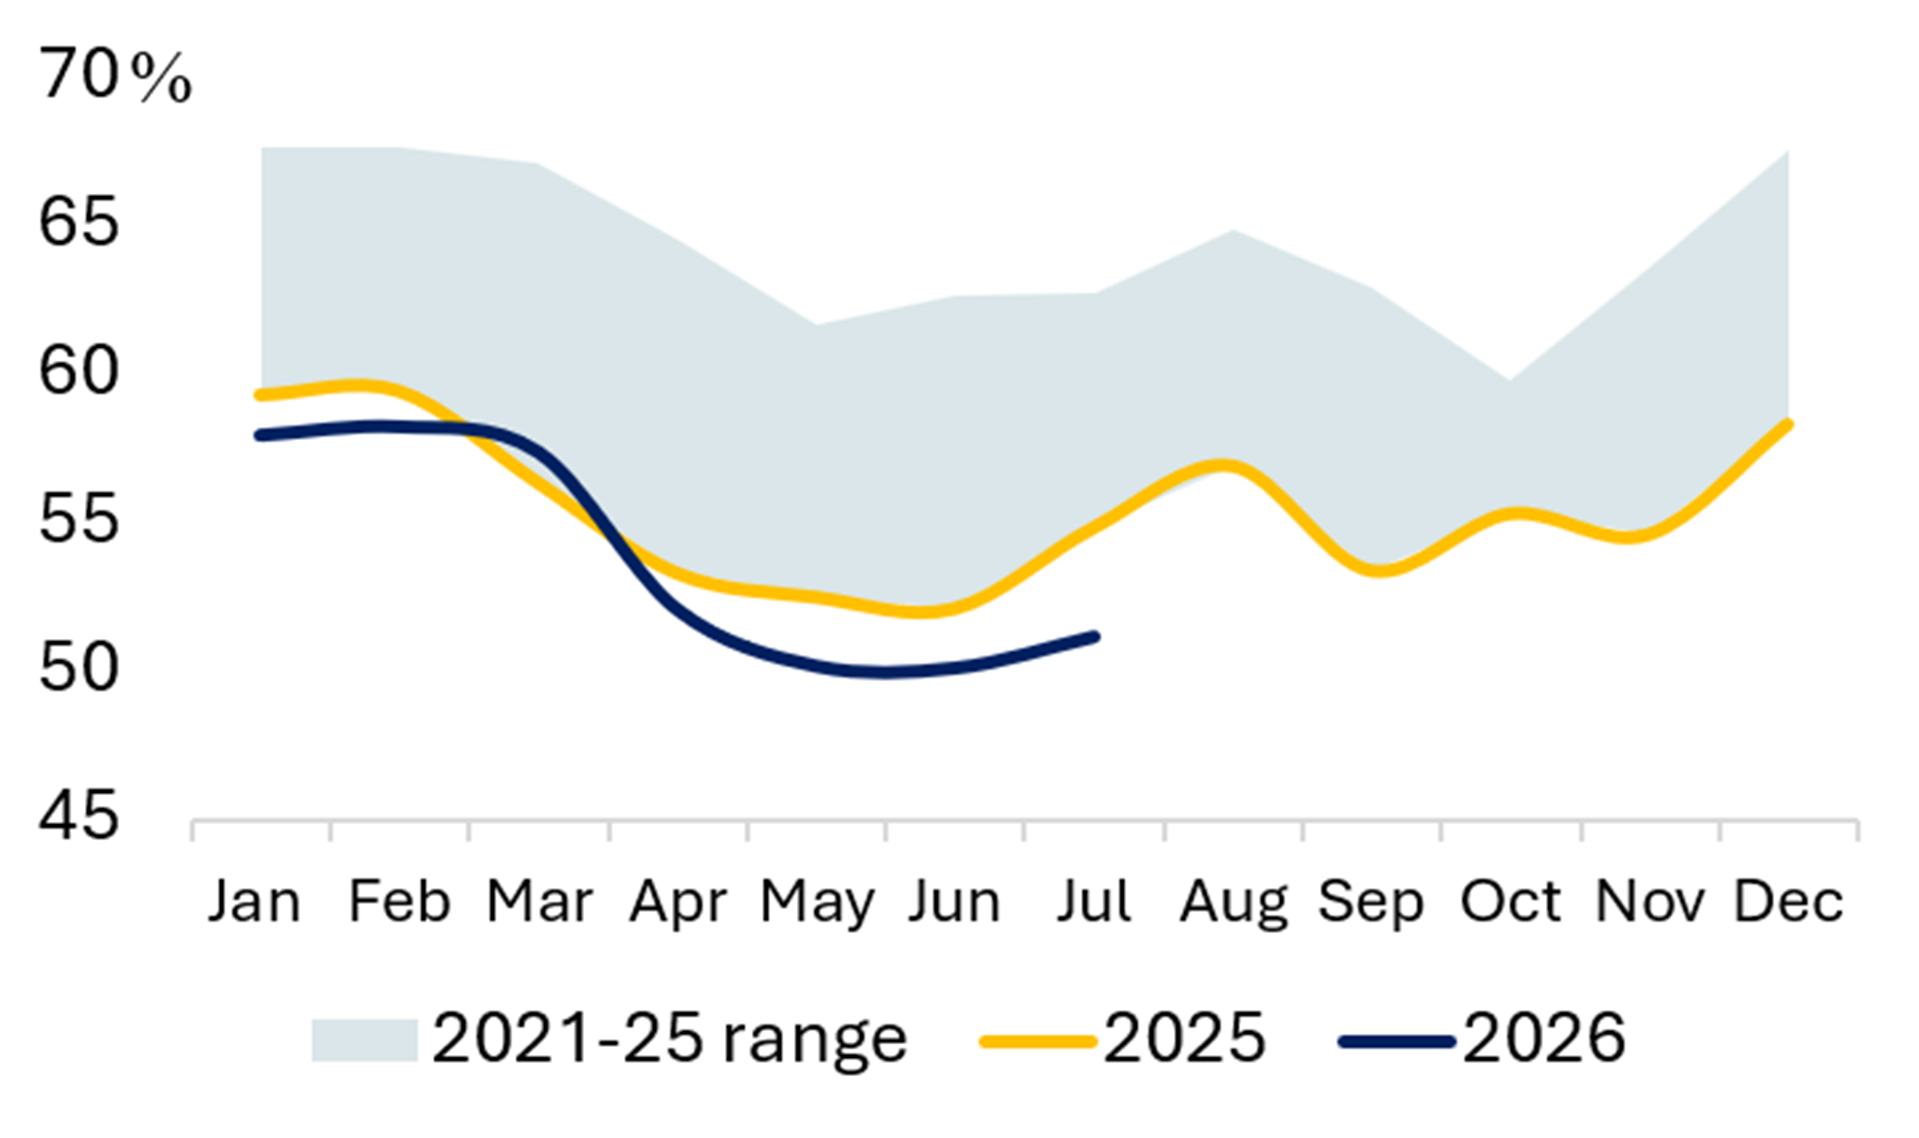
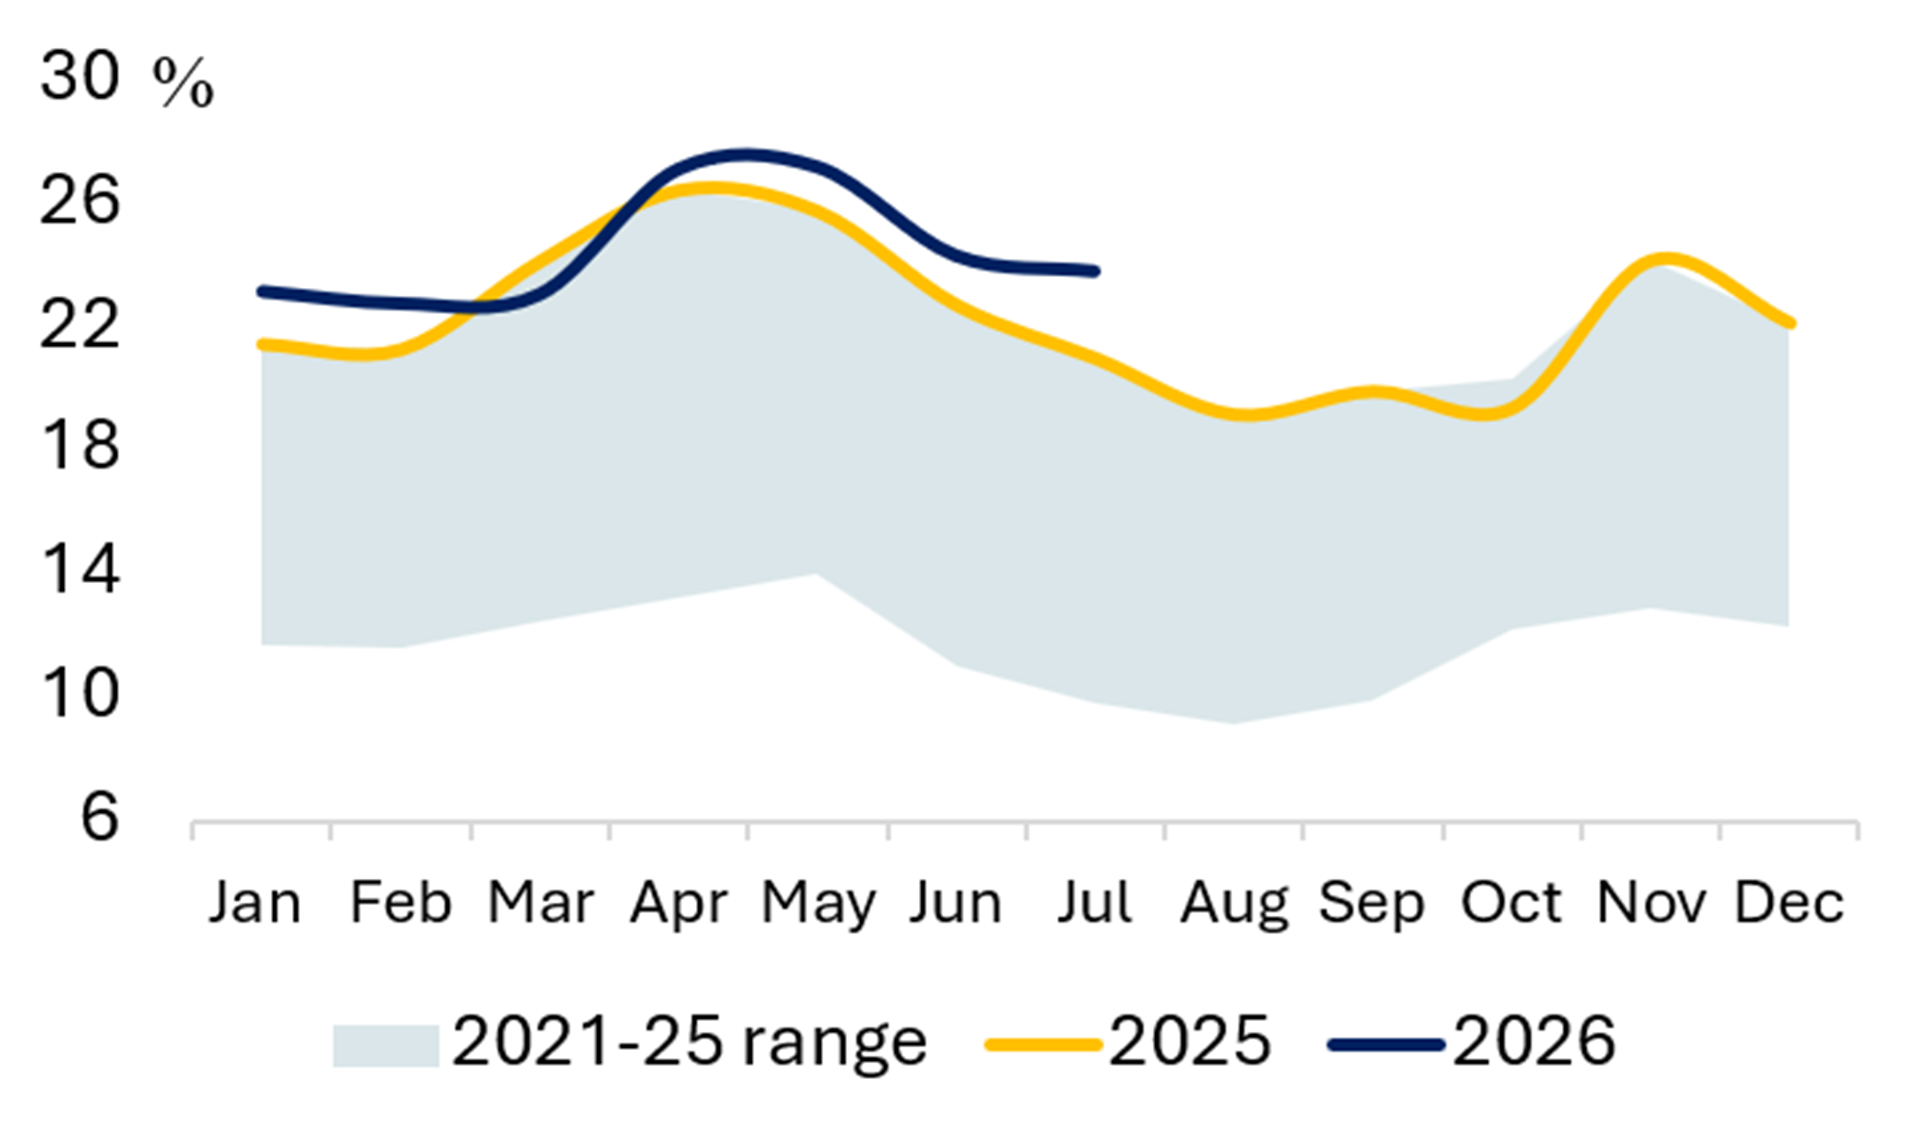
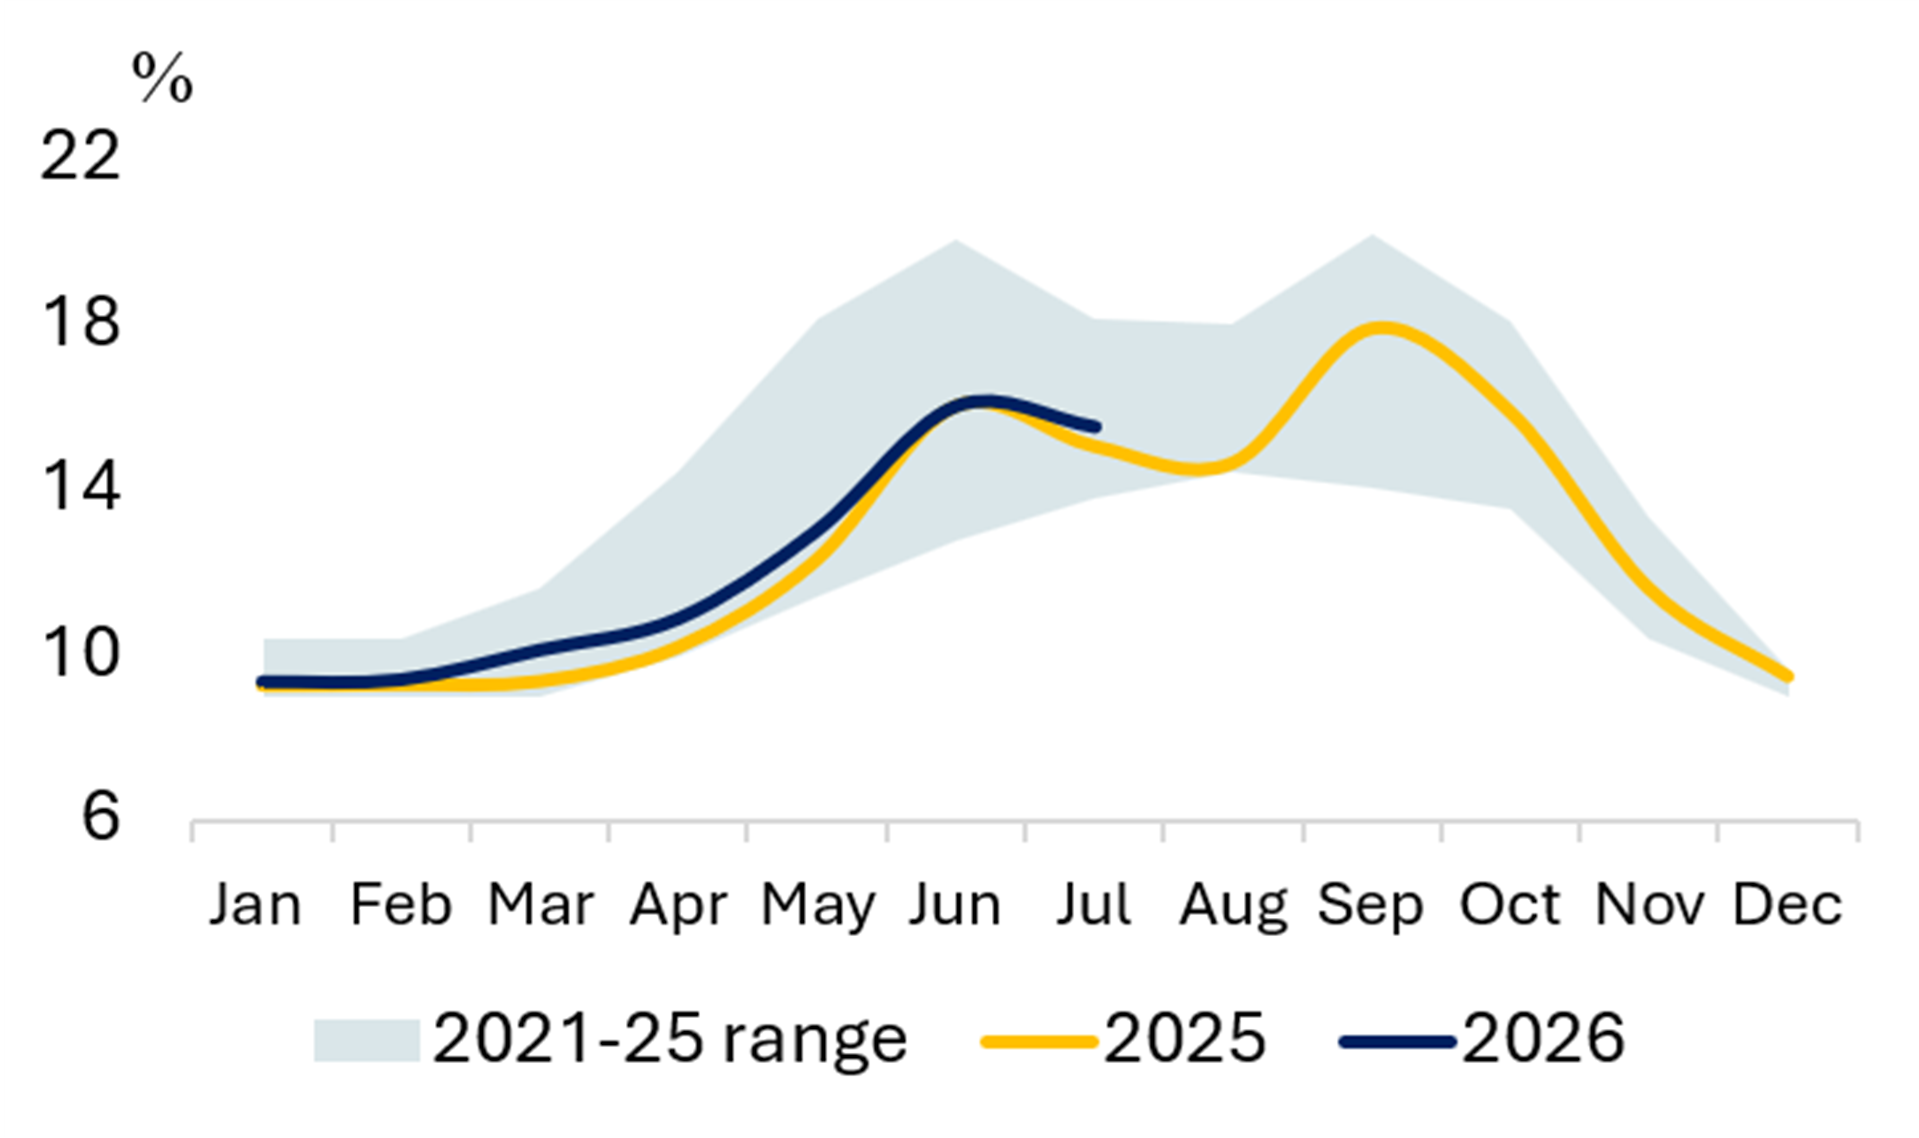
Exhibit 37 Share of Wind & Solar (%) Exhibit 38 Share of Hydro (%) 

JAPAN
Exhibit 39 Power Generation Exhibit 40 Share of Gas (%) 

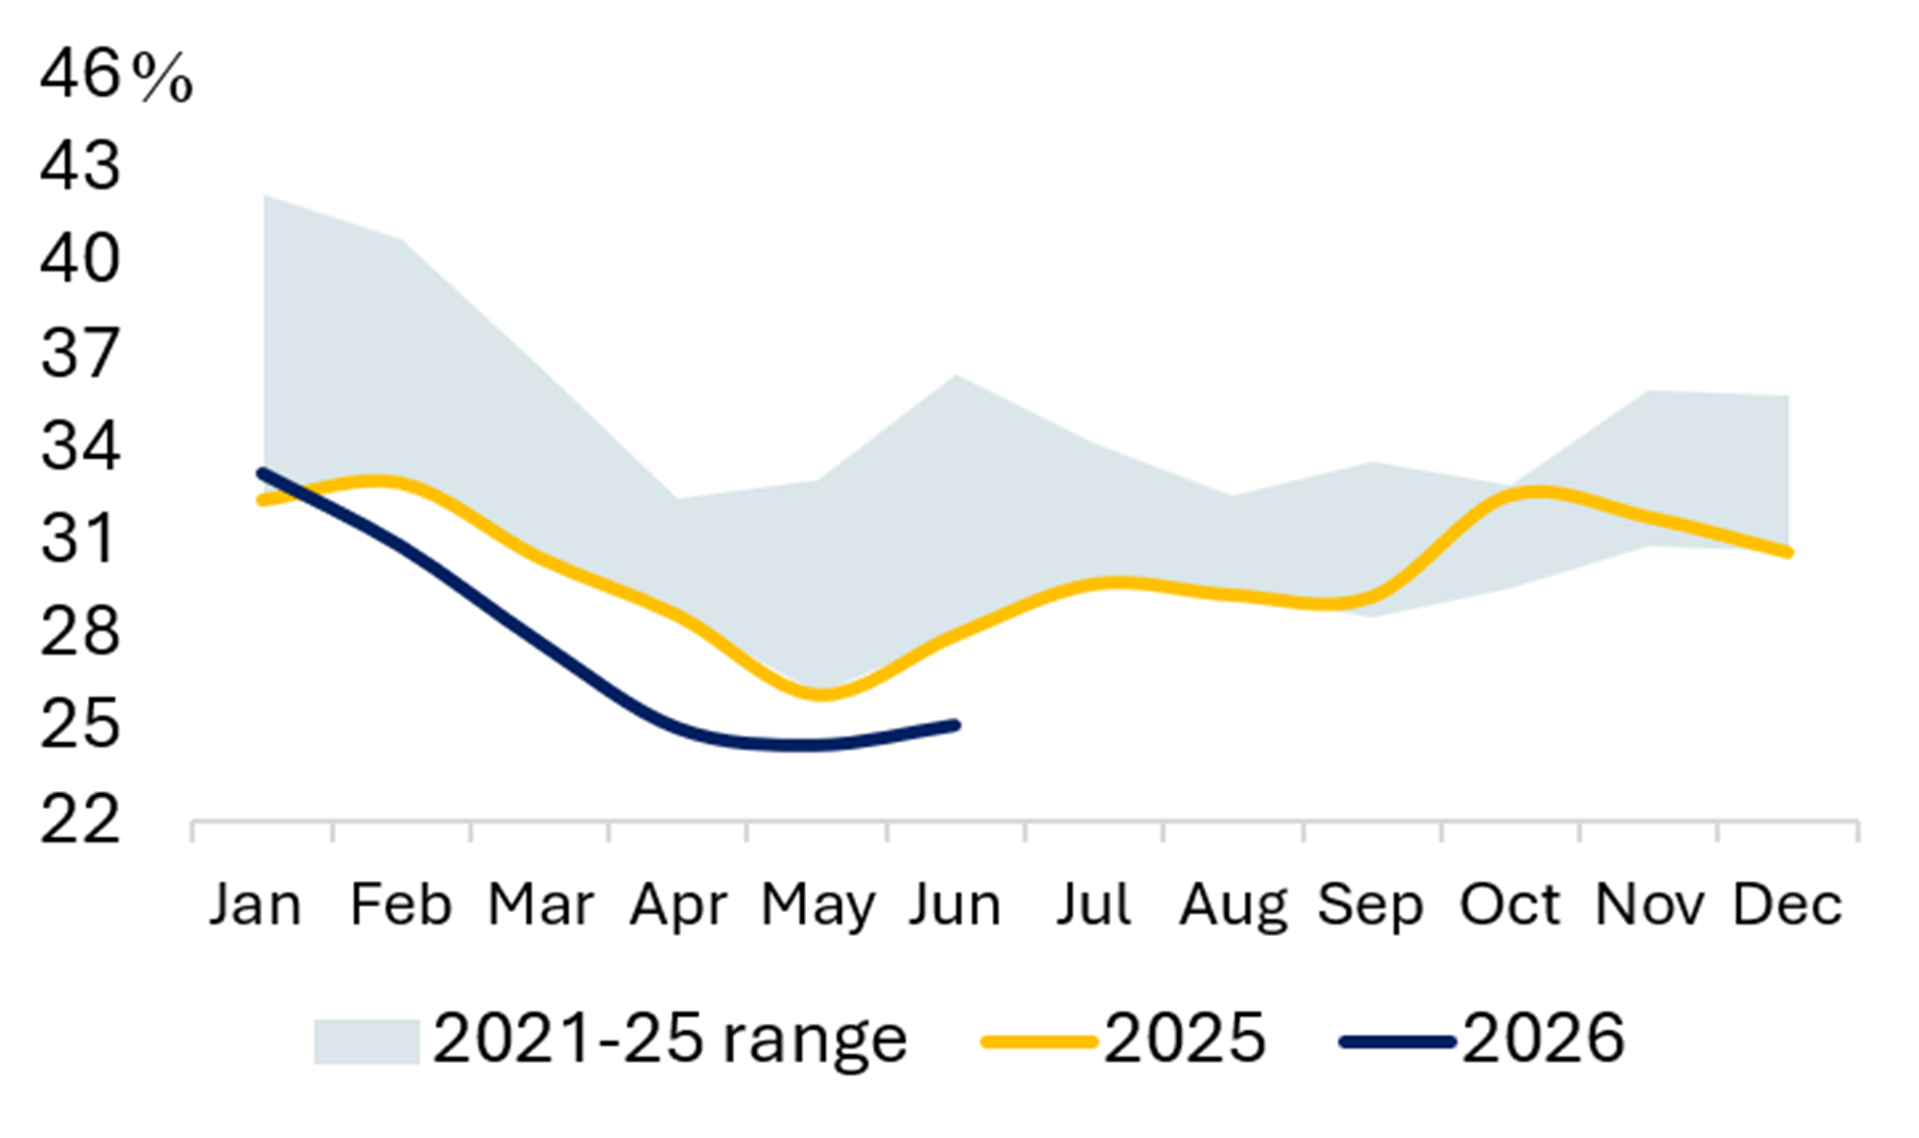
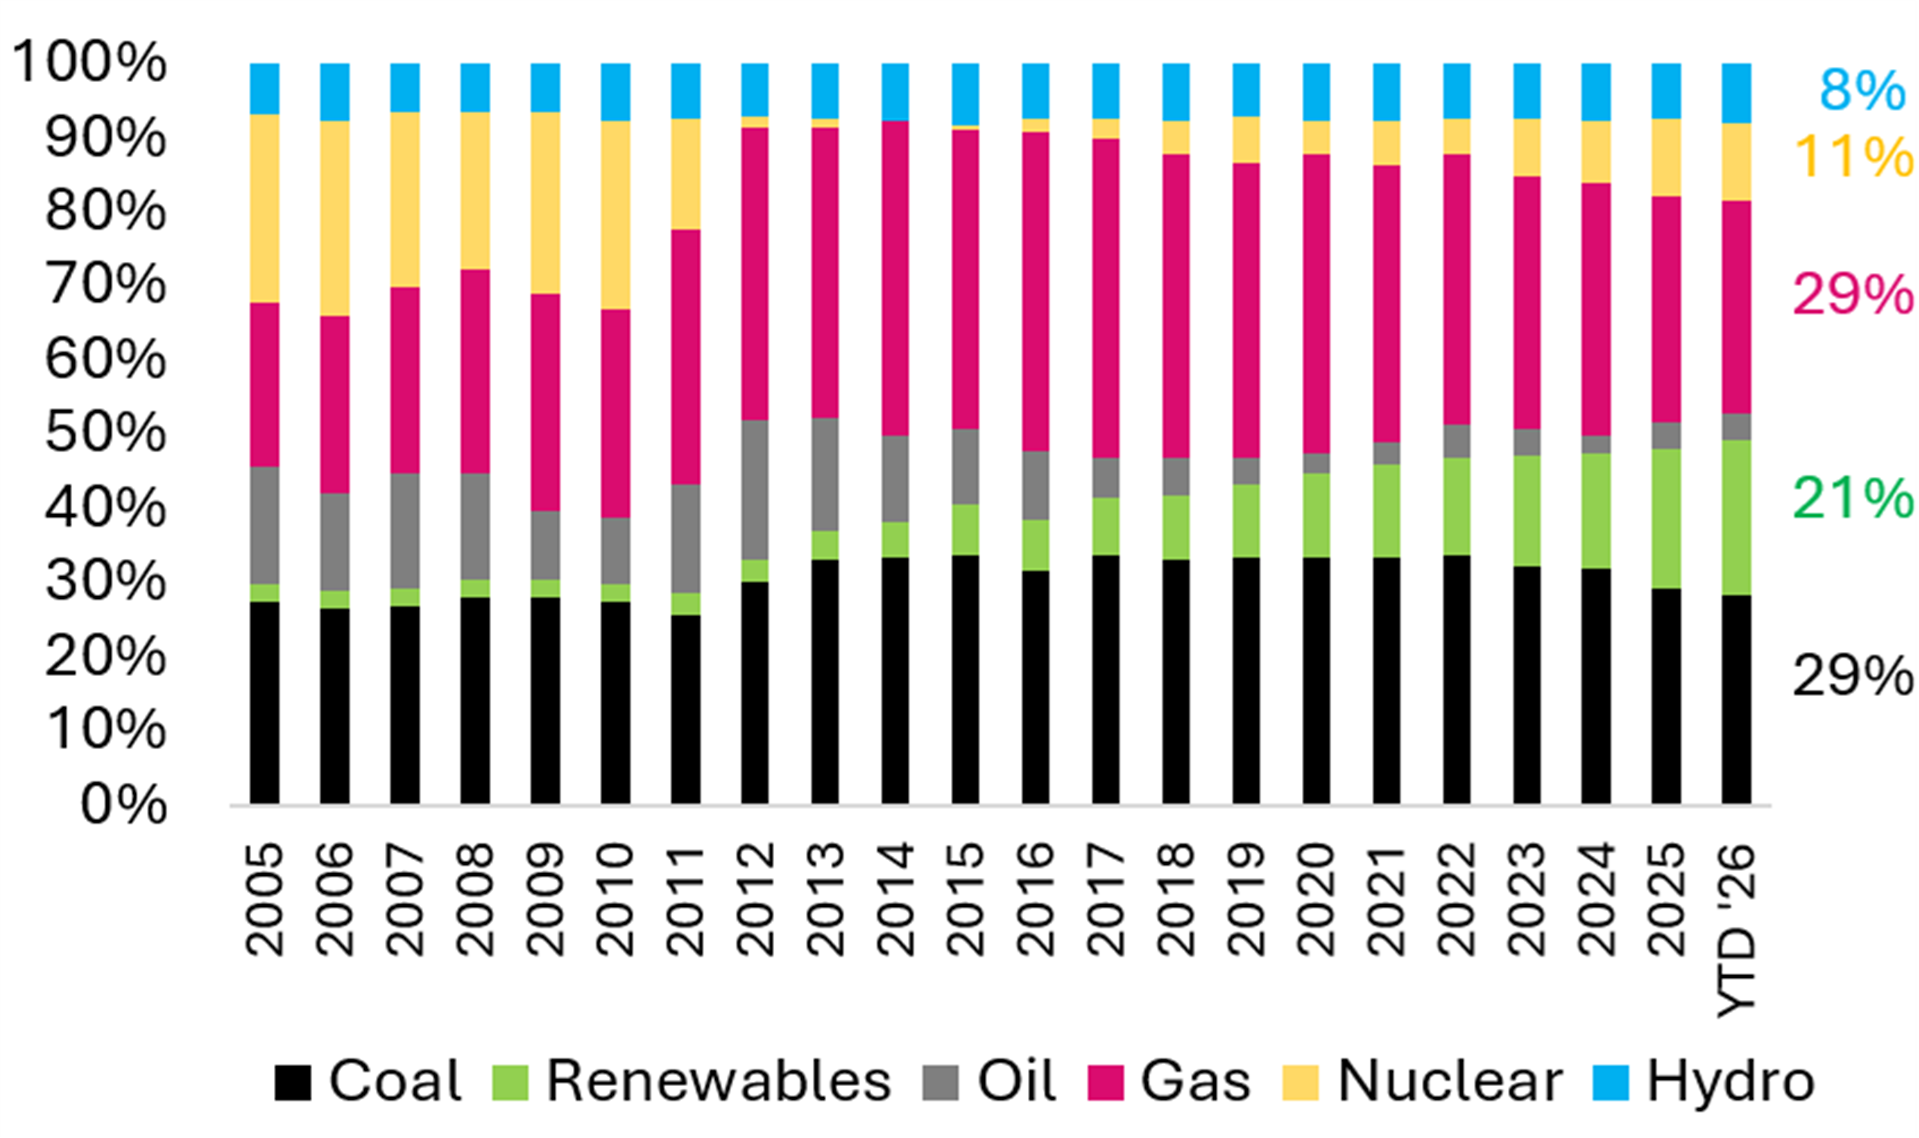
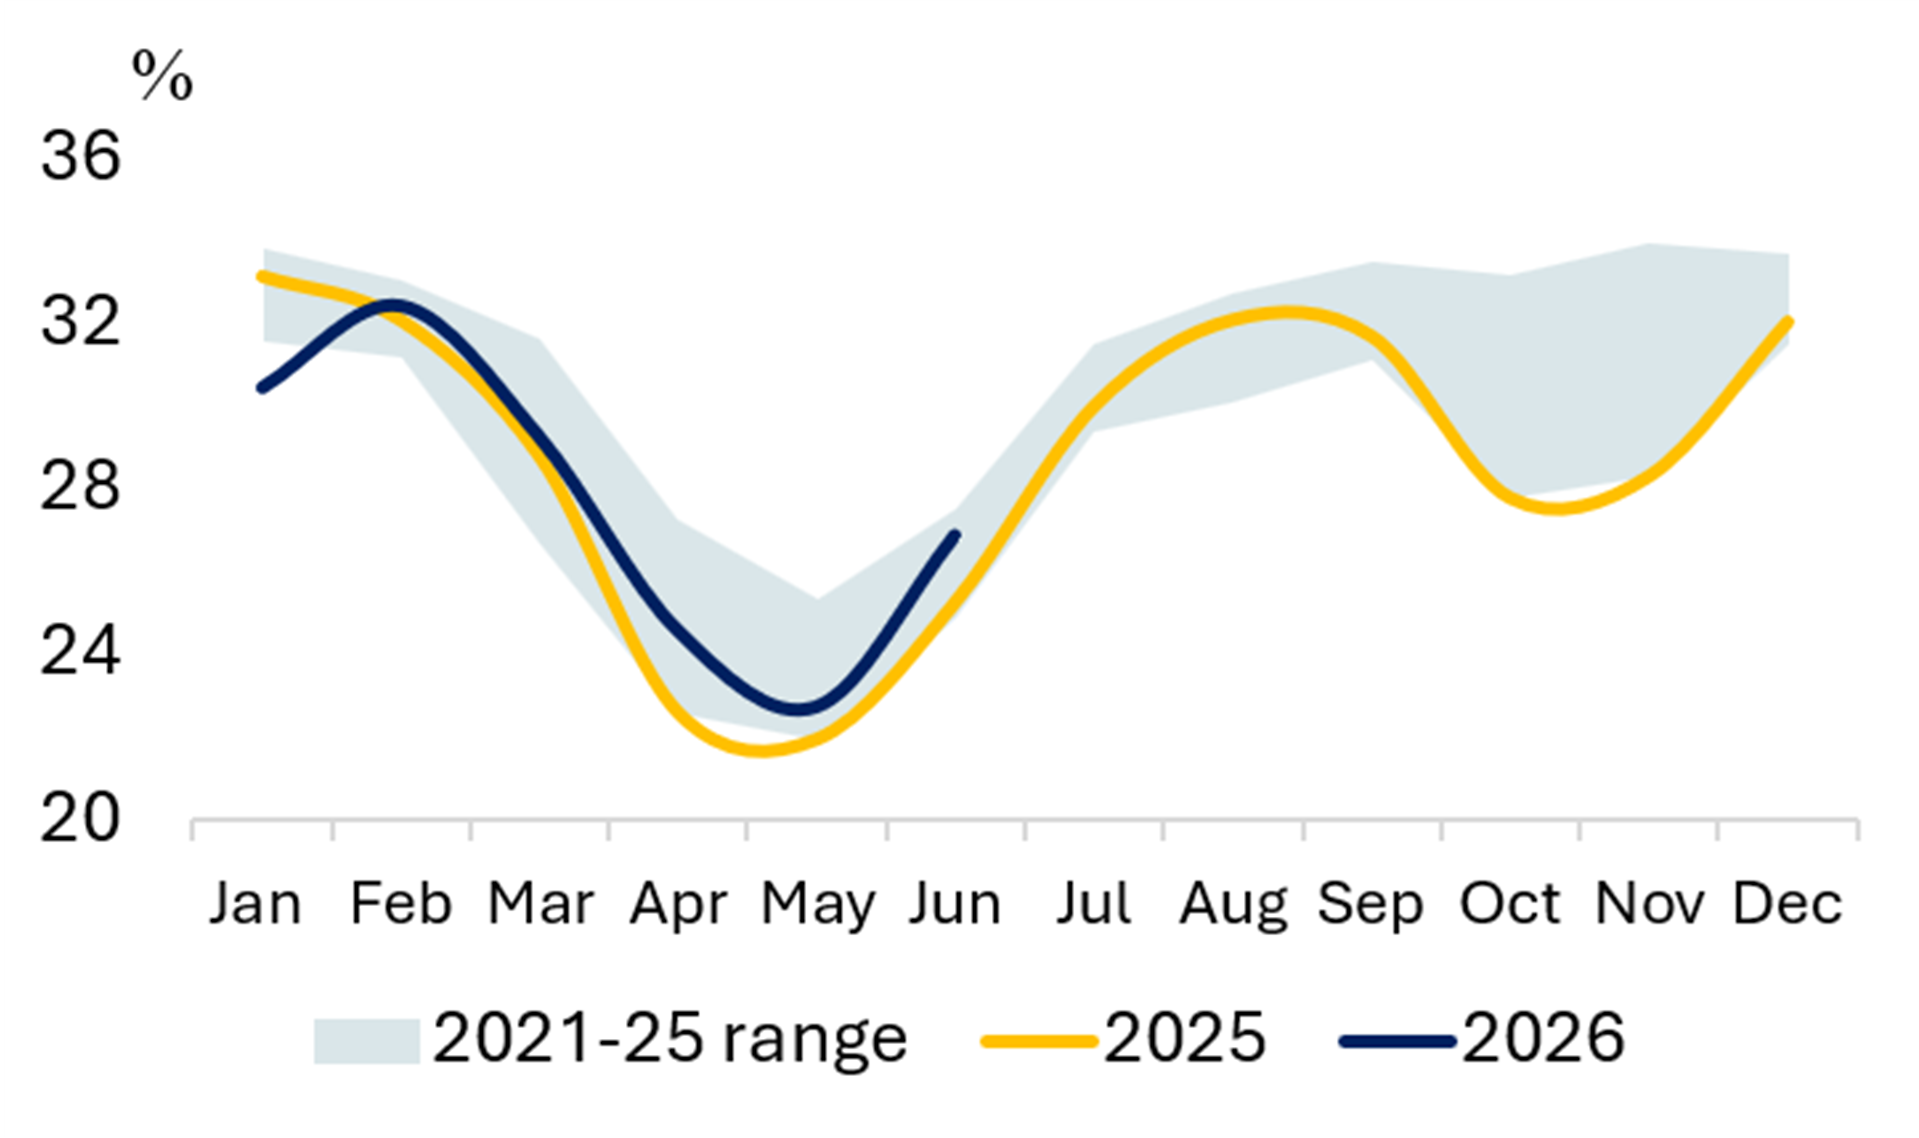
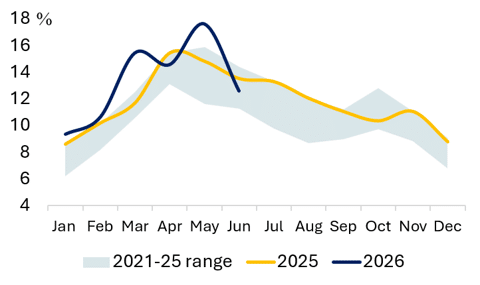
Exhibit 41 Share of Coal (%) Exhibit 42 Share of Wind & Solar (%)
Source: EMBER
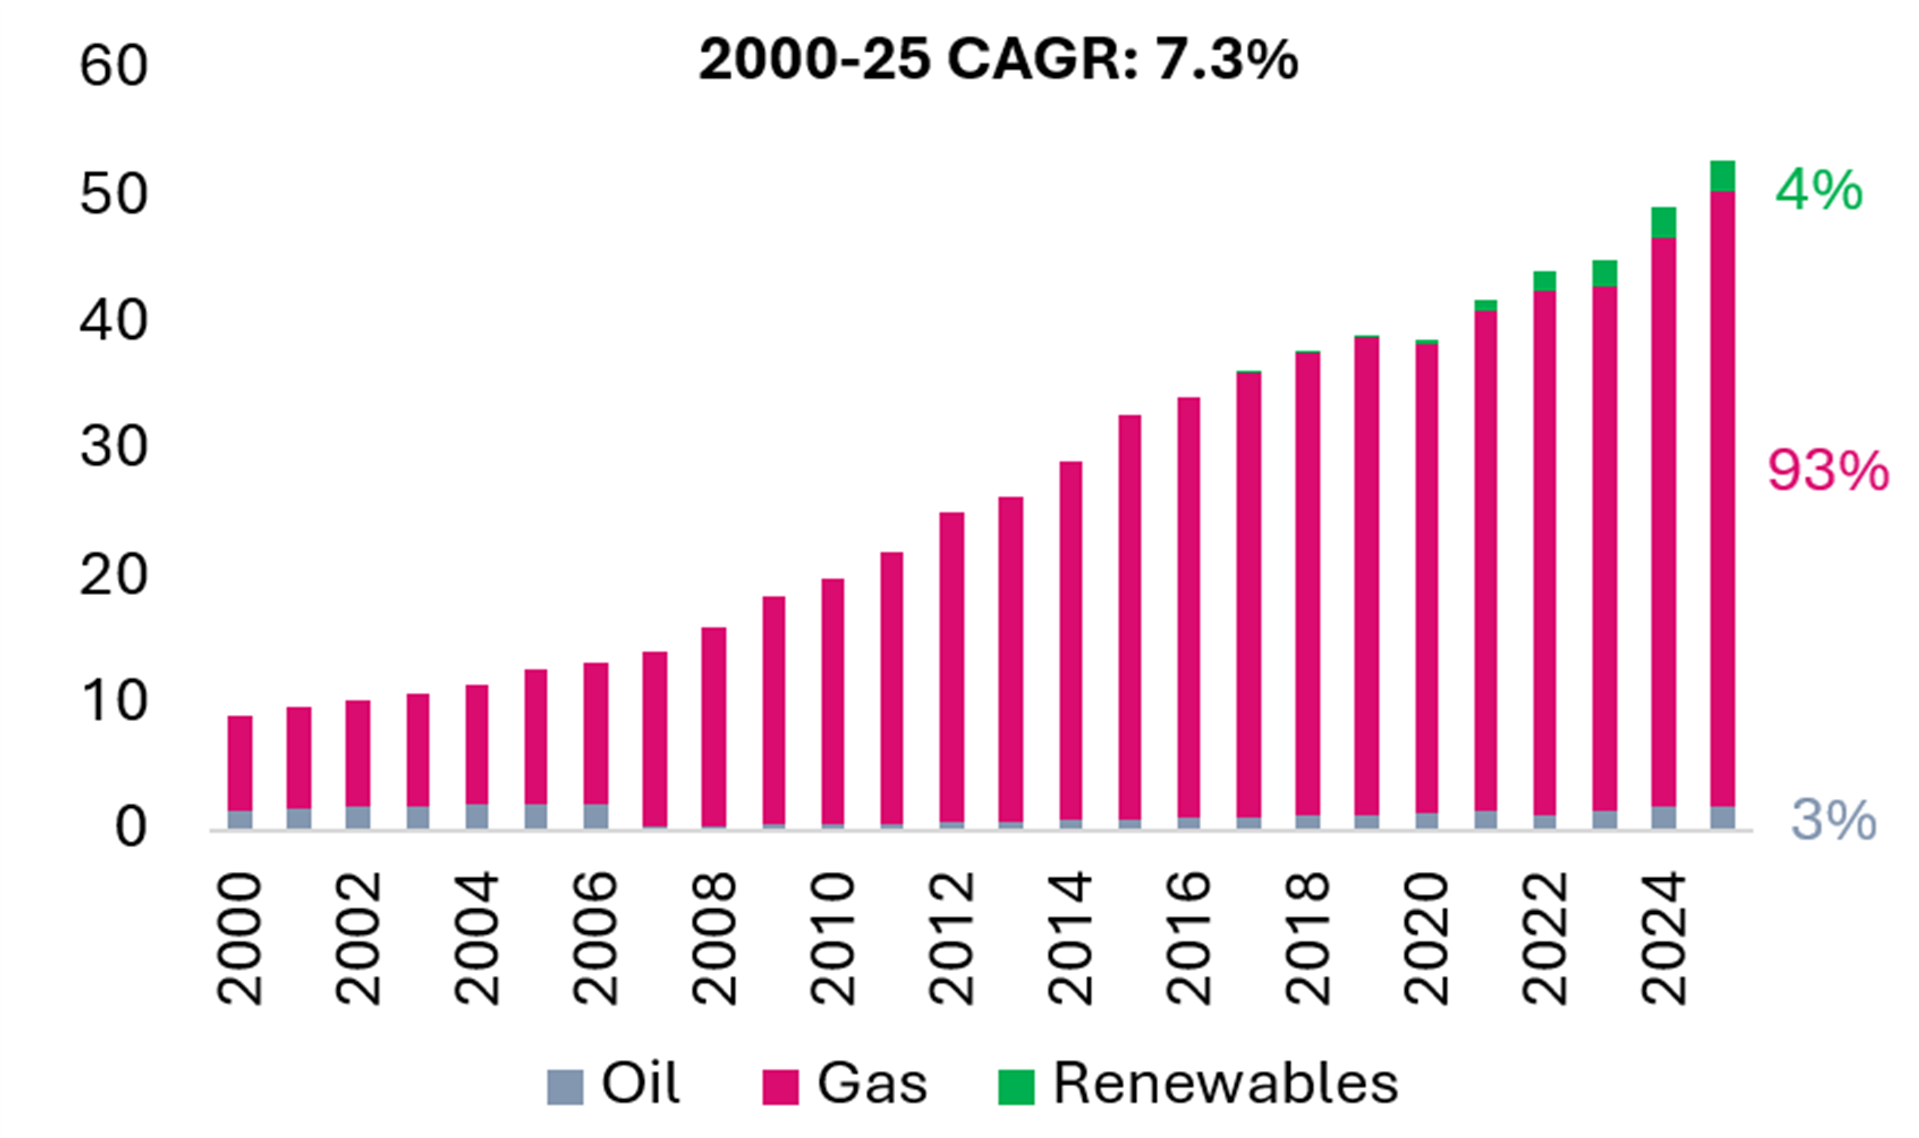
MIDDLE EAST – Energy Mix in Six Gulf Cooperation Council (GCC) Countries
Exhibit 43 Power Demand per Capita
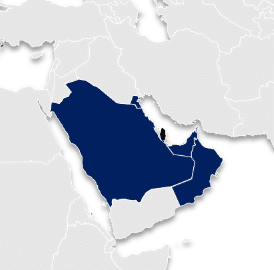
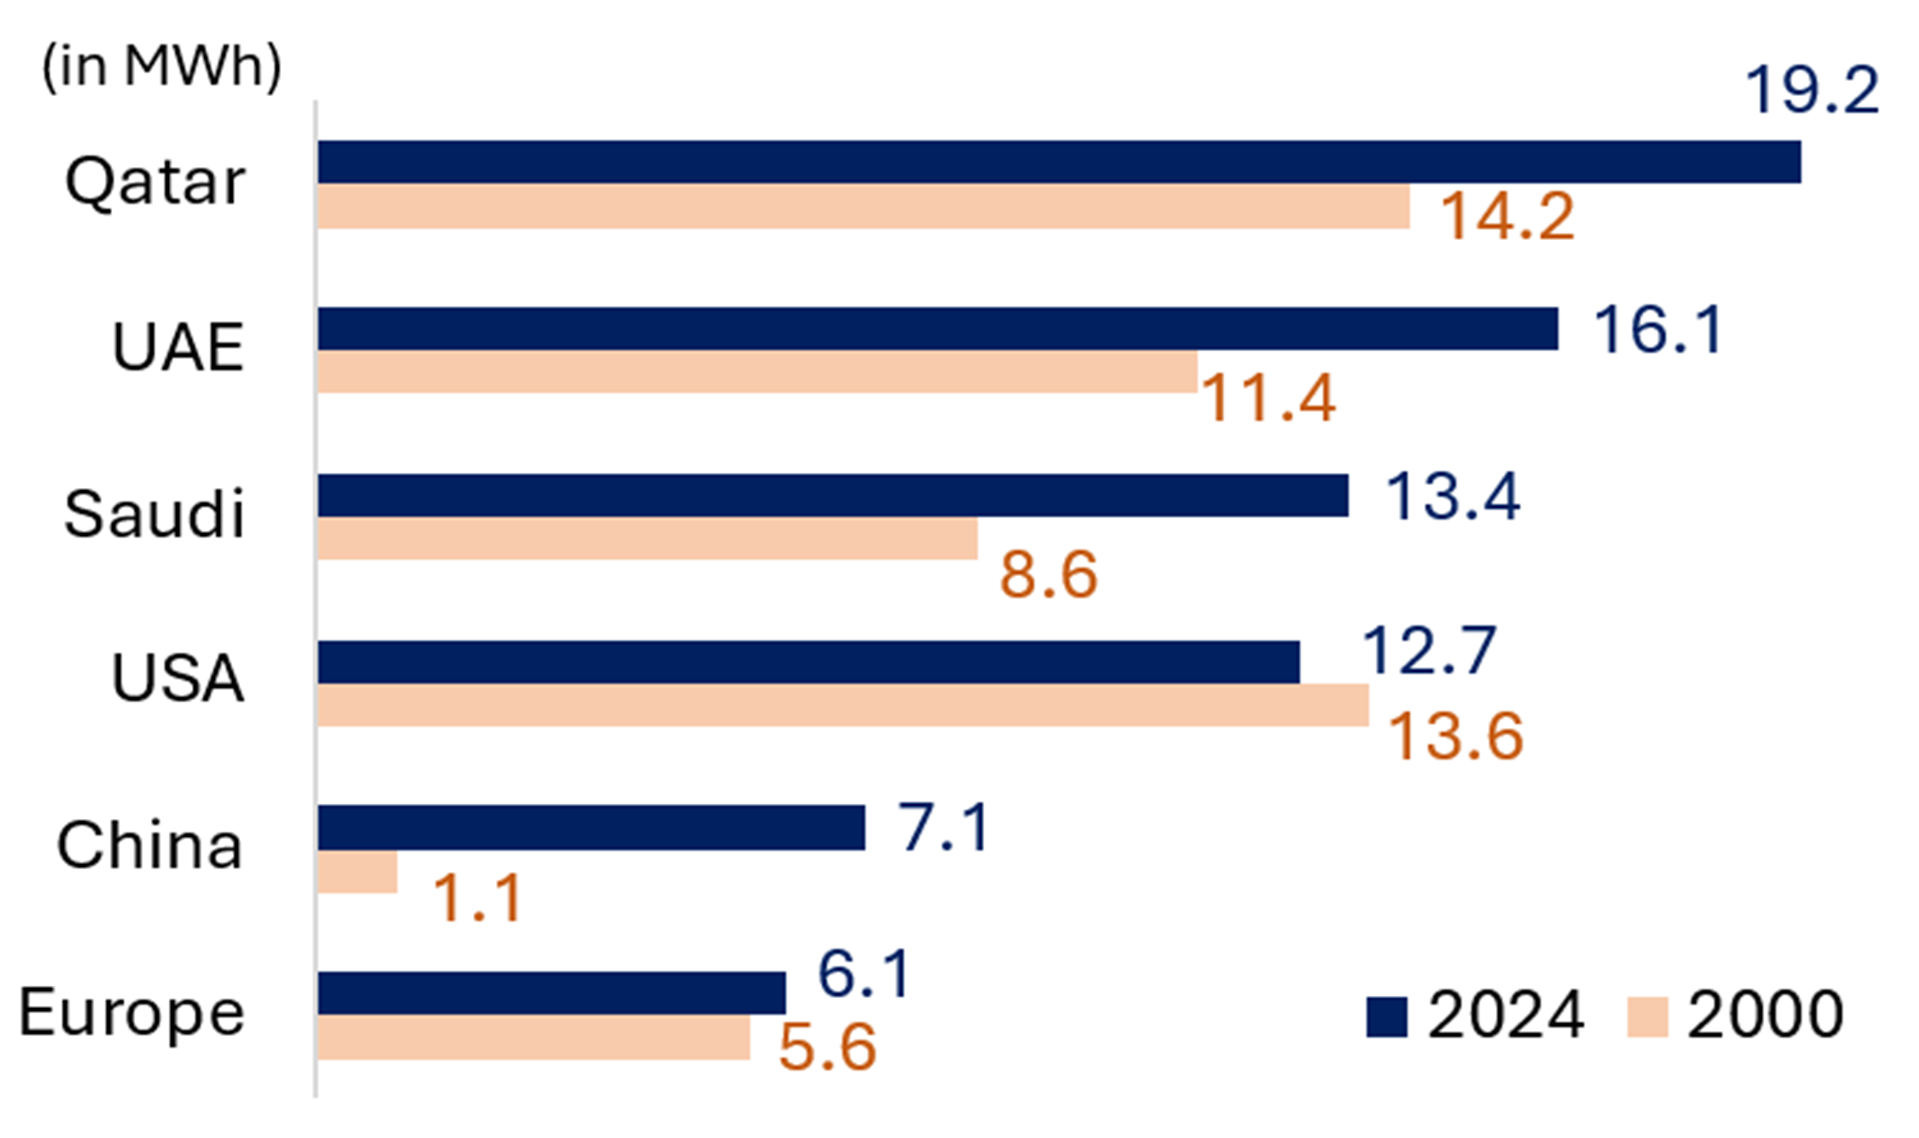
Exhibit 44 Saudi Arabia Power Gen (TWh) Exhibit 45 UAE Power Gen (TWh) 

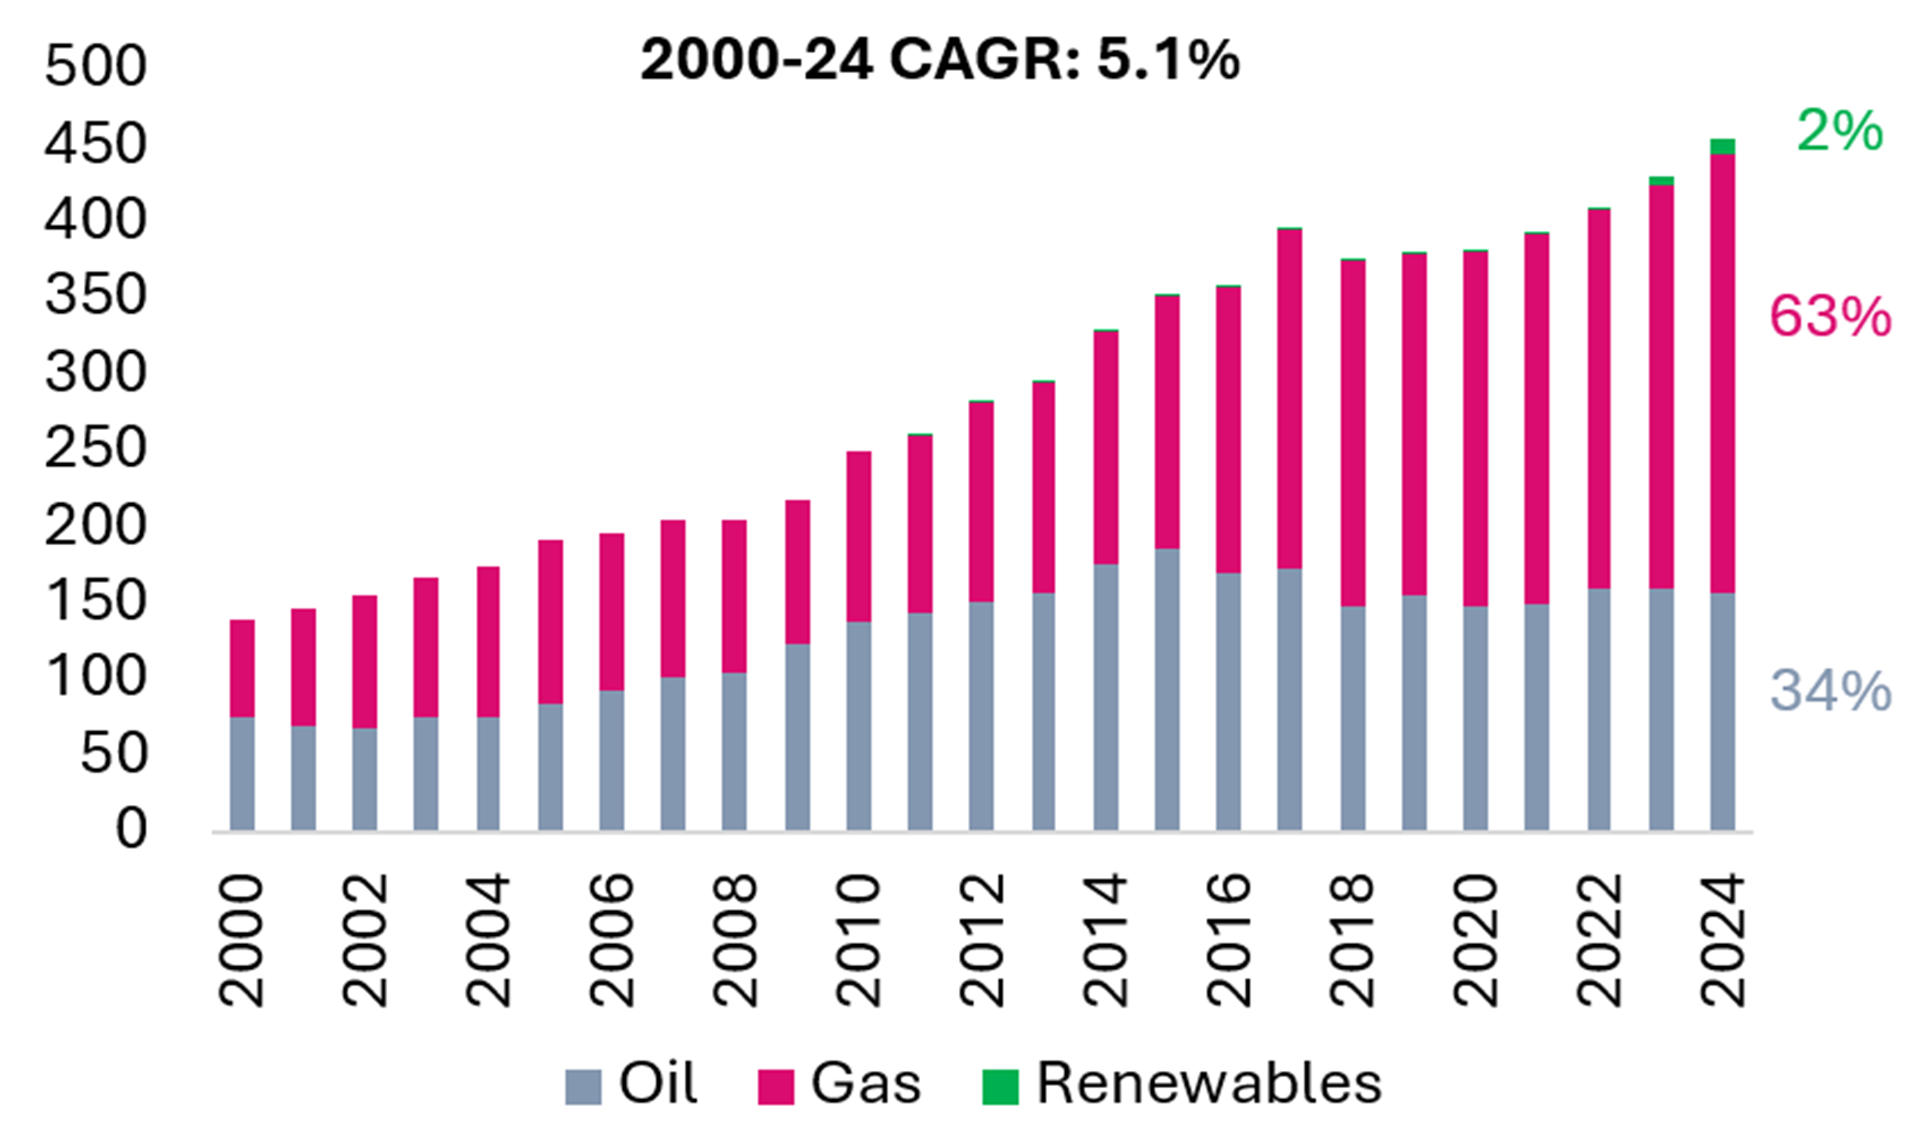
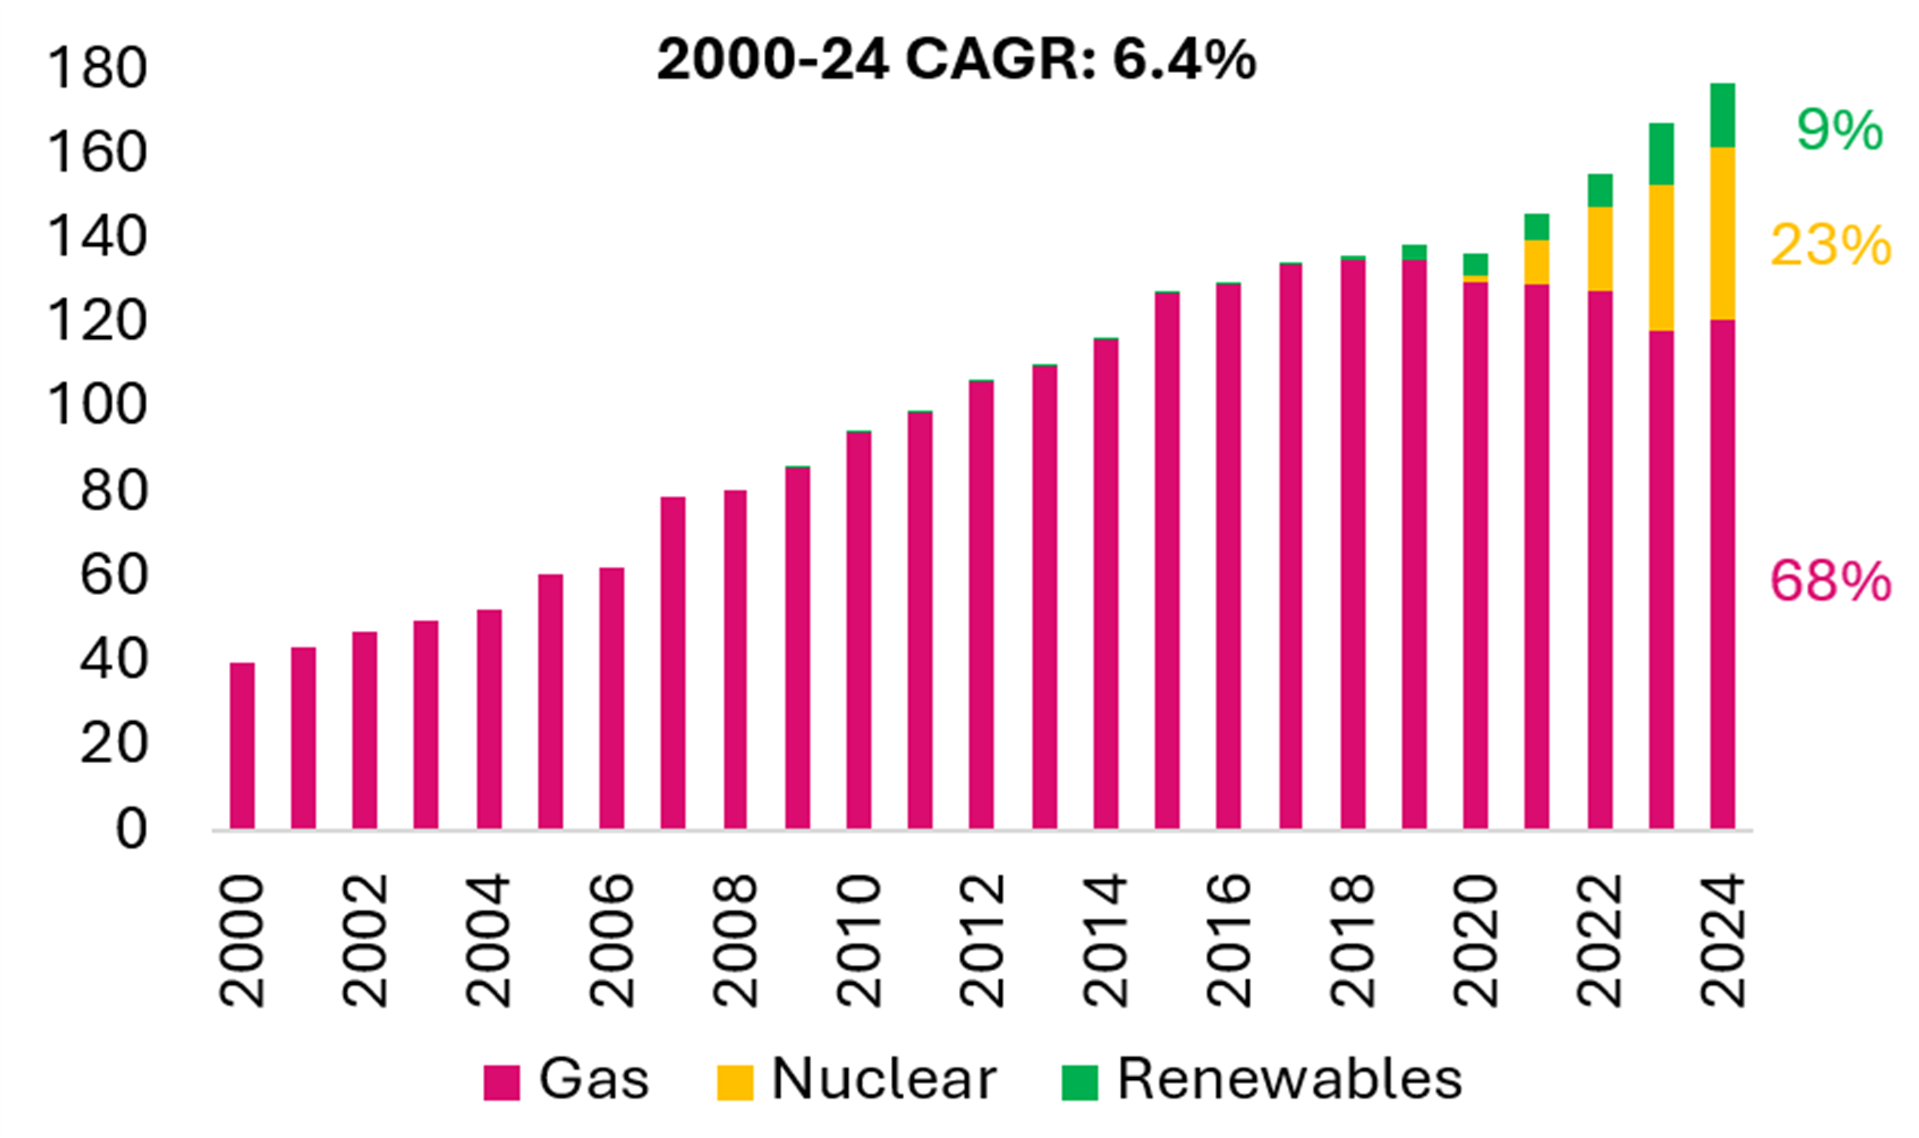
Exhibit 46 Qatar Power Gen (TWh) Exhibit 47 Kuwait Power Gen (TWh) 

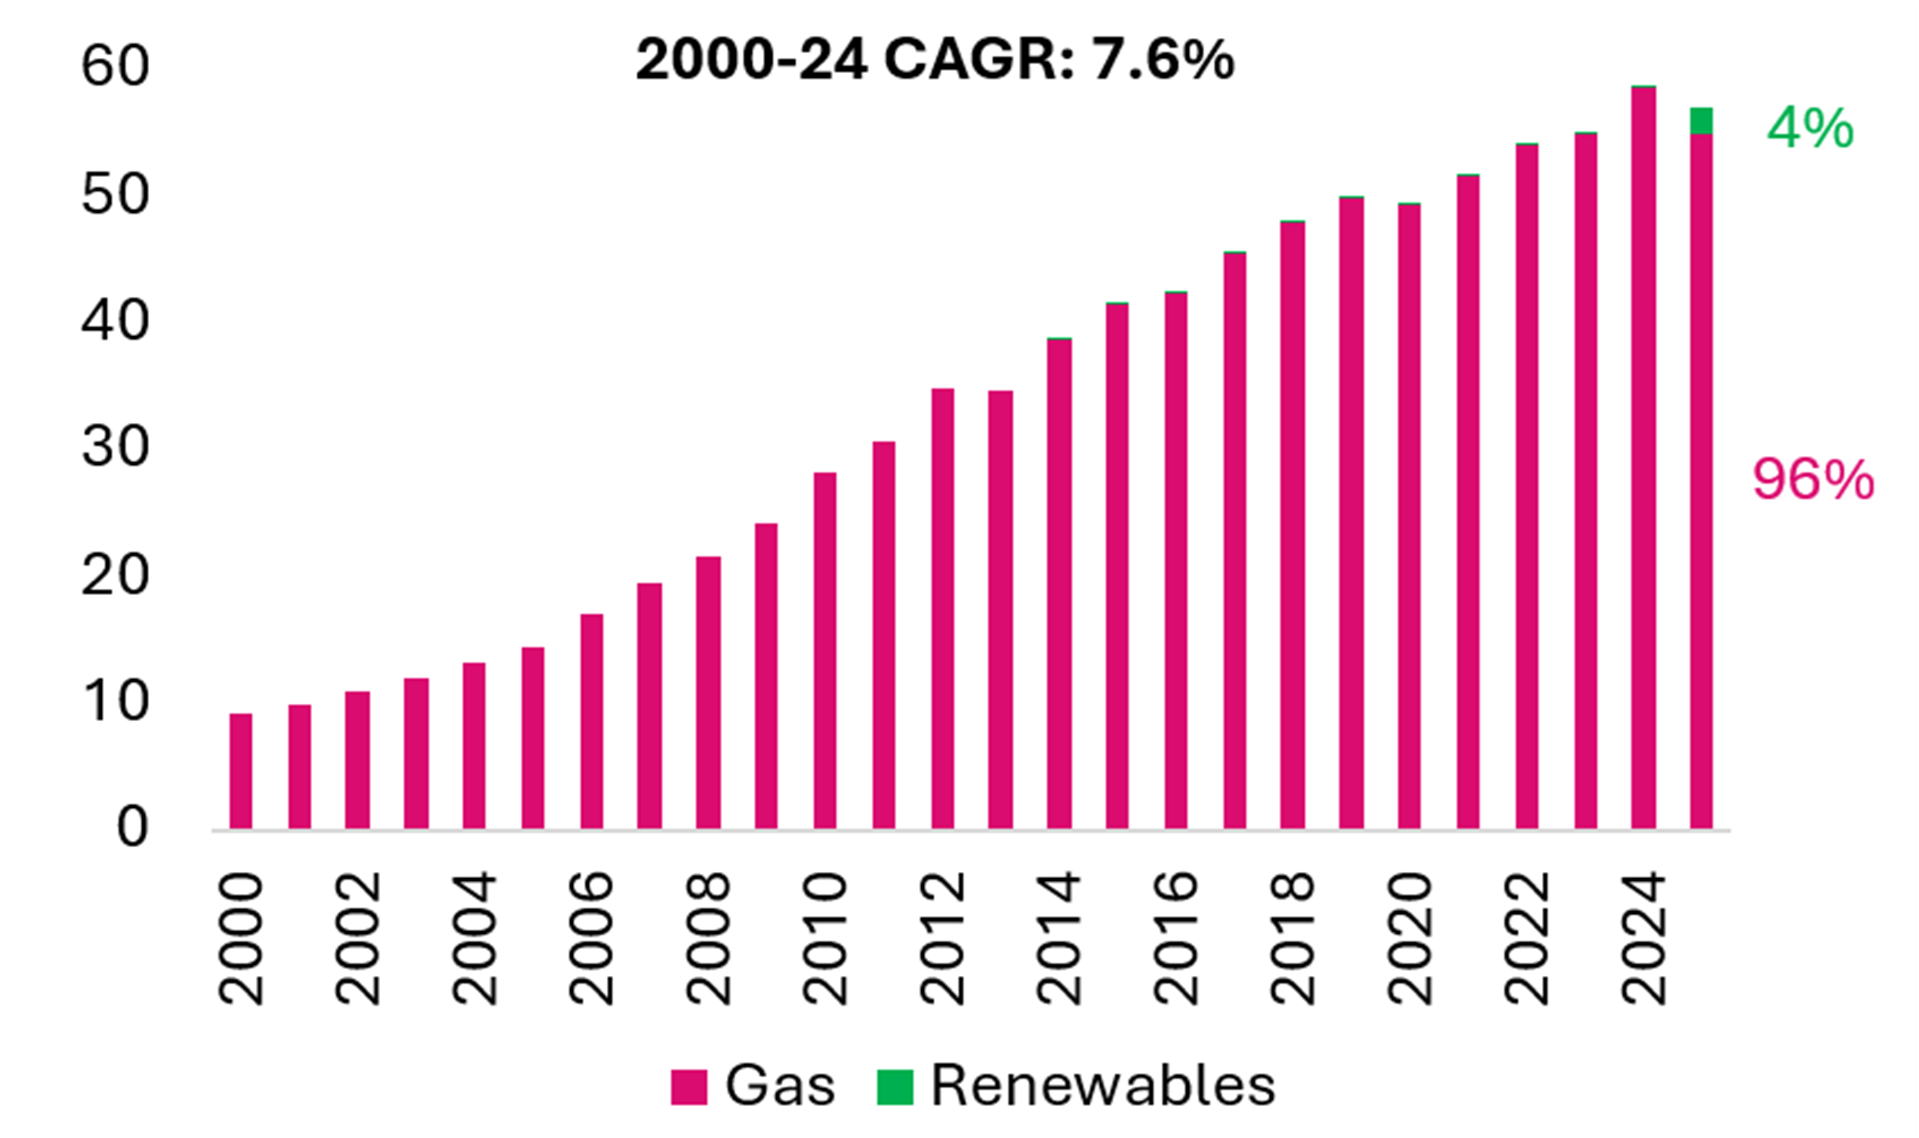
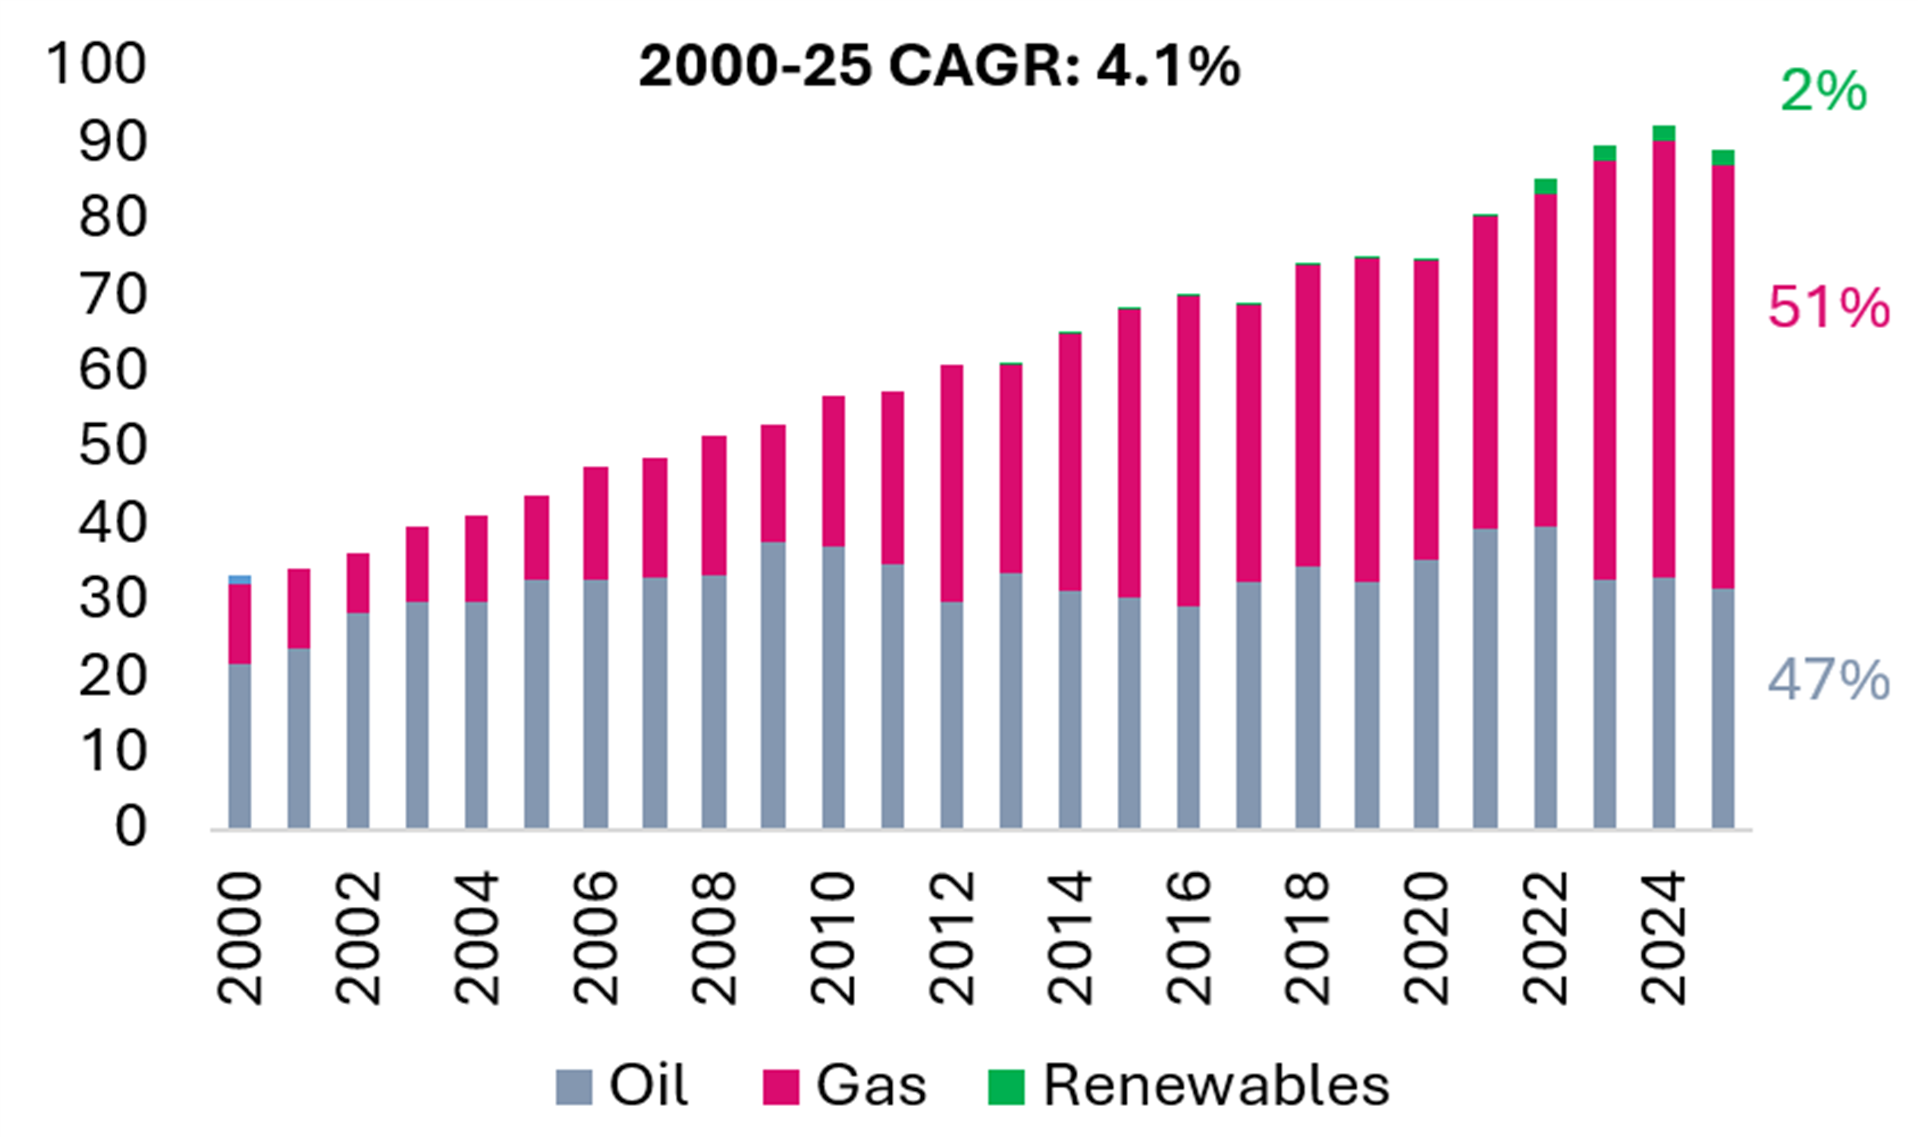
Exhibit 48 Oman Power Gen (TWh) Exhibit 49 Bahrain Power Gen (TWh) 

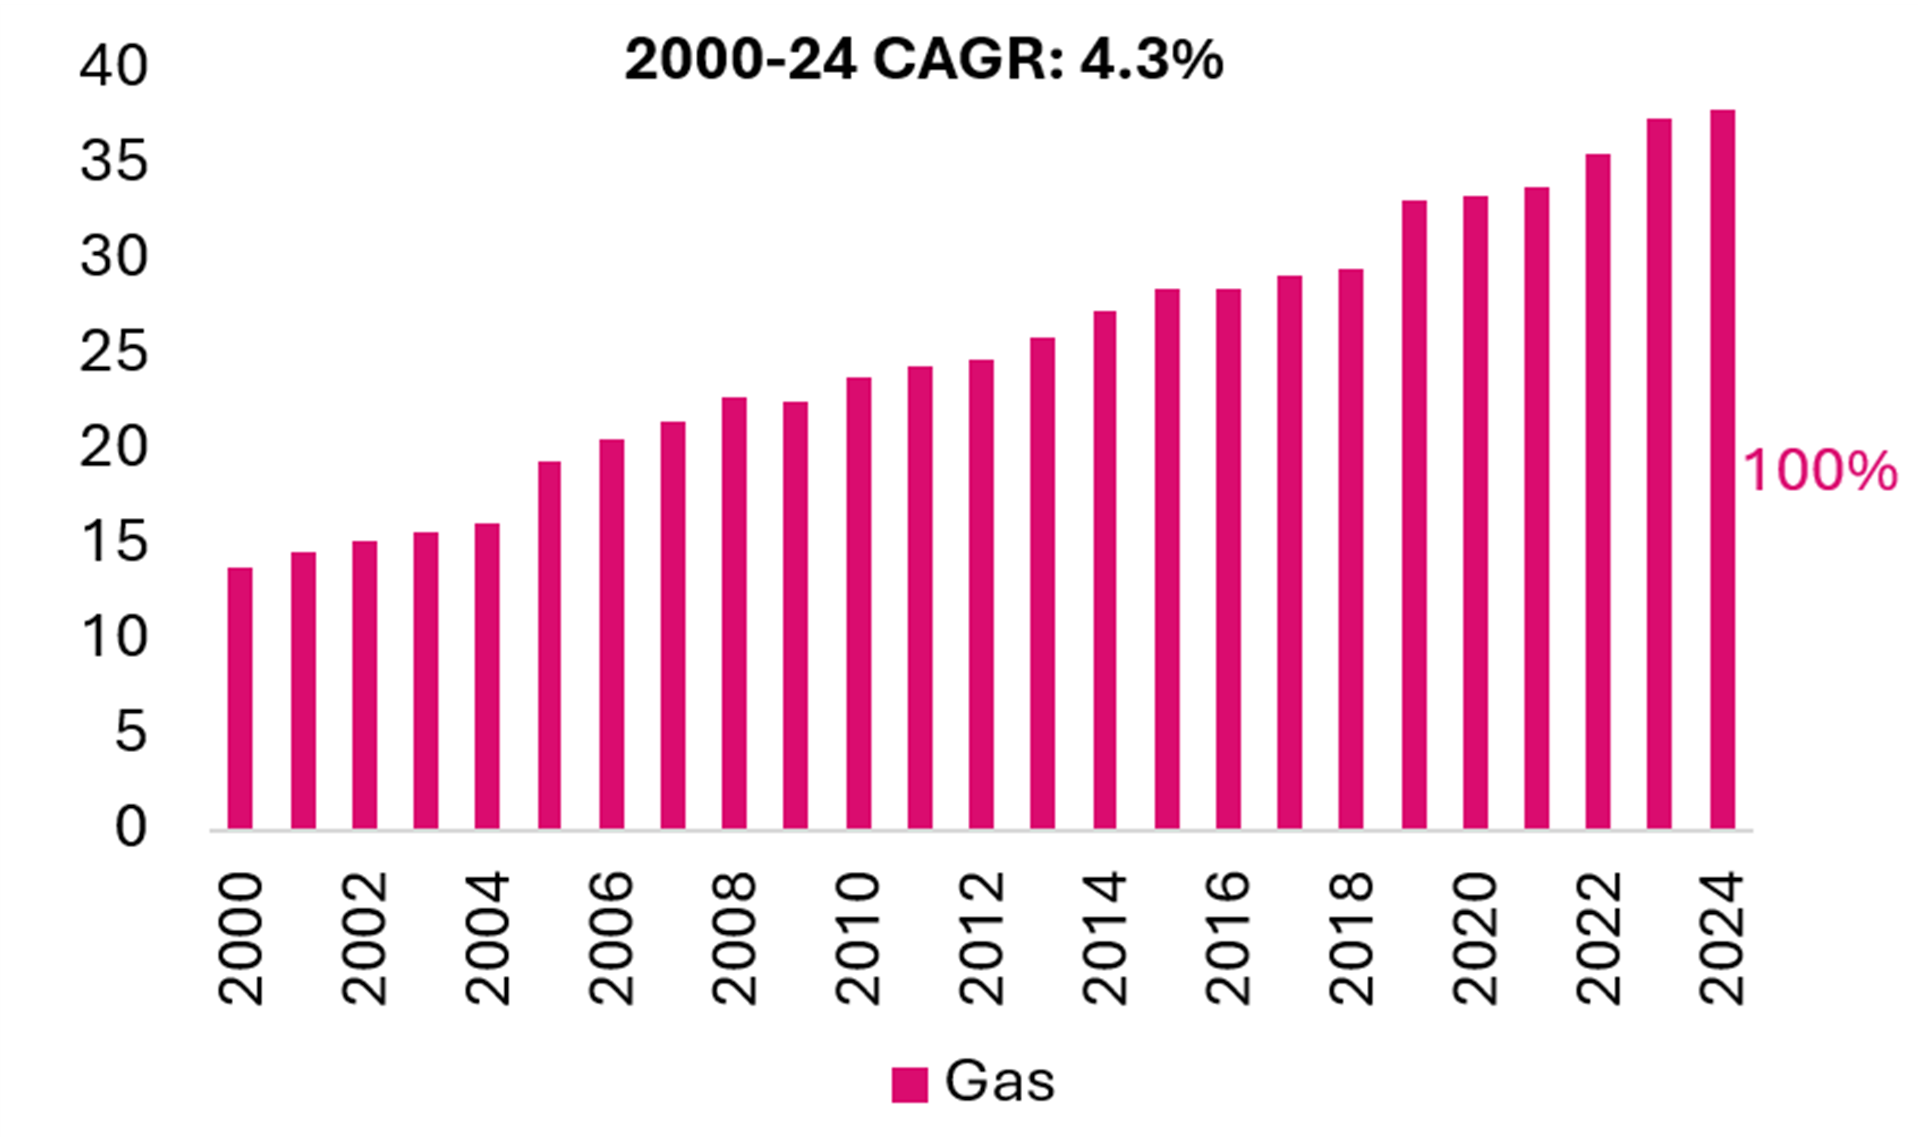
Source: EMBER
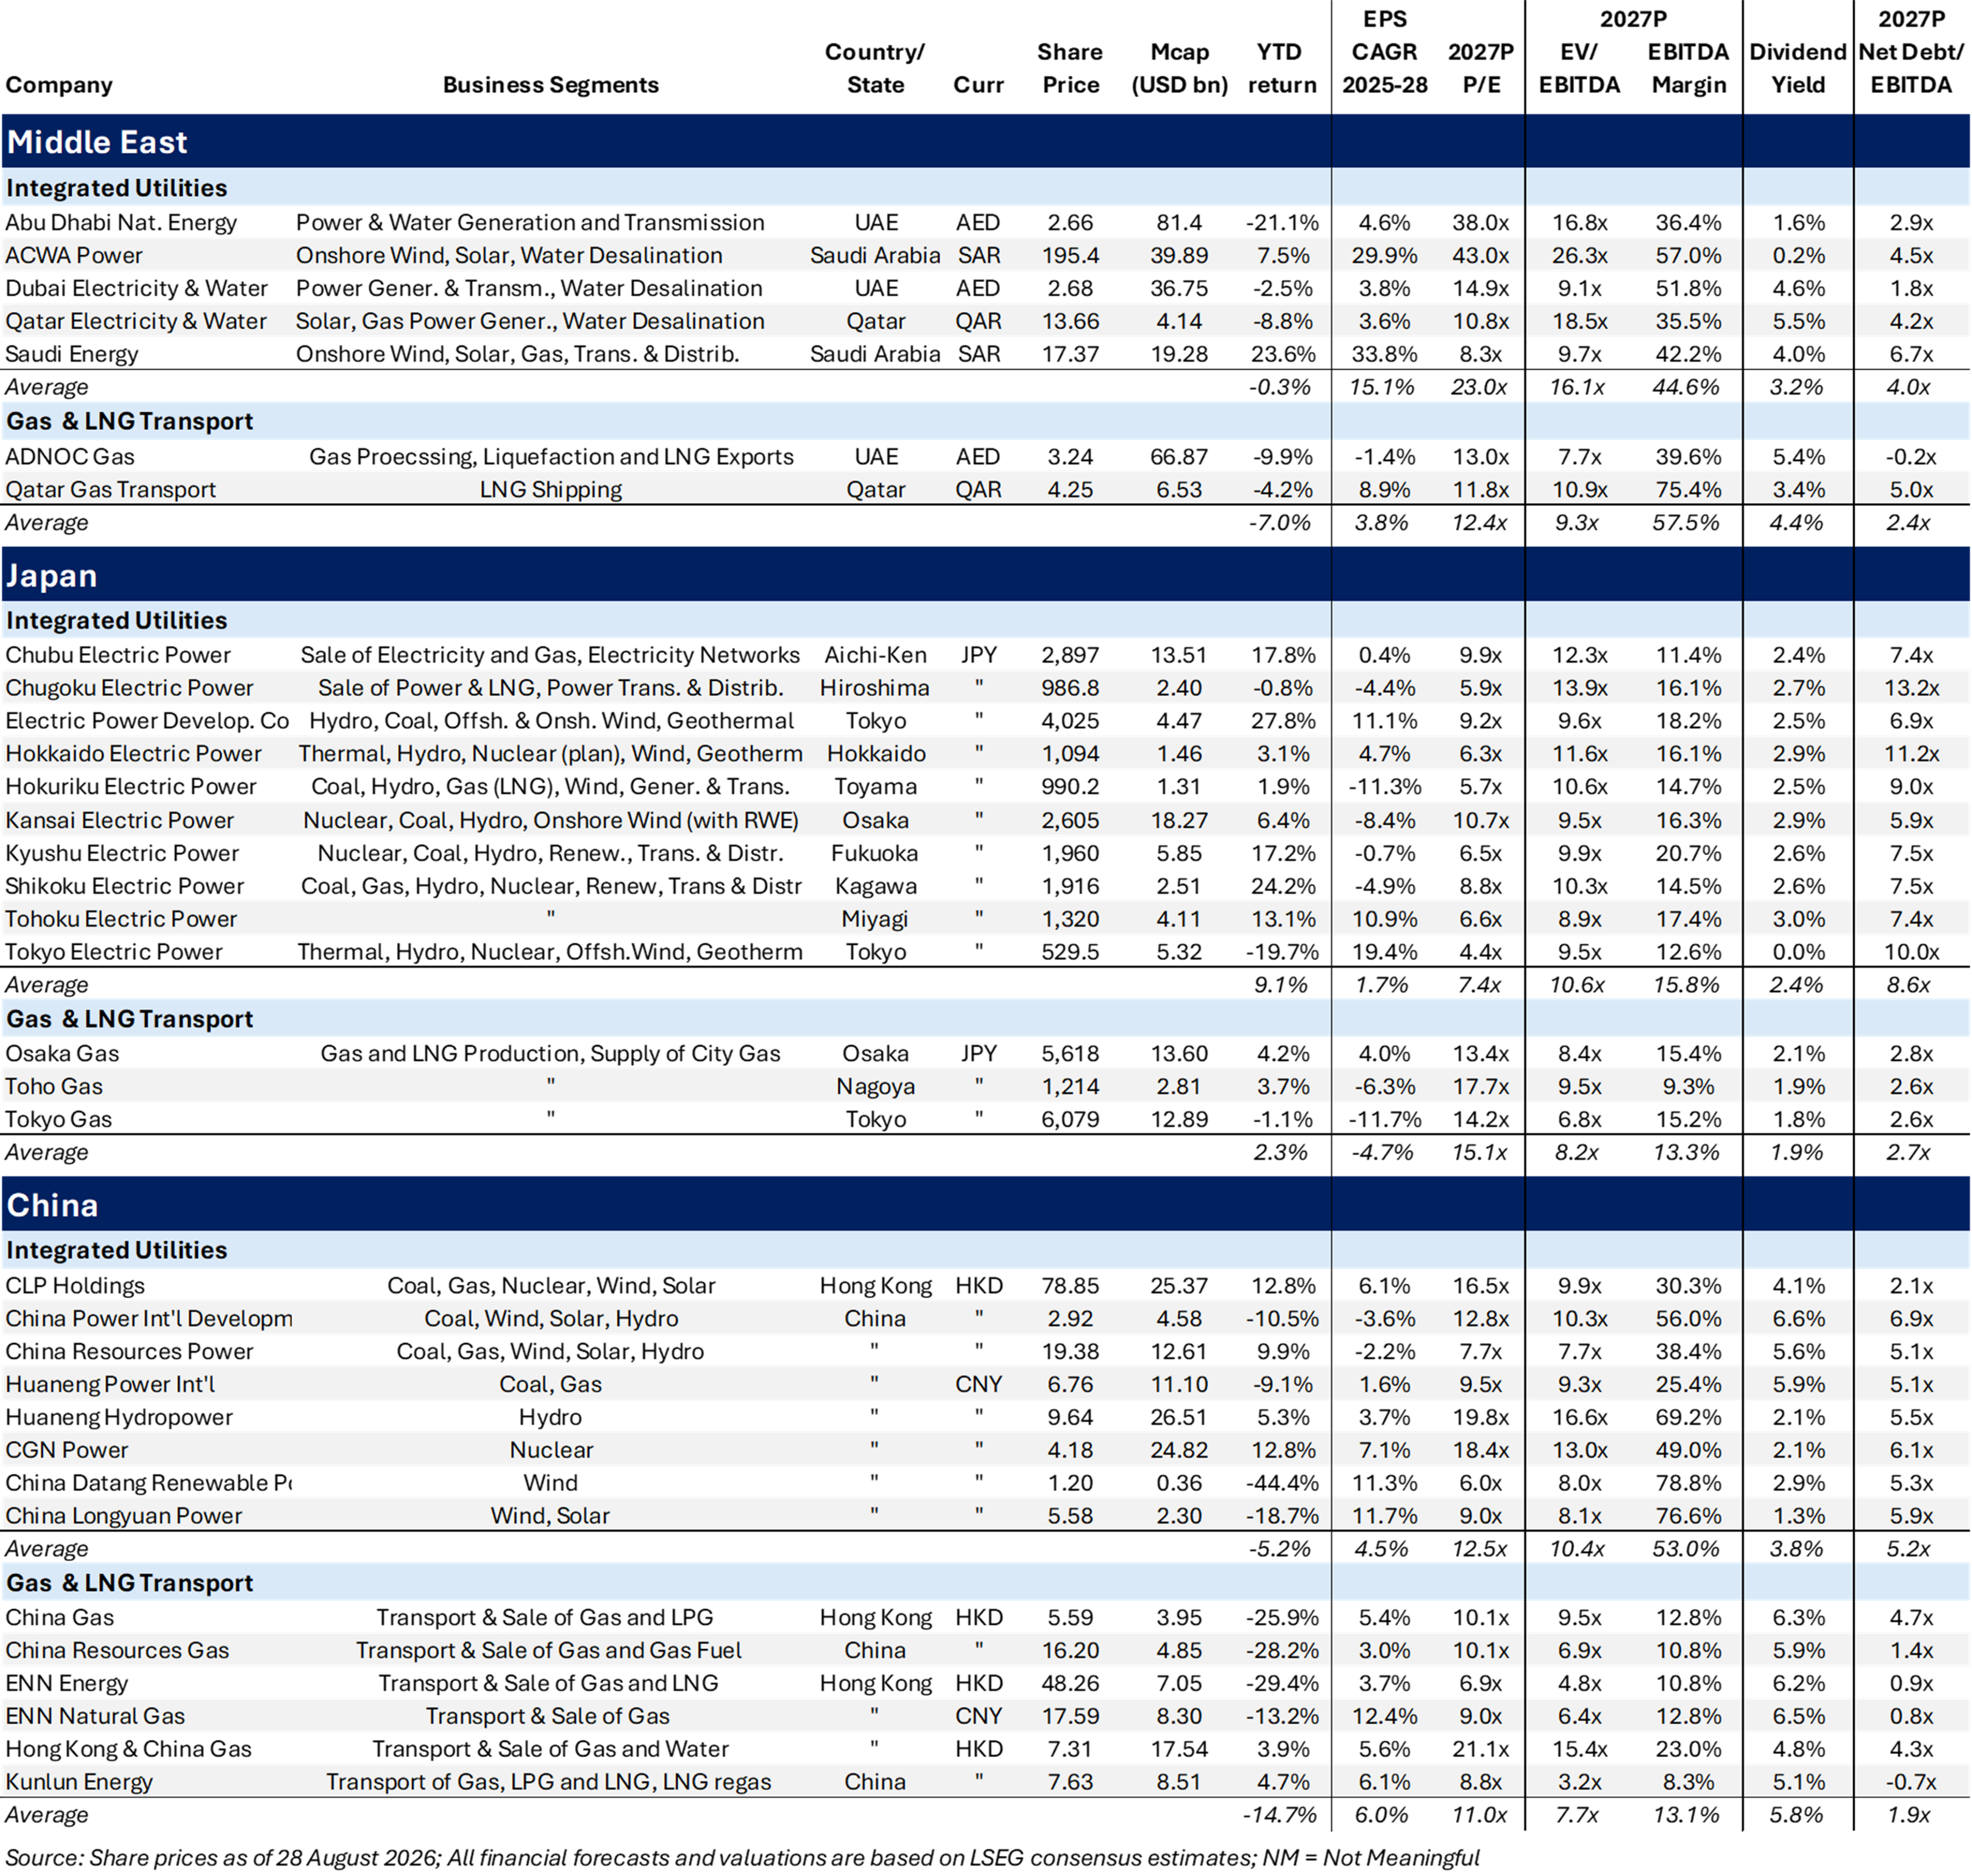
Table 5 Global Utilities – Performance & Comparative Valuation


©Gabelli Funds 2026
249 Royal Palm Beach Way, Palm Beach, FL 33480 Gabelli Funds TEL (561) 671–2100
This whitepaper was prepared by Jens Zimmermann, CFA, by Ashish Sinah, CFA, by Chong-Min Kang, and by Mitsuyoshi Kikuchi. The examples cited herein are based on public information and we make no representations regarding their accuracy or usefulness as precedent. The Research Analysts’ views are subject to change at any time based on market and other conditions. The information in this report represent the opinions of the individual Research Analysts’ as of the date hereof and is not intended to be a forecast of future events, a guarantee of future results, or investments advice. The views expressed may differ from other Research Analyst or of the Firm as a whole.
As of June 30, 2026, affiliates of GAMCO Investors, Inc. beneficially owned less than 1% of all companies mentioned.
Funds investing in a single sector, such as utilities, may be subject to more volatility than funds that invest more broadly. The utilities industry can be significantly affected by government regulation, financing difficulties, supply or demand of services or fuel and natural resources conservation. The value of utility stocks changes as long-term interest rates change
Investors should carefully consider the investment objectives, risks, charges and expenses of the Fund before investing. The prospectus, which contains more complete information about this and other matters, should be read carefully before investing. To obtain a prospectus, please call 800 GABELLI or visit www.gabelli.com
Returns represent past performance and do not guarantee future results. Current performance may be lower or higher than the performance data quoted. Investment return and principal value will fluctuate so, upon redemption, shares may be worth more or less than their original cost. To obtain the most recent month end performance information and a prospectus, please call 800-GABELLI or visit www.gabelli.com
Distributed by G.distributors, LLC., a registered broker dealer and member of FINRA.
This whitepaper is not an offer to sell any security nor is it a solicitation of an offer to buy any security.
For more information, visit our website at: www.gabelli.com or call: 800-GABELLI
800-422-3554 • 914-921-5000 • Fax 914-921-5098 • info@gabelli.com
Gabelli Funds, LLC is a registered investment adviser with the Securities and Exchange Commission and is a wholly owned subsidiary of GAMCO Investors, Inc. (OTCQX: GAMI).