US Utilities – Global Arms Race vs Race to Net-Zero
In 2024, the S&P Utility Index (SPU) returned 23.4% compared to the S&P 500 Composite’s return of 25.0%. (See Table 1). The SPU performance was led by independent power producers, including Constellation Energy (CEG; +93%), Vistra (VST; +261%; added in May of 2024), NRG Energy (NRG; +79%), and PS Enterprise Group (PEG; +43%), which surged on excitement over the potential for artificial intelligence (AI) data center power demand. Regulated utilities also benefitted from enthusiasm about future higher electric sales, moderating inflation and lower short-term interest rates. The median utility stock return was more muted as the 15-stock Dow Jones Utility Average returned 15.2% and the median of our universe of 50 regulated utilities returned 14.0%.

In 2025, we expect utility stocks to benefit from structural tailwinds of accelerated electric demand, infrastructure investment and stronger EPS growth. The US is in a global ‘arms race’ for AI superiority which requires massive new power hungry data centers. The mega-cap tech companies (hyperscalers) including MSFT, GOOG, META, and AMZN are aggressively courting electric utilities to build the infrastructure to power mega-data centers, some of which use as much power as small cities. In addition, ongoing electrification and manufacturing on-shoring are adding to electric demand. The utility and power sectors are shifting to a growth mode to try to keep up with demand.

The first wave of winners was the merchant or non-regulated power companies. Regulated electric utilities represent the second wave and will benefit from selling existing power capacity, adding power capacity (including batteries) and upgrading/expanding the transmission and distribution network. Policymakers support the investment and want de- carbonization, renewable energy and conservation. The new administration is likely to support a more economical approach to clean energy, which means more gas-fired generation, delayed coal-retirements, nuclear development, and ongoing renewable development. We expect the relaxation of some environmental and regulatory rules to help “green light” an ”all of the above” power development strategy. The confluence of these dynamics could help drive utilities to even higher EPS growth than current 5-8% CAGR targets.
TOP TEN REASONS TO OWN UTILTIES: VERGE OF POWER SURGE
1) Electric demand growth to accelerate driven by data centers, electric vehicles and manufacturing onshoring
2) Hyper-scalers (AMZN, MSFT, GOOG, META) need power and power infrastructure to support massive data centers
3) Policy makers (politicians, society) supportive of infrastructure investment because AI is considered a national security and defense issue
a. New Administration to ease environmental rules and regulations
b. Societal push for clean energy to continue and Inflation Reduction Act/Net Zero standards to drive clean energy investment for decades
4) Long runway of rate base investment (infrastructure investment)
5) Consolidation/Takeover could accelerate due to existing assets being more attractive
6) Healthy earnings and dividend growth potential (5-7%) could ramp up
7) Reasonable valuation of 17x 2025 P/E multiple
8) Competitive current return of 3.5%
9) Financial engineering, including ongoing consolidation and simplification
10) Potential for lower interest rates & economic slow-down: Defensive profile with fuel and inflation cost- recovery
CONCERNS
– What if AI is over-hyped?
– Potential for higher interest rates
– More equity raises to fund growth
– Some utilities could mismanage growth
– Weather event risks (hurricanes, wildfires, ice storms)

MACRO UPLIFT? – FED CUTTING RATES; ELECTION RHETORIC OVER SOON
Utility stock performance is inversely correlated with the outlook for interest rates. In 2024, the Ten-Year US Treasury Yield rose to 4.6%, from 3.9% at year-end 2023, and the entire yield curve remains elevated relative to the past two- decades. On December 18, 2024, the Fed lowered its overnight rate by 25-basis points to 4.25-4.5% and has now lowered 100-basis points from 5.25-5.5% in early September 2024. Future cuts will depend on the data, but expectations are for just two rate cuts in 2025 (50-basis points each), two in 2026 (total 50-basis points) and one in 2027 (25-basis points), which would leave rates at 3.1% by year-end 2027. A lower yield curve would benefit utilities via lower capital raising costs, higher valuations, and some customer bill mitigation. Further, the lower short-term US treasury yields would improve the defensive appeal of utility stocks and their 3.5% median current returns (9-11% total returns).

TRUMP ENERGY STRATEGY: WE THE PEOPLE, NEED THE POWER!
We agree with consensus (utility executives & power industry players) that the transformation to a lower-carbon economy will continue in earnest, despite negative campaign rhetoric regarding clean energy subsidies. However, clean energy indices (ICLN -15% and TAN -20%) and renewable developers (NEE -8% and AES -17%) have underperformed since November 5, 2024. We expect the Trump-Republican administration to take an economic approach to energy and decarbonization, including minor changes to the 2022 Inflation Reduction Act’s (IRA). The important clean energy (wind, solar, and battery storage) tax credits are likely to remain intact because republican-led states benefit disproportionately (80%/20%) from the economic development and thin republican margins in the Senate (53-47) and House (217-215). In addition, wind, solar and battery storage are economical and easier to site, permit and build than fossil fuels. The existing gas-turbine supply chain wait is nearly 5-years. Further, clean energy has significant societal support, state mandates and corporate ESG backing. Finally, federal AI policy necessitates ALL OF THE ABOVE POWER. However, IRA uncertainty will likely continue until late 2025.
̶ Expect some, but minimal changes to the IRA: We would not be surprised if tax credit duration were shortened to 2032 (currently the earlier of 2032 or upon reaching net-zero goals). New offshore wind projects could be at risk, but existing projects under development are championed by the states (VA, CT, NJ, NY, MA) and will likely move forward. Retroactive changes to under construction projects seem unlikely and the IRS’s “safe harbor” provision allows projects that have begun work (undertaken >5% of the project cost) to qualify for tax treatment under existing law. Many developers have “safe-harbored” equipment which allows tax credits to be applied for 5-years. Although, the IRA’s subsidies for transportation and electric vehicles could be at risk.
̶ Some streamlining to the Federal Energy Regulatory Commission (FERC): Trump said he wants to expedite federal permits and environmental reviews for construction projects worth more than $1 billion. The new administration will name one of two sitting Republicans Chair the of the FERC, which oversees siting of interstate gas and LNG projects as well as wholesale power markets. The electric and gas sectors would like to see an easier process to site, permit and build electric transmission, gas pipelines and new power plants.
̶ Expect some easing of EPA Rules: The Supreme Court recently over-turned the Chevron-doctrine, which could minimize some of the EPA’s environmental rules and regulations. The EPA’s April 2024 New Standards required future gas plants that run more than 40% of the time to use carbon capture by 2032 (gas peakers would not be impacted) and coal plants to use carbon capture covering 90% by 2032 if they plan to operate beyond 2039 or convert to 40% natural gas co-firing by 2030. A more realistic standard would lead to more gas-fired capacity and allow the postponement of coal plant retirements and help meet power demand.
DATA CENTERS MOVE FROM TALK TO REAL DEALS
After two decades of flat growth, US electric demand is on the verge of an acceleration not seen since the implementation of new appliances and central air conditioning in the 1950-70’s. (See Exhibit 3)

Most industry experts (consultants, investors, analysts, utilities) expect electric demand growth to accelerate, but nobody really knows by how much and the demand outlook keeps getting stronger. The rise of artificial intelligence is supercharging data center growth. The investment community began hearing about ‘mega-data centers’ ~eighteen months ago and over the last few quarters, numerous utilities began signing MOU’s, service agreements and filed with state PUC’s
to add new power as well as special data center/large load tariffs. Datacenters accounted for about 4.4% of US power demand in 2023 and could consume as much as 12% of the country’s electricity in 2028, according to the US Energy Department (12/20/2024). By 2028, AI servers will account for at least two-thirds of datacenters’ energy usage. AI chips consume about 10x more energy than traditional datacenter chips. Some utilities (ETR, WEC, XEL, AEP, SO, LNT, IDA, etc.) have raised sales growth rates and capital budgets to build generation and networks to keep up with demand.

We estimate that electric demand growth will approximate 2.0-2.5% (GDP growth minus efficiencies) in 2024-2025 and accelerate to 3-4% in 2026-2028 driven by more and larger data centers, EV-adoption and on-shoring activity. The electric utility sector was planning for electrification (EVs) and some manufacturing growth, but the more sudden and aggressive appetite from data centers is a significant wildcard variable.

HIGHER SALES-HIGHER CAPITAL INVESTMENT-HIGHER RATE BASE GROWTH! HIGHER EPS?
We expect higher sales and rate base growth to lead to higher EPS growth. Based on Thomson One consensus EPS estimates, utilities are expected to grow EPS 6.7% over 2023-2026. Following third quarter 2024, managements of 18 utilities target “5-7%” EPS CAGR, 14 target “6-8%”, 3 target “7-9%”, and 2 target “6-7%”. PCG and CEG target 9% and 10% growth, respectively (Table 2). Most utilities managements have been able to offset the higher cost of capital, rising capital expenditures and inflation with costs controls. Accelerated electric demand growth would further support (even enhance) EPS CAGR targets.
On October 31, 2024, Entergy (ETR) raised its EPS growth rate for the years 2026-2028 to 8-9%, from 6-8%, and the stock price rose from $60 to $75 (split-adjusted). On the same day, XEL also raised its EPS CAGR to 6-8% from 5- 7%. ETR and XEL are the only two electric utilities to have raised EPS CAGRs on the data-center theme, but others appear to have tailwinds necessary to raise expected growth rates over the next few years.


MORE ON THE POWER SURGE; NUMBERS KEEP GETTING BIGGER
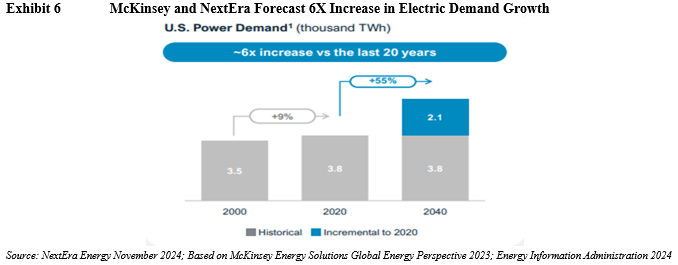
Electric demand grew 9% from 2000-2020, and McKinsey and NextEra Energy forecast 55% power demand growth over the next two decades. According to McKinsey, the US is expected to be the fastest-growing market for data centers, growing from 25 GW of demand in 2024 to more than 80 GW of demand in 2030. The power industry does not have a clear understanding of how much demand will come from data centers as they are getting bigger and becoming more power intensive.
Over the past two years, the five-year forecast (2024-29) for cumulative electric demand growth increased from 2.8% to 15.8% and the 5-year load growth forecast has increased from 23 GW to 128 GW, according to consulting firm Grid Strategies’ (December 2024) update report. The consulting firm notes that industry forecasts for data center growth vary from 65-90 GWs, and sales forecasts includes manufacturing growth of 20 GWs and other sources, including electrification, adding another 20 GWs.

The following is an excerpt from the North American Electric Reliability Council’s (NERC’s) recent Long-Term Reliability Assessment (December 2024):
“Electricity peak demand and energy growth forecasts over the 10-year assessment period continue to climb; demand growth is now higher than at any point in the past two decades. Increasing amounts of large commercial and industrial loads are connecting rapidly to the bulk power system (BPS). The size and speed with which data centers (including crypto and AI) can be constructed and connect to the grid presents unique challenges for demand forecasting and planning for system behavior. Additionally, the continued adoption of electric vehicles and heat pumps is a substantial driver for demand around North America. The aggregated BPS-wide projections for both winter and summer have increased massively over the 10-year period.”
The world’s largest datacenter market is in Dominion Energy’s Loudoun County, VA service area where ~100 datacenters require over 4 GWs of capacity. Favorable areas for data centers are in areas with ample power capacity, excess transmission and strong fiber networks, including Northern VA, Silicon Valley CA, Texas (Dallas, Houston, Austin), Phoenix, AZ, Atlanta, GA, Pennsylvania, and Portland, OR. Hyper-scalers are exploring locations with nearly every utility across the US and want/need to move quickly. Many are developing locations in newer markets because these areas are less expensive and have infrastructure (IA, WY, IN, and OH have recently secured large data centers).
Proposed data centers are significantly larger (some greater than 1,000 MWs) than existing data centers (10-50 MWs), and require more infrastructure, including reliable power (24/7/365), grid access and grid redundancies. They would prefer to be near dedicated zero-carbon power plants (nuclear/wind/solar/battery storage), which makes nuclear plants ideal. However, traditional regulated utilities own most of the nation’s nuclear plants and cannot be “pulled’ from customers to sell directly to hyper-scalers.

US manufacturing on-shoring (computer chips and batteries) is also driving higher electric demand and is aided by incentives encouraging domestic content under the IRA and CHIPS Act. In March 2024, Intel announced $8.5 billion in funding to build “fabs” in AZ, NM, OH and OR and in April 2024, TMSC announced $6.6 billion in funding to build a third “fab” in AZ. Micron is building a $15 billion facility in ID. In addition, oil and gas production and hydrogen fuel plants could further drive demand.
Electrification, the public policy movement to replace technologies or processes that use fossil fuels (gas furnaces, boilers, internal combustion engines) with electrically-powered equivalents, such as electric vehicles (EVs) or heat pumps, will also drive higher electric demand in some regions. The New England grid operator ISO expects heating electrification to turn the regional grid into a winter-peaking system sometime in the mid-2030s.
-In October 2024, the Edison Electric Institute (EEI) forecasts electric vehicles on U.S. roads to reach 78.5 million in 2035, up from 4.5 million at the end of 2023 and to represent 26% of the 300 million total vehicles (cars and light trucks) on U.S. roads in 2035. Approximately 42.2 million charge ports and 325,000 DC fast charging ports will be needed to support the 78.5 million EVs.

MAYBE IT’S ALL HYPE? “BOTTOMS UP” INDICATE INFLECTION POINT IN 2027
The pending power boom dominates industry discussion, but the 2024 EIA energy outlook forecast only 3% U.S. generation growth in 2024 and 2% in 2025. Skeptics point to previous eras of expected demand growth tied to newer technologies, such as smartphones and internet usage which failed to materialize. Some argue that utilities might be double-counting future loads from datacenter developers shopping around service territories. Again, big-tech is in an arms race and set to spend billions (See exhibit 10) to build power-intense datacenters. Hyper-scalers and manufacturers require lead-time to secure locations, grid connection, power contracts, permit and construct facilities. Sales growth likely begins in 2026 and surges in 2027-2030.

In the next section, we highlight numerous “jaw-dropping” announcements by electric utilities across the nation (excluding the Northeast and New England). To provide perspective on the sheer size of the announced deals, we refer to XCEL Energy (XEL) which highlights that a 1 GW datacenter is equal to 1 million customers and requires around 3GWs of renewable and firm dispatchable energy. Most hyperscalers require renewable power to at least offset any carbon footprint, which explains why 3 GWs are needed to support 1 GW data centers.
– On October 31, 2024, Entergy raised its EPS CAGR to 8-9% through 2028 from the 2023 guidance midpoint and raised its industrial sales growth to 11-12% CAGR (from 8-9%) through 2028. In December 2024, Meta disclosed its plans for a $10 billion data center in Northeast LA.In January 2024, Amazon Web Services (AWS) announced a $10 billion data center in MS. The utility is in discussions with 5-10 GWs of data centers and 7-11 GWs of other industrial customer growth. ETR plans to build three combined cycled gas plants (2,265 MWs of capacity) and 1,500 MWs of renewables to serve the Meta load.
ETR raised its 2024-28 capital budget by $7 billion incremental to $33 billion ($3 billion equity) and is exploring nuclear expansion, including potential power uprates up to 300 MW and SMR technology evaluations. The residential bill increases are expected to be 3.5% CAGR, down from 4.0% previously, aided by spreading fixed costs over higher sales. Meta is providing funds to reserve equipment, pay for the power, and finance transmission lines to the plants. In addition, Meta will pay a minimum monthly charge that will cover “the full annual revenue requirement for the planned generators” for 15 years, along with transmission costs and several other charges.
– Over 2015-24, Dominion Energy (D) added 6.1 GWs of new data centers, including 14 (949 MWs) YTD and expect to connect 16 (91 MWs) for a total in 30 data centers (1,040 MWs) in 2024. D has agreements to add 21.4 GWs of data center capacity over the next few years. The utility forecasts for power demand growth of 5.5% annually for the next decade and to double by 2039. To meet growing demand, D filed 2024 VA Integrated Resource Plan and includes an “all-of-the-above” approach with ~27 GWs of additional resource capacity including 5,934 MWs of natural gas between 2030 and 2036, 6 GWs of new offshore wind (2.6 GWs already in development), 12 GWs of new solar, and about 4.5 GWs of new battery storage. The company also plans to deploy five small modular nuclear reactors (SMRs) starting in the mid-2030s, for a total of 1,340 MWs.
– On its third quarter call, Southern Company (SO) forecast projected electric load growth of ~6% from 2025 to 2028 driven by strong economic development. Georgia Power’s potential load additions and development pipeline have grown to over 36 GWs by the mid-2030s, with 8 GWs committed. SO targets EPS growth of 5-7% supported by projected state-regulated electric and gas utility rate base growth of 6%.
– On its third quarter call, American Electric Power (AEP) outlined its 2024-27 sales forecast, including total retail sales growth of 3.5%, 8.3%, 8.4% and 8.9%, respectively, driven by commercial sales growth of 11.1%, 23.2%, 19.0% and 16.1%. In 2021-23, AEP total retail sales growth was 2.1%, 2.8%, and 2.5%, respectively. AEP is negotiating requests for 10-15 GWs of incremental load by 2030. Customer commitments for 20 GWs of load through 2029 driven by data center demand and economic development. AEP 2025-2024 resources needs total 21 GWs and plans 6.2 GWs of solar, 4.3 GWs of wind, 1.2 GWs of storage, and 8.9 GWs of gas. AEP’s 2025-29 capital program totals $54 billion and the company targets 6-8% EPS CAGR.
– XCEL Energy (XEL) outlines strong sales growth with further upside from data centers 8,900 MWs of data center requests (2.6% sales CAGR). XEL highlights that 1 GW datacenter is equal to 1 million customers, ~ 3 GWs of renewable and firm dispatchable energy. $6-8 billion of investment requirement, $0.9-1.0 billion of incremental revenues and 10% customer savings. XEL’s base capital plan of $45 billion, reflecting 9.4% rate base growth, and could be increased by $10 billion, includes new CO generation (5-10 GWs from 2028-2031), MN generation (5 GWs 2025-2030) and TX (5-10 GWs).
– In November 2023, WEC Energy Group (WEC) raised its 2026-28 annual electric demand growth forecast to 4.5-5.0%, from 0.7%, to reflect data center and technology demand. Microsoft began construction of at least a $3.3 billion data center near a science/technology Innovation Park south of Milwaukee. MSFT owns 1,900 acres in the technology park and is developing a significant data center among other “yet-to-be announced” facilities. WEC has added 1,400 MWs to its generation plan but will likely need more given expectations for more announcements. WEC’s 2025 EPS guidance of $5.17-5.27, represents a ~7.5% increase from the midpoint of the ’24 EPS guidance range of $4.80-4.90. The utility targets 6.5-7.0% EPS CAGR.
– In early November 2024, Alliant Energy (LNT) disclosed electric service agreements with two “prestigious” data centers (1,100 MWs of power capacity) at the Big Cedar Industrial Center Mega-site in Cedar Rapids, Iowa. The new individual customer rate (ICR) tariff spread costs over larger base of sales. The data centers are expected to come on line in 2028 and boost IPL’s peak demand by over 20%. IPL’s peak load is 3,000 MW’s. A secondphase would come on-line by 2030. LNT presented a 2024-2032 Electric Sales Growth CAGR of 3-5% under a 1,000 MW scenario (also has a 2-4 GW scenario) but expects normal 0.5-1.0% growth in 2025-2026 with more significant ramps in 2027-2029. LNT is currently negotiating with other data centers negotiating in and has various development-ready sites.
– In its 2025 integrated resource plan (IRP), IDACORP (IDA) raised its 2025-2029 load growth expectation to +7.7% and it could be higher pending two possible large high-energy users who have not finalized agreements. IDA does not provide EPS growth targets but raised its rate base CAGR to an “industry-leading” 16.9% (from 10.8% rate base CAGR). IDA’s 2023 rate base grows from $4.2 billion to $9.5 billion by 2028. Notable growth activity includes Micron’s expansion of its Boise headquarters and new $15 billion microchip fab facility (a Meta data center), and $415 million Lamb Weston potato processing facility.
– PPL Corp (PPL) – PPL-PA has signed advanced stage agreements for ~8 GWs with data centers, including many to come on-line in 2026-2028, representing potential transmission capital upside of $600-700 million. The utility is in active discussion with 31 GWs of potential projects over 2026-2034. PPL notes that 1 GW connected reduces transmission costs on the retail customer bill by about 10% (~2% of total bill or $3 per month). In KY, the utility has active data center requests of more than 3 GWs over 2026-2034, with 400 MWs in advanced stages. Formal project announcements/capex upside is expected later this year or early next year with transmission projects coming online in the 2026-2028. PPL-KY expects to need additional generation and is adding one 620 MW gas plant in 2027 and asking to add another one CCGT in 2030 and 2031 as well as significant solar and battery storage. The IRP outlines the need for 2,700-3,200 MWs of new natural gas, solar and battery storage through 2039. Potential generation needs may require capital investments ranging from $6-7 billion through 2035.
– Pinnacle West (PNW) benefits from a growing AZ economy (Phoenix is second-largest data center market). Large commercial/industrial customers account for 3-5% of the 4-6% long-term weather normalized sales growth guidance. PNW is committed to 4,000 MWs of data centers and backlog of 10 GWs of requests.
– Evergy (EVRG) continues to negotiate 6 GWs of load growth, including more than 3 GWs of data center growth. EVRG has signed projects representing over 750 MW of load; Google ($1 billion data center/2028), Panasonic ($4 billion EV battery manufacturing plant/2026) and Meta ($800 million data center/2027). EVRG forecasts 2- 3% annual load growth through 2028 (back-end loaded) and plans to add 4,500 MWs (1,950 MWs of solar, 1,250 MWs of wind and 2,455 MWs of hydrogen-capable gas) and retire 1,900 MWs of coal from 2023-2032. Two combined-cycle gas plants are expected to come on-line in 2029-2030. The utility’s 2025 EPS guidance range is
$3.92-4.12 (from 2024 guidance of $3.73-3.93) and the top half of 4-6% CAGR.
– NorthWestern Energy (NWE) announced plans to provide electric supply 75 MWs of service to Altas Power Group at its Butte, Montana data center beginning in 2026, with forecasted growth of up to another 75 MWs in the subsequent 3-5 years. The announcement follows a separate agreement to provide 50-MW’s (growing to 250- MW’s) of energy service for a developer planning new data centers in MT. NWE recently added the Yellowstone gas plant and expects buy a larger ownership interest in the Colstrip Plant beginning January 1, 2026.
– Several other utilities are seeing growing interest from large customers and data centers, including Exelon, Ameren, OGE, DTE (1.4 GWs with Switch).
GROWING LOAD CAN HELP IMPROVE AFFFORDABILITY
Megatech/Hyperscalers are desperate for locations to site and power these enormous power-hungry facilities and have agreed to “pay their fair share.” Some states like Iowa (LNT) and Ohio (AEP) have designed special tariffs to account for large customers and ETR’s agreement with requires Meta to provide funds to reserve equipment, pay for the power, and finance transmission lines to the plants. In addition, Meta will pay a minimum monthly charge that will cover “the
full annual revenue requirement for the planned generators” for 15 years, along with transmission costs and several other charges. Regulated utilities and retail customers (residential & commercial) benefit from higher sales and revenues, but also by spreading fixed costs over a larger sales base. In Exhibit 11, PG&E (PCG) outlines that its expected additional data centers would lower customer bills by 1-2% and electric vehicles by an additional 2-5%.

US POWER EQUATION SEEING COAL RETIREMENTS
In 2023, the US had ~1,200 GWs of power capacity, including 215 GWs of renewables (74 GWs of utility-scale solar (6%) and 141 GWs of wind capacity (12%). Natural gas represented 42% of output, nuclear 19%, coal 17%, wind 11%, hydro 6% and solar 4%. Over the past decade, less-efficient nuclear (13 retirements since 2013), coal and gas power plants were retired and replaced with highly efficient natural gas plants and renewable generation. Based on planned retirement schedules, coal’s rapid decline will continue, and all new capacity will be renewable, battery- storage and/or natural gas-fired (excluding the 2.2 GWs Vogtle nuclear expansion scheduled for 2023-24).

In 2025, EIA forecasts natural gas will represent 41%, coal will decline to 15%, while nuclear contributes 19%, wind 11%, solar to 7% and hydro 6%.
NERC SOUNDS THE ALARM; POWER DEMAND TO EXCEED SUPPLY
More than one-half of North America faces a risk of energy shortfalls in the next 5-10 years as data centers and electrification drive electricity demand higher and retirements threaten resource adequacy, according to the North American Electric Reliability Corp 10-year outlook (2024 Long-Term Reliability Assessment – December 2024).

The LTRA recognizes 52 GW of confirmed power plant retirements by 2029 and 78 GW over the 10-year assessment period. Retirements total 115 GW by 2034 and the power is primarily being replaced by “intermittent and variable” generation. NERC’s forecast peak reserve margins (the cushion between supply and peak demand) fall to concerning levels across the US. Further, more frequent and extreme weather events impact record peak demands in many regions.
WHO HAS “NON-REGULATED POWER’ TO SELL?
Independent Power Producers (IPPs), or merchant generators, are the most leveraged to potential supply shortages. IPPs/merchants own power plants in non-regulated power markets, including PJM (Northeast/MidAtlantic), ERCOT (Electric Reliability Council of Texas), and CA, and provide marketing/power management services to customers. In 2023-24, the share prices of CEG, NRG, VST and TLNE have risen dramatically. Table 3 for financial and market data.

Texas (ERCOT) expects to continue to see well-above average load growth and Winter Storm URI highlighted the potential power and gas price volatility that could benefit merchant power players. Given favorable subsidies and contracts, nearly 30% of state capacity is intermittent renewable energy. ERCOT projects reserve margins to get extremely tight, and the state legislation created the Texas Energy Fund (TEF) to encourage more reliable gas-fired generation. TX regulators approved 17 (out of 72 applicants) to add 38 GW’s of generation and 11 have filed for the interconnection cue by 2028, including ~450 MW plants by each VST, NRG, and CEG. The TEF is set-up to cover 10 GWs but legislators are considering expanding the program. See below for largest owners of merchant power plants:

IPPs and merchant power companies have higher risk than utilities and are highly correlated to commodity prices (power prices). Since 1995, the sub-sector of IPPs has experienced “boom-bust” periods and bankruptcies of key players, including AES, Enron, Dynegy, Mirant, Calpine, NRG, Talen. As a result, private equity owns many of the nation’s non-regulated power plants. Further, regulatory frameworks have evolved to promote cleaner energy and lower carbon emissions, which hampers the long-term value of fossil-fired IPP assets. IPP’s/merchants are likely to benefit from a favorable supply – demand scenario for several years.
THE NUCLEAR OPTION SEEMS THE BEST BUT SEVERAL YEARS OUT
We expect a Nuclear Renaissance to occur over several decades with the support of federal, state and local governments, and, importantly, the megatech companies. Nuclear power is the most reliable form of power generation with capacity factors normally over 90% (meaning they run nearly all year long) and have a near zero carbon footprint. AMZN, GOOG, MSFT and META are pursuing nuclear power to fuel data centers and their financial resources offer enthusiasm for a nuclear revival.
Nuclear power represents roughly 19% of total US power generation. The US has 93 nuclear reactors (54 plants) in 28 states that generate roughly 19% of the nation’s power capacity, which compares to 104 nuclear reactors in 2013 and 20% of total US generation. Prior to the 2022 IRA, several older nuclear units retired as low gas prices (and therefore power prices) made them uneconomic. However, the IRA provided a floor price via production tax credits of ~45/MWH and an increased focus on data center/zero carbon power has breathed new life into the future of nuclear power.
Challenges of building new nuclear capacity are significant and there have only been two nuclear units built in US over the past 40-years. Southern Company’s Georgia Power’s Vogtle Units 3 and 4 (2023 and 2024) were the first new nuclear units to come online in the U.S. since Palo Verde (AZ) in the 1980s (TVA’s Watts Bar – 2016 excluded). Approvals from the Nuclear Regulatory Commission (NRC), permitting, planning, and construction take several years, and the costs are often underestimated. Vogtle Units 3 &4 were originally scheduled to be completed by 2016 and 2017, respectively, at a cost of $14 billion total. The final price tag was $30 billion, more than $16 billion over budget, and over six years behind schedule.
The US probably will not add a large sale nuclear plant for some time, but existing nuclear plants will seek license extensions and some recently retired plants could return to service. The existing non-regulated nuclear plants (depreciated and written-down) have suddenly become extremely valuable. There are roughly 40 GWs of non-regulated nuclear power plants owned by CEG, VST, PEG (3), NEE (2), TLN (1) and D (1). In addition, recently (within 5- years) retired plants Three Mile Island Unit 1, Palisades, and Duane Arnold are being evaluated to bring back on-line. Diablo Canyon which was scheduled for 2025 retirement license has been extended. Further, the appetite for zero carbon power increases the likelihood that small nuclear reactors (SMR’s-300-MW‘s) become a reality. SMRs modular design is supposed to simplify construction, reduce timelines and require less land. The Department of Energy (DOE) could support/backstop multiple new plant developments.
Recent important nuclear announcements:
– Susquehanna and AMZN: On March 4, 2024, Talen (TLN) announced a deal to sell its digital infrastructure campus (data center and crypto mining facilities) to Amazon Web Services (AWS) for $650 million. The campus is adjacent to its Susquehanna nuclear plant (2,200 MWs) near Berwick, PA, which would allow TLN to directly supply 960 MWs of zero-carbon power to the campus. AEP and EXC requested FERC rulings regarding potential cost shifting (pulling load of system) that harms utility customers. The agreement highlights the value of merchant power plants (especially nuclear) as hyper-scalers are less price elastic and contract directly.
– Three Mile Island Unit 1 and Microsoft: On September 20, 2024, Constellation Energy (CEG) announced a 20-year power purchase agreement with Microsoft to restart Three Mile Island Unit 1 (renamed Crane Clean Energy Center), a nuclear power reactor near Harrisburg, PA, shut down in 2019. The deal will supply Microsoft’s data centers in the region, and includes $1.6 billion investment to restore the plant, such as the turbine, generator, main power transformer and cooling and control systems. CEG is pursuing Nuclear Regulatory Commission (NRC) approval and license renewal with hopes of 2028 restart.

– Palisades: In September 2023, Holtec International signed a long-term PPA with Wolverine Power cooperative and Hoosier Energy to repower the Palisades (800-MW/Covert MI) shut down in May 2022. The restart has support from the State of Michigan and the US DOE. The agreement could include up to two small modular reactors (SMRs rated at 300 MW each) that Holtec intends to build and commission at the Palisades site. In early 2023, Holtec submitted a loan application with the U.S. DOE for federal loan to repower Palisades.
– On October 14, 2024, Alphabet signed an agreement with Kairos Power, a nuclear power developer, to build and operate a 500 MW fleet of small advanced reactors by 2035, with the first targeted to come online in 2030. The plants would be strategically located near Alphabet’s data centers.
– In October, Amazon revealed a $500 million investment in X-energy, an SMR developer, as part of a longer- range partnership between the two companies to deploy up to 5 GWs of new nuclear power projects by 2039. AMZN also signed an agreement with Energy Northwest (consortium of state public utilities) to develop four 80 MW Xe-100 SMRs deployed at the Columbia Generating Station in Richland, Washington, with the potential for up to 12 reactors at the site totaling 960 MWs of capacity. Amazon may separately deploy an SMR with at least 300 MWs of generating capacity near Dominion Energy’s North Anna nuclear power plant in VA through a memorandum of understanding.
– On December 3, 2025, Meta announced an RFP for 1-4 GWs of new nuclear in the U.S. coming online starting in the early-2030s. Initial proposals are due February 7, 2025, open to both large-scale and SMR proposals. Meta has contracted for over 12 GWs of renewable energy worldwide and has “matched global operations with 100% clean and renewable energy” since 2020.
– On December 18, 2024, Oklo announced a non-binding Master Power Agreement with Switch to supply 12 GWs of Oklo’s Aurora Powerhouse projects through 2044. Switch is a provider of AI, cloud and enterprise data centers; in a press release, Switch data centers have been powered by 100% renewable energy 2016.
Several SMRs are in development and hope to be commercially viable in the early 2030’s, including by the following: NuScale (SMR), GE-Vernova (GEV), OKLO (OKLO), Kairos Power, Terra Power, Holtec, BWXT Technologies and X-Energy. Westinghouse Joint venture with Cameco (CCJ) and Brookfield (BEP/BEPC)
On October 16, 2024 the DOE opened applications for next-generation nuclear technologies, offering $900 million for domestic deployment of SMR technologies. Applications are due January 17, 2025. The hyperscalers focus on new nuclear and could be helpful to act as a cost overrun risk backstop and support the financing as off-takers via higher rates/tariffs.
NATURAL GAS: ‘RUMORS OF MY DEMISE WERE GREATLY EXAGGERATED’
In 2024, Energy Information Administration (EIA) projected that more than 40% of delivered natural gas would be consumed by power generators and natural-gas-fired power plants would generate roughly 42% of the 2024 electric power. The 2024 LTRA projects that an additional 6,500 MWs of new natural-gas-fired generation will be added over the next five years and over 10 GWs in the next ten years. We expect that number to rise materially. Over the past several years, new natural gas plants have fallen out of favor and leading manufacturers (GE/GE Vernova, Siemens and Mitsubishi) stopped making them. However, new gas-fired turbine orders are on the rise and the wait list is now nearly 5-years to COD.
To address the growing risk of shortages, NERC recommends new gas capacity and transmission investment. In PPL’s latest IRP, it outlined the need for 2,700-3,200 MWs of new natural gas, solar and battery storage through 2039. The utility recently began construction of the 600 MW Mill Creek Unit 5 combined cycle gas (hydrogen ready) plant (COD 2027) and asking to add another one CCGT in 2030 and 2031 as well as significant solar and battery storage. PPL’s construction cost estimates for new generation are as follows:
– Peakers: gas simple cycle ($1,500/kW)
– Combined-cycle gas-CCGT ($2,121/kW), solar ($2,108/kW)
– Battery storage ($2,160/kW)
– SMR’s would be over $7,000/kW
We estimate that new utility scale renewables would be:
– Wind ($2,500/kW) before 30% investment tax credit
– Solar ($2,400/kW) before 30% investment tax credit
THE US PLANS TO ADD LOTS AND LOTS OF WIND, SOLAR and BATTERIES
Over the past two decades, renewable power technology and economics have improved dramatically. In addition, the 2022 Inflation Reduction Act (IRA) provides tax incentives to encourage accelerated clean energy investment through at least 2032. NEE highlights that renewables are lower cost (Onshore wind $25-50; Solar $40-60; CC gas $70-85; SMR
$115-140; CC Gas with CCS $115-125) than other types and can be deployed quicker. As such, NEE expects US renewable output to represent 43% of total fuel mix by 2030 (from 18% today).

Near-term challenges of adding nuclear and natural gas power combined with increasing renewable portfolio standards and growing demand makes for a very favorable renewable development market. Renewable developers (AES, NEE/NEP) have substantial opportunity to add wind, solar and battery storage and at enhanced margins. Most states have zero-carbon, low-carbon and clean energy standards. Hyper-scalers (Amazon, Meta, Alphabet) require reliable (24/7), zero-carbon power (nuclear/wind/solar/battery storage) and electricity consumed is matched with clean energy.

As of April 2024, proposed new capacity for 2024-2028 totaled 370 GWs (63% solar, 26% wind, and 9% gas). Another 130 GWs of energy storage, including 72.8 GWs of battery storage, is expected 2024-2028.

According to NERC’s LTRA, solar is the overwhelmingly predominant generation type being added, followed by battery, natural-gas, and wind. Batteries are now the second most predominant resource in the interconnection queues. Wind and solar power are intermittent with capacity factors between 30-50% compared to gas and coal, which are much higher. As a result, more renewable capacity is needed to replace retiring coal and gas-fired power. NEE forecasts that US total power capacity (all sources) needs to nearly double from 1.2 TWs in 2020 to 2.1 TWs by 2040.

Based on NERC’s previous capacity planning analysis, the amount of capacity to be added is growing, but a lot of it will not reach completion. Some projects that are in the earlier stages of the interconnection queue process will be withdrawn before completion due to supply chain issues, planning and siting challenges, and business or economic factors.
S&P Global Market Intelligence data (12/20/2024) shows that cumulative US solar generating capacity grew 18.3 GW, or 35%, over twelve-months ended 9/30/2024, with more than 116.6 GWs of capacity in operation. Through 2028, developers plan to add 232.2 GWs of additional solar capacity. That includes 39.3 GWs under construction (>450 projects).

S&P GMI data (12/20/2024) cumulative wind show 157 GW of US wind in operation, but only 3.9 GW added over the twelve-months ended 9/30/2024. The pace of new wind projects has slowed since 2020 as renewable energy developers focus on solar and storage projects. Through 2028, project developers expect about another 68.5 GW of wind projects, including offshore projects have federal permits and under construction (Sunrise Wind I & II and Revolution Wind farms in 2026).

WHO’S BUILDING THE CLEAN POWER?
All regulated utilities are adding renewable power (wind, solar and battery storage), but normally go through a competitive bidding process among developers. The utility then enters into a purchased power (PPA) agreement with the renewable developer or buys the project.
NextEra Energy (NEE) is the largest renewable owner (35 GWs) and expects to add 36.5-46.5 GW’s over 2024-2027 of renewables/storage, including 2024-25 14.1-17.1 GW’s (7.4-8.3 GW’s solar/3.5-4.4 GW’s of wind; 2.6-3.5 GW’s of storage) and 22.4-29.4 GW’s in 2026-27 (5.5-7.1 GW’s wind; 11.1-14.1 GW’s of solar; 5.2-7.2 GW’s storage. Other large owners, include AES Corp (owns 18 GWs; 13 GW backlog; and 66 GW project pipeline), Berkshire Energy, Brookfield, and Iberdrola/Avangrid and private developers Invenergy, Apex, and Hecate.

LONG WAITING LIST TO CONNECT NEW POWER TO GRID
Power developers have aggressive plans but face long waiting lists (often 3-7 years) to interconnect to the grid. The transmission system was not designed to handle massive renewable additions, particularly given wind/solar intermittency. The ability to site new renewables is key to successful development, which entails not only finding locations where the wind/sun resources are strong, but near transmission/substation interconnections, and a constructive local planning council. NEE and AES highlight competitive advantages of scale, experience and access to technology, as well as importance of site locations.

RECORD INVESTMENT (RATE BASE GROWTH) YEAR-AFTER-YEAR LEADS TO EPS GROWTH
In 2024, EEI member electric utilities expect to invest $186.4 billion vs. $167.8 billion in 2023, which marks the twelfth consecutive year of record investment. Accelerated electric demand is leading to large increases in utility capital programs and rate base growth. Over the next several years, utility capital investment will continue to rise.
̶ Clean energy transformation (coal retirements, on/off-shore wind, solar, and storage).
̶ Electric transmission and distribution (grid modernization, hardening, undergrounding).
̶ Electrification, EV charging, efficiency, etc.

Investment is necessary across the board, including distribution ($51 billion, or 33%), generation ($37 billion, or 24%), transmission ($32 billion, or 20%), gas-related ($22 billion, or 14%) and other ($13 billion, or 8%). According to the DOE, almost 70% of electric infrastructure in North America is over 25 years old. Electric utilities are allocating a growing amount of capital to grid adaptation, hardening, and resilience (AHR) initiatives to make systems more resilient to hurricanes and wildfires.
Utilities have ample ability to fund through operating cash flow, stock and debt issuances. Credit rating agency metrics reflect monopoly service areas, regulatory financial protections and the ‘public good’ nature of the product/service. The industry’s average parent-level rating has held at BBB+ since increasing from BBB in 2014. However, the growing capital programs mean more equity will be issued over the next five years. Utility issuances can be accretive if issued above book value and regulators allow returns on the investment.


State Public Utility Commissions as Important As Ever For EPS Growth
Utility regulation generally remains supportive of investment, but some PUCs are more constructive than others ( Exhibit 20). Many jurisdictions have adopted changes to rate design, such as forward test years, rate mechanisms and adjustment clauses to allow timely recovery and return on costs associated with various capital investment programs (environmental, pipe replacement) and weather normalization. However, a handful of PUC’s have become “less-than- constructive”, including IL and CT. The allowed returns on equity (ROE) set by PUCs play a major role in utility earnings growth.

ALLOWED ROE’S TICKED UP “SLIGHTLY’ BUT ROE SPREAD TO RATES NARROWED
In 2023-24, rate case activity reached record-high levels driven by inflation, interest rates and growing utility capital spending plans. In higher rate states, affordability can become an important issue. A general rule of thumb is that State PUCs and ratepayers will tolerate 2 -4% bill inflation per annum and rate requests above that will be met with controversy.

In the first nine months of 2024, the average ROE authorized for electric utilities was 9.70% (37 rate cases) above the 9.60% (63 cases) average observed in full year 2023. In the first nine months of 2024, the average ROE authorized for gas utilities was 9.74% (21 cases) above the 9.64% (43 cases) average observed in full year 2023.
In 2023-24, utility allowed ROEs rose modestly as a function of interest rates after declining over the past 30-years. The spread between the allowed-ROE and the 10-year U.S. Treasury yield is currently 530-basis points, and it has ranged between 500-900 basis points over the past few years. During the 1990s, the utility sector averaged roughly 400-600 basis points spread. PUCs historically have taken a gradual and measured approach to changes in authorized ROE levels.

LONG TERM TRANSMISISSION PROJECTS EARN FERC FORMLA RETURNS
Investment in the electric grid has become a national infrastructure priority because its upgrade is required to support zero carbon power, reliability, sales growth and data centers. FERC regulated transmission projects are investor-owned utility priorities because of generally higher ROEs (set MISO at 9.98%; NE ISO is 10.57%) and favorable forward- looking formulaic rate treatment. In 2023, EEI member utilities invested $30.7 billion in electric transmission compared with $31.7 billion in 2022. NERC and the ISO’s are outlining several transmission opportunities. The Midwest Independent System Operator (MISO) is leading the transmission upgrade process with its $100 billion long- term planning projects (LTRP). In December 2024, MISO awarded/approved Tranche 2.1 $21.8 billion worth of projects. Tranche 1 (2022) transmission projects, totaling $10.3 billion and spanning IA, IL, IN, MI, MN, MO and WI. Winning bidders, included:
– Ameren (AEE)
– Xcel Energy (XEL)
– Fortis (FTS)
– WEC Energy Group (WEC)
The projects are expected to be in service in 2028-2032. LRTP projects help accommodate the influx of renewables needed to meet state and utility clean energy goals. In September 2024, the Texas PUC approved an ERCOT plan for roughly $13 billion in transmission investments and SPP ($7 billion) and CAISO ($6 billion). The ISO New England electric grid expects $1 billion in annual transmission investments through 2050 to support the clean energy transition and could still face potential resource adequacy challenges. Several Northwestern utilities (AVA, POR, ALE) have partnered in the $3.5 billion (COD 2029-2030) North Plains Connector with Grid United. The 415-mile transmission line connects Bismarck, ND and Colstrip, MT and can carry 3,000 MWs.
Over the next few years, we expect FERC to solidify numerous policy directives and incentives, including ROE methodology, transmission planning and the interconnect process, as well as the need to alleviate the clean energy logjam, and gas pipelines.
In addition, we expect Texas-based T&D utilities are likely to benefit materially from strong sales growth as the state’s constructive regulatory principles that provide semi-annual rate increases that result in stair-step EPS growth.
– TXNM Energy (TXNM)
– CenterPoint Energy (CNP)
– Sempra Energy (SRE)
Infrastructure Becoming More Valuable! Buyers Circling the Wagons;
In January 2024, BlackRock (BLK), the world’s largest asset manager agreed to buy Global Infrastructure Partners (GIP), the world’s largest infrastructure manager for $12.5 billion. Blackrock highlighted infrastructure as one of the most exciting investment opportunities owing to structural shifts, including de-carbonization, energy independence, domestic industrial capacity and on-shoring.
In 2024, Blackrock/GIP and other investment giants KKR & Co. Inc., Brookfield, and Energy Capital Partners LLC announced acquisitions of renewables platforms and utilities. Given accelerated power demand, energy infrastructure, (power generation, renewables, transmission, gas pipelines) has become increasingly valuable and development opportunities abound. Some recent announcements:
– On December 23, 2024, Iberdrola, (Madrid, Spain) closed on the acquisition of the last 18.5% ownership of Avangrid (AGR) for $35.75.
– On December 12, 2024, Energy Capital Partners closed on the purchase of Atlantica Sustainable Infrastructure PLC (AY) for $2.56 billion.
– On June 24, 2024, KKR acquired Emera’s interest in the Labrador Island Link, a 1,100 km high voltage transmission line in Newfoundland, Nova Scotia. In addition, KKR agreed to buy Germany’s Encavis (7 GW by the end of 2027) renewable developer for $3 billion.
– On May 6, 2024, GIP and the Canada Pension Plan Investment Board agreed to acquire ALLETE (ALE) for $67.00 per share in cash (18% premium), or $6.2 billion including the assumption of debt. ALE owns/operates/develops renewables and multi-billion opportunities to build transmission assets.
– In late March 2024, VST closed on the acquisition of Energy Harbor’s nuclear (~4 GW) and retail businesses (~1 million customers). Energy Harbor owns the Beaver Valley 1 and 2, Perry, and Davis Besse nuclear plants and retail businesses. VST’s 2024 Adjusted EBITDA guidance is $3.7-4.1 billion (Energy harbor to add $700-900 million).
– In February 2024, GIP agreed to buy 50% of the South Fork and Revolution offshore wind (NY) projects from Eversource for $1.1 billion.
– In November 2023, CEG acquired a 44% stake in the South Texas Project Electric Nuclear Plant (STP), a 2,645- MW, dual-unit near Houston, TX, from NRG. Price implied 11.7x EV/EBITDA.
We expect more acquisitions of renewable and other energy platforms, including entire utilities. Other acquisitive infrastructure players, include Blackstone, Macquarie, Argo, and Summit. Utility financial engineering (subsidiary acquisitions, spins, and/or divestments) remains active, but takeover activity of investor-owned utilities has slowed in recent years. Since 1995, the US electric utility sector saw over 155 acquisition announcements and 124 completed deals.
In 2024, three deals were announced and two closed. In 2023, three deals were announced, one deal closed, and one agreement terminated. Merger activity declined during the pandemic-impaired 2020-21 COVID-19 era. Investor- owned utilities prefer organic rate base growth (pay 1x rate base) to the takeover of rate base at a multiple of rate base. Regulated utility acquisitions can lead to a lengthy regulatory approval process and require onerous concessions. In addition, a higher cost of capital hampers some buyers’ willingness to engage. Most utilities are focused on ambitious investment programs then face challenges steering deals through a complex state and federal regulatory approval process. However, the sector remains ripe for consolidation as smaller companies face growing challenges to fund growth opportunities and need greater economies of scale.


The 2024/2023/2022 Performance See-Saw
In 2024, the S&P Utility Index has returned 23.4% year-to-date after being the worst performing of the S&P 500 Sector in 2023 (negative -7.1% total return). (Table 8). Despite solid EPS track-records and outlook, utility stock performance continues to be hampered by the higher yield curve over the past thirty-months (2 1/2 years). During 2022-24, S&P industry sectors have been “see-sawing” in response to a fluctuating economic outlook as recession and inflation fears ebb and flow. Expectations for a recession led to defensive stock out-performance in 2022, while a fear of missing out (FOMO) on the strong tech stock advances (exacerbated by the election) has left utility stocks somewhat neglected. The FOMO and concern over interest rates appears to have been exacerbated by enthusiasm over the new administration,

We also highlight the poor total returns of the clean energy ETF’s over each of the two years, with iShares Clean Energy ETF (ICLN) negative return of -25.7% and the Invesco Solar Index (TAN) negative return of -37.6% with recent underperformance driven by concerns that clean energy support has faded under a Trump/Republican administration.
Utility Stocks Trade at Historical Discounts on Relative P/E
In 2024, utility stock performance overcame the negative impact of higher interest rates primarily due to prospects of higher EPS growth related to electric demand (and gas demand), but the two year-underperformance reflects concern over higher cost of capital, equity issuances, wildfire issues, and uneconomic offshore wind projects.
Please see Table 9 for Utility Subgroup Metrics and appendix on page 29 for more utility stock financials.
̶ Electric utility valuation multiples have declined from 23x forward earnings in early 2020 to roughly 16.5x 2025 earnings estimates. Over the past twenty-five years, utility forward multiples have ranged between 10x and 23x earnings with a median of 16.6x.
̶ The gas utility performance reflects recovered investor sentiment offset by greater challenges to maintain earnings outlooks. Gas utilities currently trade at <16x 2025 earnings estimates despite significant consolidation activity at higher multiples.
̶ The water utility two-year under-performance reflects the impact of higher interest rates on higher multiple stocks. Water utilities trade at the highest multiples due to their scarcity, small size, takeover premium, ESG value, and long-term growth potential through consolidation and privatization.
̶ The six Canadian electric and gas utilities have lower growth rates and higher current returns. Canadian provincial regulatory environments are more challenging (lower allowed ROEs and equity ratios) than many US utility jurisdictions.

Valuation
Over the past twenty years, electric utility multiples climbed from roughly 10x forward earnings to over 23x, driven by improving fundamentals, higher growth rates and lower interest rates from 2000-2022 (Exhibit 27). Electric utilities trade at ~16.6x consensus forward earnings estimates which is near the historical median. We consider the multiple attractive given higher utility earning growth rates and strong fundamentals.

Given that long-term interest rates (specifically the 10-year and 30-year Treasury yields) have risen to 4.6% following a long-term secular decline since the late 1980’s, we measure the earnings yield (1/P/E) as a percentage of the 10-Year T- Bond Yield to gauge interest rate adjusted valuations. As can be seen in Exhibit 28, the current ratio of 135% indicates the sector P/E is modestly higher than its historical median relationship with the 10-Year T-Bond Yield.

Interest Rates and the Fed
Utility stocks are not bond proxies, and share prices are a function of earnings and dividend growth rates, but higher (lower) rates negatively (positively) impact stocks, given that future cash flows are impacted by the discount rate. In addition, current utility dividend returns become less compelling when returns on other investments increase, including Treasury yields. The current 6-month Treasuries yield over 5.0% and US Treasuries hold even greater defensive appeal than utilities. The factors below mitigate the negative impact of higher rates.
- Annual dividend hikes: Utilities target annual dividend increases, which serve to mitigate the negative impact of higher rates. In 2024, electric utilities increased the annual dividend by a median of 4.9%.
- ROE is set based on interest rates: A utility’s cost-of-capital, including equity returns (ROEs), is set by state PUCs and increases (decreases) as interest rates rise (fall).
- Annual riders minimize inflation risk: State PUCs and FERC regulatory principles have improved to include more frequent rate adjustments, which mitigate inflation risk.
- Utility stocks pay higher dividends than other sectors: The present value of a higher near-term dividend stream is less impacted by changes in interest rates than a lower near term dividend stream.
While utility dividend yields and 10-year U.S. Treasury yields are highly correlated and will likely remain so in the future, utility dividends have risen over time (most on annual basis) while the Treasury yield remains fixed. Utility stock prices, unlike Treasury bond prices, are likely to rise should earnings and dividends grow over time.
Conclusion
The utility sector offers a 3.5% current return and many utilities managements target 5-8% annual earnings and dividend growth. The utility business model represents a safe haven in the face of recession and/or inflation fears. In addition, the transformation of the utility sector from fossil fuel-fired to renewables provides the environment for strong annual earnings and dividend growth. Accelerated electric demand provides support for EPS CAGR and the potential for even higher growth. We believe that the combination of strong utility fundamentals, and the potential for accelerated electric demand bode well for the relative performance of utilities.


Timothy M. Winter, CFA
(314) 238-1314
©Gabelli Funds 2025
ONE CORPORATE CENTER RYE, NY 10580 Gabelli Funds TEL (914) 921-5100
This whitepaper was prepared by Timothy M. Winter, CFA. The examples cited herein are based on public information and we make no representations regarding their accuracy or usefulness as precedent. The Research Analysts’ views are subject to change at any time based on market and other conditions. The information in this report represent the opinions of the individual Research Analysts’ as of the date hereof and is not intended to be a forecast of future events, a guarantee of future results, or investments advice. The views expressed may differ from other Research Analyst or of the Firm as a whole.
As of September 30, 2024, affiliates of GAMCO Investors, Inc. beneficially owned 6.98% of RGC Resources, 4.42% of National Fuel Gas, 2.91% of Southwest Gas, 2.10% of Northwest Natural, 1.84% of TXN Energy, 1.49% of York Water, 1.01% of Black Hills, and less than 1% of all other companies mentioned.
One of our affiliates serves as an investment adviser to Hawaiian Electric or affiliated entities and has received compensation within the past 12 months for these non-investment banking securities-related services.
Funds investing in a single sector, such as utilities, may be subject to more volatility than funds that invest more broadly. The utilities industry can be significantly affected by government regulation, financing difficulties, supply or demand of services or fuel and natural resources conservation. The value of utility stocks changes as long-term interest rates change