EUROPEAN DEFENSE EXPENDITURE OUTLOOK
European NATO members’ defense expenditure in the ten years before the invasion of Ukraine stood at around 1.5% on average as a share of GDP. At the time, NATO members were expected to allocate at least 2% of their GDP to defense. That compares to circa 3.5% in the U.S., and 2.5% for NATO total, including the U.S. and Canada. NATO Europe, after the invasion of Ukraine in 2022, substantially increased defense expenditure to about 2.0% as a share of GDP. In June of 2025, the NATO summit took place in The Hague, Netherlands. At the event, NATO members committed to a new set of spending and capability targets.
NATO members made the commitment to invest 3.5% as a share of GDP by 2035 to resource core defense requirements and to meet the NATO capability targets. In addition, they account for up to 1.5% as a share of GDP for investments that are less specific, e.g. investments to protect critical infrastructure and strengthen the defense industrial base. Overall, we estimate the European NATO members’ core defense expenditure in 2024 to be around $485bn. The three largest contributors are Germany with $100bn or around 20% of the total, followed by the U.K. with $85bn and France with $65bn. That compares with around $955bn spent by the U.S.
We have updated our European NATO members’ core defense expenditure outlook based on statements made by key nations since the NATO summit. We now estimate NATO Europe core expenditure to reach around 2.5% as a share of GDP, or $680bn by 2027 and 3.0% or $905bn by 2030. Key driver of this absolute growth with around 25% is Germany. This is explained by Germany’s firm commitment to lead NATO Europe spending and enabled by the taking on of an unprecedented level of debt. Based on official government statements, we now expect German core expenditure to reach 3.0% as a share of GDP by 2027 and 3.5% by 2029, i.e. 6 years ahead of the NATO targets.
Core expenditure can be divided into two main segments: equipment, which historically contributed around 20% to NATO Europe total spend, and others. Others mainly includes personnel and expenses for operations and maintenance. After the invasion of Ukraine, equipment expenditure has grown disproportionately strongly, to about 30% of the total. This growth is best explained by a more rapid availability of equipment versus, e.g., the hiring and training of personnel. The three largest equipment contributors are the U.K. with around $30bn, Germany with $28bn, and France with $18bn. Overall, we estimate the total addressable European defense equipment market in 2024 to be around $155bn.
That $155bn compares to around $290bn in equipment expenditure in the U.S., which has consistently explained close to around 30% of total U.S. defense expenditure over the past decade. While this 30% is likely a good guideline for a NATO Europe equipment share normalization long-term, we continue to expect a higher equipment share short- and medium-term in light of its more rapid availability. Based on conversations with industry participants, we continue to model a 40-50% share of the incremental annual defense spend to be allocated to equipment. As a result, we estimate NATO Europe equipment expenditure to grow at an around 15% CAGR to $340bn by 2030.
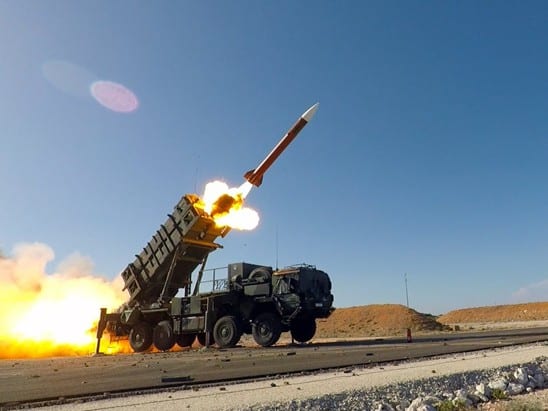
With regard to NATO Europe capability targets (details highly classified), statements confirm our expectation of a growing emphasis on land-based operations, ammunition, and air defense.
EUROPEAN DEFENSE INDUSTRY OVERVIEW
The European defense industry is fragmented, with the top ten companies accounting for less than half of the total equipment market. Based purely on estimated European equipment market share, the top five European defense contractors are BAE Systems (around 8%), Airbus and Thales (6% each), and Rheinmetall and Leonardo (5% each). That said, Airbus is not primarily a defense contractor, with only around 20% of total FY-24 sales generated with military applications. The landscape therefore can be roughly divided into two main segments: companies with a defense sales exposure of close to 50% and above, and companies with a defense sales exposure of up to 30%.
The former has a clearer focus on military applications and ranges from BAE Systems – which, with 95% exposure comes closest to being a pure play – to Kongsberg Gruppen, which generates almost 50% of their revenues from defense. The latter represents the European aerospace industry, including Airbus, the aeroengine OEMs, and their suppliers. Within the defense-focused group, sales exposure to the European defense equipment market varies and ranges from Hensoldt, with an estimated 75% of total sales to BAE Systems, which only generates one third of its total sales with the European defense market.
European governments also source equipment from U.S. defense contractors, e.g., for cost reasons. That said, we assume that the majority of the equipment expenditure will continue to be spent locally. A high sales exposure to the European defense equipment market and more specifically countries within Europe with ambitious spending targets is therefore a good starting position to benefit from the total addressable market expansion. That said, recent weeks have also shown that likely key profiteers share another trait: a high sales exposure to the focus areas of the new capability targets land-based operations, ammunition, and air defense.
APPENDIX
ONE CORPORATE CENTER RYE, NY 10580 Gabelli Funds TEL (914) 921-5100
This whitepaper was prepared by Daniel Gleim, CFA. The examples cited herein are based on public information and we make no representations regarding their accuracy or usefulness as precedent. The Research Analysts’ views are subject to change at any time based on market and other conditions. The information in this report represent the opinions of the individual Research Analysts’ as of the date hereof and is not intended to be a forecast of future events, a guarantee of future results, or investments advice. The views expressed may differ from other Research Analyst or of the Firm as a whole.
As of March 31, 2025, affiliates of GAMCO Investors, Inc. beneficially owned less than 1% of all companies mentioned.
Funds investing in a single sector, such as defense, may be subject to more volatility than funds that invest more broadly. The defense industry can be significantly affected by government regulation, financing difficulties, supply or demand of services. The value of defense stocks changes as long-term interest rates change.
Investors should carefully consider the investment objectives, risks, charges and expenses of the Fund before investing. The prospectus, which contains more complete information about this and other matters, should be read carefully before investing. To obtain a prospectus, please call 800 GABELLI or visit www.gabelli.com
Returns represent past performance and do not guarantee future results. Current performance may be lower or higher than the performance data quoted. Investment return and principal value will fluctuate so, upon redemption, shares may be worth more or less than their original cost. To obtain the most recent month end performance information and a prospectus, please call 800-GABELLI or visit www.gabelli.com
Distributed by G.distributors, LLC., a registered broker dealer and member of FINRA.
This whitepaper is not an offer to sell any security nor is it a solicitation of an offer to buy any security. For more information, visit our website at: www.gabelli.com or call: 800-GABELLI
800-422-3554 • 914-921-5000 • Fax 914-921-5098 • info@gabelli.com
Gabelli Funds, LLC is a registered investment adviser with the Securities and Exchange Commission and is a wholly owned subsidiary of GAMCO Investors, Inc. (OTCQX: GAMI).


