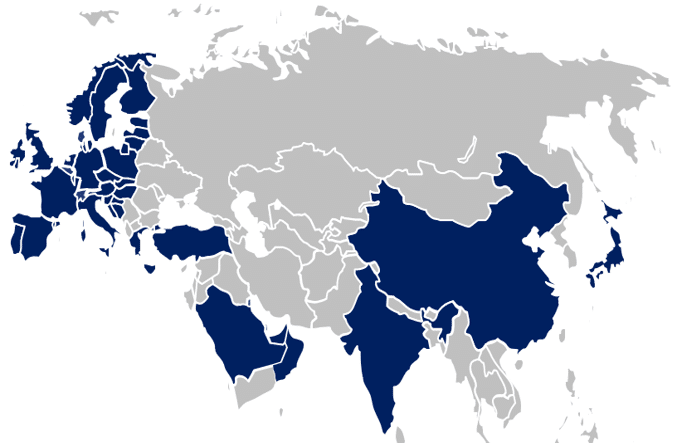
Europe, Middle East & APAC
What You Need to Know
Power demand grew strongly in the third quarter: up 4.4% year-over-year in Europe and as much as 6.0% in the US (see Table 4 on page 10). Exceptionally hot weather boosted electricity demand this summer. Even so, the quarter confirmed the solid underlying electricity demand growth already seen in the first and second quarters. In this issue’s Monthly Focus, we look at how the electrification of different sectors will drive long-term power demand globally through 2035 and how much investment will be needed to meet this electrification demand.
Despite this strong power demand, European and US utilities fell sharply in the third quarter as bond yields surged. In contrast, Japanese utilities gained, although Japanese yields hit the highest level in 30 years. Our equal-weighted “Japan Integrated Utilities” index gained almost 20% over the quarter, while European and US utilities lost 6% and 13%, respectively. In our “Power Points” section (“How exposed are Japanese utilities to rising interest rates?”), we explain why Japanese utilities offer a good hedge against rising yields within a global utilities portfolio.
Bond yields peaked at the beginning of October and have since declined, and utilities stocks have recovered with them. They posted solid gains at the start of the fourth quarter: the MSCI World Utilities index rose almost 5% in October, outperforming the broader market (MSCI World), which fell 1% amid rising AI-related volatility. US utilities, which had suffered most from rising yields and the growing pushback against data centers in the third quarter, also rebounded the most, with the MSCI US Utilities gaining almost 8% in October. Despite the October rebound, global utilities remain mostly under water year-to-date (y-t-d). Europe is the exception: the MSCI Europe Utilities (+9% y-t-d) is once again within striking distance of the broader market (+11.8% y-t-d; see Table 1).
The S&P Global Clean Energy index, on the other hand, failed to recover from its heavy third-quarter losses (-17%) and kept sliding in October (-9%), thereby cutting its y-t-d gain to 3.4% (see Table 1). Accordingly, our equal-weighted wind and solar equipment indices, whose members are mostly also in the Clean Energy index, fell further in October and now show y-t-d losses of 7% (wind equipment) and 21% (solar equipment).
Table 1 Index Performances

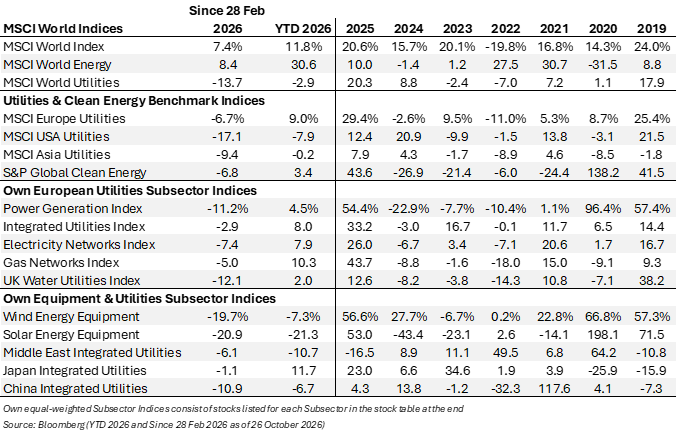


Exhibit 1 Short-Term PERFORMANCE Exhibit 2 Long-Term VALUATION
(rebased since 2025) (1-yr Forward EV/EBITDA since 2017)
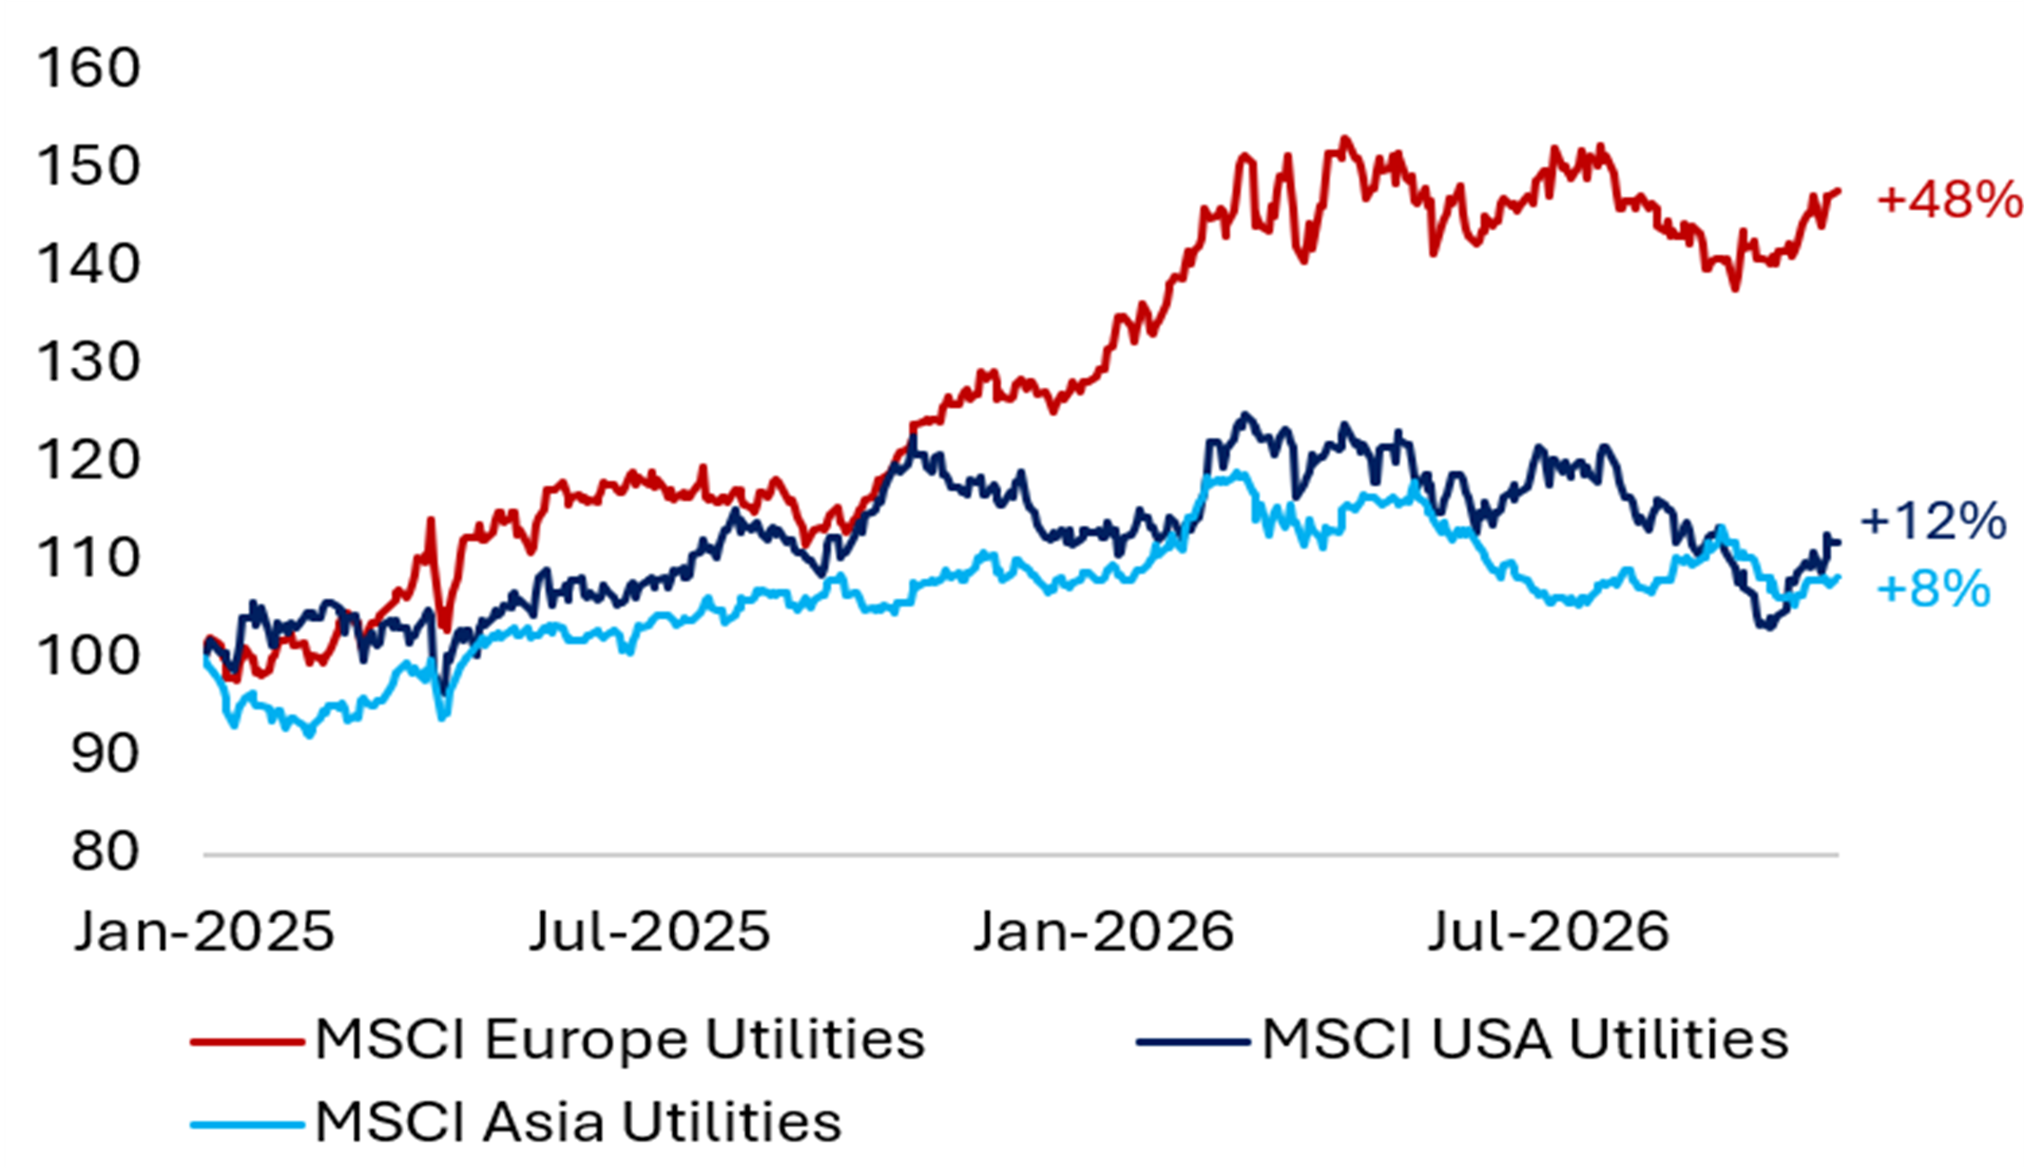
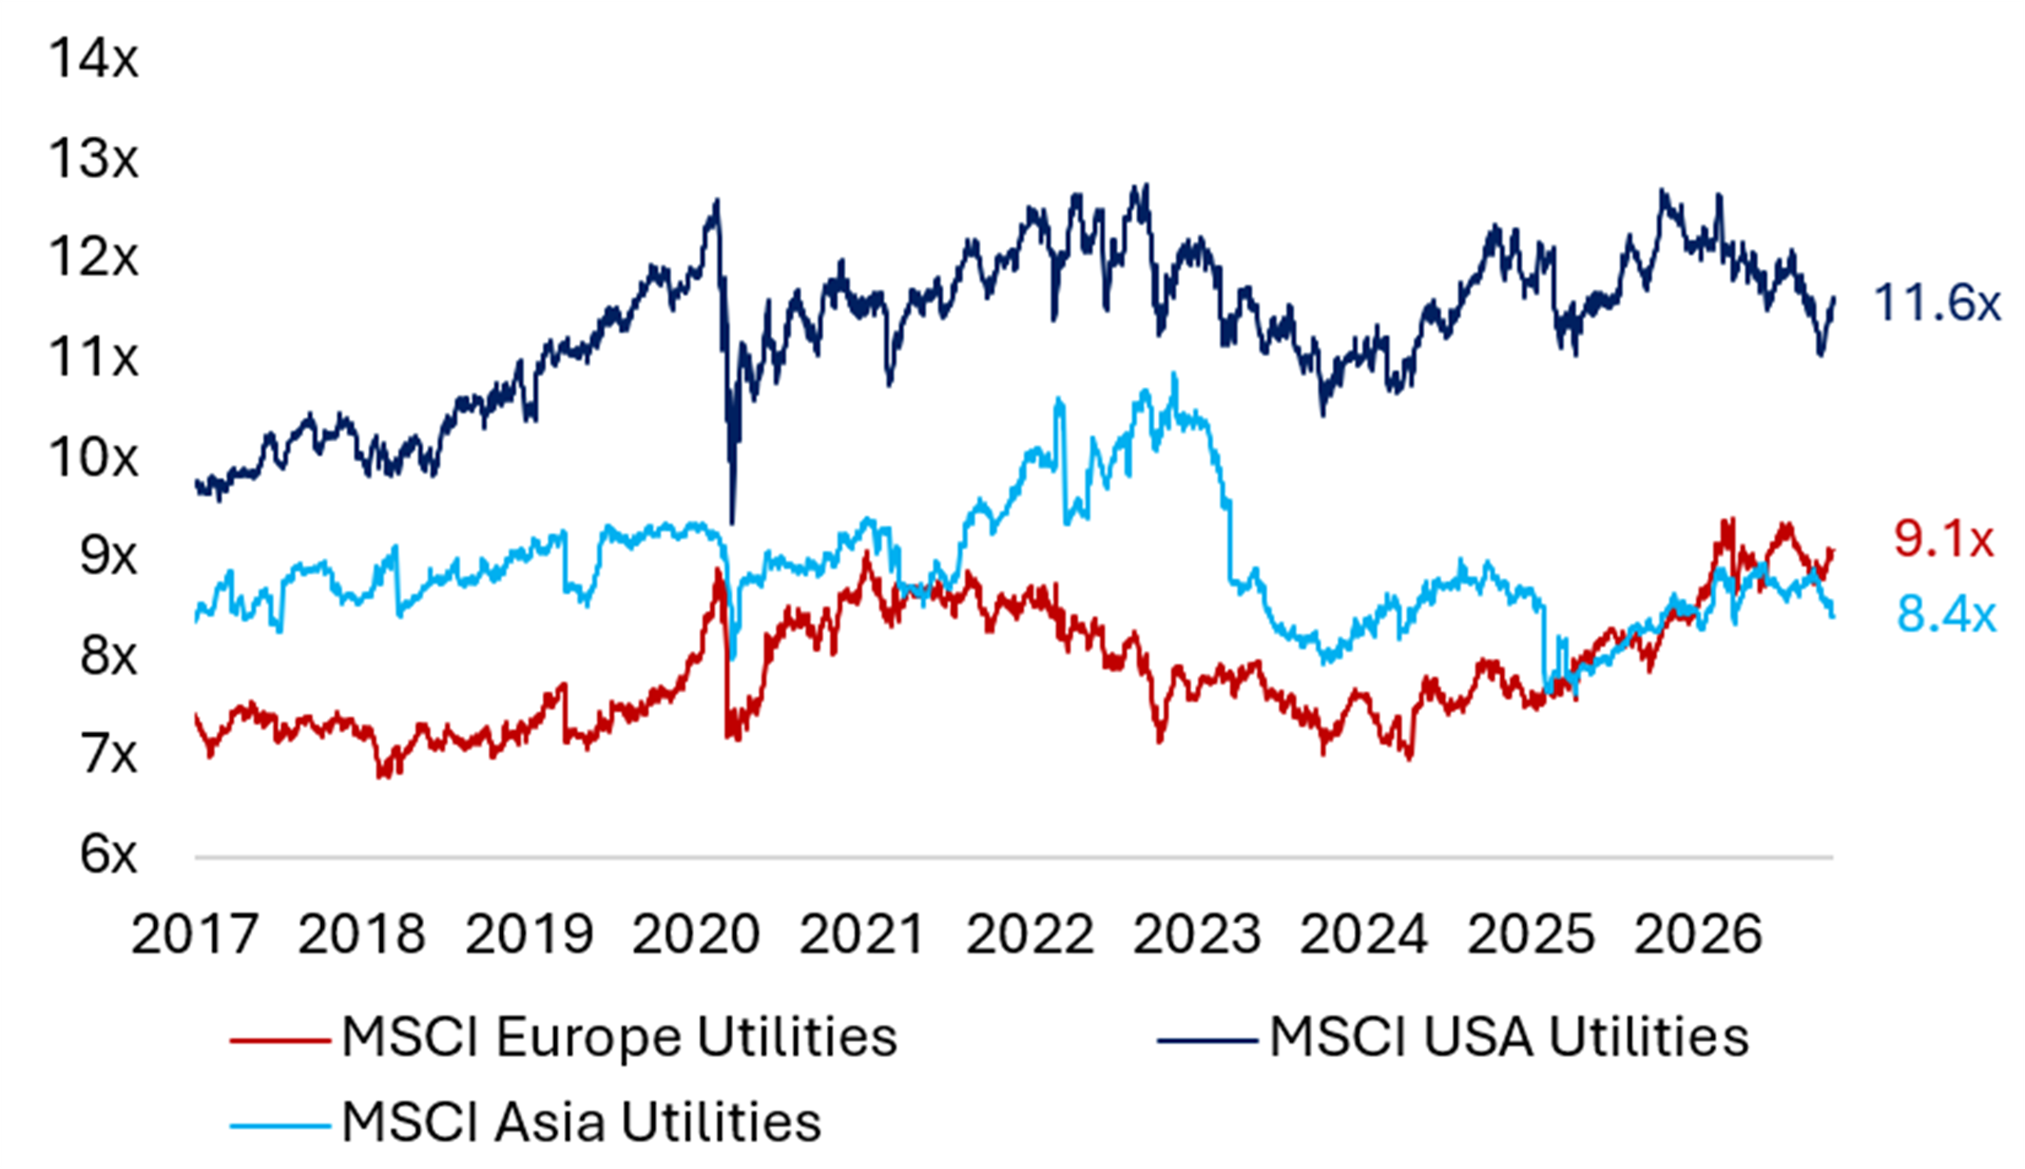

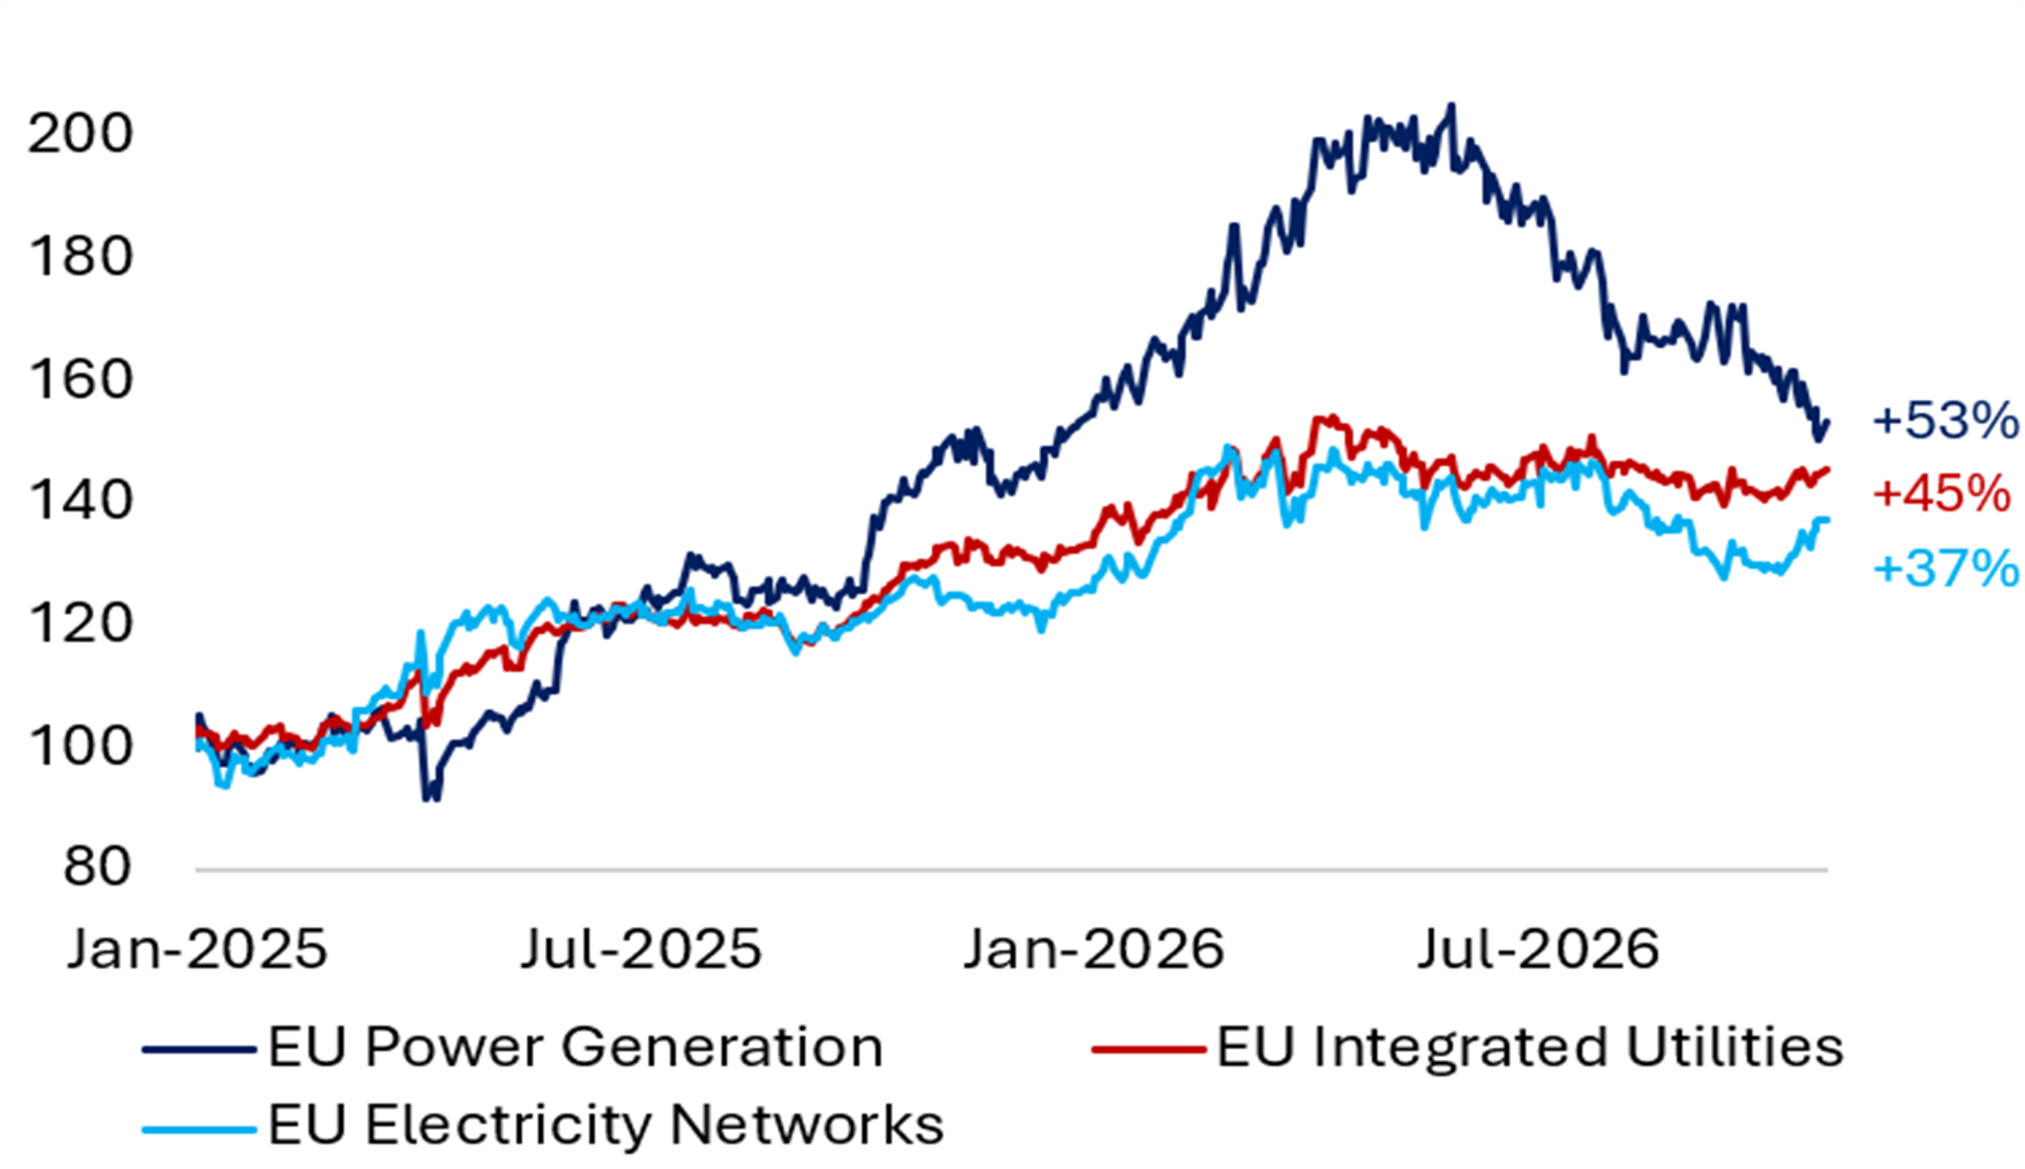
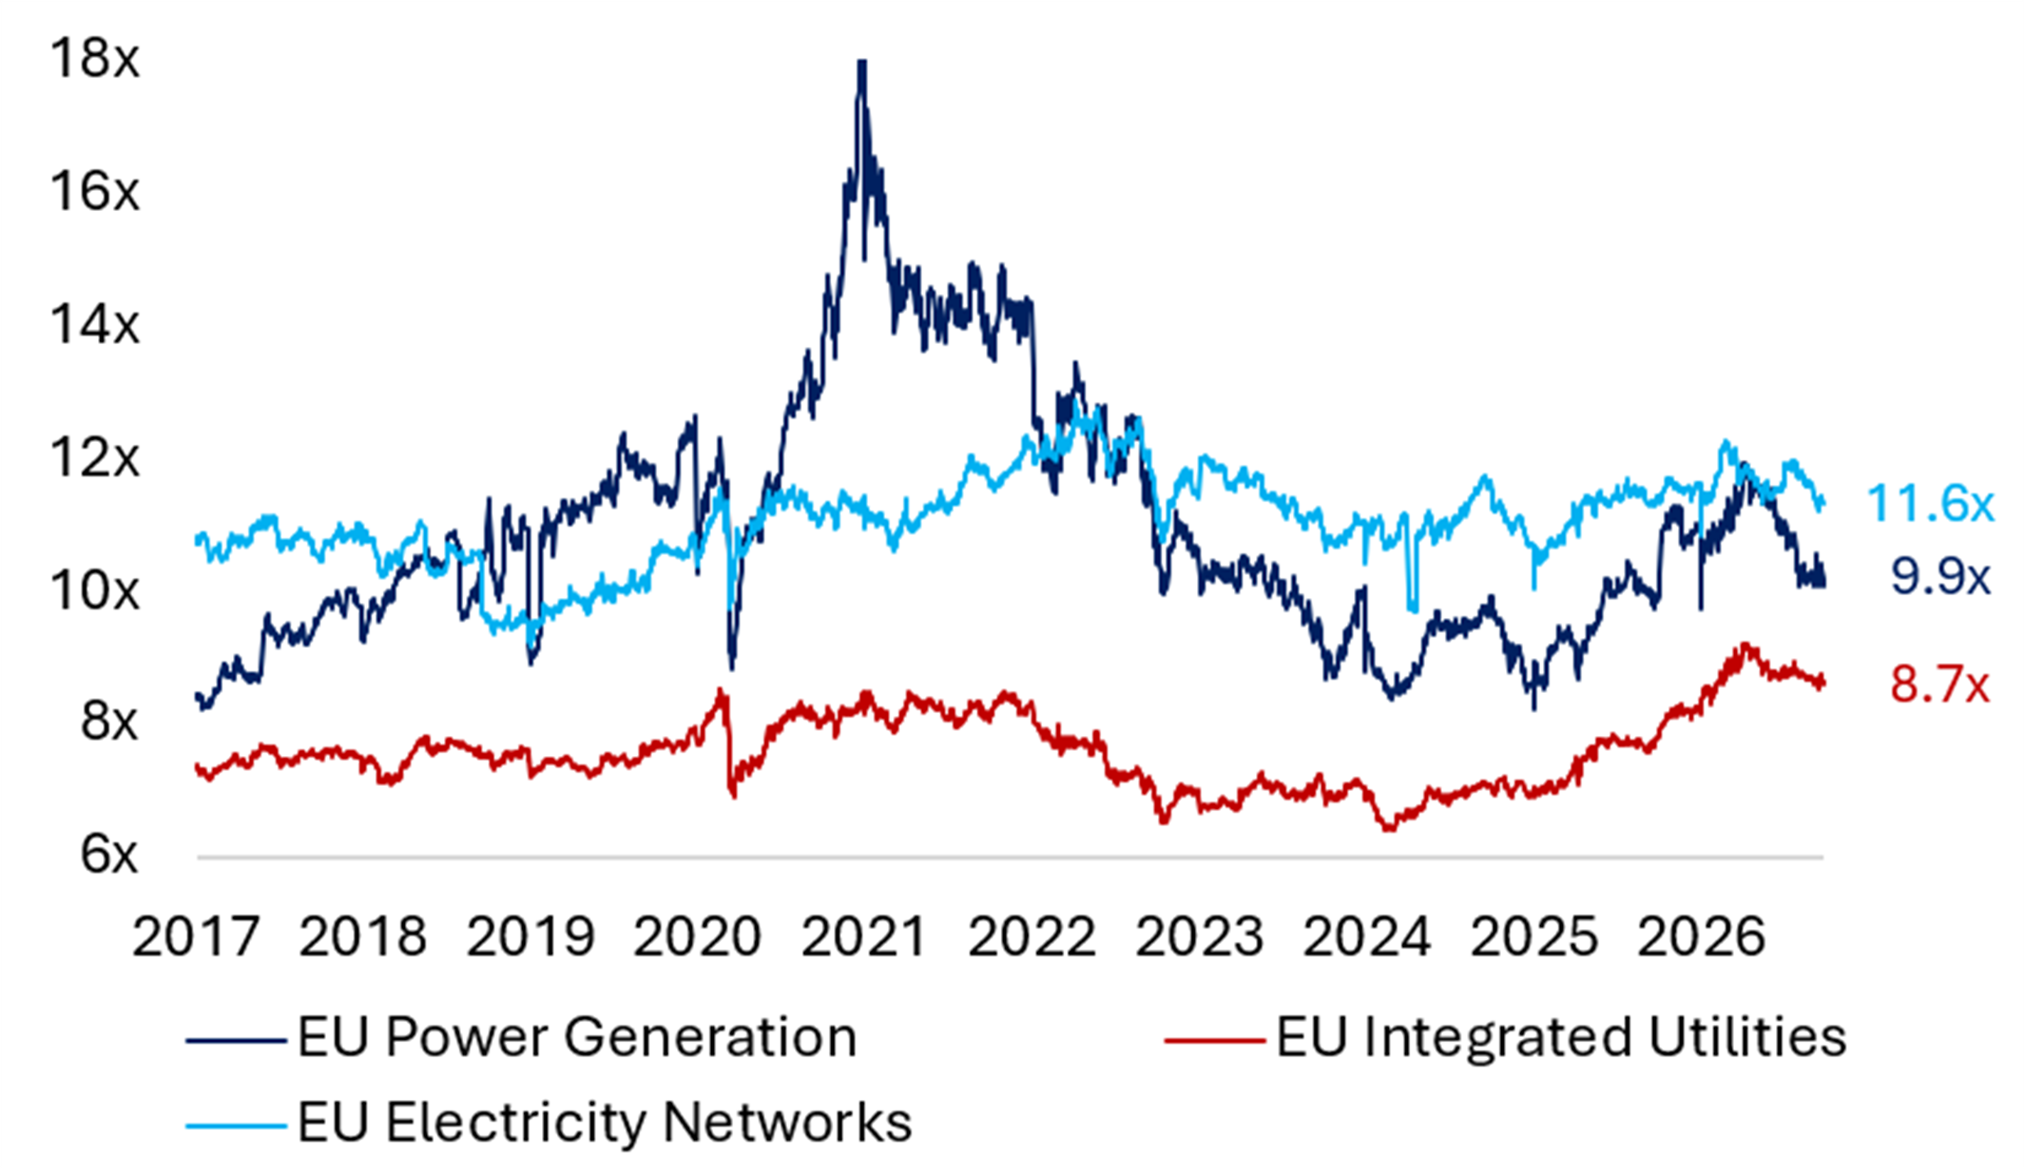

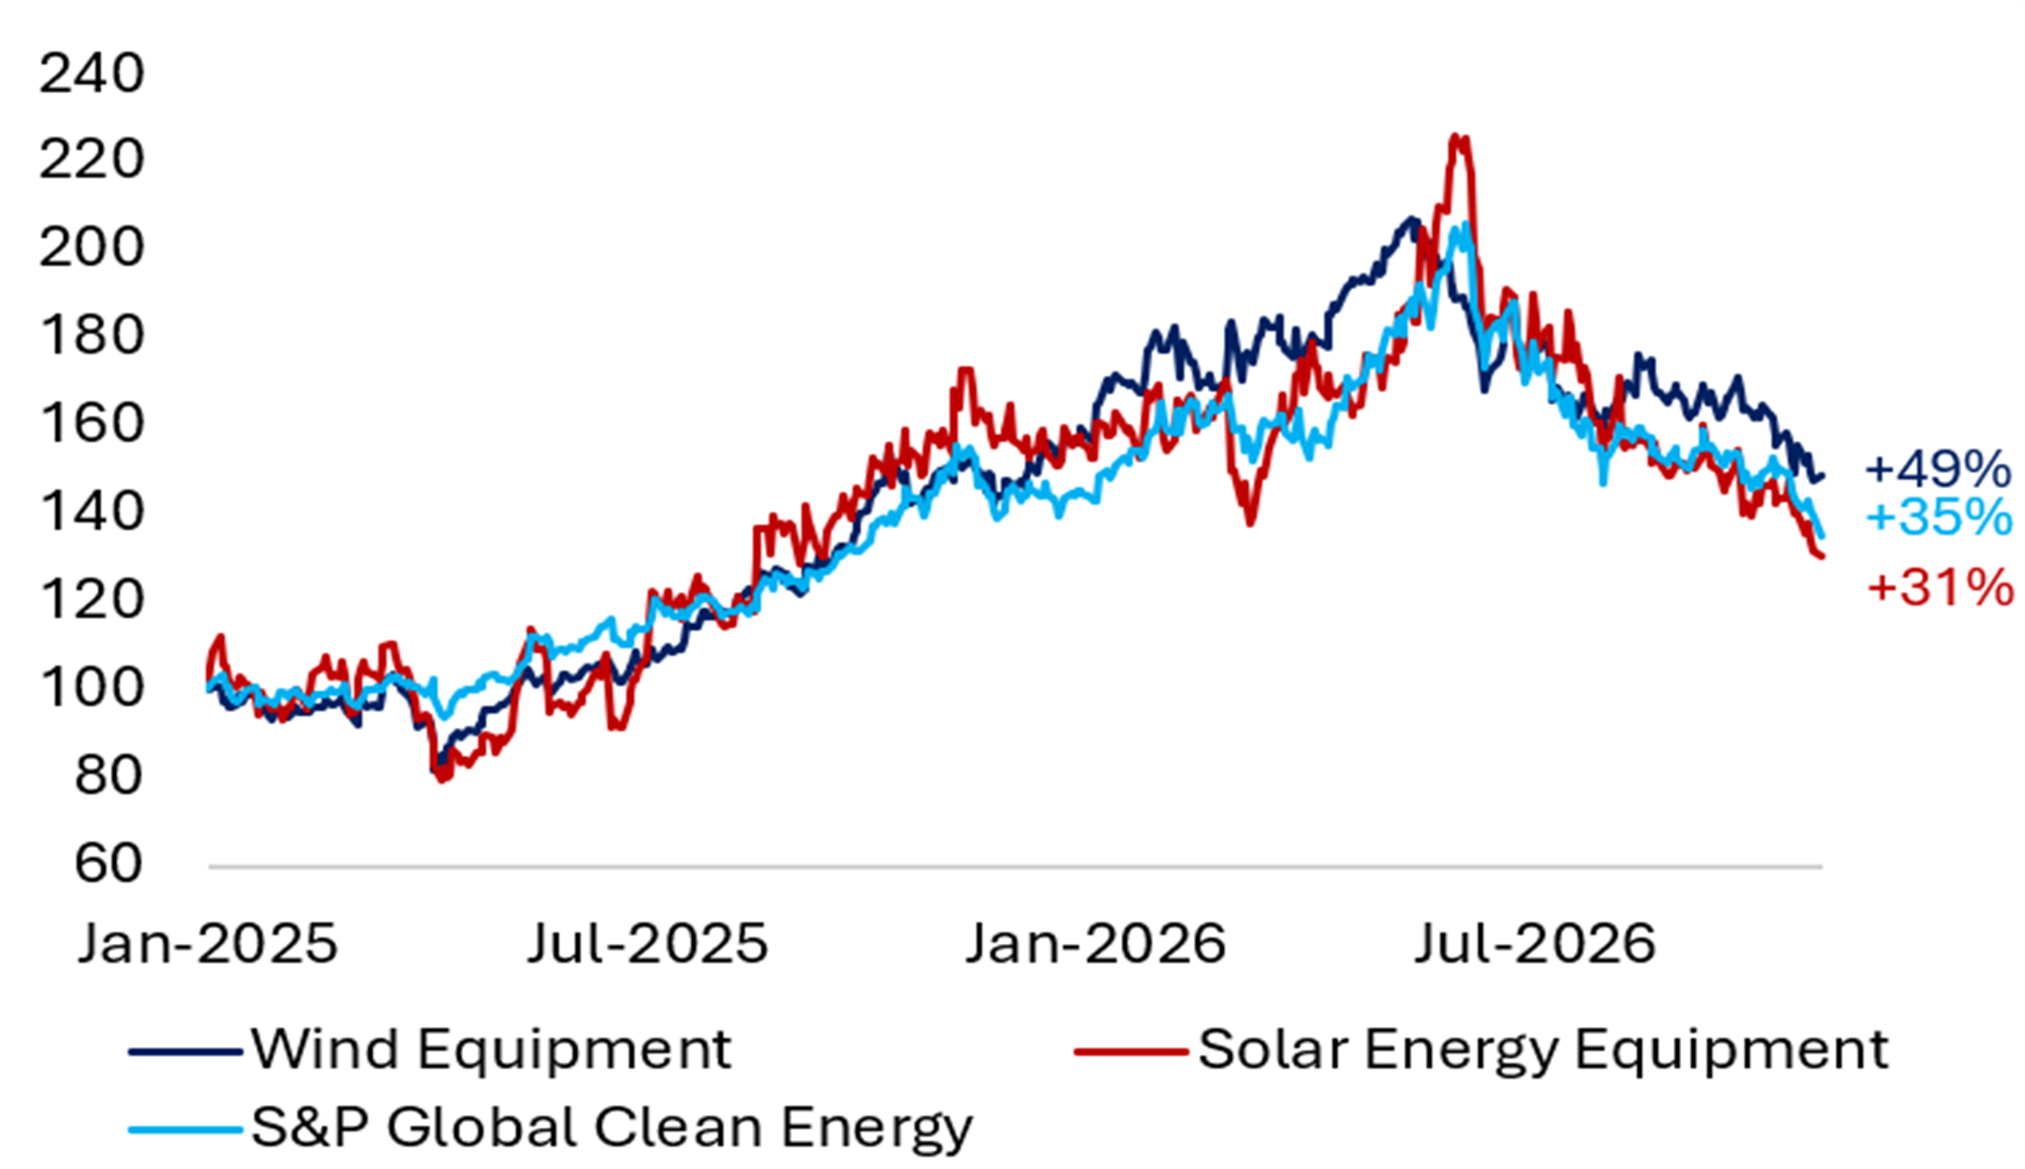
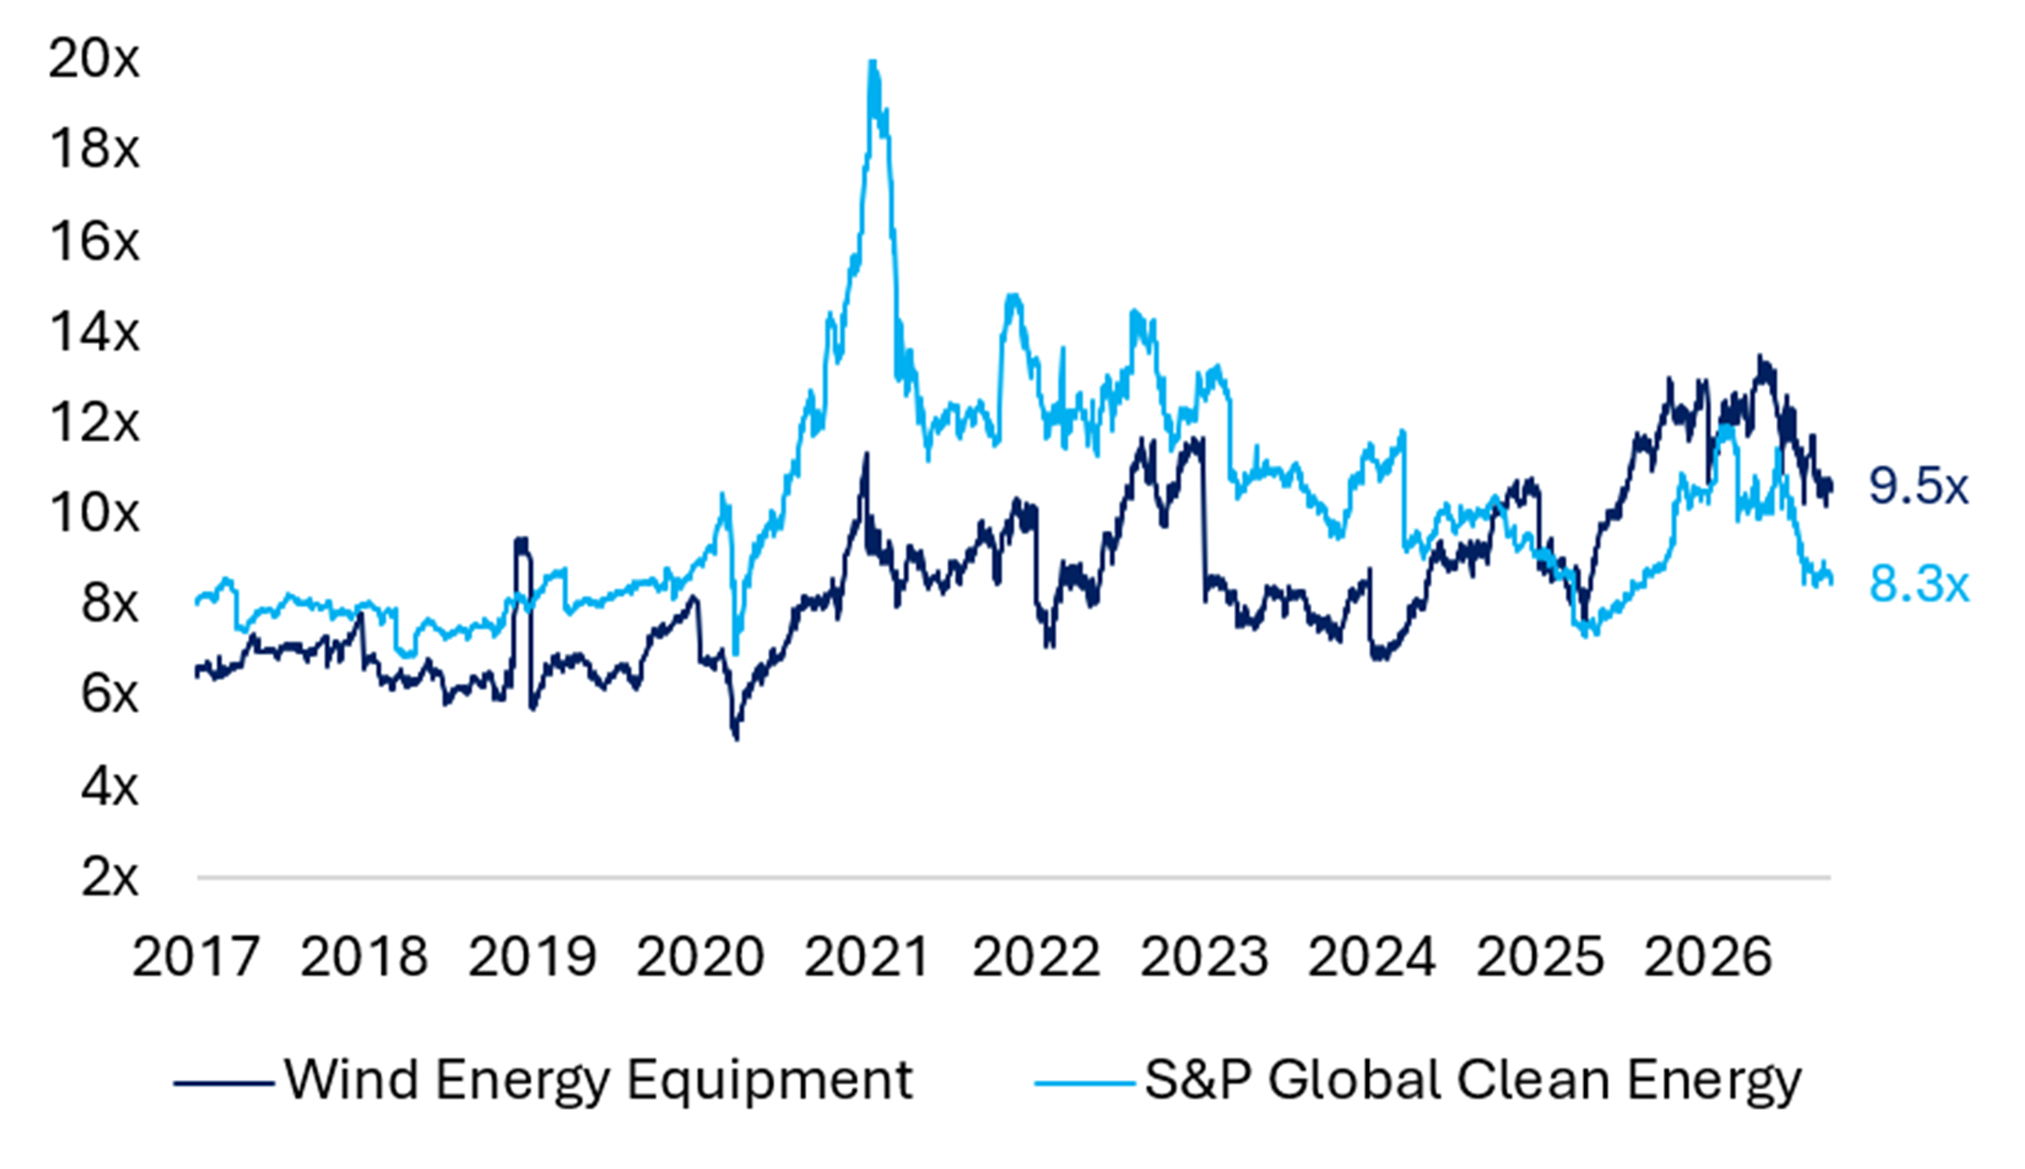
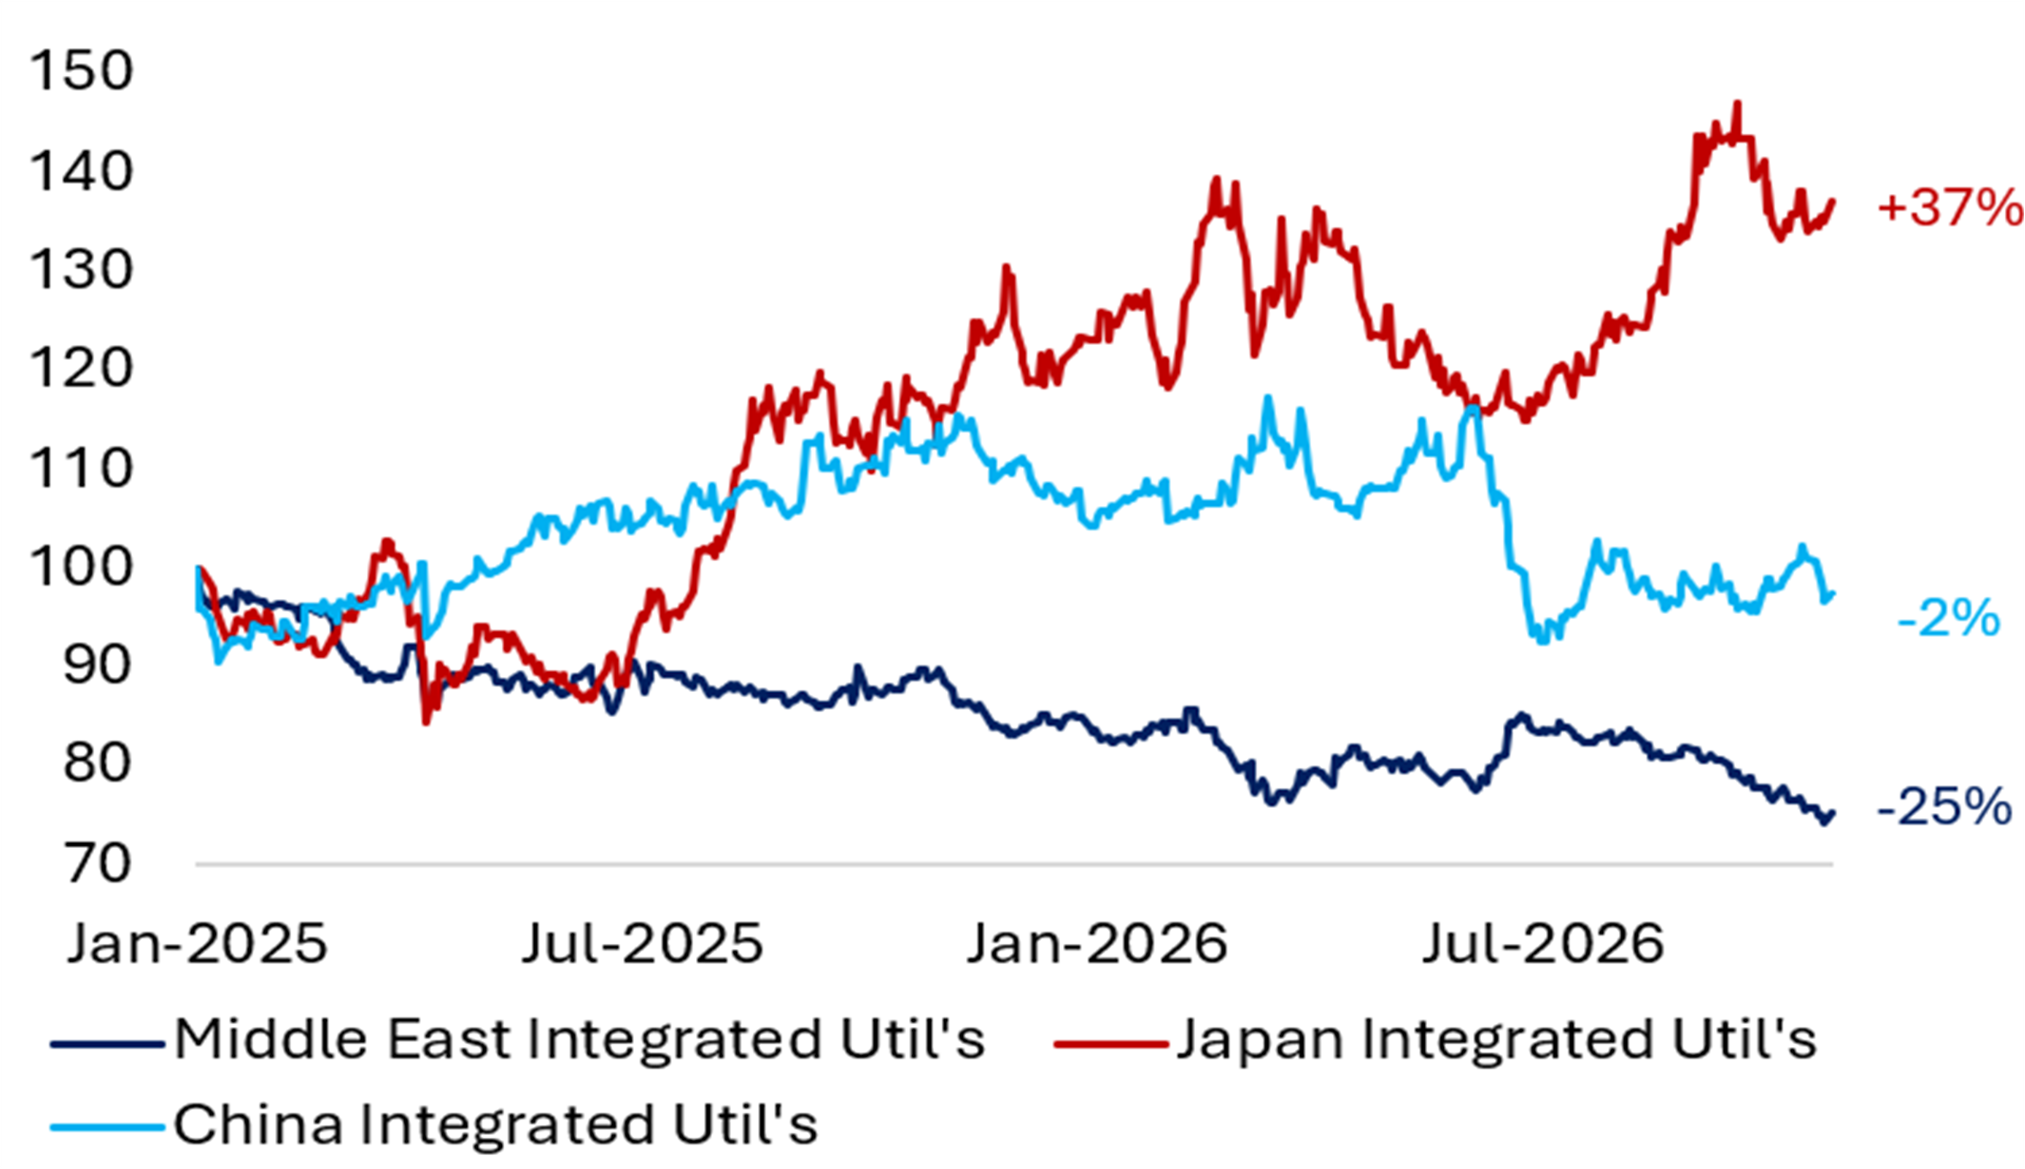
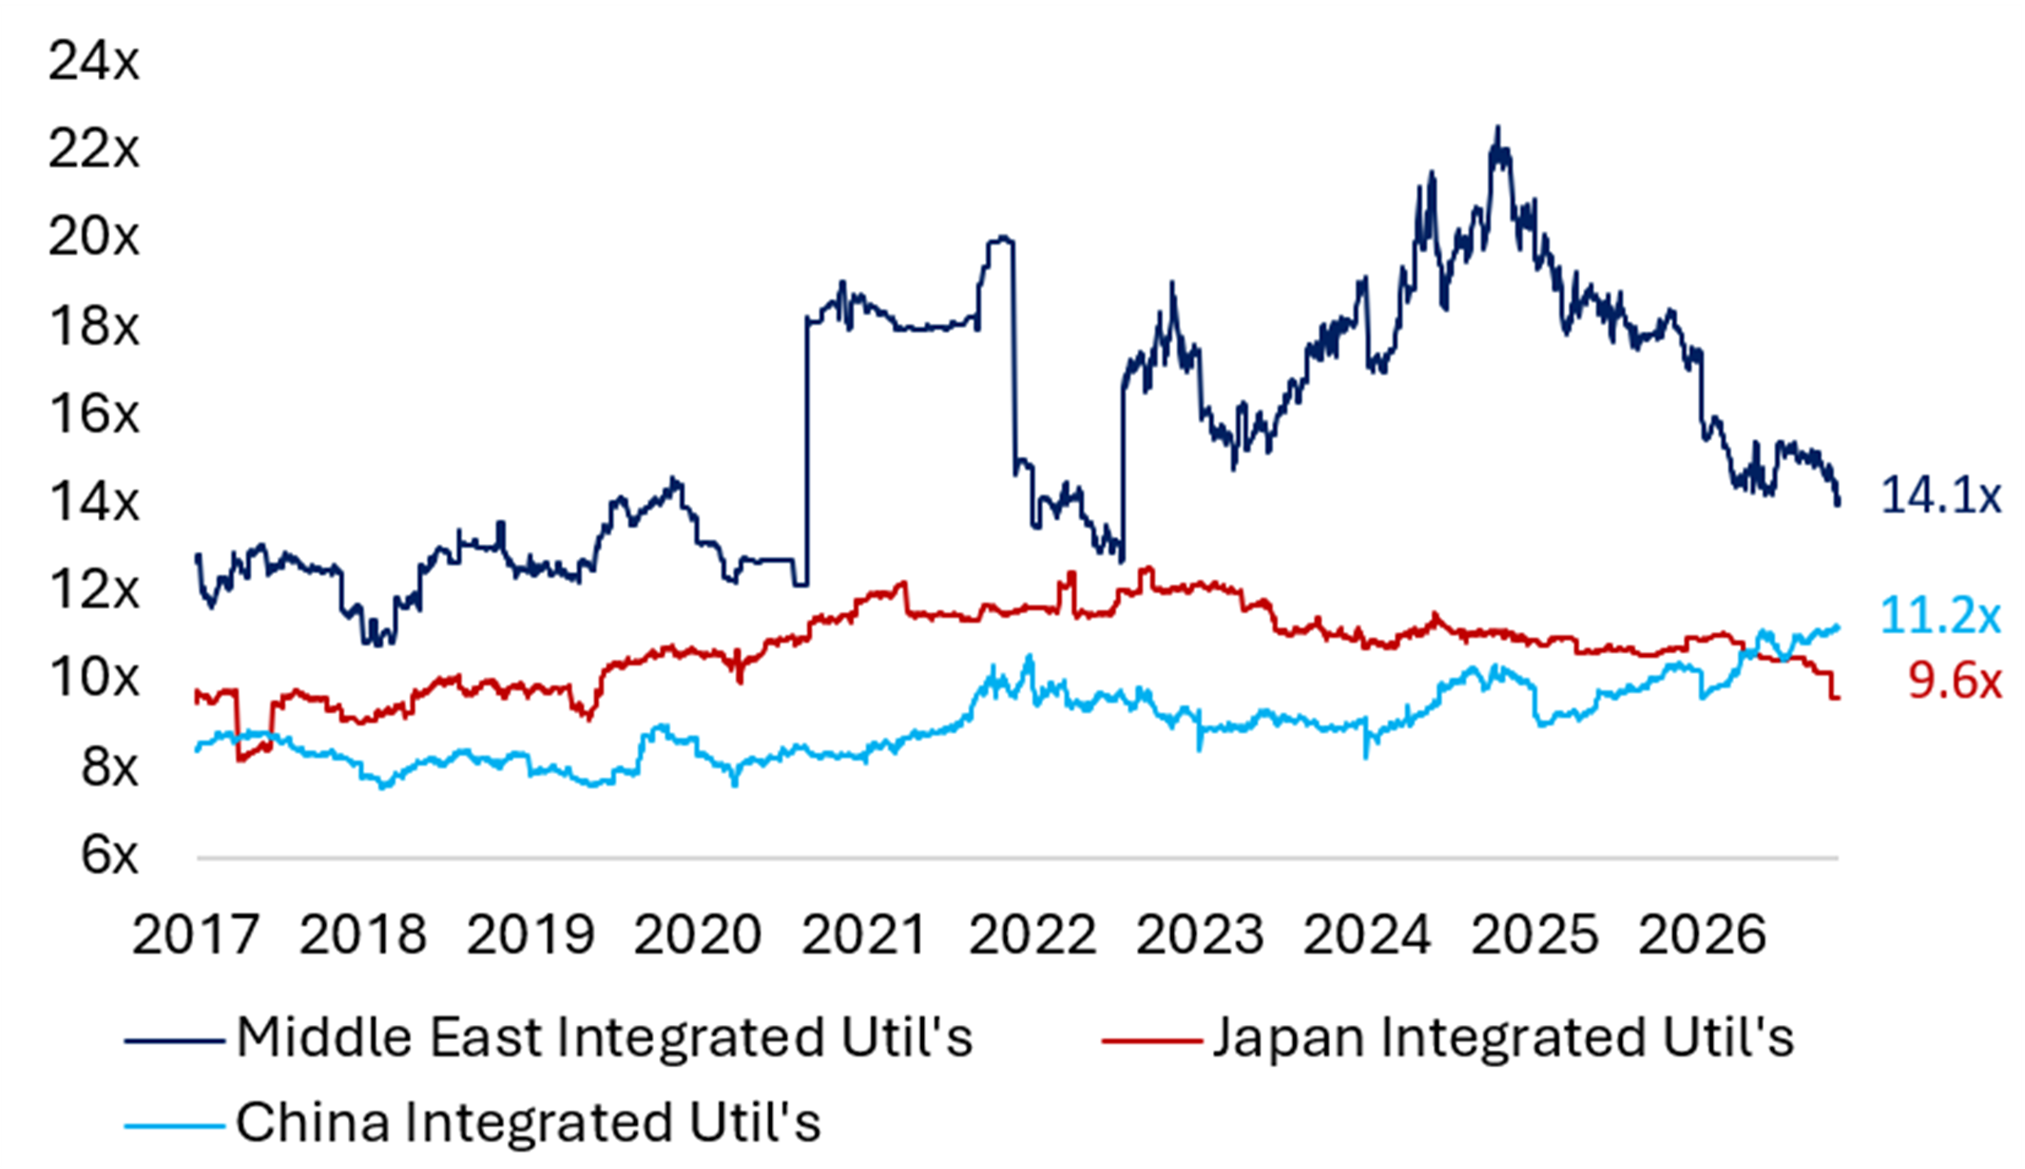
Source: Bloomberg (Prices as of 26 October 2026) Source: Bloomberg (Valuations as of 26 October 2026)
Monthly Focus: An Electrifying Growth Outlook
Electrification drives global power demand growth
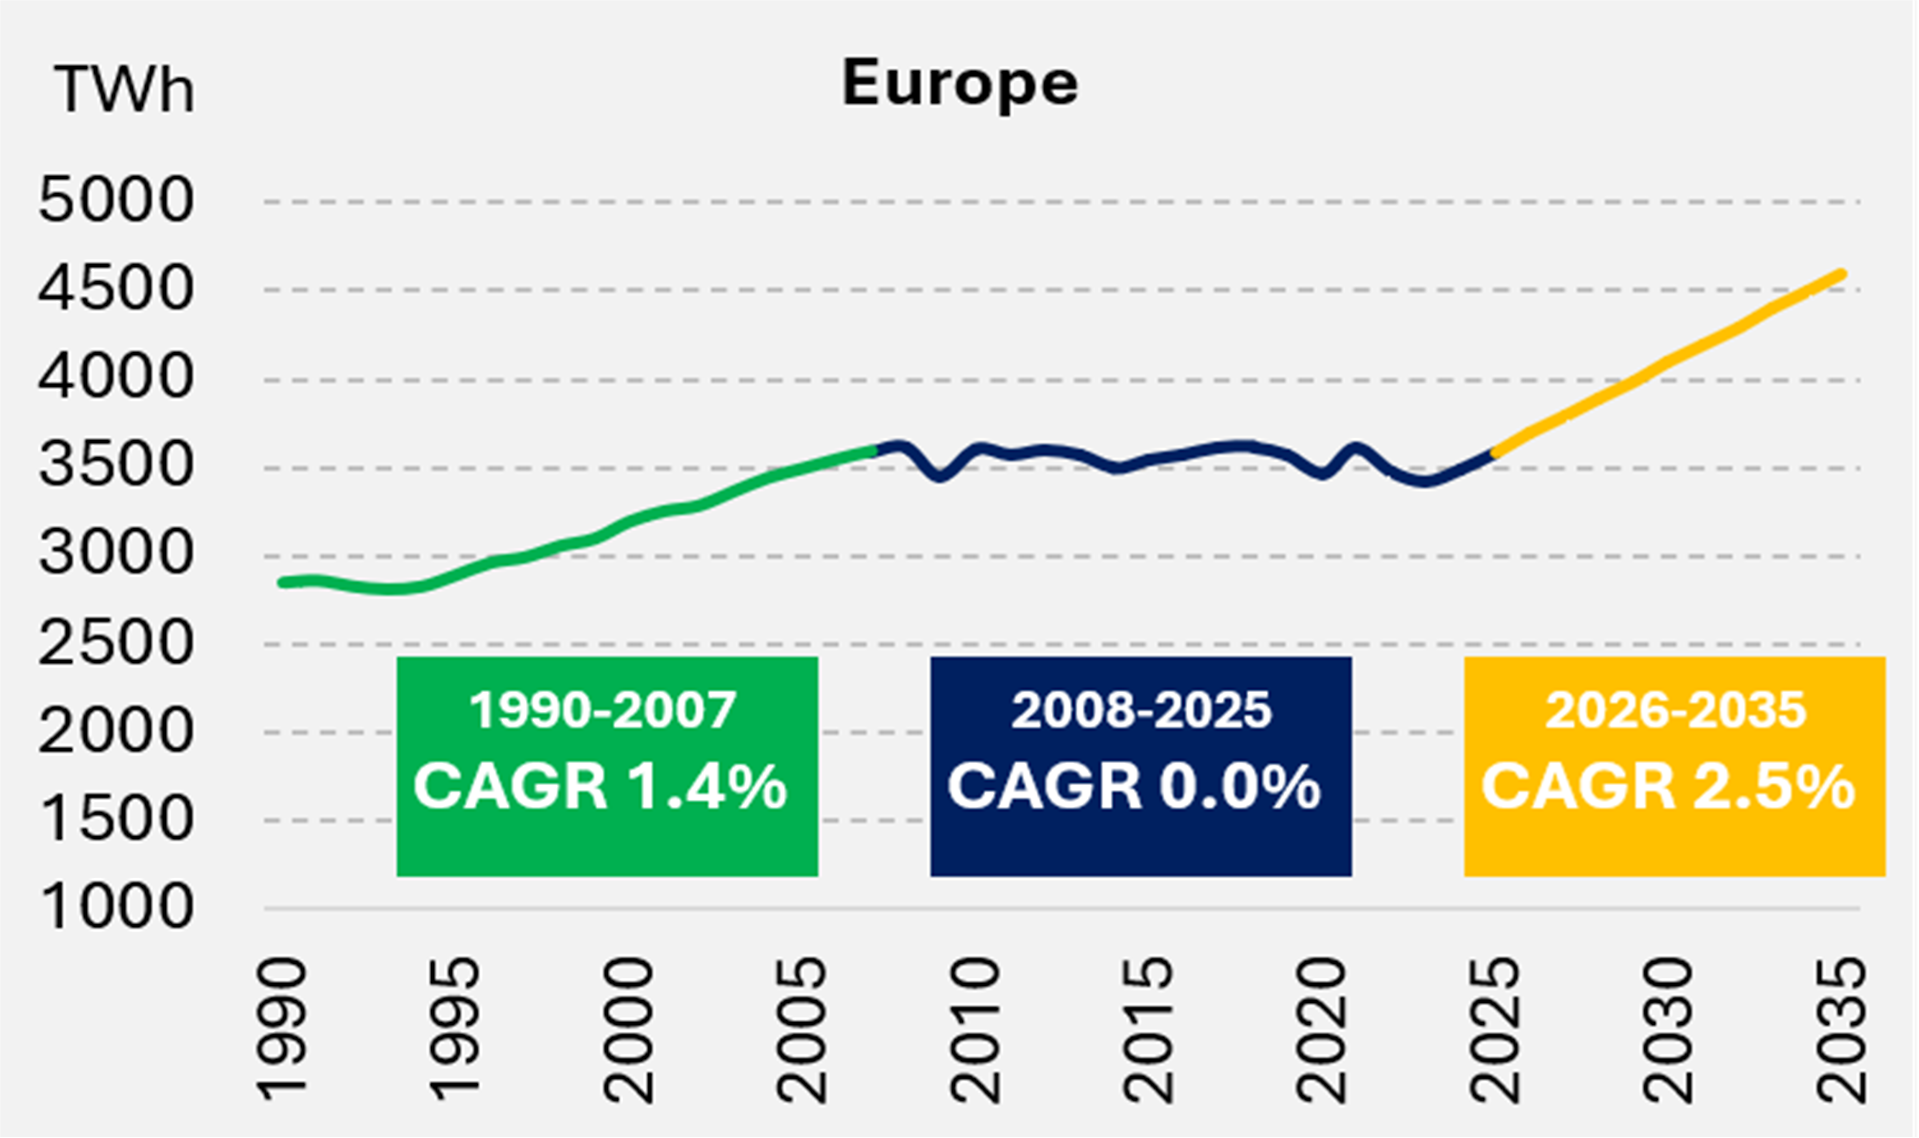
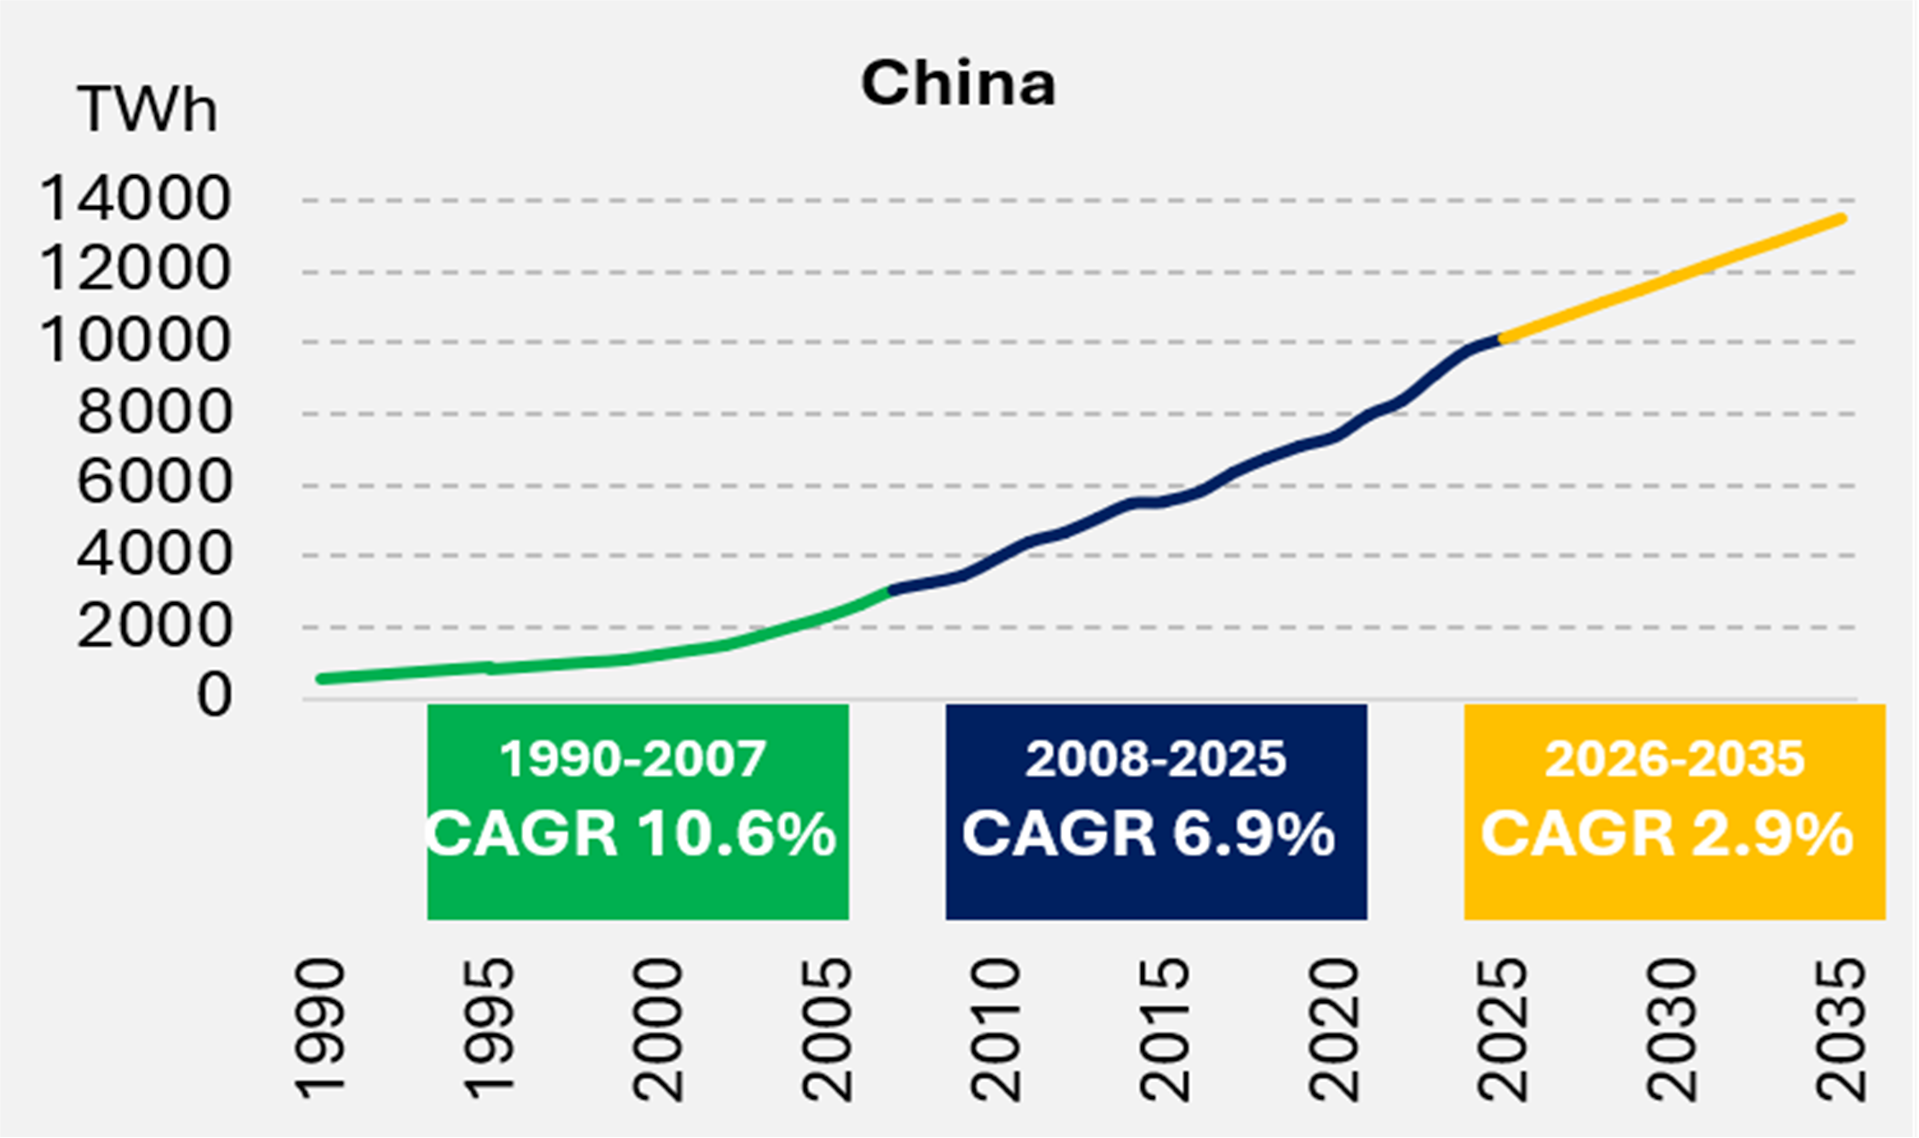
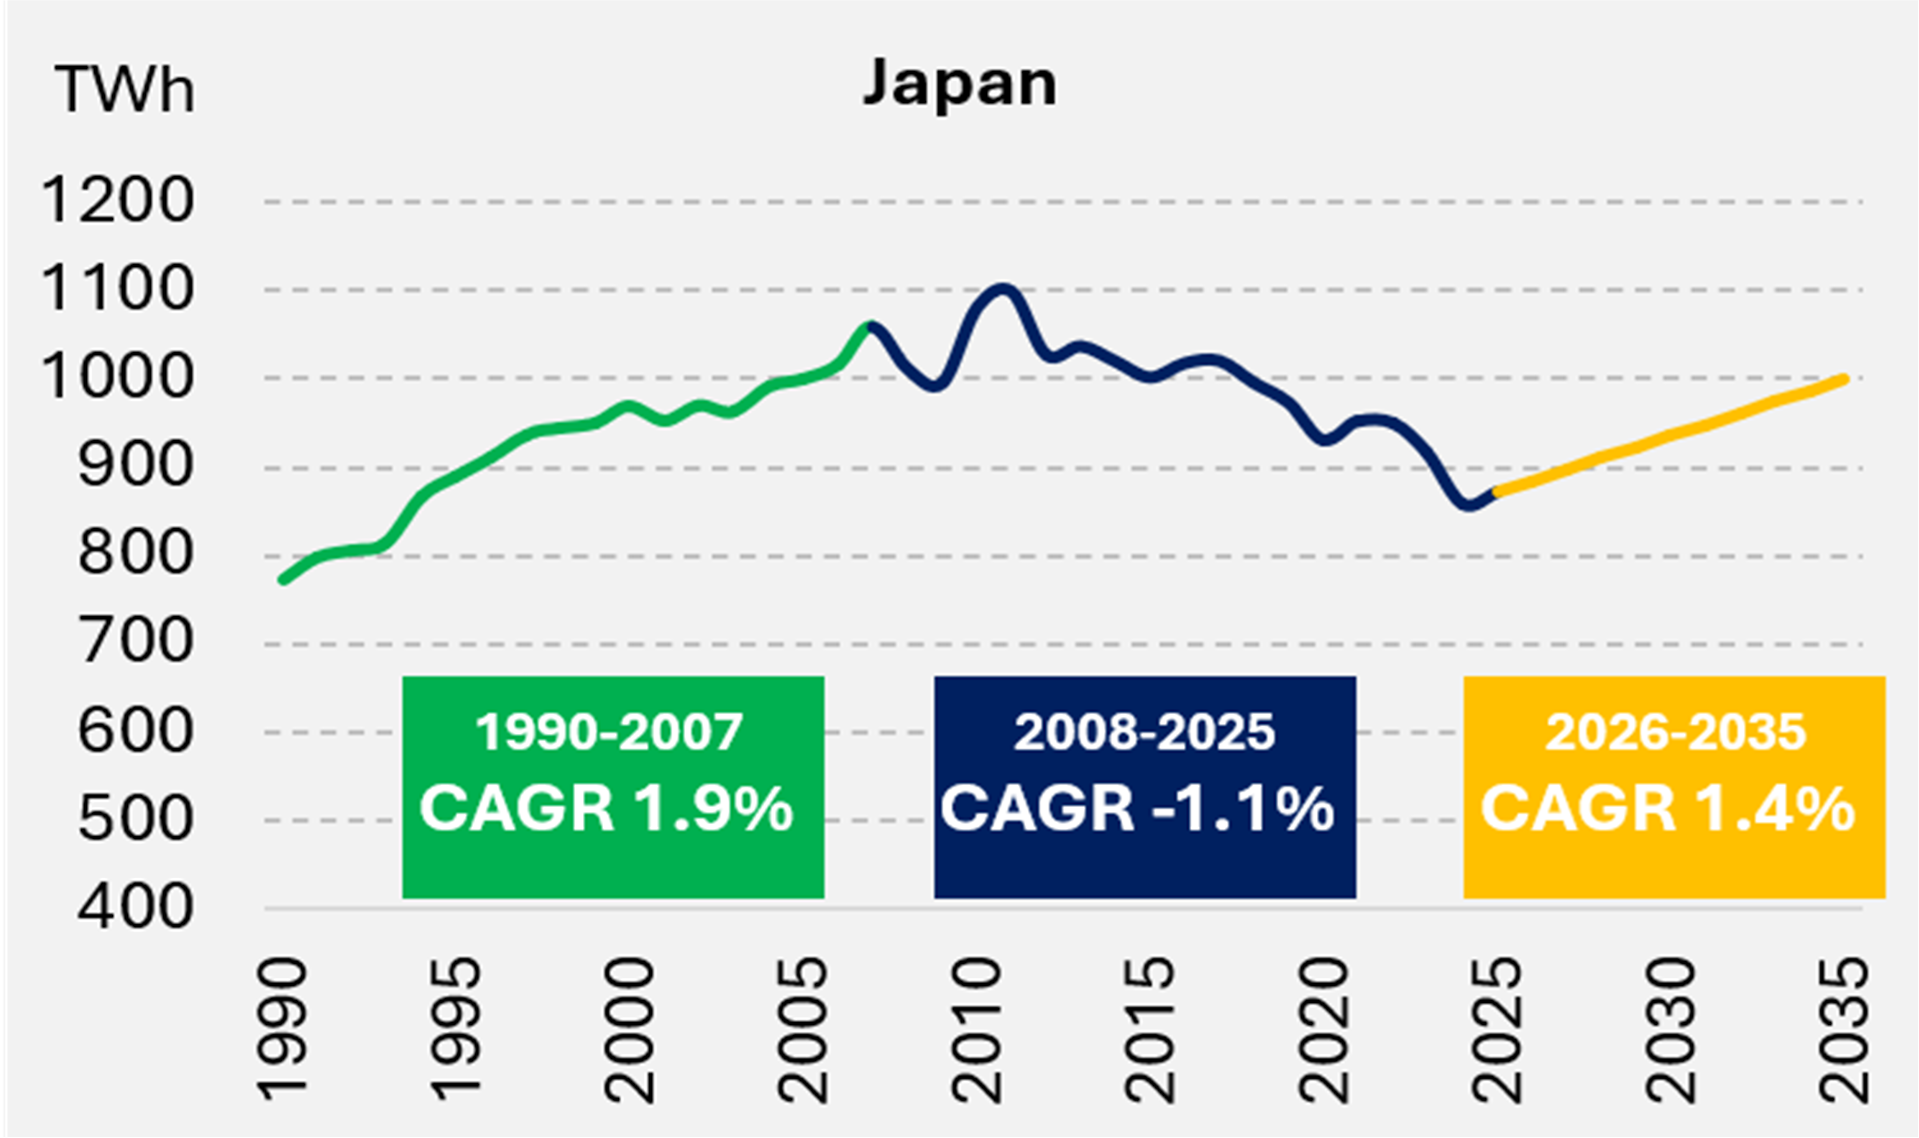
After a “lost decade” with stagnant or declining power demand in advanced economies, the global power sector has reached an inflection point as it has entered a phase of structural demand growth over the next decade around the world (see Exhibit 3). We identify three pillars for growing power demand: First, the unprecedented build-out of data centers around the world will require significantly more electricity over the next decades, primarily in the USA; second, the electrification of key economic sectors will increase the share of electricity in final energy consumption of the transportation, housing and industrial sectors, which will raise power demand in advanced economies (Europe and Japan) as well as in emerging economies (China); and third, a growing middle-class with rising incomes will get access to electricity in lower-to-middle income countries, thereby driving long-term electricity demand primarily in emerging economies.
Exhibit 3 Long-Term Power Demand Growth around the World

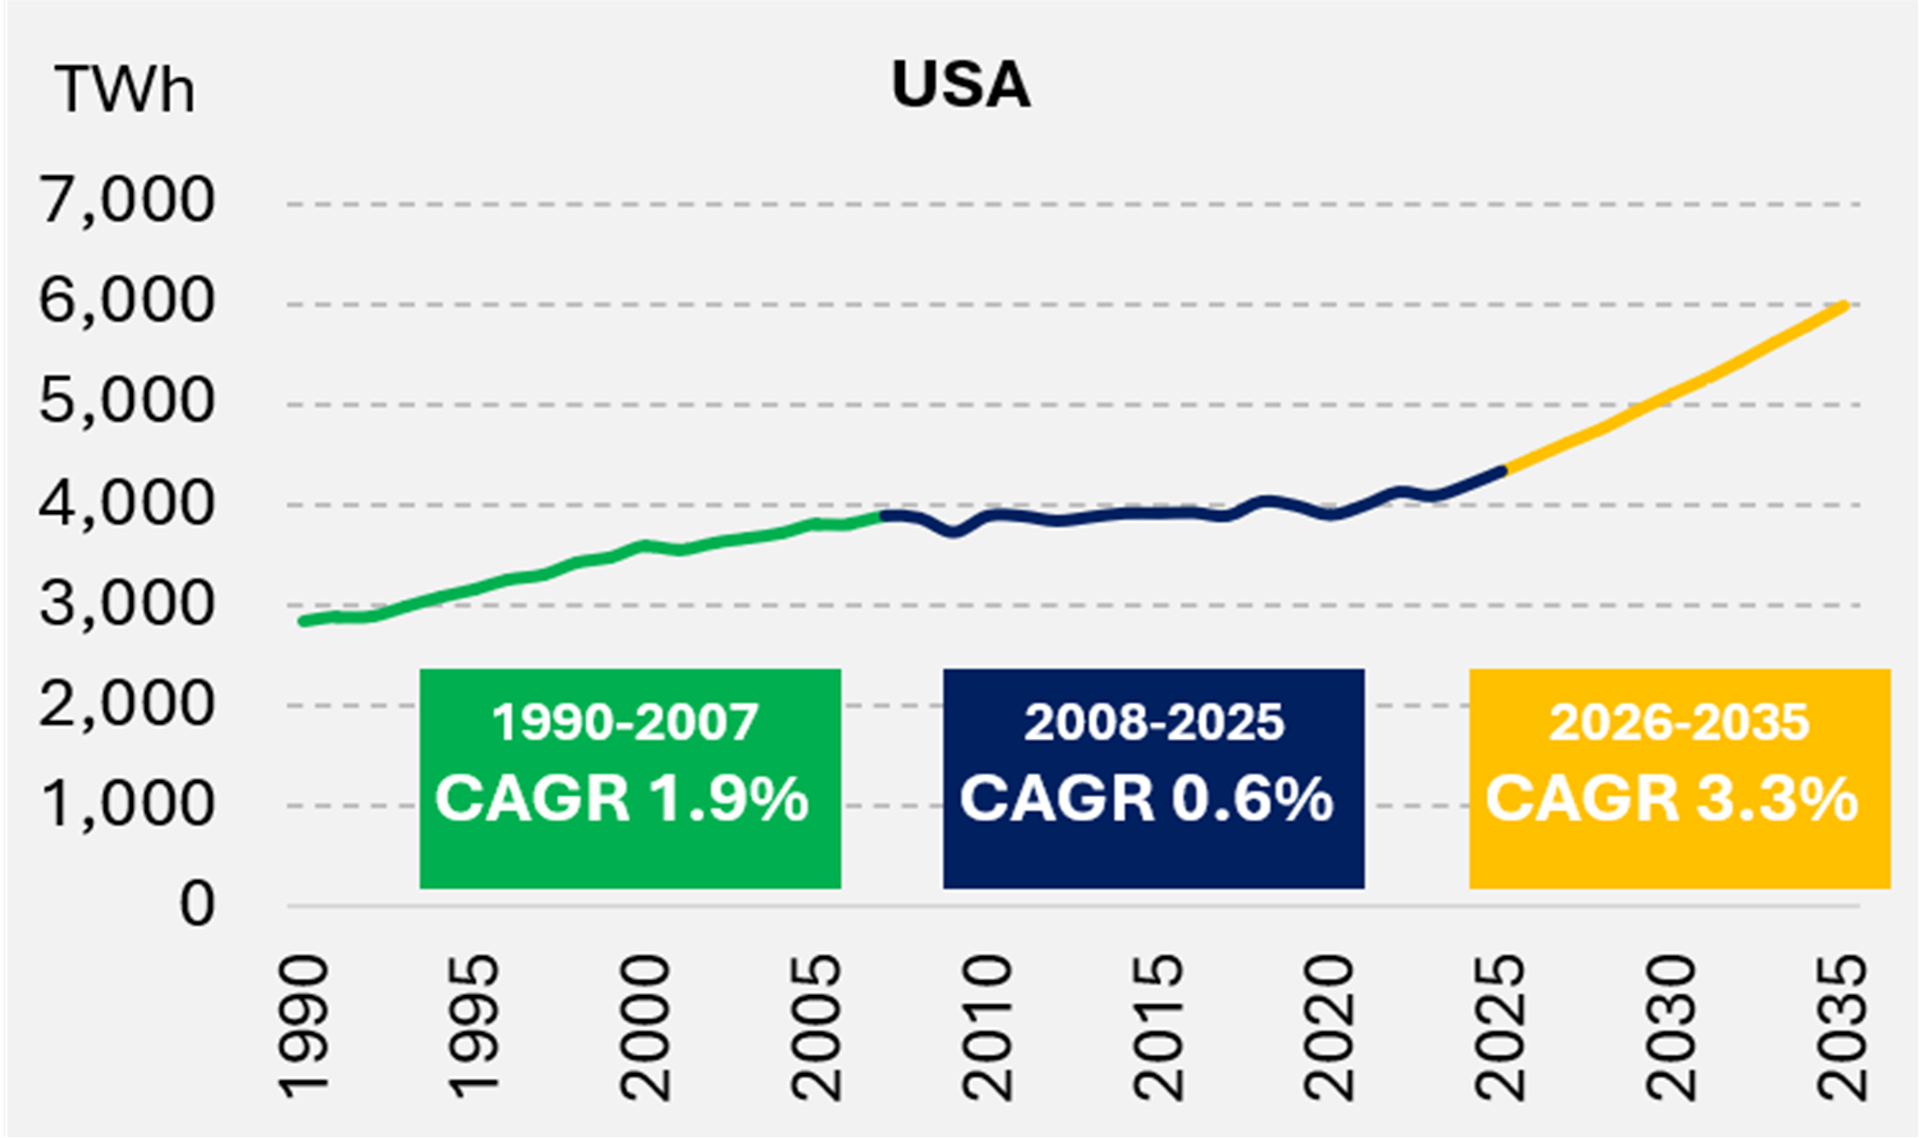



Source: Int’l Energy Agency, North American Electric Reliability Corporation (NERC)
The energy system takes primary total energy supply (TES) such as coal, gas, oil or solar irradiation, and transforms these sources of primary energy into energy products such as electricity, coking coal or gasoline, which are then distributed as energy products to end-users for final energy consumption in the transport, buildings, industrial and agriculture sectors. Currently, around 40% of primary TES serves as an input to electricity generation, including coal, natural gas, nuclear energy as well as renewable energy resources such as hydropower, wind and solar. Electrification is defined as the share of electricity that is used as an end-use product in total final energy consumption (in addition to other energy products, such as gasoline and coking coal).
Differences in electrification by end-use sector around the world
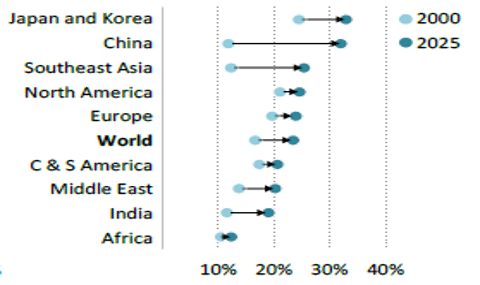
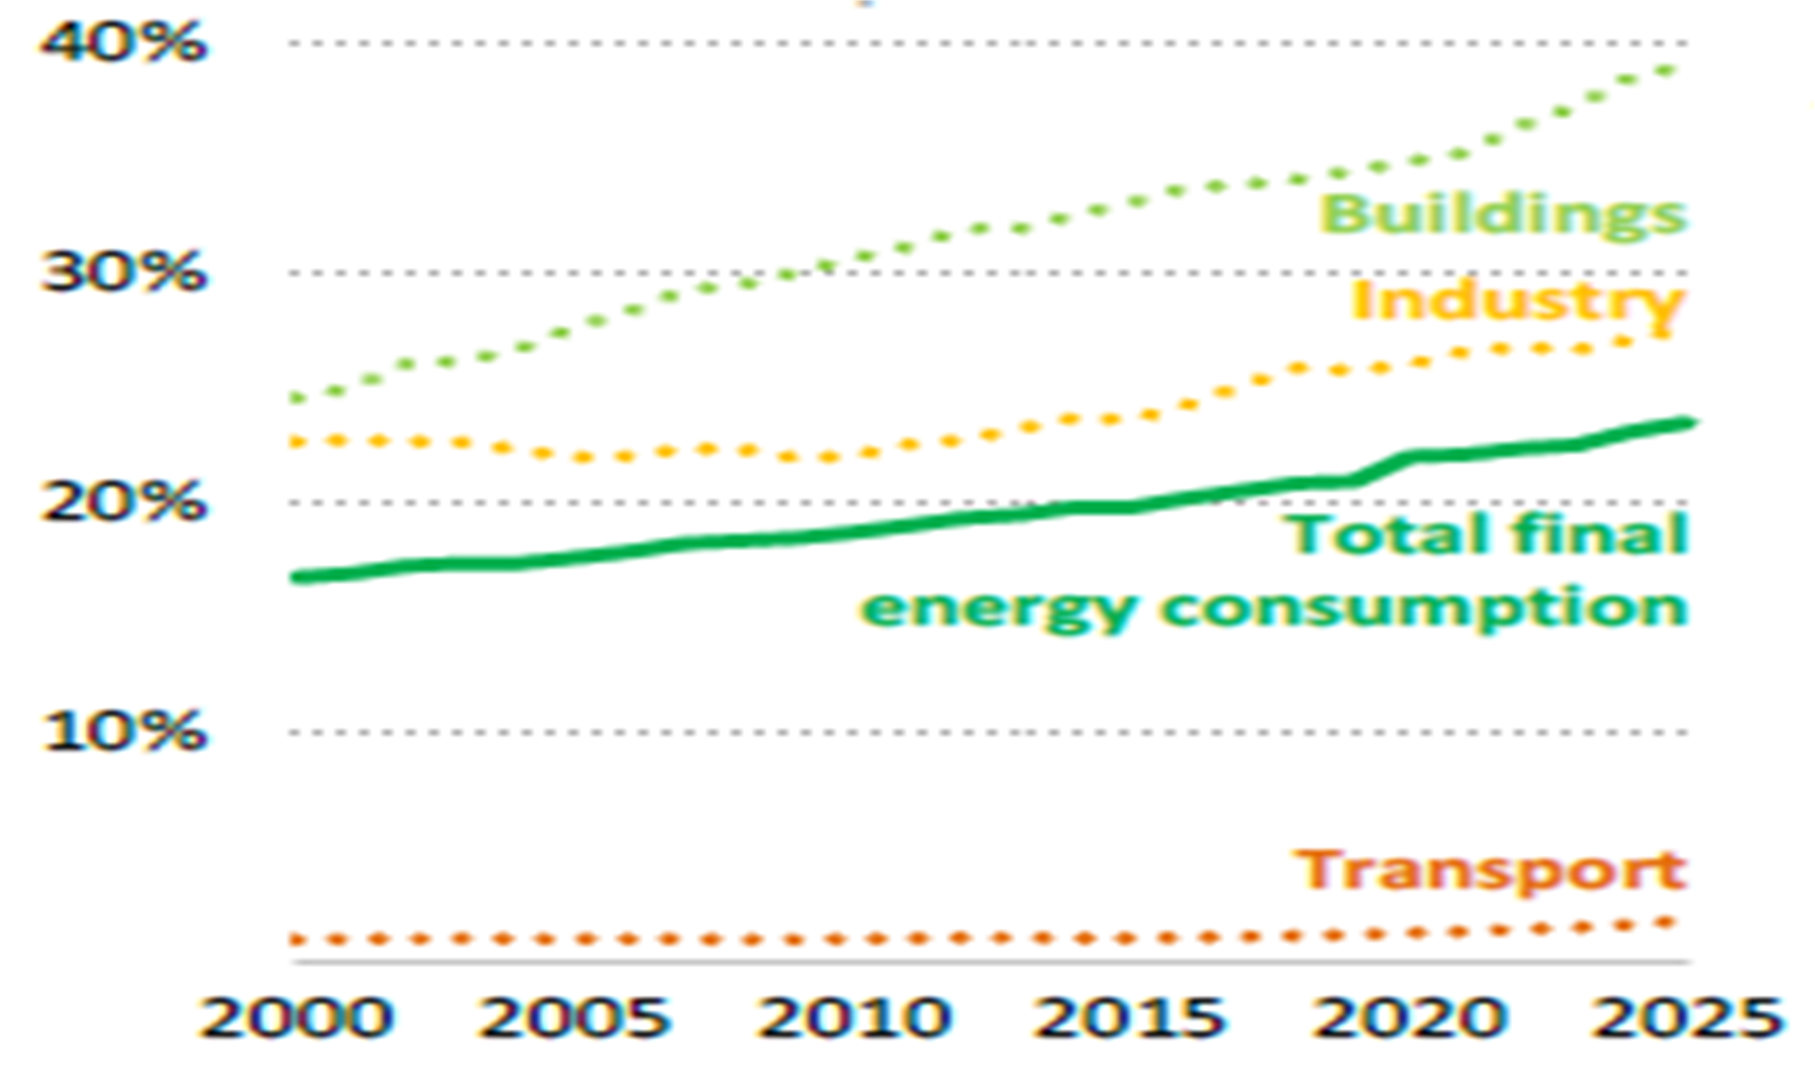
Despite rapid power demand growth, electricity currently accounts for just 23% of the world’s final energy consumption with electrification rates varying significantly across countries and sectors (see Exhibit 4 on left).
Exhibit 4 Change in electricity consumption as a share of total final energy consumption from 2000 to 2025
Electrification by region Electrification by sector

Source: International Energy Agency (Electricity 2026)
Electrification rates differ widely by region, shaped by economic structure, energy systems, climate and policy. Major economies in East and Southeast Asia are among the most electrified countries. In Japan and Korea, electricity already covers about one third of final energy consumption. That reflects high import-driven fuel prices, large and highly electrified export manufacturing, and climates that need both heating and cooling. China and Southeast Asia have caught up quickly since 2000 as advanced manufacturing grew and traditional biomass use fell. Fossil fuel producers such as North America and the Middle East lag behind, because cheap oil and gas have slowed the uptake of electric technologies.
Europe sits at about 24% despite high fuel prices. Its large heating demand has long been met by natural gas, first produced at home and later imported from Russia, and its industry has fewer highly electrified sub-sectors. Africa is the lowest at just over 12% in 2025, half the global average and only 2 percentage points higher than in 2000. More than 600 million people there still lack access to electricity, and heavy reliance on inefficient biomass pushes the electrification rate down further.
Across sectors, buildings are the most electrified (see Exhibit 4 on right). Their electricity share rose from about 25% in 2000 to nearly 40% in 2025, mainly because of more air conditioners and appliances, along with a gradual shift to electric cooking as well as space and water heating. Industry has electrified quickly since 2010, as non-energy-intensive sectors switched to electricity and already-electrified sectors like advanced manufacturing grew faster. Transport is far behind. Outside rail, electricity has played only a small role, and its share of transport energy rose from just 1% in 2015 to nearly 2% in 2025, or 4% of useful energy given its efficiency. While electric vehicles are still a small part of the total vehicle fleet, it is seen as the main growth driver for electrifying the transport sector as long-distance aviation and shipping remain hard to electrify.
Deployment of electrification technologies has already accelerated over the last decade. Falling costs (especially for batteries), innovation and policy support driven by energy security, climate and industrial strategy have all helped. In transport, global electric car sales grew 40-fold from 2015 to over 20 million in 2025, about one in four new cars sold. More than 10 million electric two- and three-wheelers are sold each year, mostly in developing Asia, and sales of electric trucks are growing fast in several markets. Together, EVs now replace 2.3 million barrels of oil per day.
In buildings, air conditioner shipments reached nearly 200 million units in both 2024 and 2025, and heat pump sales have grown over 4% per year since 2019. Data center server capacity grew about 17% annually from 2015 to 2025, and electric reverse-osmosis desalination is also adding demand. In industry, investment is rising in electric technologies for low-temperature heat. Supporting electrification infrastructure is expanding as well: grid investment rose from $315 billion in 2015 to $450 billion in 2025. Stationary battery storage additions reached almost 120 GW in 2025, nearly 100 times the 2015 level. Total electricity supply and grid investment is set to reach $1.6 trillion in 2026, or $2 trillion including end-use electrification, about 60% of global energy investment.
Entering the Power Investment Super-Cycle
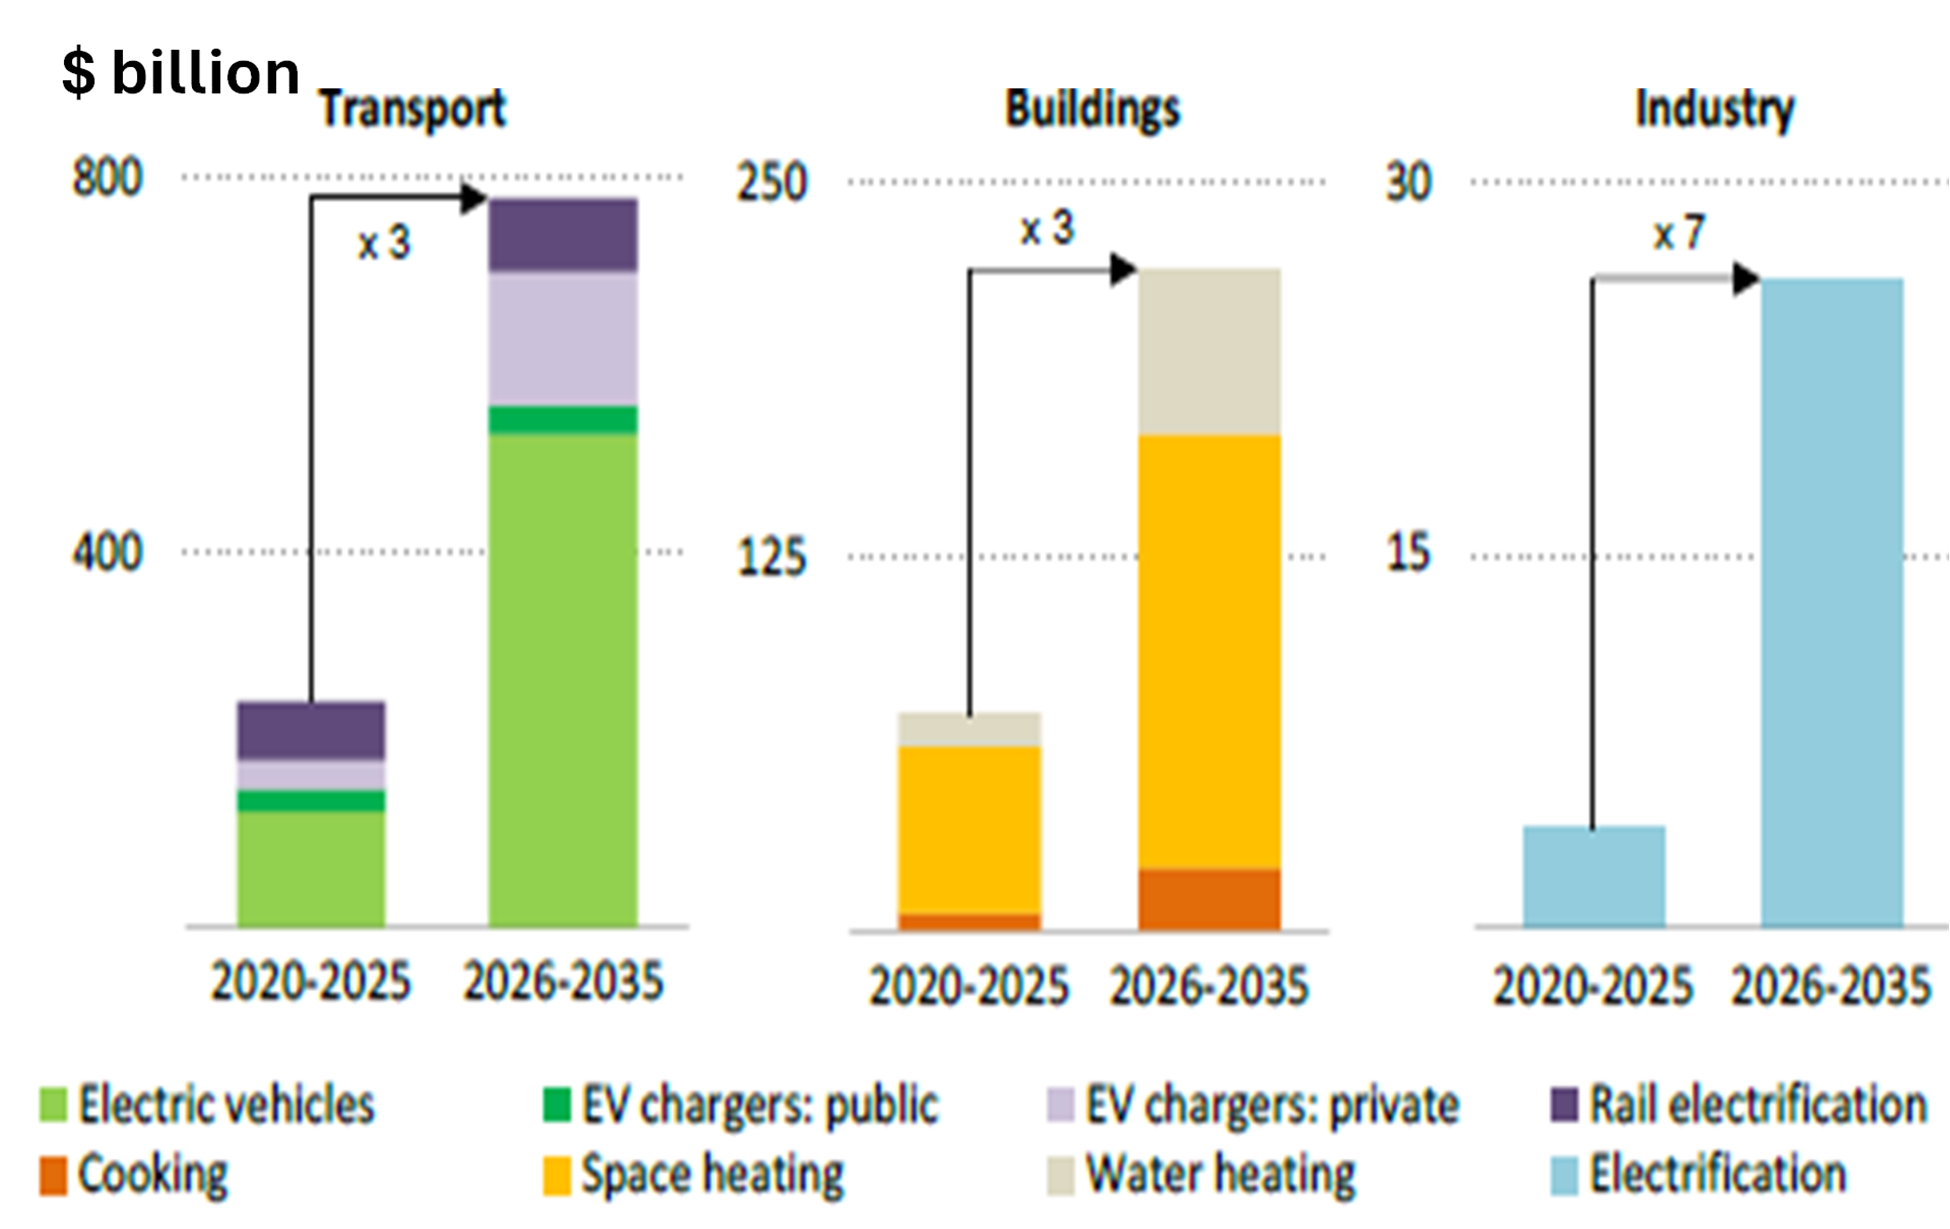
Electrification needs significantly higher investment in end-use sectors as well as in power supply. Today about $320 billion per year goes into electrifying the transport, buildings and industrial sectors, which rises to about $1 trillion in these three sectors by 2035 (see Exhibit 5).
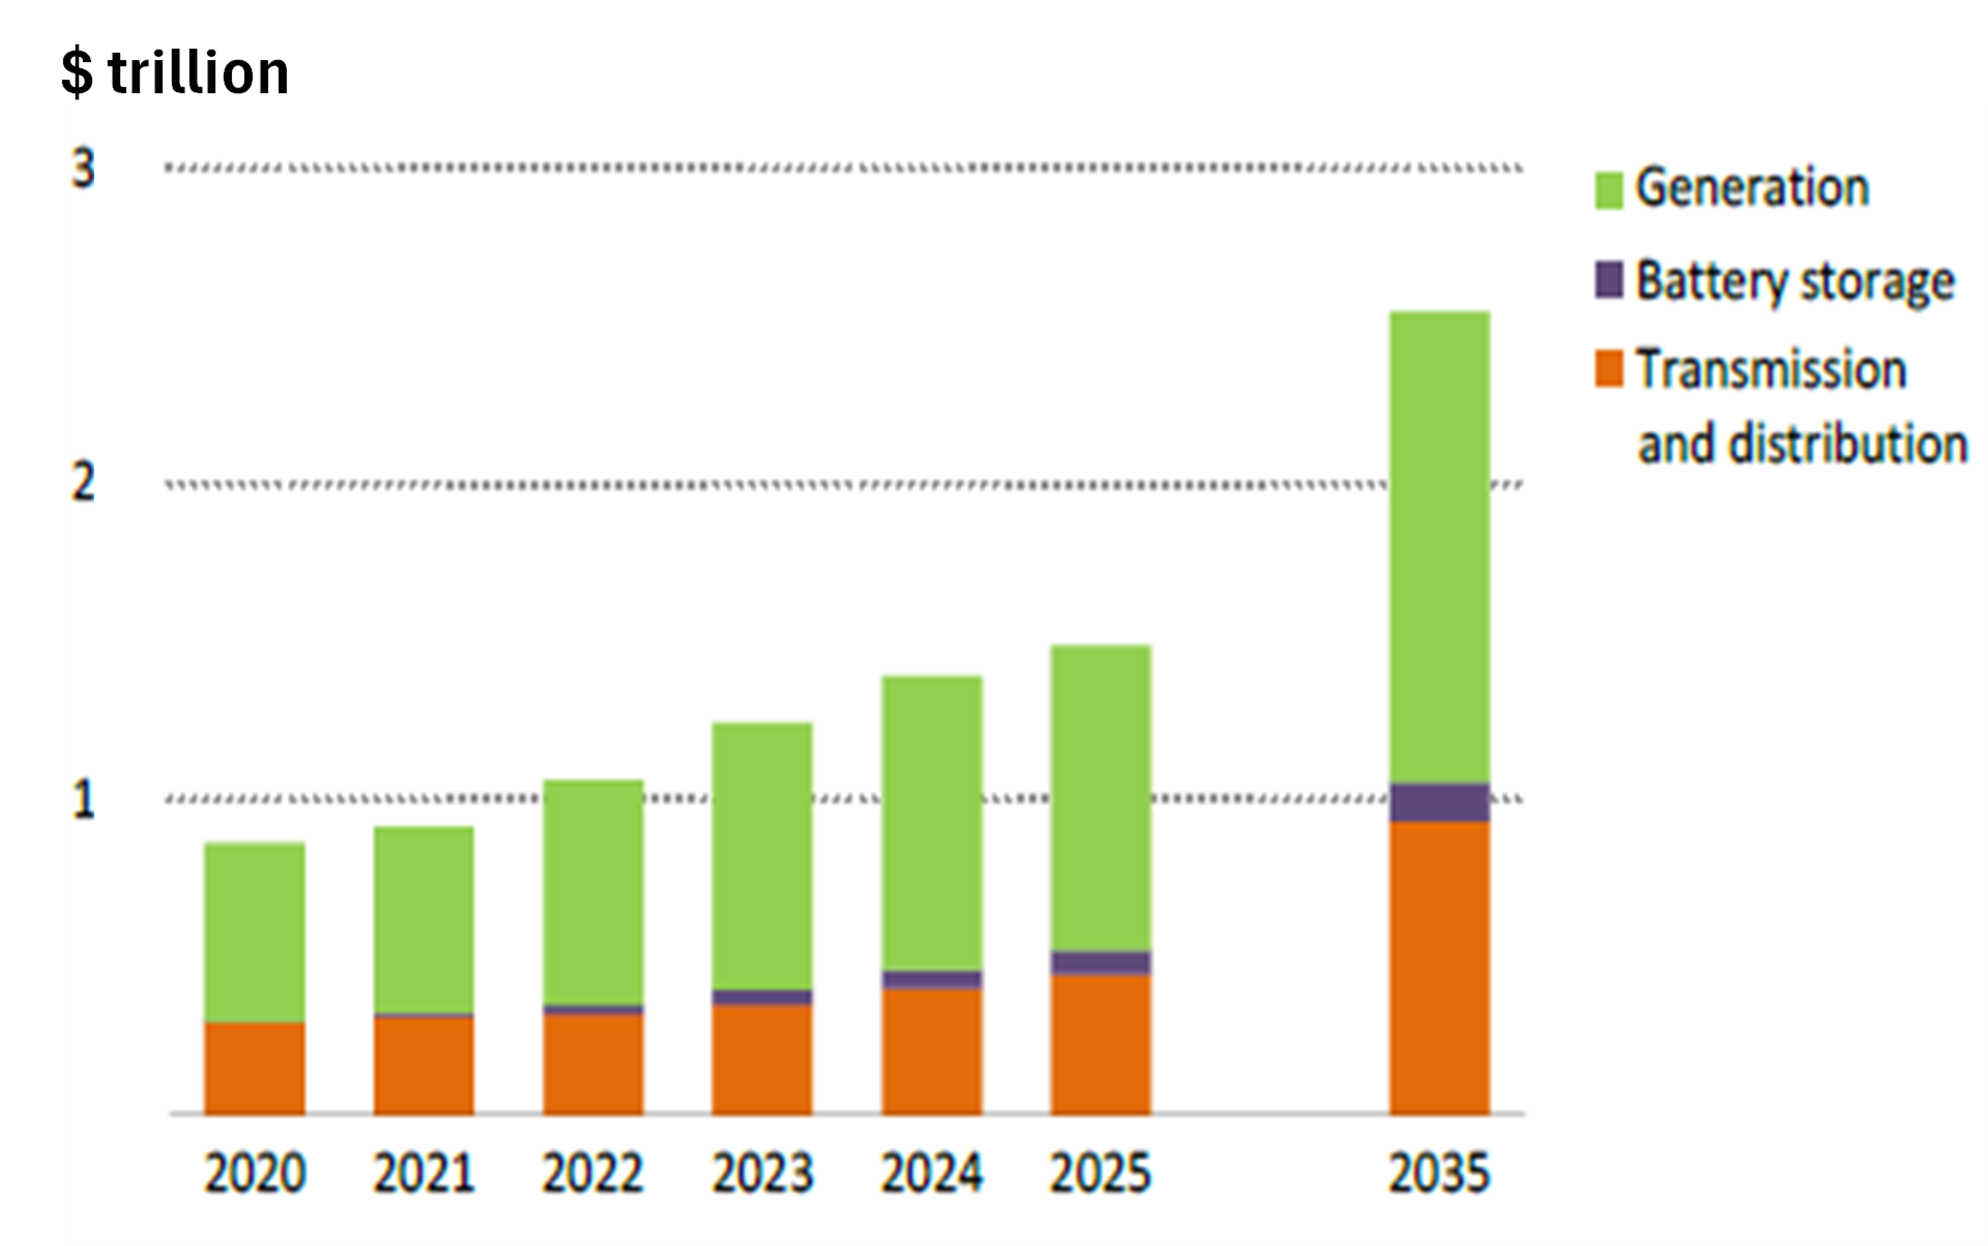
Exhibit 5 Annual investment Exhibit 6 Annual power
by end-use sector sector investment


Source: International Energy Agency (Electricity 2026)
Transport takes the largest share: spending on EVs by households and businesses grows from $125 billion to about $530 billion, and charging infrastructure adds about $175 billion a year. In buildings, electric space heating such as heat pumps drives most of the growth. Industry electrification grows the most in relative terms, rising almost sevenfold by 2035, though it starts from a very low base. Much of this spending is done by households, small businesses and public bodies, so cost matters a great deal. Some of these investments already pay off today, but others need new infrastructure or policy support to make capital easier or cheaper to get.
Global investment in the power sector grew by more than 70% in five years, from about $865 billion in 2020 to $1.5 trillion in 2025 and reaches about $2.5 trillion by 2035, with most of the additional capex going to low-emissions generation, storage and grids (see Exhibit 6). Generation remains the largest component, which rose from $560 billion to $960 billion between 2020 and 2025 and is projected to reach about $1.5 trillion by 2035, mostly in renewables. Battery storage is growing fastest: it went from about $5 billion to $80 billion and reaches about $125 billion by 2035, because it helps integrate intermittent renewable energy resources and makes the power system more flexible. Grid investment rose from $295 billion to $450 billion and nearly doubles to about $930 billion by 2035, so that transmission and distribution networks can keep up with the faster global electrification.
Taken together, total power investment in end-use sectors (in Exhibit 5) plus the power sector (in Exhibit 6) is projected to exceed $3 trillion annually over the next ten years, with most of the spending required in advanced economies and China because of their economic size and high electricity use. These countries already invest heavily in generation, grids and EVs, and their total electrification investment is projected to double from an average of $1.1 trillion annually in 2020-2025 to $2.2 trillion annually in 2026-30. In emerging markets and developing economies, total investment roughly triples to average almost $1 trillion annually in 2026-2030. Their biggest investment increase comes from EVs (including two- and three-wheelers) and the related power infrastructure, as well as from power grids and energy storage.
Private Market Value (PMV) Watch – Deals, Deals and more Power Sector Deals
Italgas gains joint control of Portugal’s largest gas distribution company
Italgas has acquired 100% of Meet Europe Natural Gas from Marubeni and Toho Gas. Meet Europe Natural Gas holds a 22.5% stake in Floene, Portugal’s leading gas distribution system operator (DSO), which serves about 1.1 million customers through a 4,000 km network that includes the Lisbon metropolitan area. The acquisition gives Italgas joint control of Floene. Italgas CEO Paolo Gallo said the deal will combine Floene’s local presence with Italgas’ expertise in network digitalisation and operational efficiency. Italgas paid an equity value of about €120 million for the 22.5% stake. In 2025, Floene reported EBITDA of €105.6 million and net debt of €613 million. Portugal’s energy regulator ERSE (Entidade Reguladora dos Serviços Energéticos) put Floene’s regulated asset base (RAB) at €1 billion in 2025. On these figures, Italgas paid an implied EV/EBITDA of 10.9x and EV/RAB of 1.15x for an asset that earns a 10.6% EBITDA return on its RAB. The deal takes Italgas into regulated gas distribution in Portugal and uses about a quarter of the €0.5 billion M&A budget set out in its 2026–2032 business plan. At 1.15x RAB, Italgas paid a modest premium to the 1.07x that Enagas paid GIC in April for a gas network in France. We think Floene’s higher EBITDA return on RAB (10.6% vs 9.1%) justifies the premium.
GE Vernova buys power grid company
GEV acquired Trench Group for $9 billion or 18x EV/EBITDA based on Trench’s reported EBITDA in FY 2026. Trench produces high-voltage grid equipment (high- and medium-voltage bushings, instrument transformers, and coils) and will add around $500 million to GEV’s “Electrification” EBITDA in 2028. The acquisition is expected to close at the end of 2027 and will be funded equally with cash and new debt.
Veolia reportedly weighs selling businesses in mature European markets
As part of Veolia’s ongoing €2 billion asset disposal plan, several reports have appeared in October about potential divestments of assets across Europe. Veolia appears to be working with advisors to consider different options (including a possible sale) for its Italian operations, although the company had said the unit is not part of its disposal plan. The Italian business is active in energy efficiency, renewable power generation, as well as water and waste management. According to Veolia’s 2025 annual report, its Italian business generated €978 million of revenue and reported an EBITDA of around €100 million. Veolia is also exploring the sale of its waste management business in Belgium, which operates hazardous waste, wood recycling and organic refuse businesses. Of these, the hazardous waste activities may receive the strongest interest from infrastructure and private equity investors. Finally, according to Mergermarket, Veolia has also launched the sale of its water and wastewater business in Germany with a small auction process that targets only a few potential bidders. In addition to municipal water services, Veolia operates a large industrial water platform in Germany, providing water treatment, process water, desalination and wastewater solutions to industrial clients in the chemicals, food and beverage, energy and biofuels sectors.
RWE sells stake in Five Estuaries offshore wind project in the UK
RWE has finalized the sale of its 33.33% stake in the Five Estuaries offshore wind farm to EDF. EDF Power Solutions UK & Ireland takes over RWE’s share and will lead the project on behalf of the joint venture partners. Before the sale, RWE led the development on behalf of the project partners and was the largest shareholder. Britain’s Secretary of State for Energy Security and Net Zero granted Five Estuaries development consent in December 2025. Five Estuaries is an extension to RWE’s operational Galloper wind farm in the UK. Once operational, Five Estuaries could generate enough electricity to power about 1 million UK households. No sales price was disclosed but RWE plans to reinvest the proceeds in its existing portfolio of offshore wind projects.
Growing investor interest in Spanish power distribution networks
The association of electricity distribution companies in Spain (CIDE) sees a growing investor appetite for accelerating the consolidation of the fragmented sector of distribution network system operators (DSOs) in Spain. Investment funds and major electric utilities are interested in acquiring stakes in Spanish DSOs as they are drawn by the sector’s regulated revenues and the growing need for grid expansion to support renewable energy deployment, electrification, and new demand from industries like AI data centres. CIDE president Gerardo Cuerva notes that while Spain can produce competitive renewable electricity, the real bottleneck is insufficient grid infrastructure to deliver electricity where it is needed, particularly in rural areas that are served by nearly 200 small DSOs across over 600 municipalities.
Power Points
EUROPE
Italy caps gas prices at €60/MWh
After six months of talks with the European Commission, Italy has won approval for a gas price cap of about €60/MWh for thermal power generation. However, it is an 18-month emergency measure, not the permanent ETS (Emission Trading System) sterilization that was first planned. The Commission said the Italian scheme is based on the 2022 Iberian gas-for-power mechanism. It will offset higher gas costs but not ETS costs, and all of the benefit must be passed on to final consumers. With gas prices at about €85/MWh, Minister Pichetto expects savings of “more than €25/MWh,” which would cut wholesale power prices by about 10% from about €200/MWh. Pending EU notification, the cap could apply from January 2027.
RWE and KKR reportedly bid for German state-owned utility Uniper
Bloomberg reported that RWE and private equity firm KKR have submitted a joint non-binding bid for Uniper. The German government owns about 99% of Uniper, which is currently valued at around €19 billion. It is looking for a suitable owner for the strategically important gas utility as it seeks to unwind its 2022 bailout. The government wants Uniper to be kept as an integrated business and plans to retain a stake of around 25%. Uniper’s works council firmly opposes a sale and prefers an IPO to safeguard the company’s independence. Uniper’s generation portfolio consists mainly of around 11 GW of gas-fired capacity, largely in the UK and Germany, plus 3.6 GW of hydro. These assets would complement RWE’s existing flexible generation portfolio. However, a joint bid would be a notable reversal for RWE. On the 1H 2026 results call on 13 August, CEO Markus Krebber said the company had no interest in acquiring Uniper. Neither RWE nor KKR has commented.
Iberdrola: Here comes (another) guidance raise
Iberdrola delivered another set of solid of 9M 2026 results. Adjusted EBITDA rose 7.5% YoY to €11.9 billion and adjusted net profit increased 9% YoY to €5.1 billion, both driven by double-digit EBITDA growth in its Networks business. The Networks business benefited from a 16% YoY growth in the Regulated Asset Base (RAB), which was driven by double-digit RAB growth in all regions except for Spain. Conversely, EBITDA in “Electricity Generation & Customers” declined YoY by 1.4% on a lower load factor and lower pricing. More importantly, Iberdrola raised its 2026 net profit guidance to “above 10% growth,” up from “above 8% growth” in July and the original guidance of “around 6% growth” in February. The company also introduced a long-term guidance through 2030, targeting a 2025-30 CAGR of 10% for adjusted net profit.
UK WATER:
Pennon issued new equity
On 7 October 2026, Pennon announced a gross £550 million rights issue at a subscription price of 250p per share, offering 7 new shares for every 15 held. The rights issue price represents a 35.5% discount to the theoretical ex-rights price, based on the closing price of 452 pence share on 6 October 2026. The rights issue is part of a wider investment plan over AMP (asset management period) 8 and the additional funding plan. The company also cut 2026/27 expected dividend per share by 30% to 18p per share. Further, the company also announced plans to sell Pennon Power and targets a gearing of max 65% of RCV in the regulated business over AMP 8.
UK Water regulator published new reports
Following the investment funding announcement in August, on 14 October 2026, UK Water regulator Ofwat published its draft ODI (outcome delivery incentives) determination for 2025-26, which proposed a net £240 million reduction in water bills, of which £107 million will be returned to customer bills in 2027-28. This reduction reflects companies’ failures to meet performance targets of which Thames Water and Yorkshire Water are expected to face the largest penalties.
Furthermore, on 21 October, Ofwat published a financial resilience report highlighting £1.8 billion injected into water companies in 2025-26, with £1.7 billion additionally committed. However, per the report, financial resilience in the sector remains uneven with Thames Water, South East Water and Southern Water being singled out for ‘Action Required’ and enhanced oversight. Severn Trent and United Utilities got assessments of ‘Standard Monitoring’ given their relatively stronger position.
The UK has faced a prolonged dry summer with ‘hose pipe bans’ in force in several areas of England. An update from the government indicated that at least 120% of average rainfall is needed over the next 6 months for these areas in England to be considered out of drought. The government has instructed companies to intensify leak detection, monitor water resources daily and prioritize public supplies.
MIDDLE EAST:
Saudi Arabia raises electricity and water tariffs
Saudi Arabia will raise utility tariffs as part of long-planned reforms, with two major state-owned utilities confirming that electricity tariffs will rise by 5% to 17% from January 2027, while water bills will increase two- to threefold for most users. Saudi citizens have long benefited from cheap, subsidized electricity and water as part of generous government welfare. Over the past decade, however, the authorities have gradually cut and redirected some of these subsidies as part of economic reforms led by Crown Prince Mohammed bin Salman. To soften the impact of the latest increases, King Salman bin Abdulaziz Al Saud ordered support measures for citizens, including monthly allowances for families and higher minimum wages. The IMF has long called for reform of the broad subsidy regime, which it sees as distorting market prices and encouraging overconsumption.
CHINA:
Electricity market reform supports renewables growth
China’s power sector continues to undergo significant structural changes with rapid renewable capacity additions, electricity market reform and grid constraints reshaping the economics of power generation. At the end of September, combined solar and wind capacity grew approximately 17.8% YoY, with solar installed capacity +16.5% to 1,310 GW and wind installed capacity +20.4% to 700 GW. This compares with 3.9% growth in electricity consumption during the first 9 months of 2026. Wind and solar generation increased by approximately 11.1% YoY over the same period, accounting for around 64% of incremental electricity consumption, highlighting the growing contribution of renewables to China’s power supply but also the divergence between capacity and generation growth. Wind and solar utilization declined to 90.9% and 91.4% in 1H26, respectively, from 93.2% and 94% in 1H25, reflecting rising curtailment pressures.
Electricity market reforms continue and in October, the National Development and Reform Commission (NDRC) proposed revisions to spot-market rules that would facilitate joint bidding by renewable generators and battery storage facilities, potentially allowing generators to shift electricity delivery from periods of excess supply and depressed prices to higher-priced periods. The proposals also place greater emphasis on location-specific electricity pricing to better reflect regional supply-demand imbalances and transmission constraints. While these measures could eventually improve renewable monetization and reduce curtailment, they also reinforce the growing importance of realized tariffs, utilization rates and storage investment, rather than capacity expansion alone.
Recent company operating data illustrate these challenges. During 9M 2026, Longyuan’s wind generation declined 5.0% YoY and Datang Renewables’ declined 12.8%, against a backdrop of weaker wind resources and higher industry-wide curtailment. In contrast, CR Power’s total generation increased 9.7%, supported by 10.3% growth in thermal generation and 35.1% growth in solar generation. These trends highlight the increasing differentiation between pure renewable developers, which remain more exposed to weaker utilization and market-based electricity pricing, and diversified utilities such as CR Power and Huaneng Power, which benefit from a broader generation mix and greater generation flexibility. Longer term, the proposed reforms, if implemented, could improve project economics for Longyuan, Datang Renewables and China Power.
JAPAN:
How exposed are Japanese Utilities to rising interest rates?
Rising long-term interest rates have become an additional concern for global equity markets. Japanese utility stocks, however, have generally demonstrated resilience amid rising global interest rates, persistent inflation, and geopolitical uncertainty. The yield on newly issued 10-year Japanese government bonds reached 3.1% on October 7, hitting its highest level in approximately 30 years, before easing to around 2.9% in late October. In this month’s report, we review the potential impact of higher interest rates on Japan’s electric and gas utility sector.
Financial pressure from a higher rate environment
For much of the past three decades, rising interest rates were not a major concern for Japanese utilities. Today, however, several factors are contributing to a structurally higher interest-rate environment. These include reflationary policy measures, expansionary fiscal spending, elevated global commodity prices led by crude oil, increased government spending driven by evolving geopolitical dynamics, and growing electricity demand associated with AI-related infrastructure and data centers. If these trends persist, financing costs for Japanese utilities are likely to increase gradually over time.
Defensive characteristics with growth opportunities
Despite these headwinds, the Japanese utility sector retains several defensive qualities. Utility services remain essential infrastructure, providing relatively stable cash flows and stronger pricing power compared with many other industries. In addition, increasing electricity demand from AI development and data centers presents a meaningful long-term growth opportunity. As mentioned in the latest two reports, nationwide wheeling charges are scheduled to increase by approximately 10% to 18% for all major utilities, except Hokuriku Electric Power (9505). This marks the first broad-based increase since the wheeling charge system was introduced in 1995. The higher charges are expected to be reflected in electricity prices from November and should provide a multi-year earnings tailwind for utility companies. As a result, market participants will expect EBITDA forecasts for FY March 2027 to be revised upwards, with a potentially larger impact becoming visible in FY March 2028.
Strong debt servicing capacity remains intact
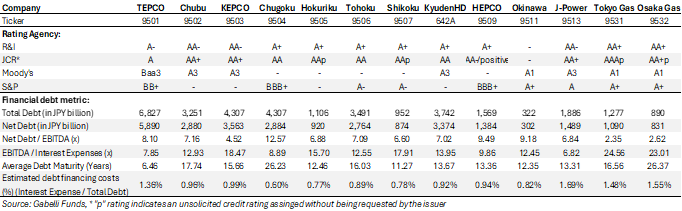
A review of utility balance sheets as of March 2026 suggests that rising interest rates are unlikely to create immediate financial stress. The EBITDA-to-interest expense coverage ratio for Japanese utilities are shown in the table below, and most utilities companies maintain interest coverage ratios above 10x. Net Debt-to-EBITDA ratios present a similar picture. Japanese gas utilities generally maintain leverage of approximately 2x to 3x, while electric utilities typically range between 5x and 10x due to the capital-intensive nature of their business (see Table 2).
Table 2 Credit ratings and financial debt metrics of Japanese electric and gas utilities

Conclusion
Given the prospect of EBITDA growth supported by higher utility charges, the current interest-rate environment does not appear to pose a material near-term risk to the sector.
Japanese electric and gas utilities generally maintain adequate debt capacity despite relatively high leverage levels. Although Net Debt-to-EBITDA remains elevated for several electric utilities, strong interest coverage ratios, often exceeding 10x, indicate solid debt-servicing capability. Furthermore, long debt maturities and low average financing costs help mitigate refinancing risk and support continued access to debt capital markets. With interest rates continuing to trend higher, investors will closely monitor the upcoming 1H FY 2026 earnings announcements, scheduled for late October and early November, for signs of upward revisions to EBITDA and EBIT guidance.
European Power Prices and Global Electricity Demand Growth
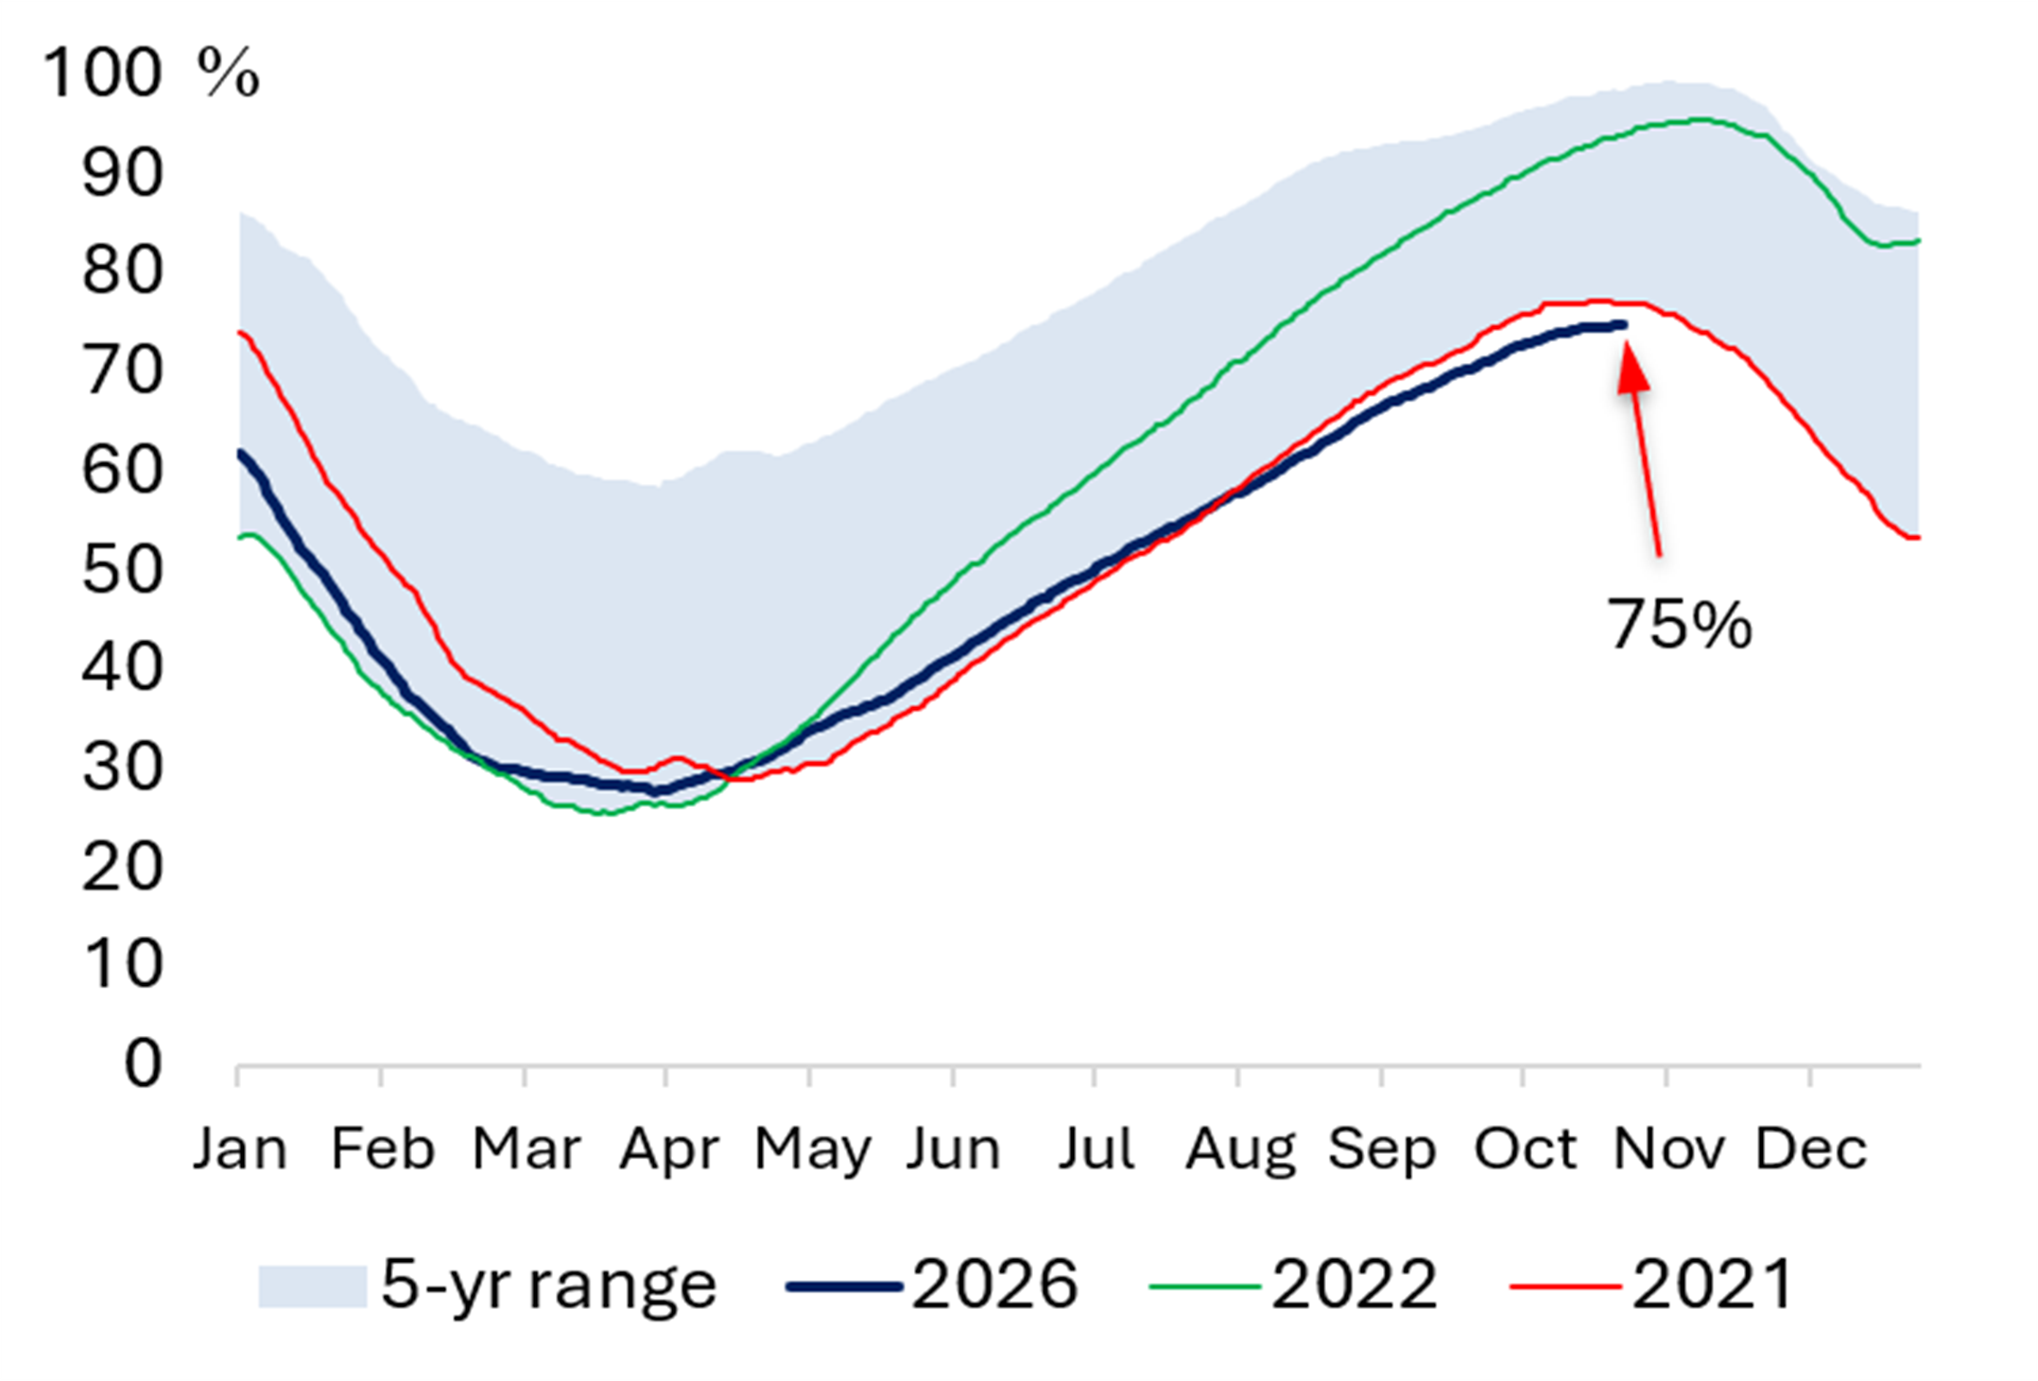
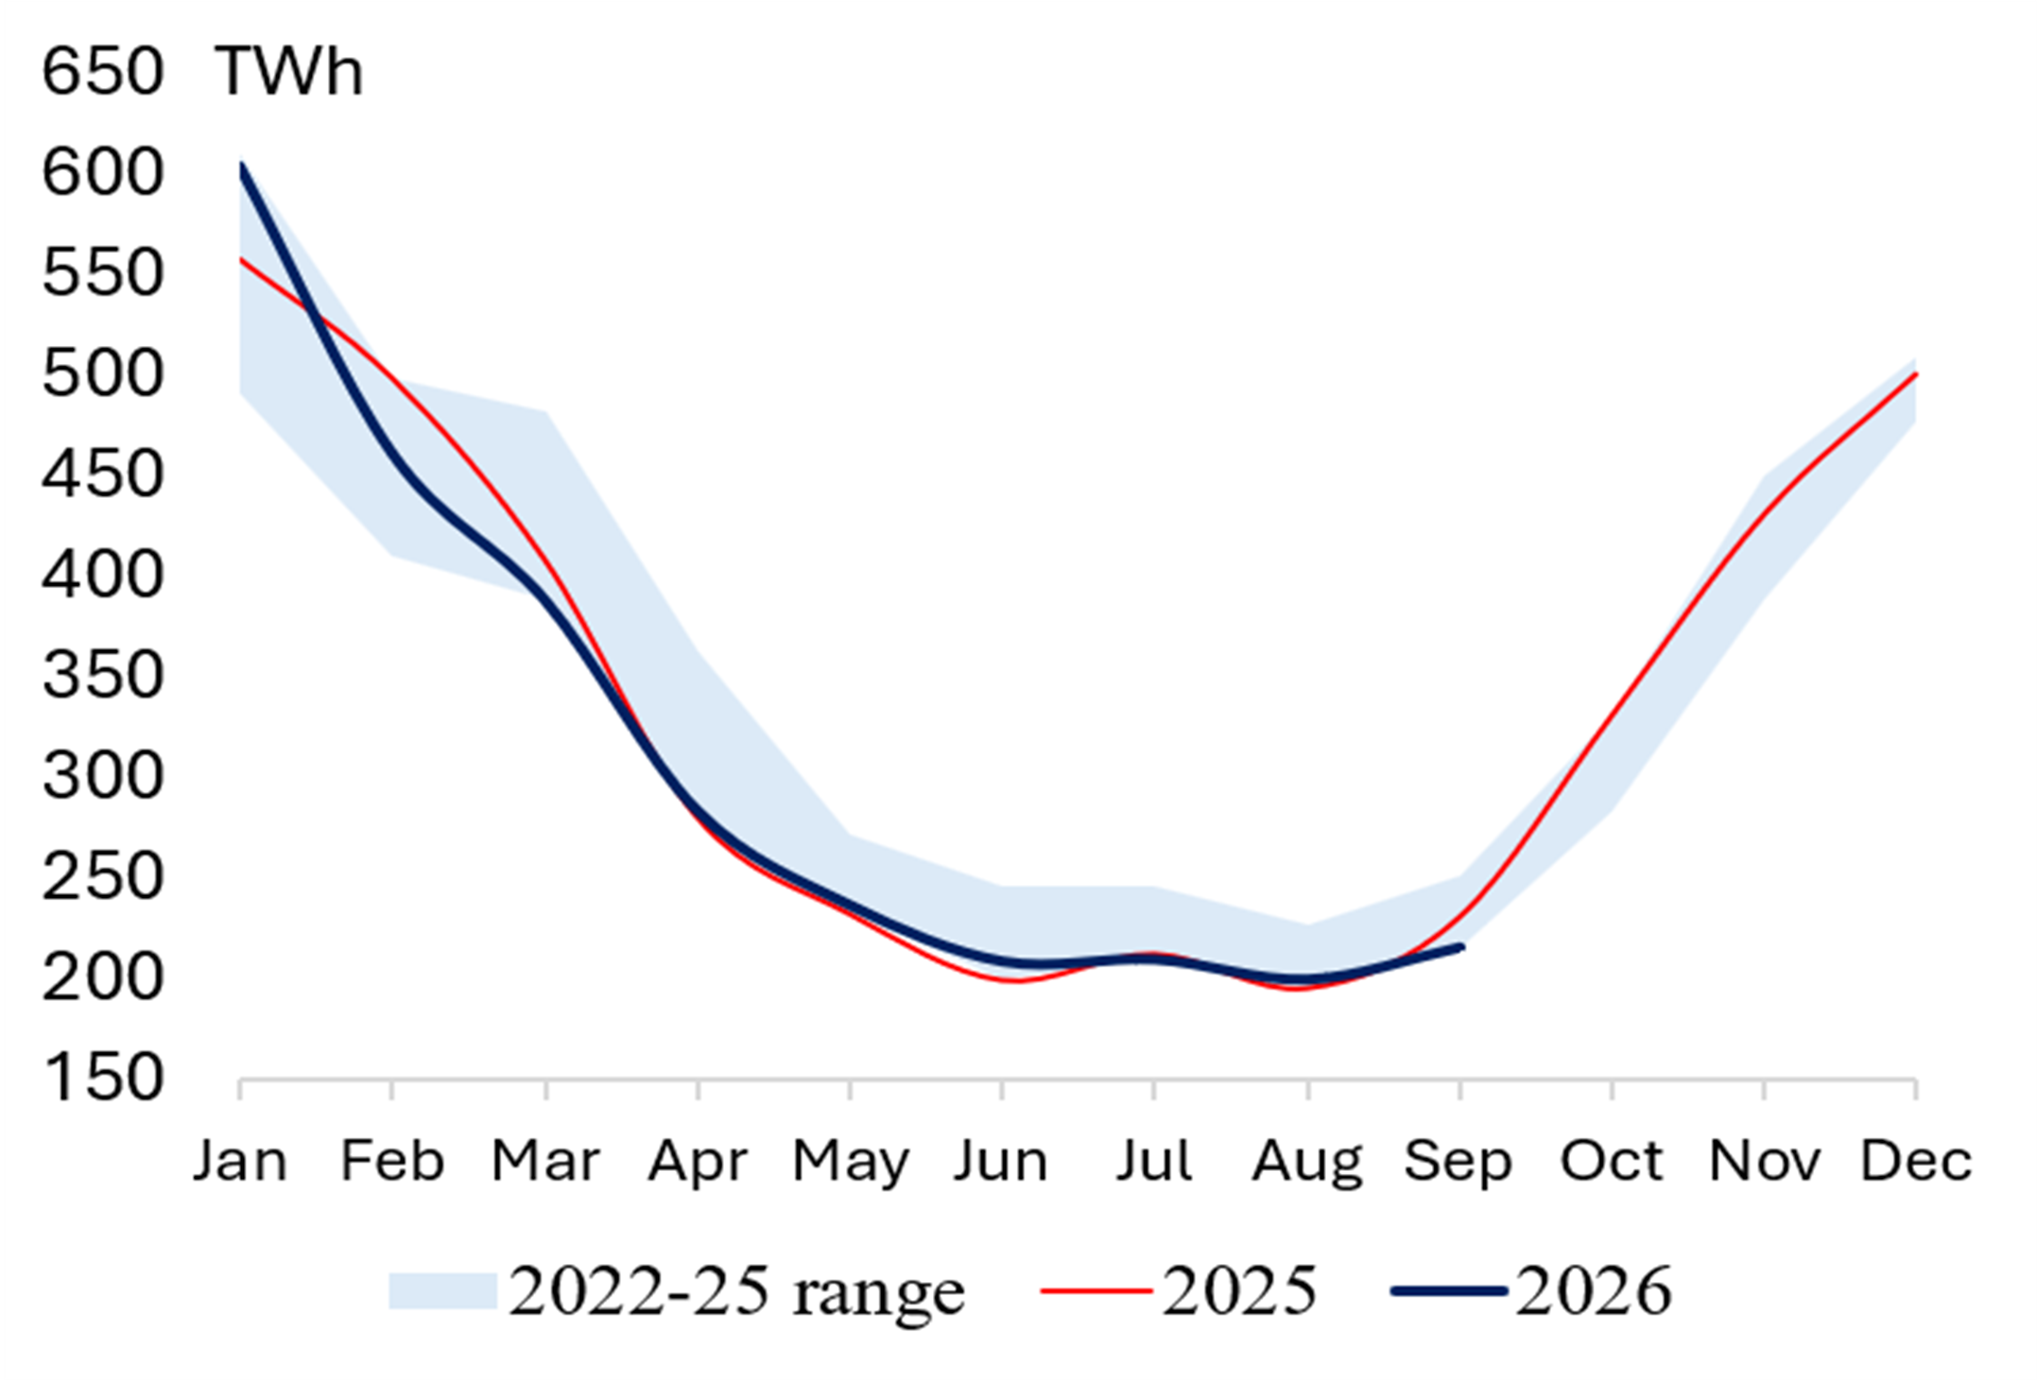
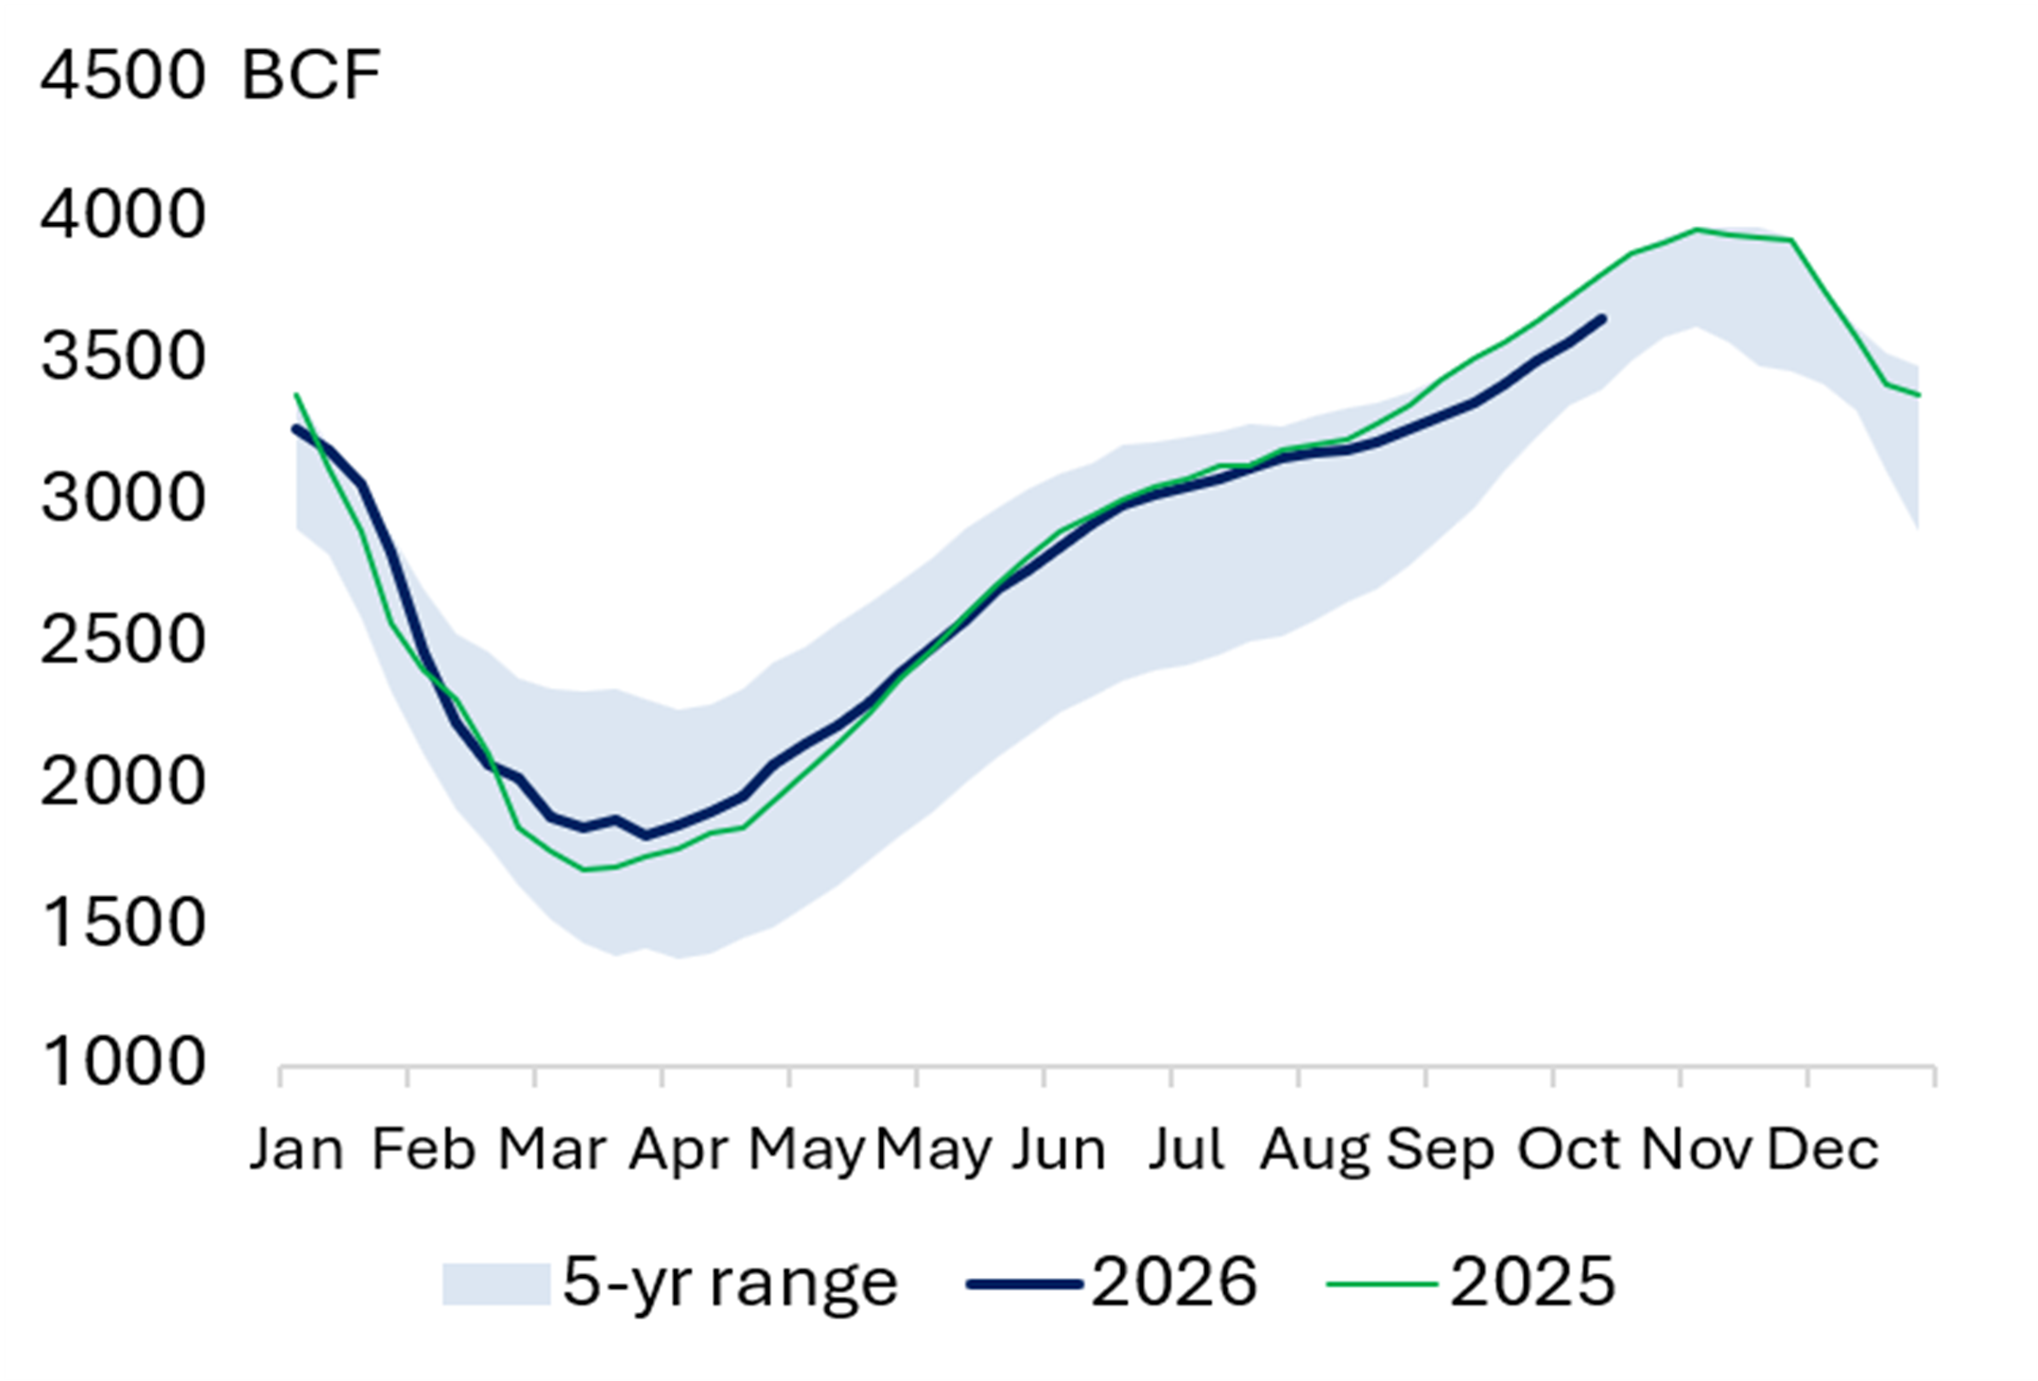
The Iran conflict has pushed Europe into its second energy crisis in four years, but unlike 2022, when Russia cut pipeline gas supplies, Europe faces limited volume risk this time: only around 0.1% of total gas imports in 2Q 2026 came from the Middle East (see Exhibit 11), with the last LNG cargoes delivered in April before monthly LNG imports from the Middle East stopped entirely in May 2026 (see Exhibit 12). However, as Europe failed to replenish depleted gas storage through LNG purchases from the US this summer (US LNG exports were diverted from Europe to Asia, see Exhibit 10), EU gas storage is just 75% full at the end of October, below the lowest level for that time of year since 2021, just before the 2022 energy crisis started (see Exhibit 7). As European buyers now compete with Asian buyers in the spot market to refill storage for the winter, LNG prices – and, by extension, European gas prices – are likely to remain elevated through the winter months. With average LNG prices already running 51% above last year’s level on a year-to-date basis, European gas prices have moved higher as well. Average EU gas prices are up 45% versus 2025, while average UK gas prices are 36% higher year-to-date than in 2025 (see Table 3).
Table 3 Megawatts & Molecules: Average Annual Electricity, Carbon, Coal and Gas Prices

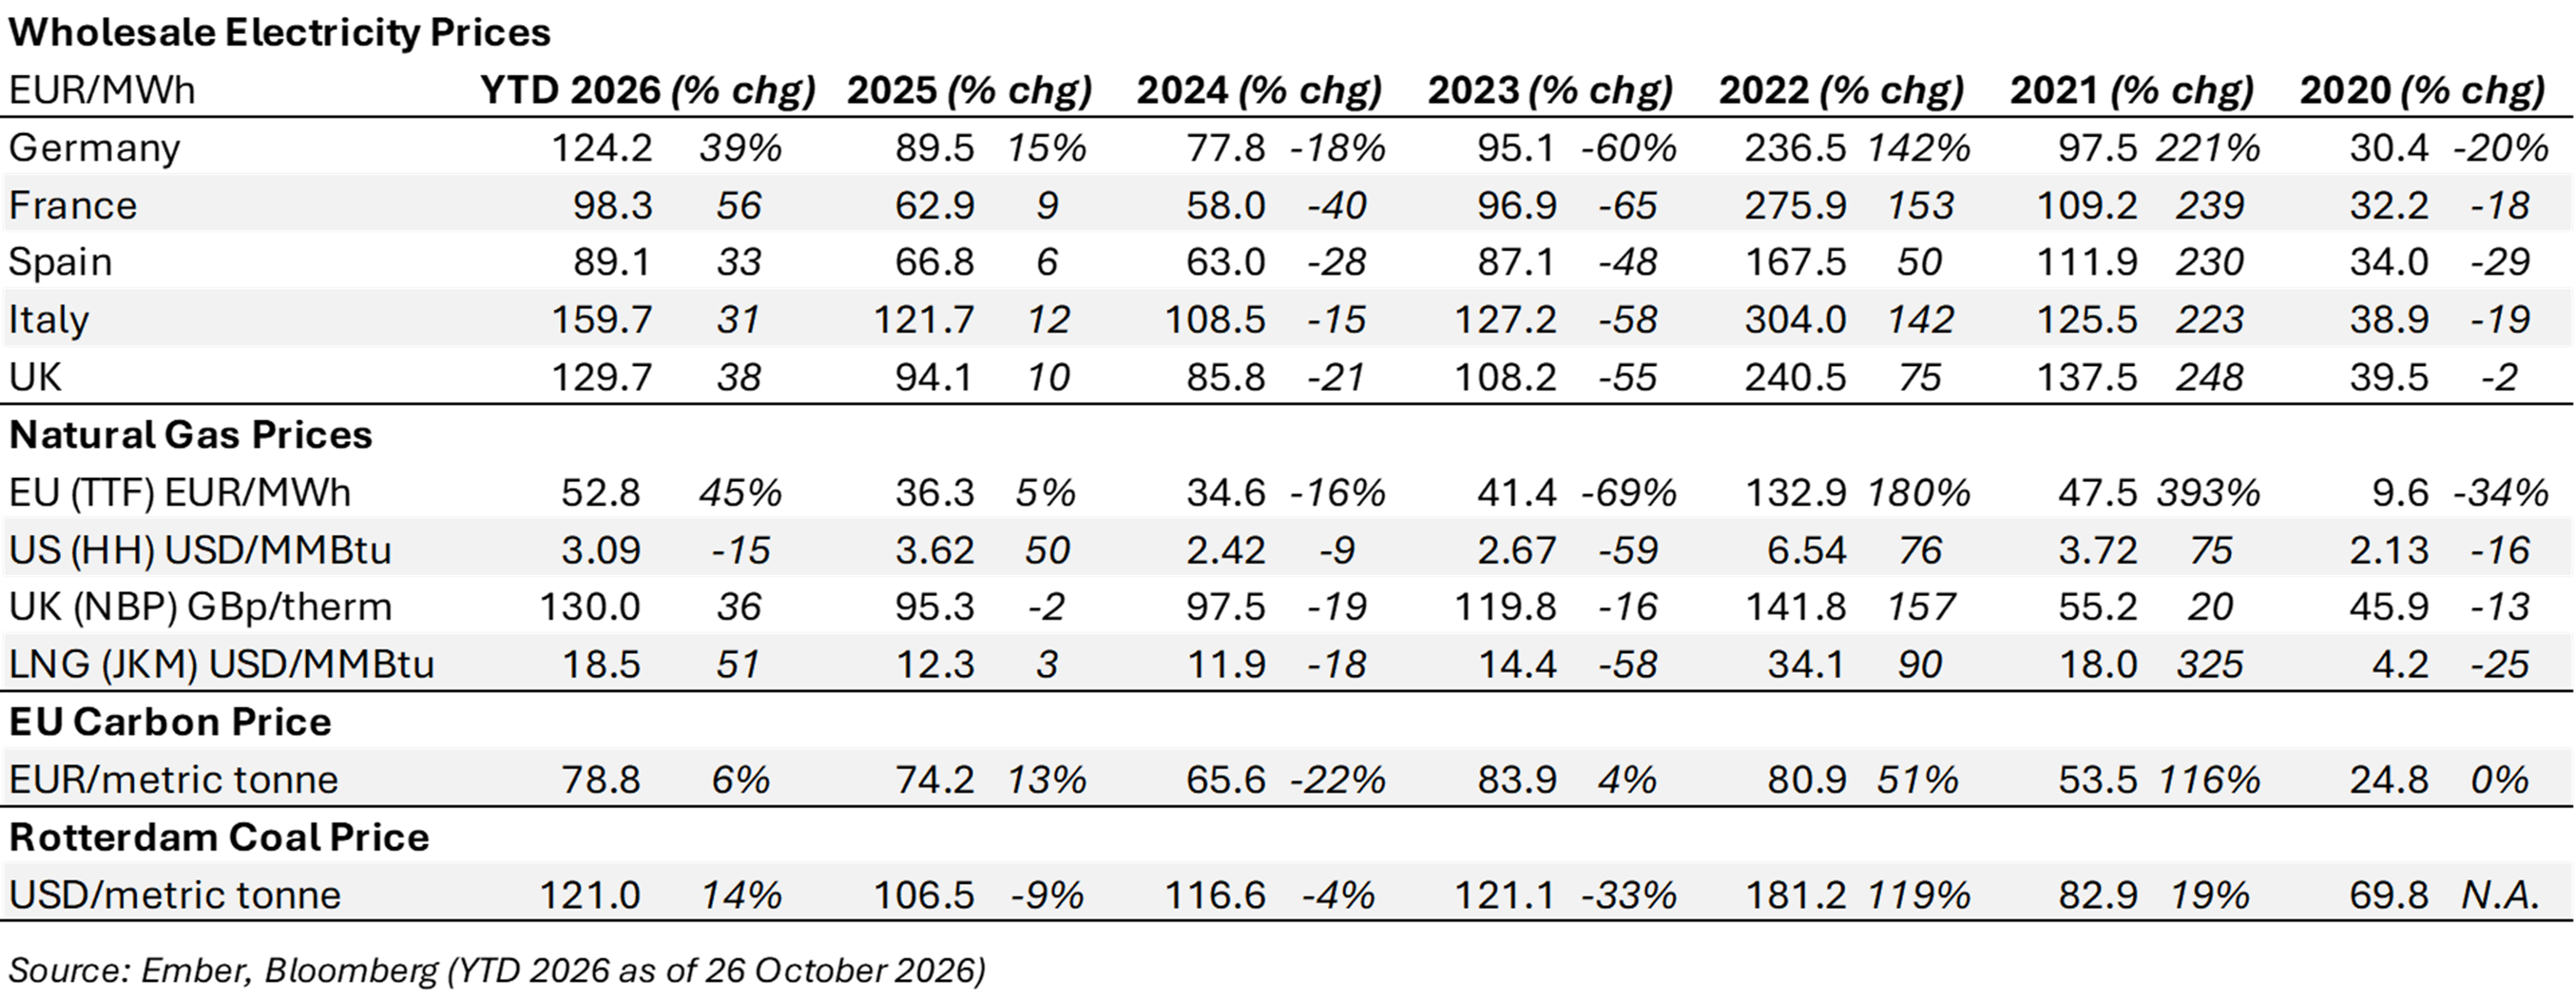
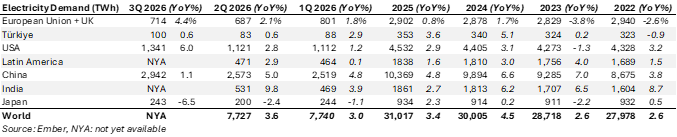
Rising gas prices have also pushed up power prices in countries that rely heavily on gas-fired generation. Under Europe’s merit-order system, gas-fired plants are often the marginal producers and therefore set wholesale electricity prices. Average wholesale power prices in Germany, Italy and the UK have already jumped above €100/MWh in 2026, exceeding their 2025 averages by 39%, 31% and 38%, respectively (see Table 3). Power prices in Spain (€89/MWh) and France (€98/MWh) have also risen from 2025 but remain below €100/MWh, as these countries depend less on gas for power generation. Despite elevated power prices across Europe this year, it is encouraging that EU+UK electricity demand grew by 4.4% in the third quarter. After several years of flat or declining consumption, power demand in the EU+UK and in the USA has grown in every quarter (see Table 4) and every month of 2026 (see Exhibits 13 and 14).
Table 4 Annual Electricity Demand (TWh)

Gas Storage and LNG Flows
Exhibit 7 EU Gas Storage (% full) Exhibit 8 EU + UK Gas Demand 

Source: US Energy Information Administration Source: US Energy Information Administration
Exhibit 9 US Gas Storage Exhibit 10 US LNG Exports 

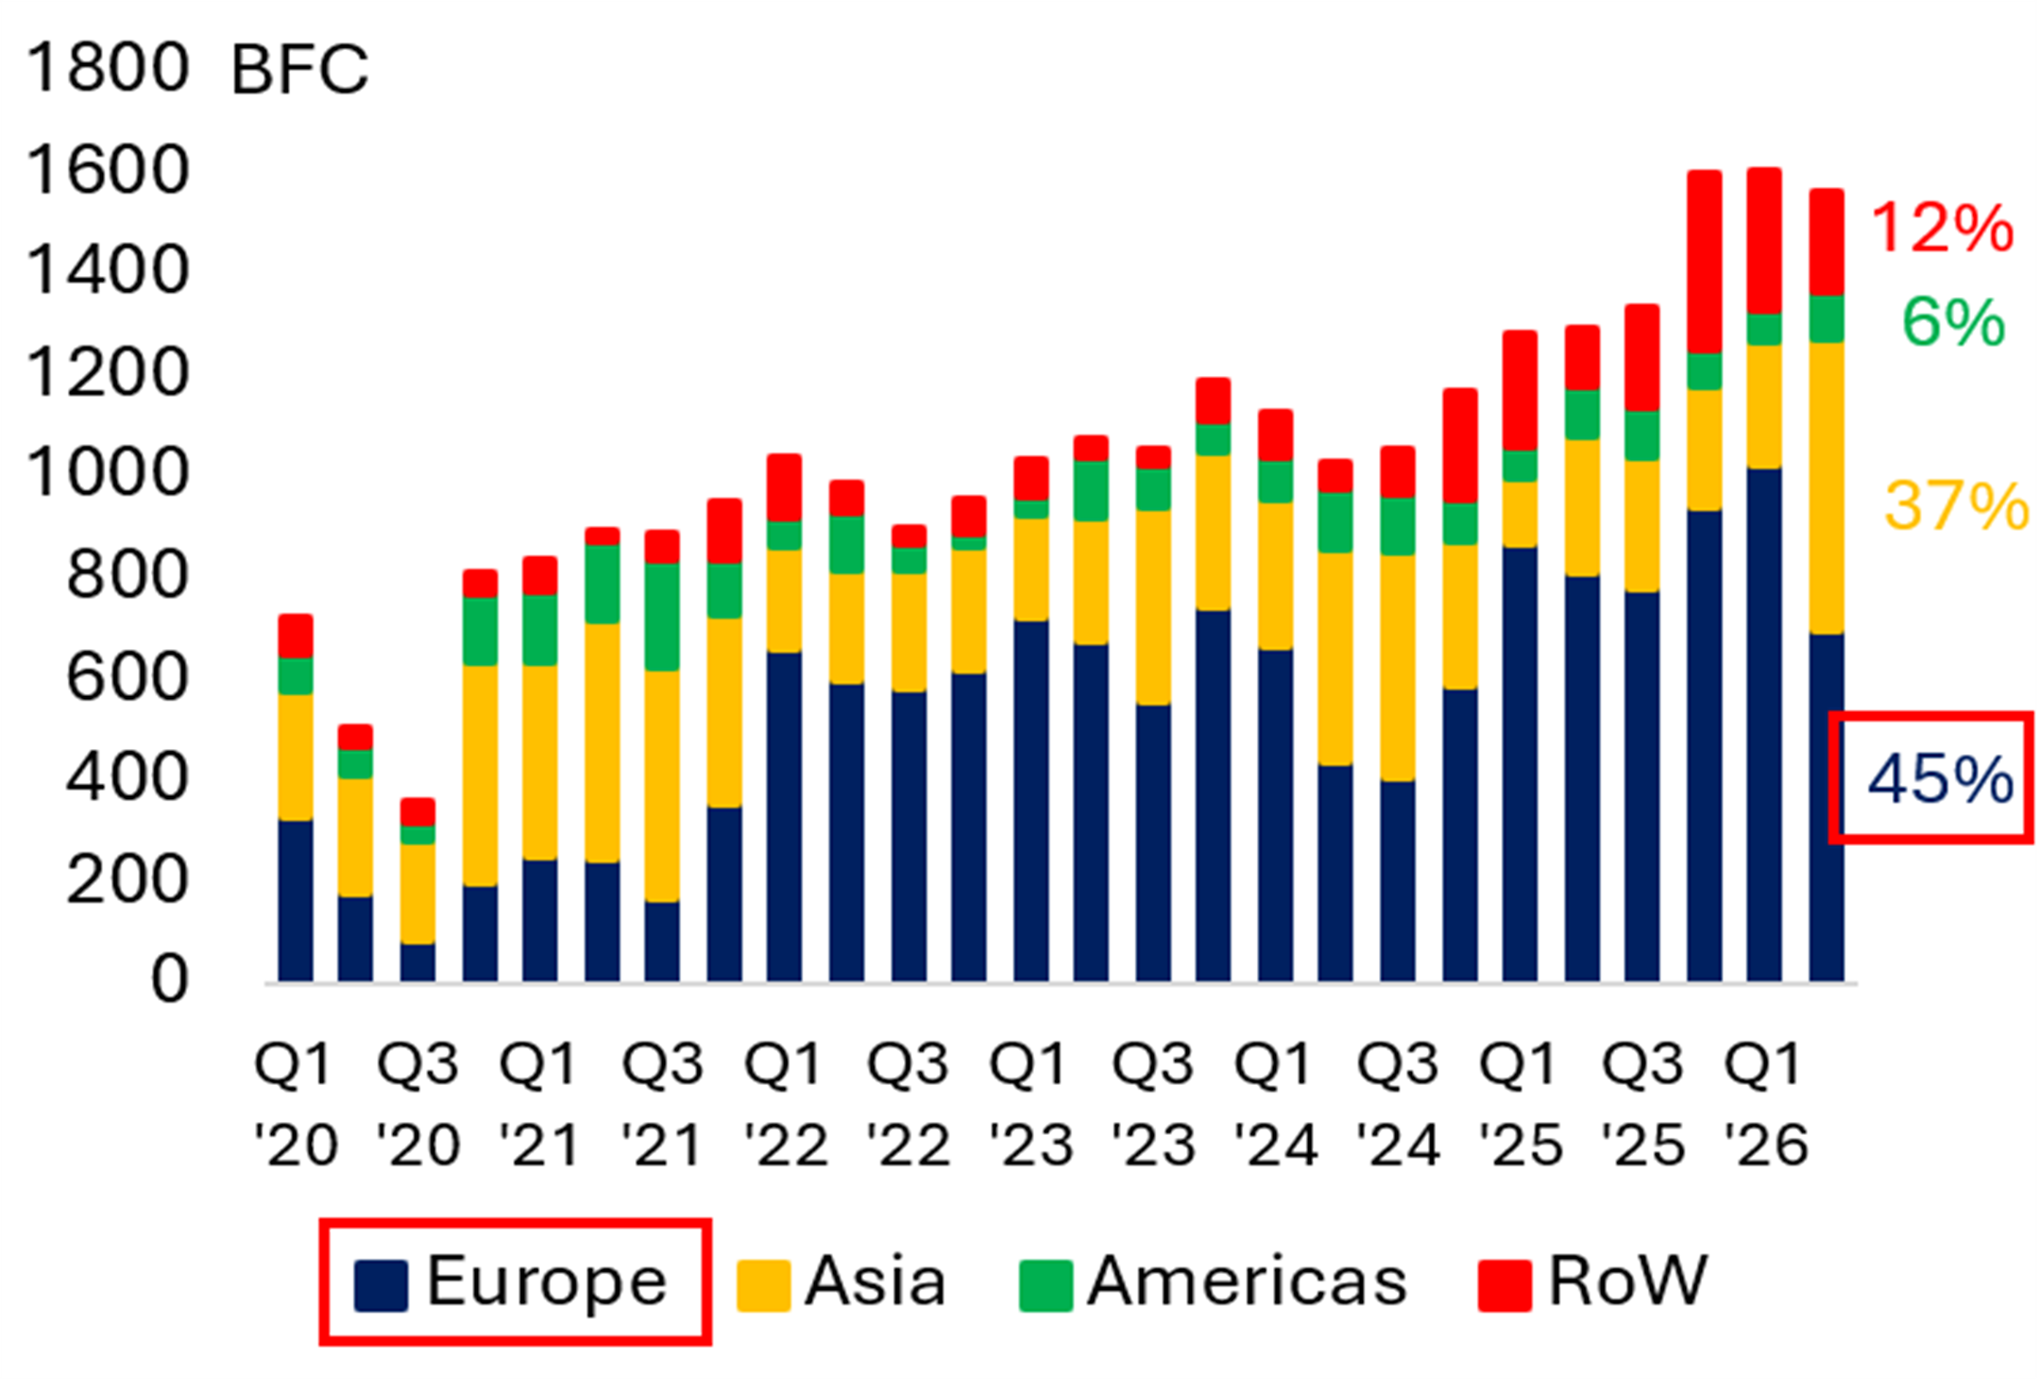
Source: Gas Infrastructure Europe Source: Bruegel
Exhibit 11 EU Quarterly Gas Imports by Source Exhibit 12 EU Monthly LNG Imports 

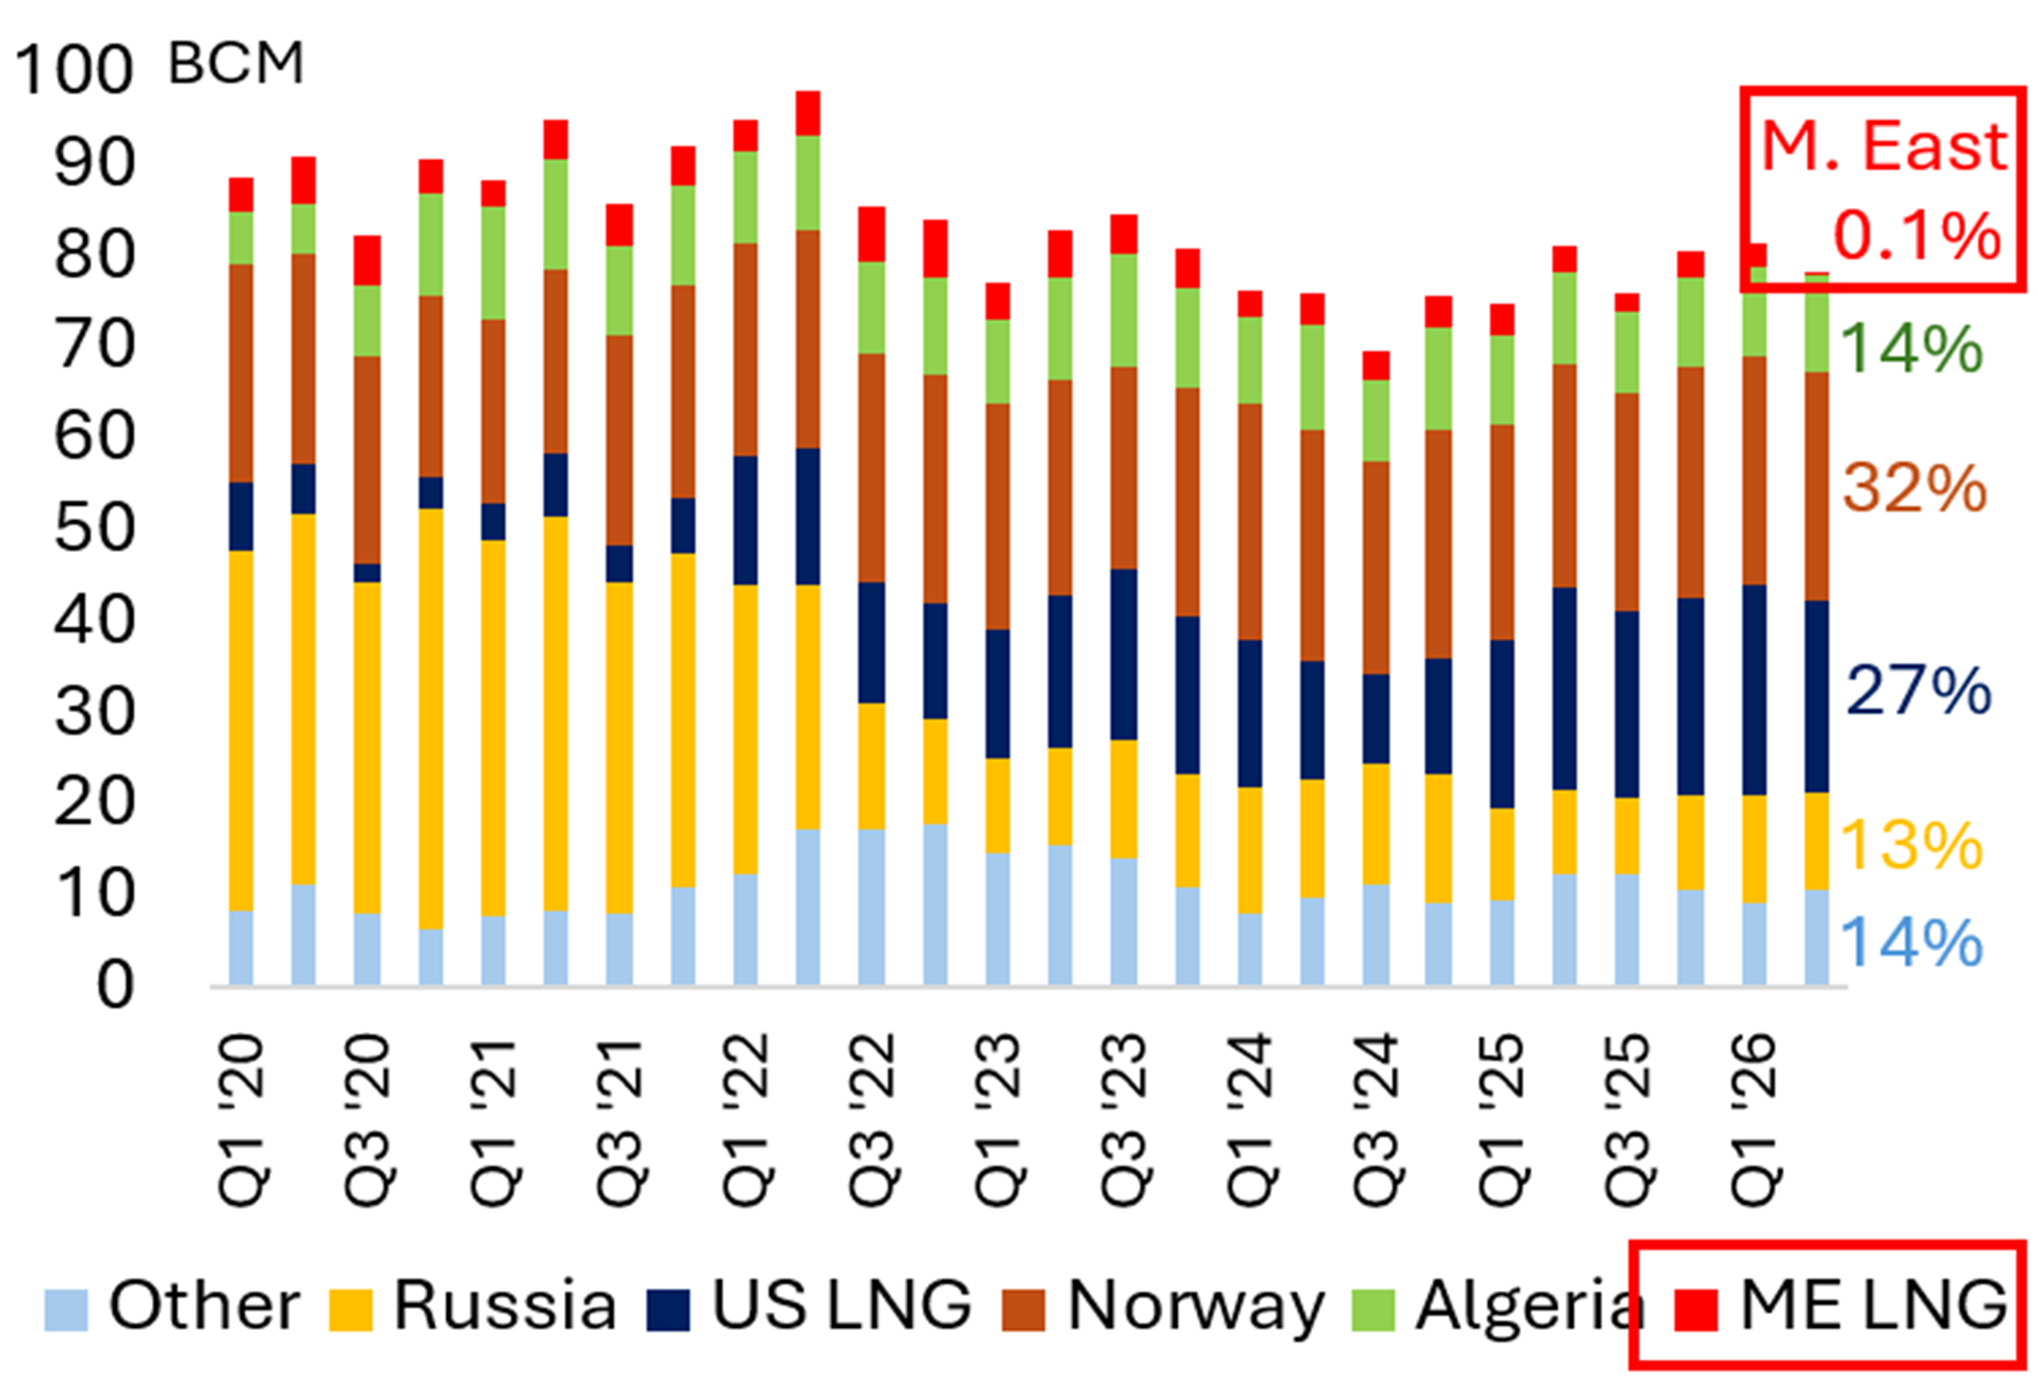
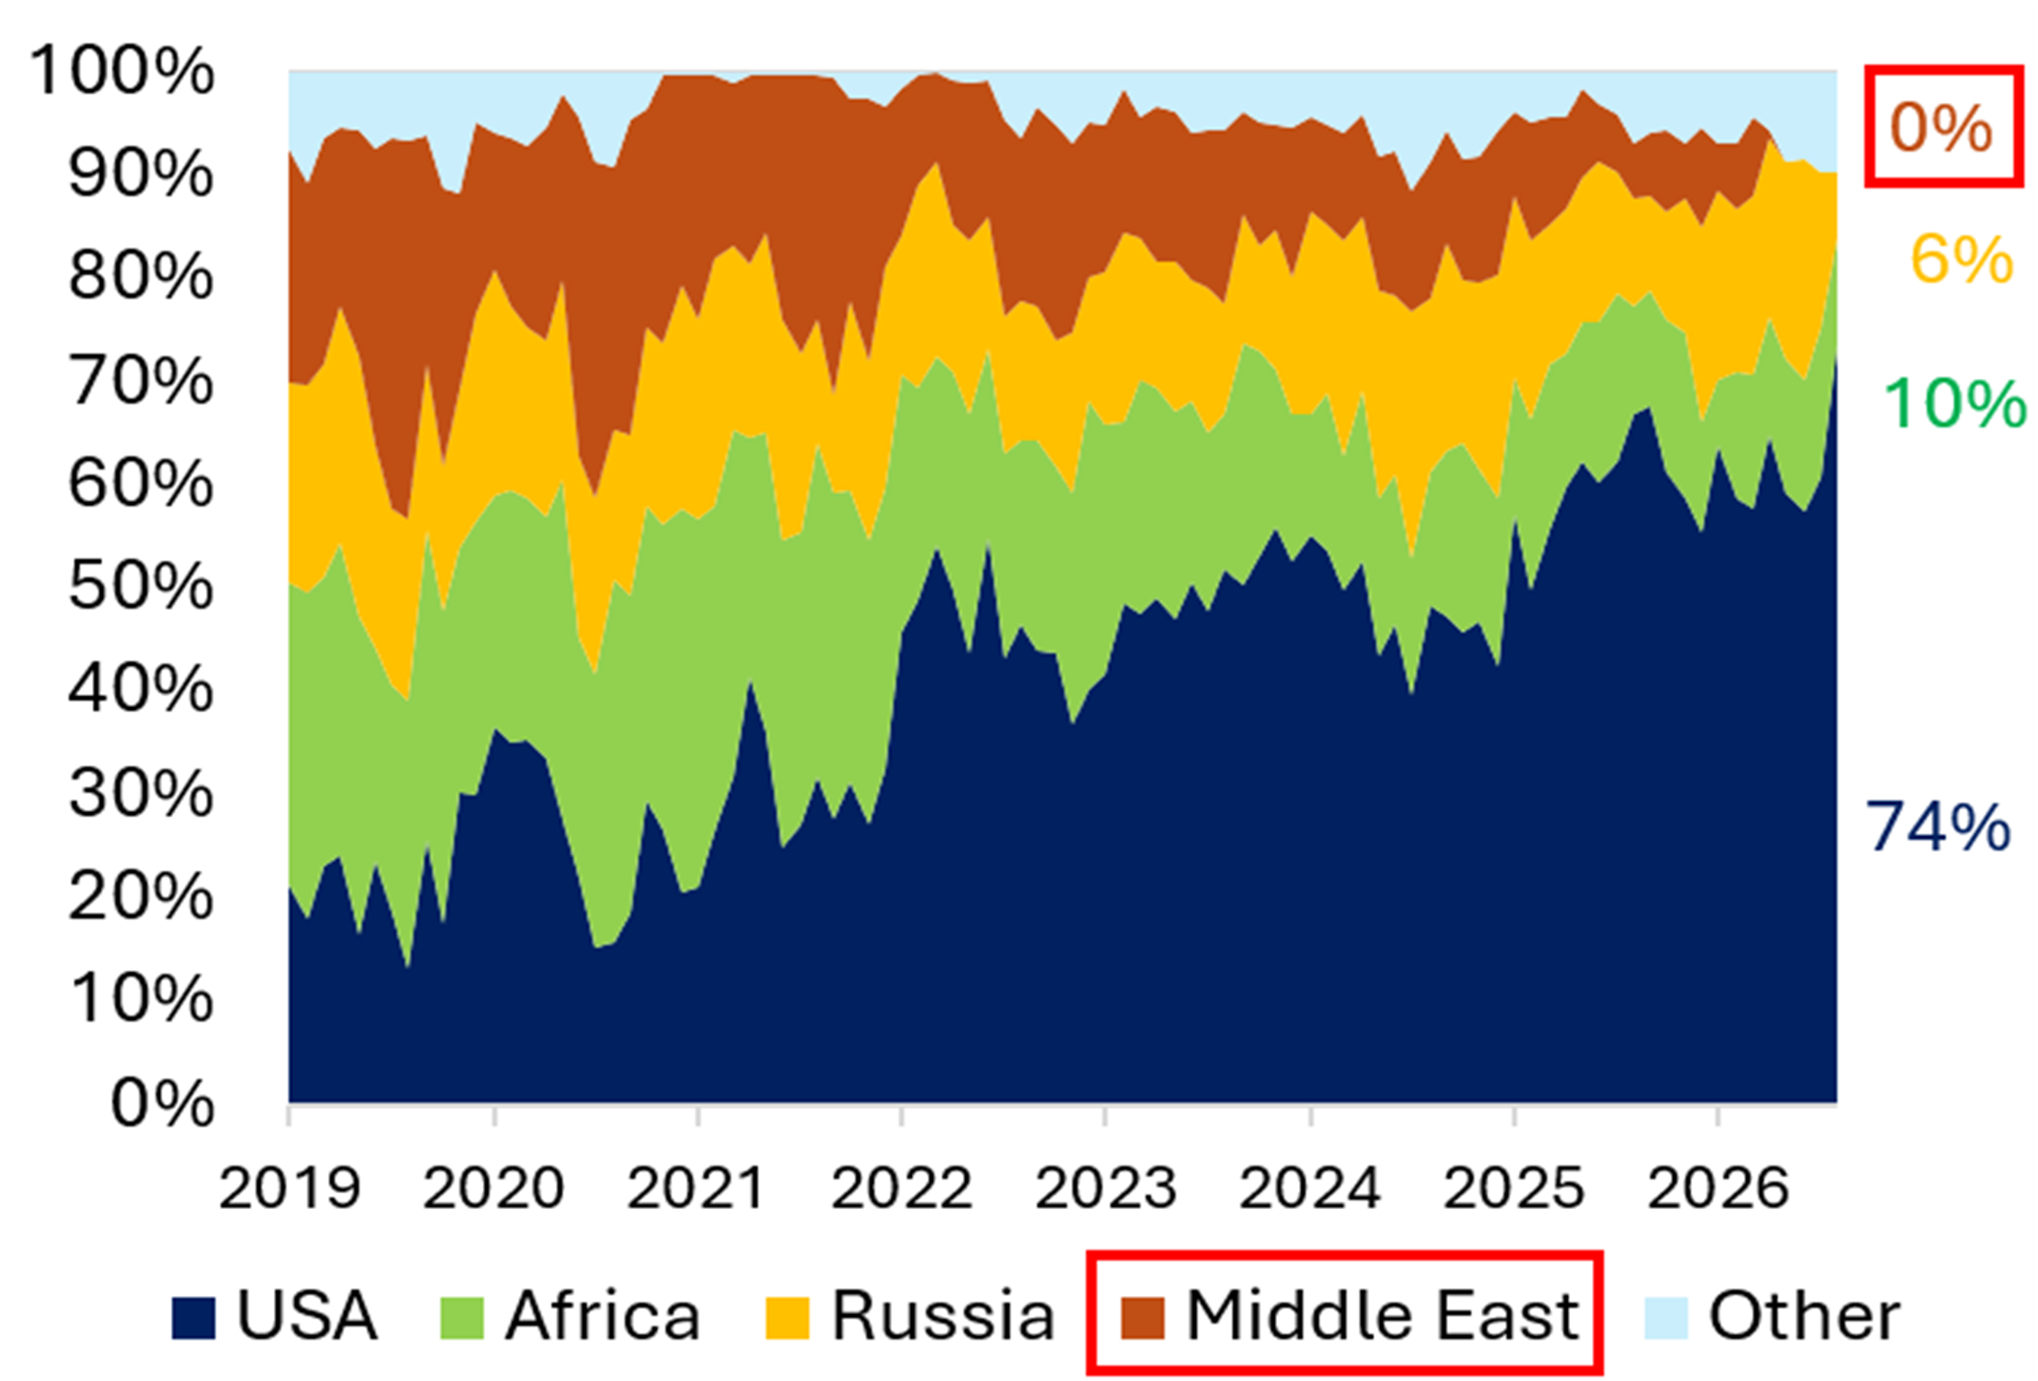
Source: Bruegel Source: Bruegel
Global Power Demand Growth (in TWh)
Exhibit 13 Europe Electricity Demand Exhibit 14 USA Electricity Demand 

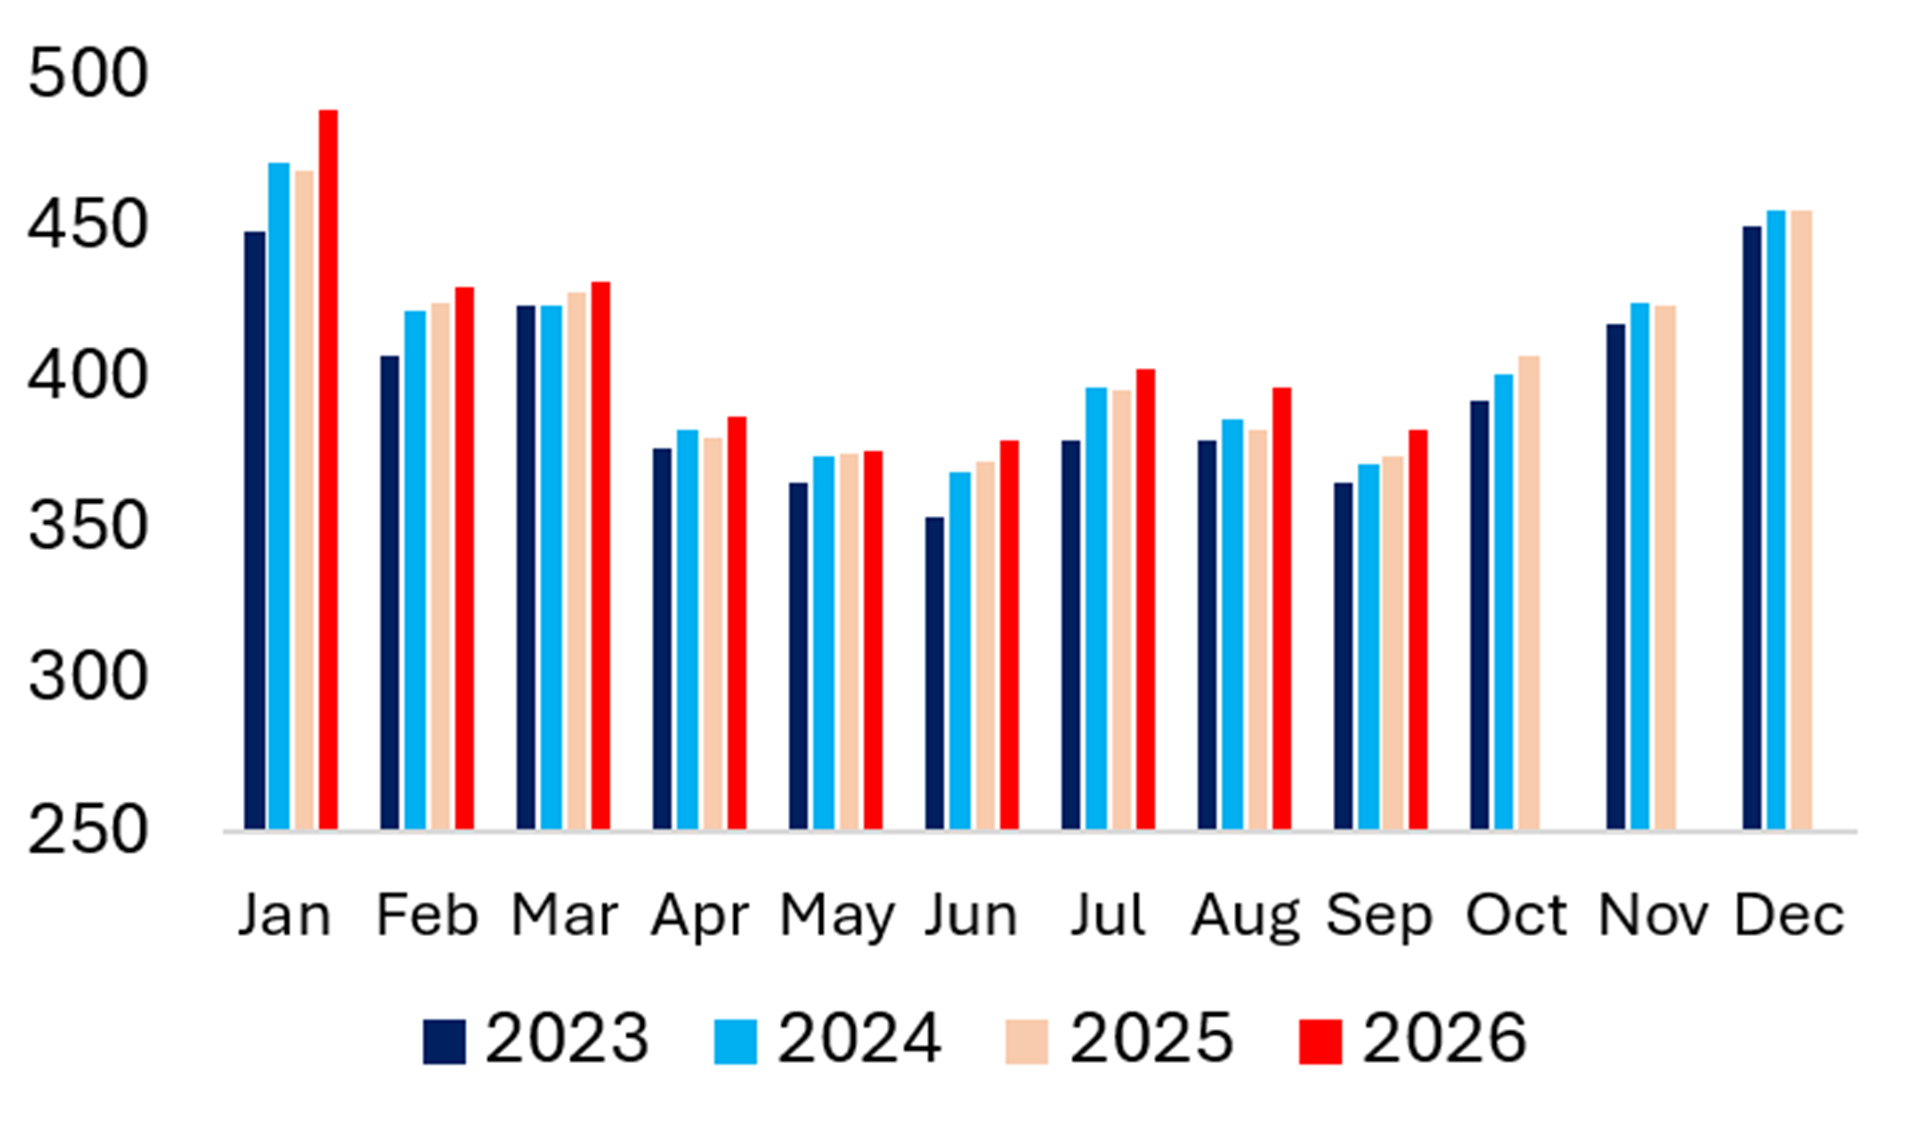
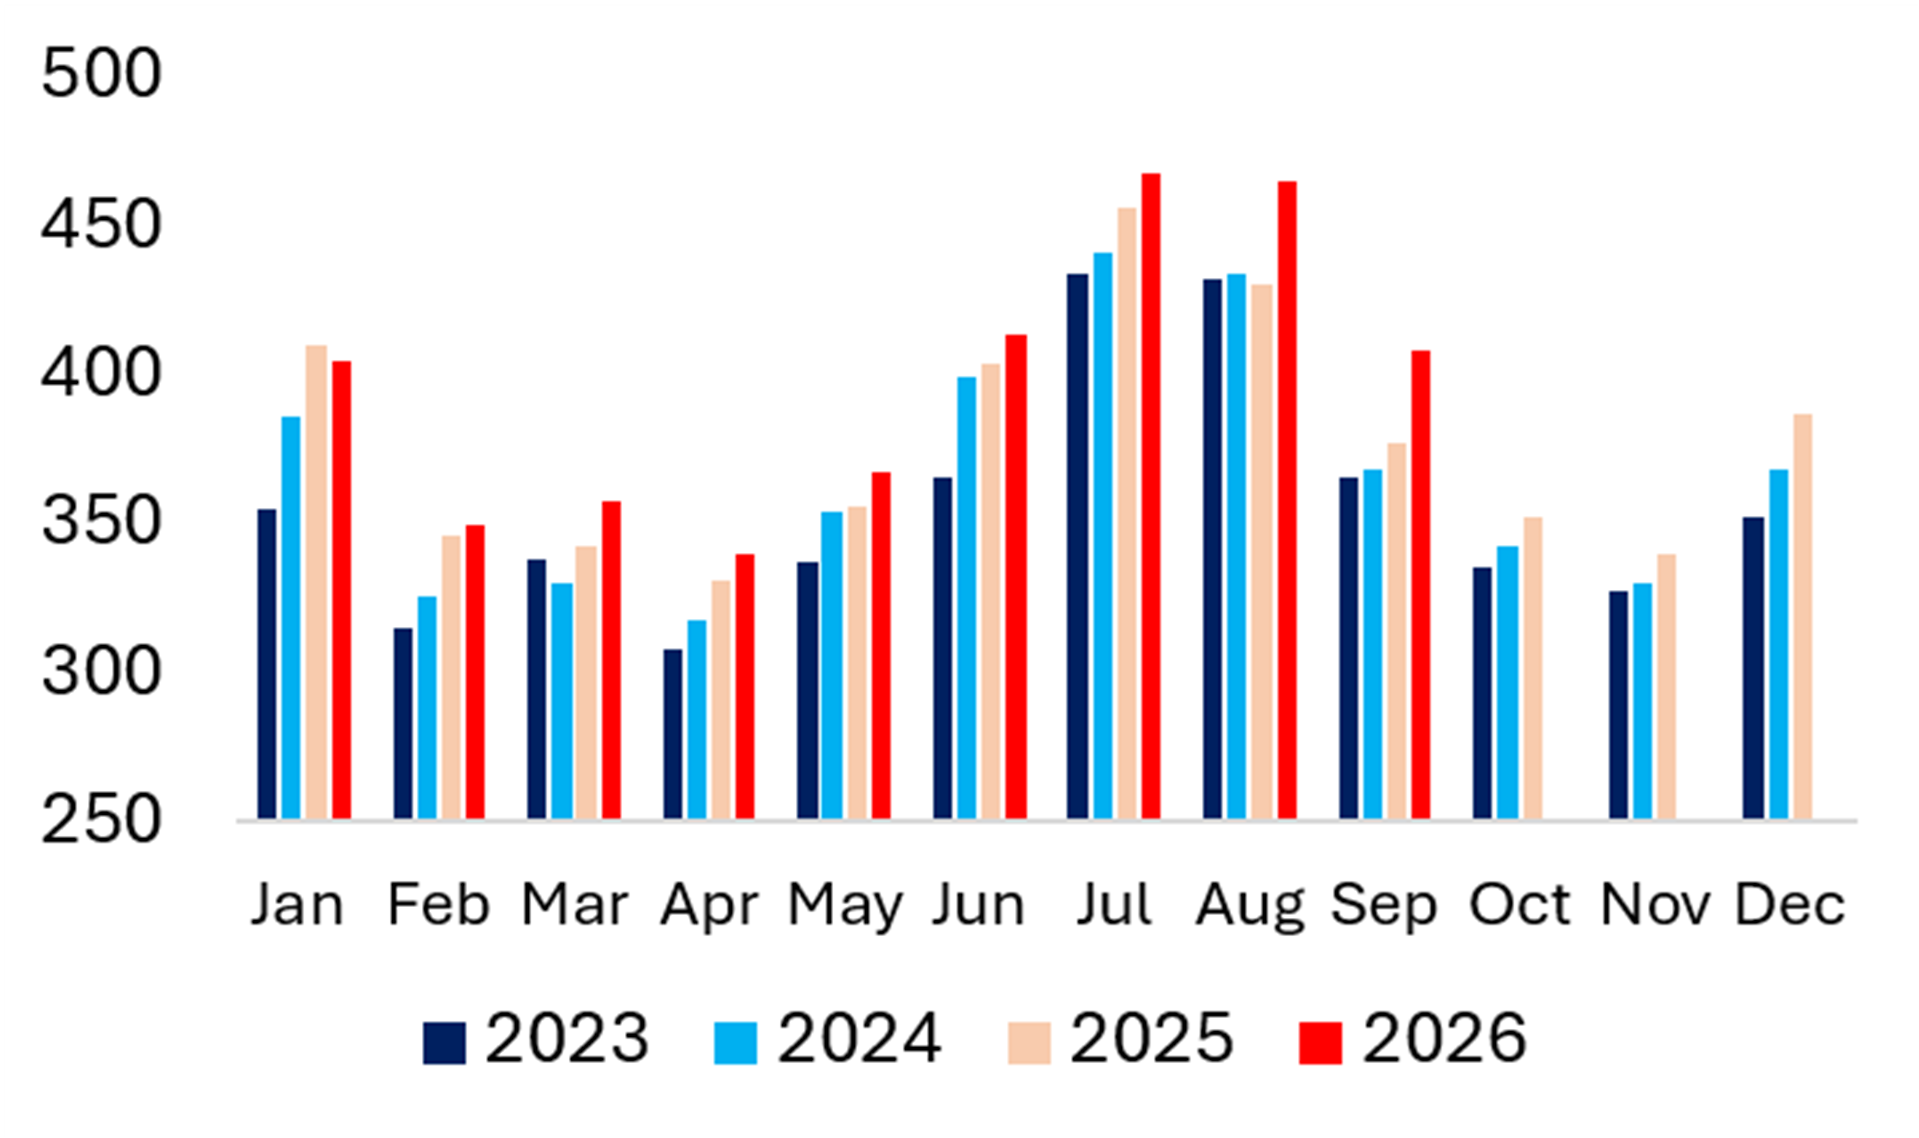
Exhibit 15 Türkiye Electricity Demand Exhibit 16 LatAm Electricity Demand 

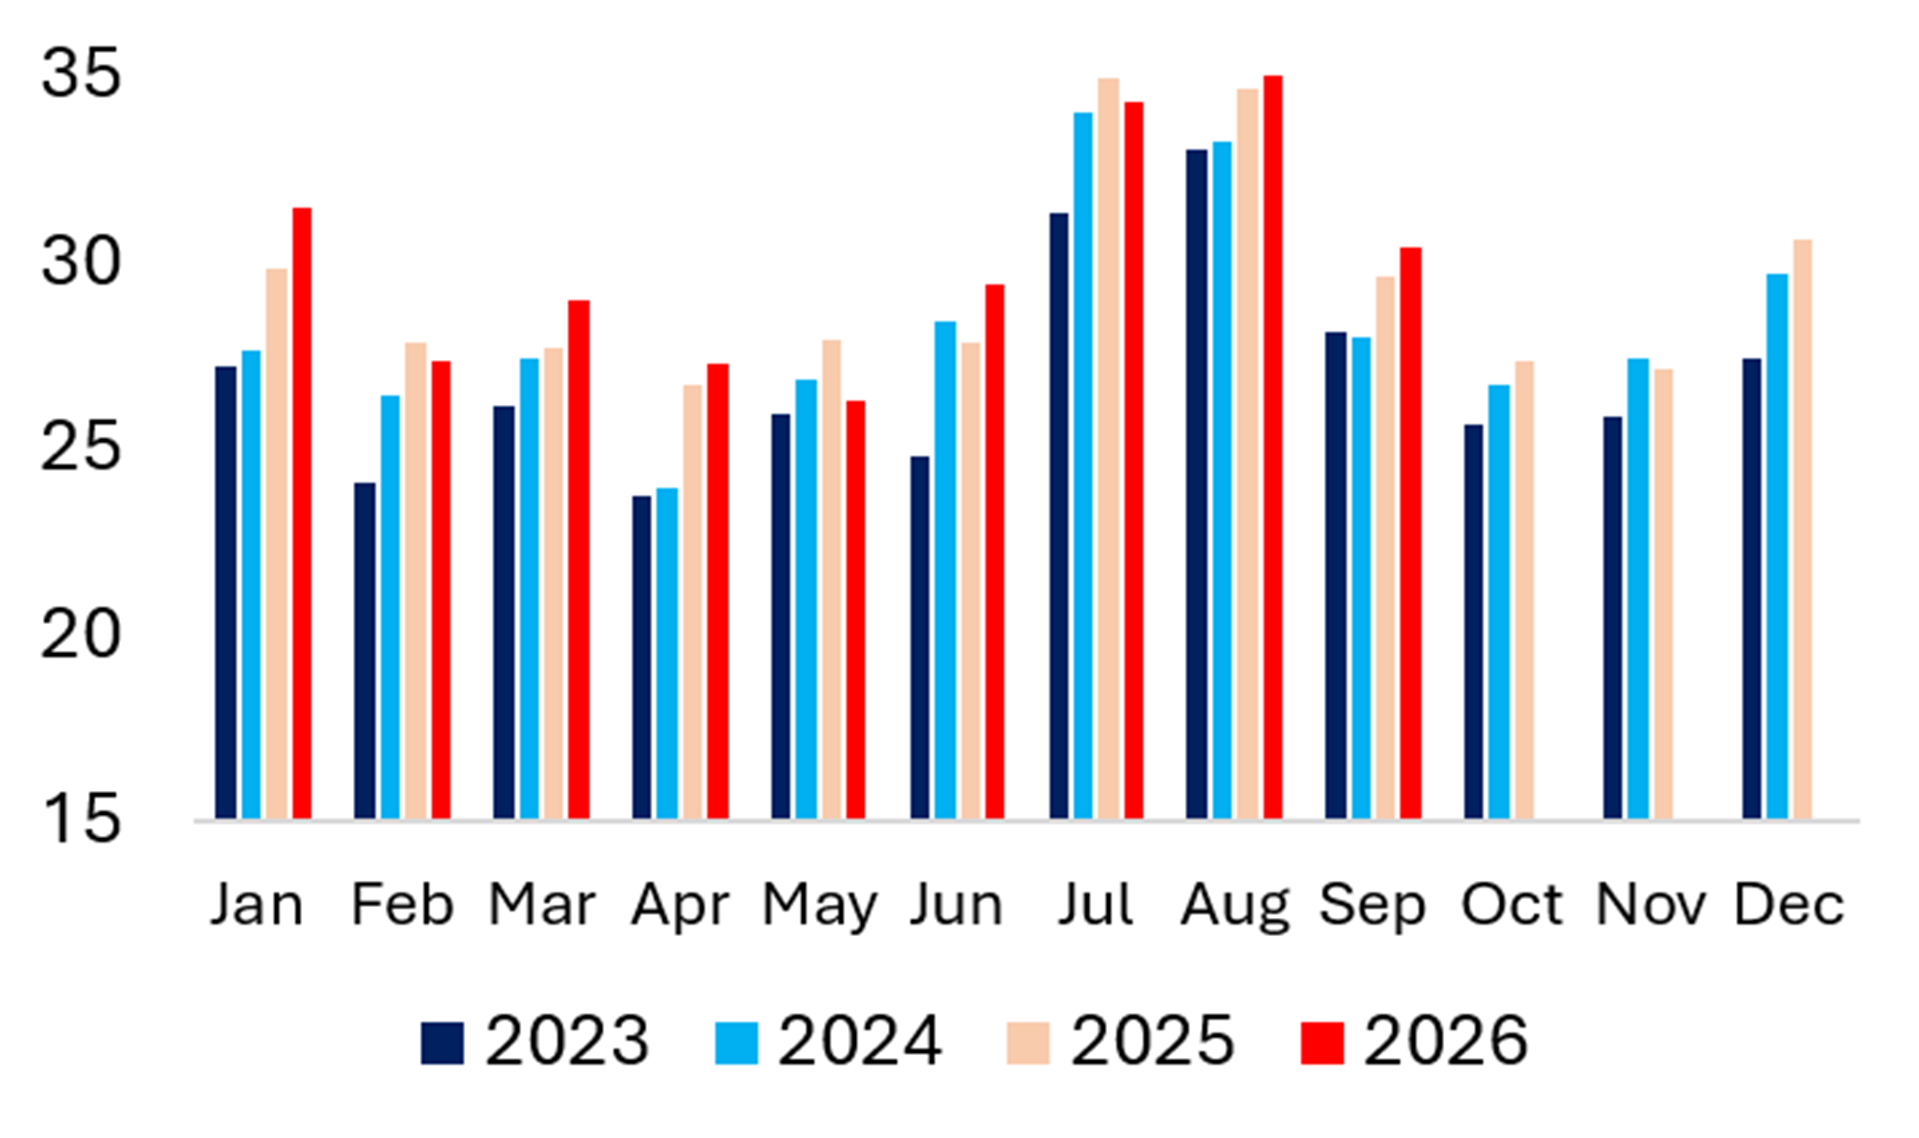
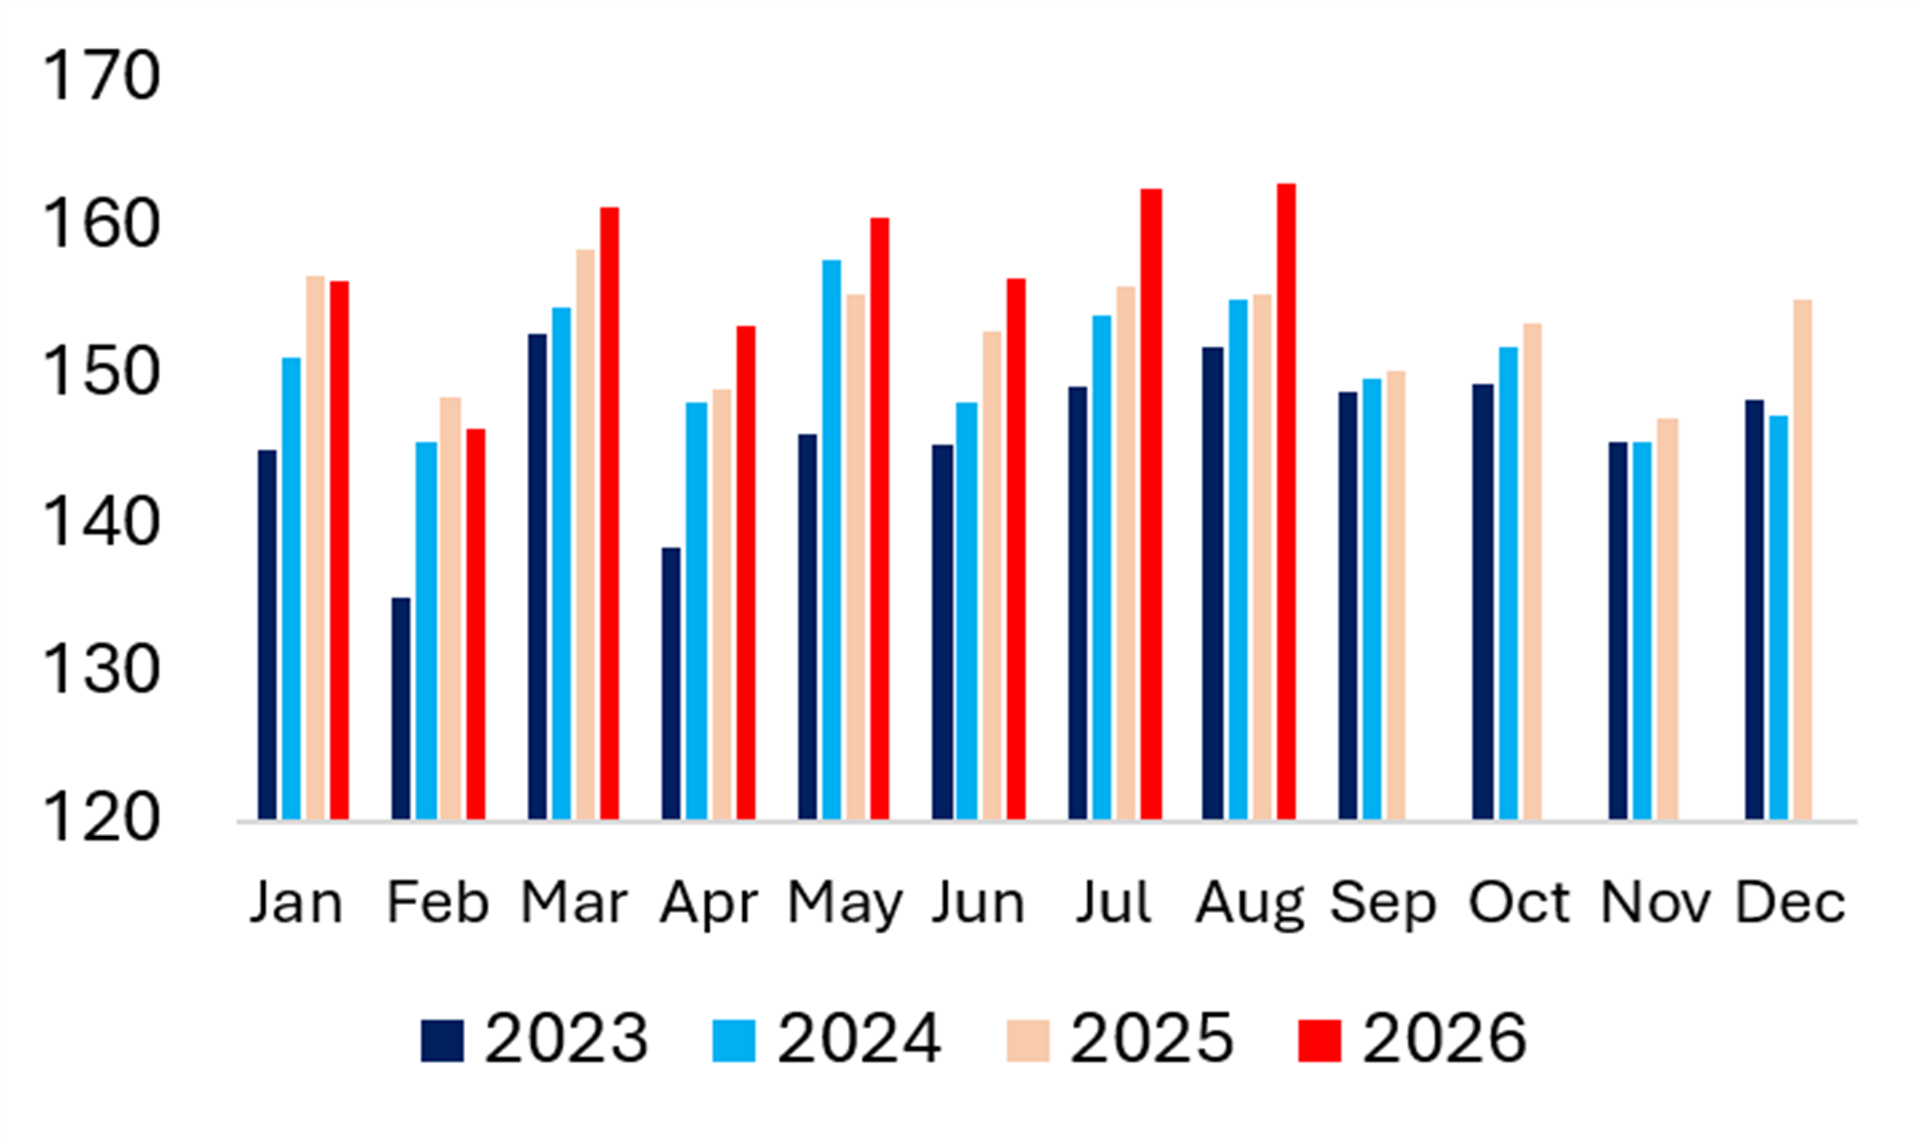
Exhibit 17 China Electricity Demand Exhibit 18 Japan Electricity Demand 

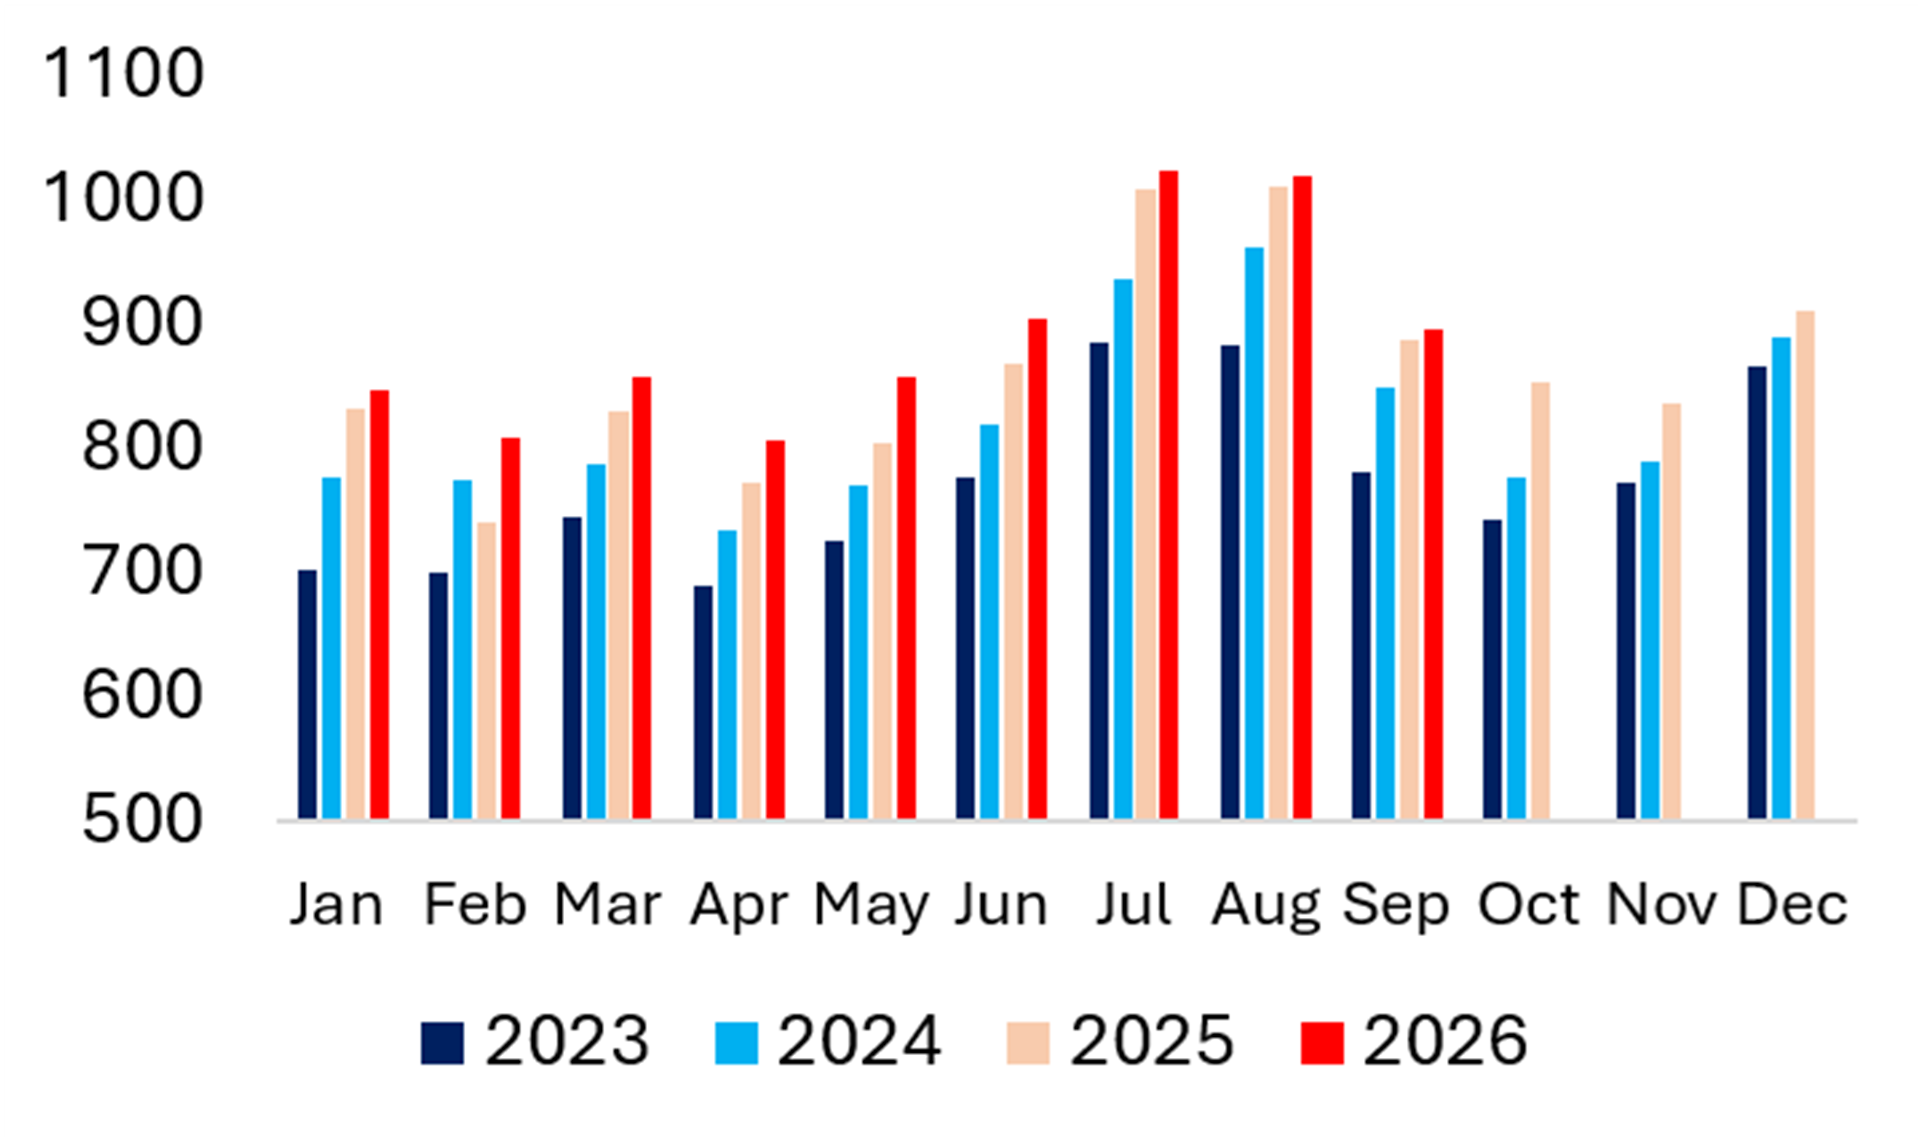
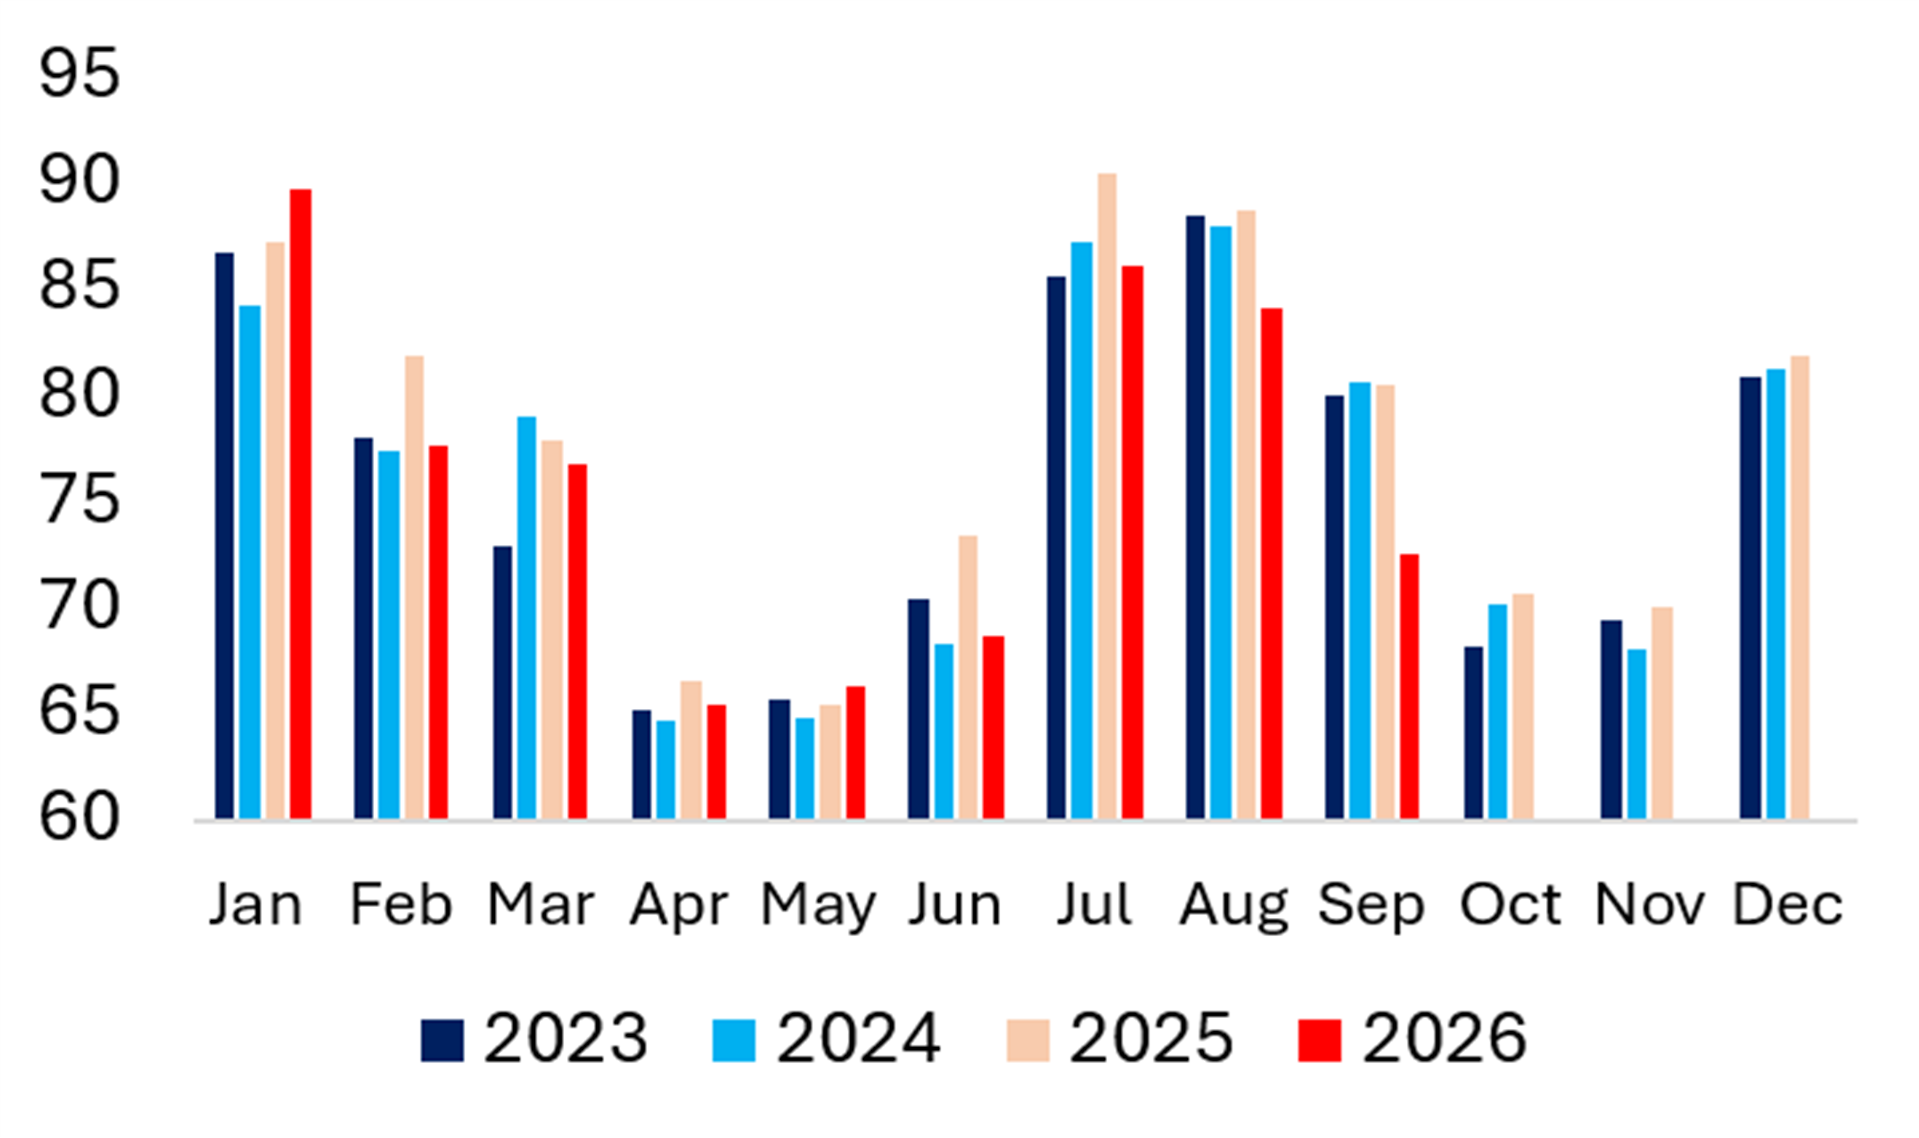
Exhibit 19 India Electricity Demand Exhibit 20 World Electricity Demand

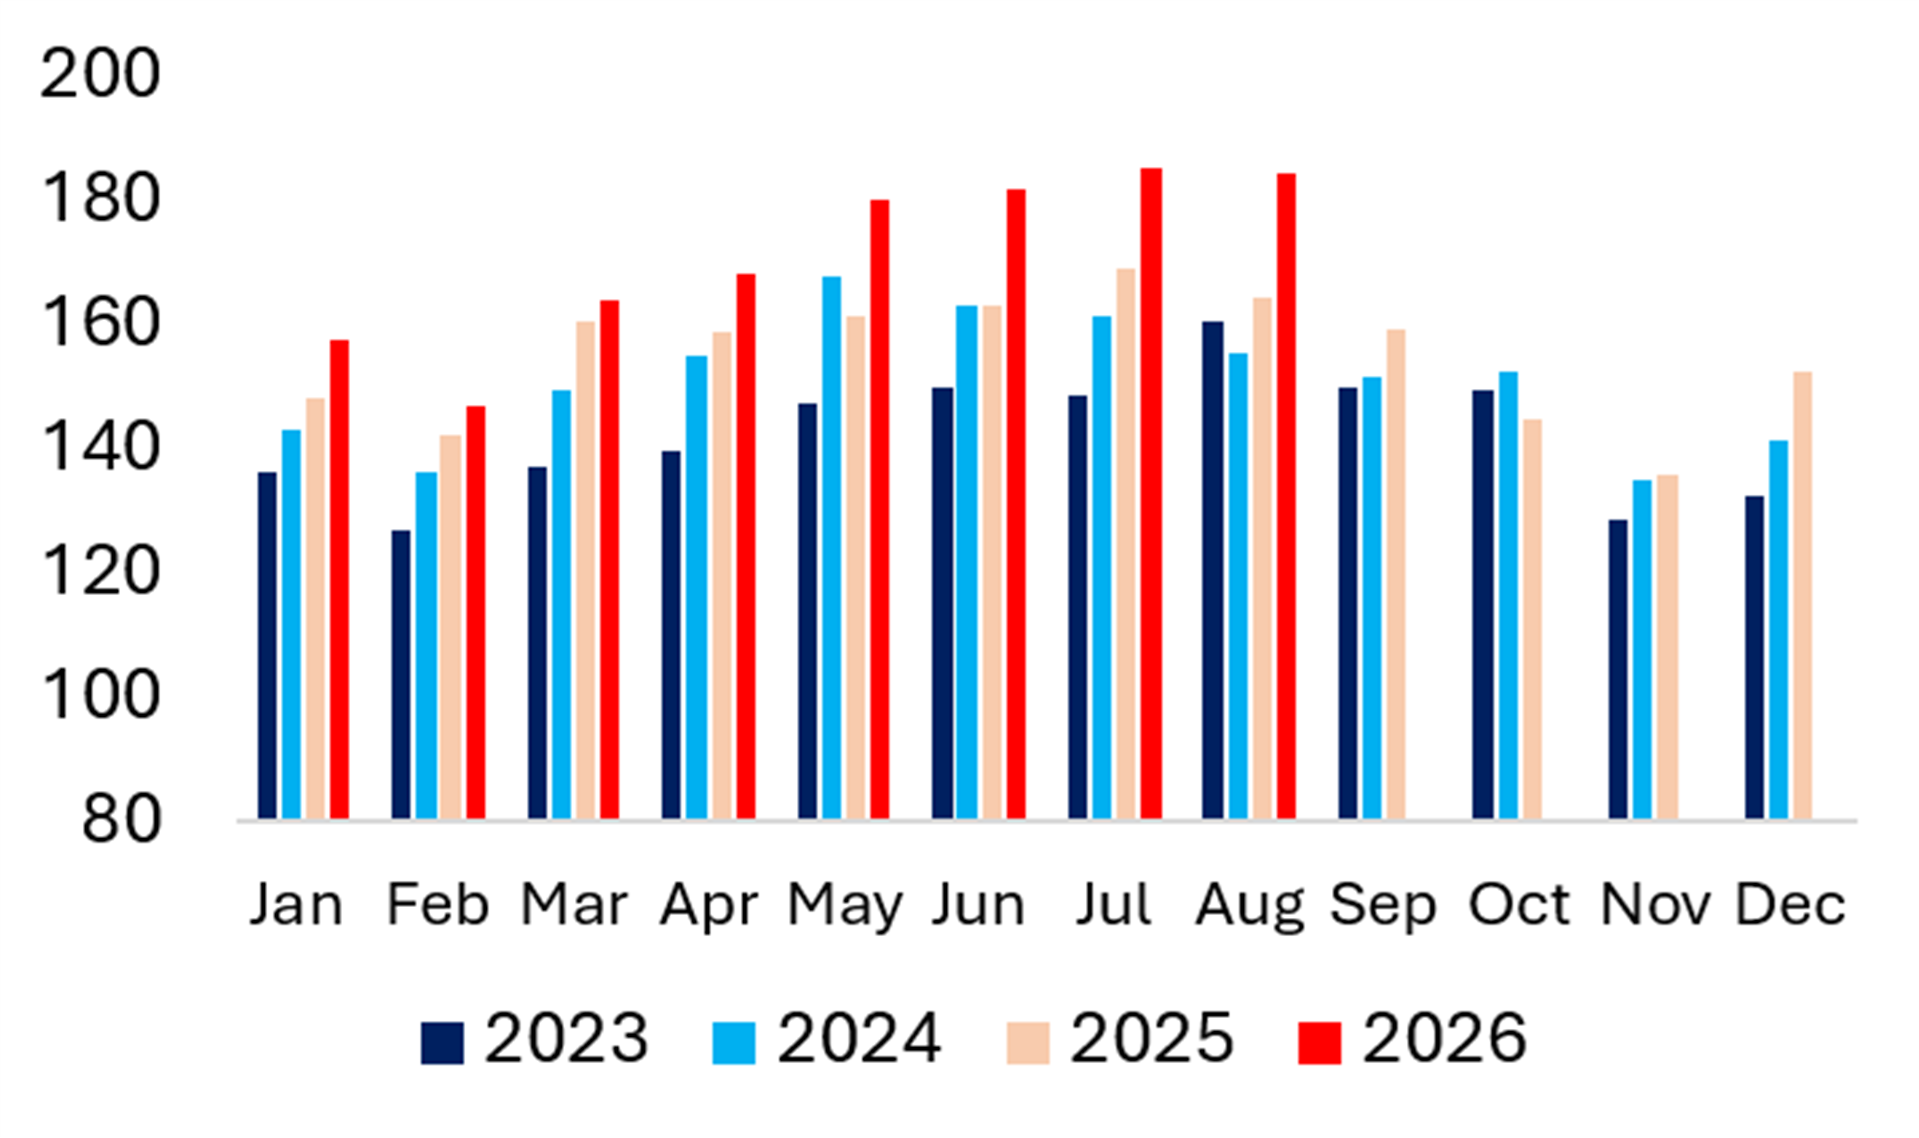
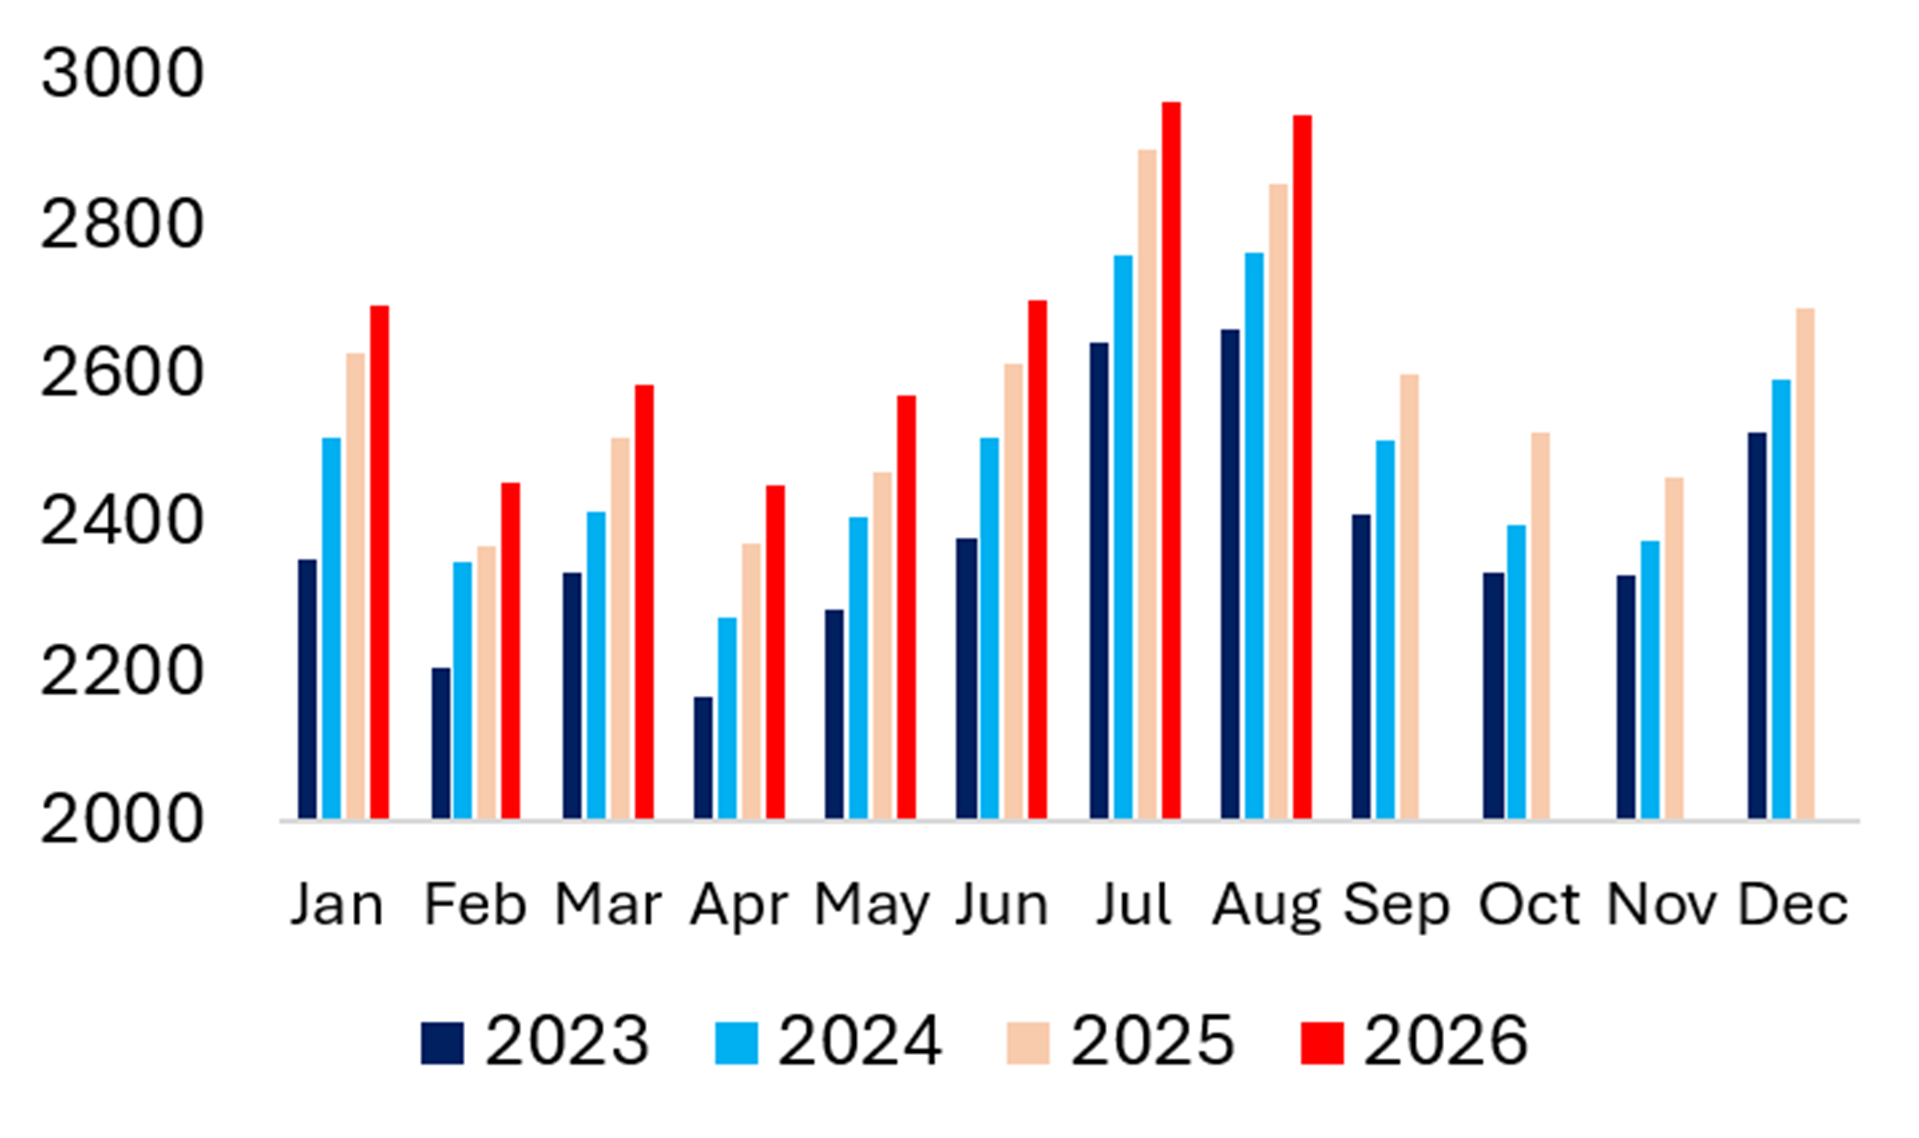

Source: Ember
Power Tracker: Changing Fuel Mix and 3 Biggest Sources of Power Generation
EUROPE
Exhibit 21 Europe: Biggest Source of Electricity in Each Country
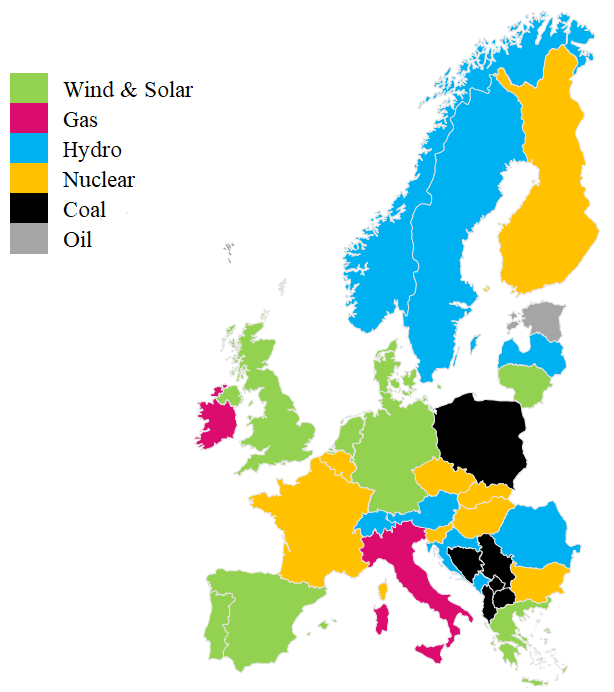
Exhibit 22 Power Generation Exhibit 23 Share of Wind & Solar (%) 
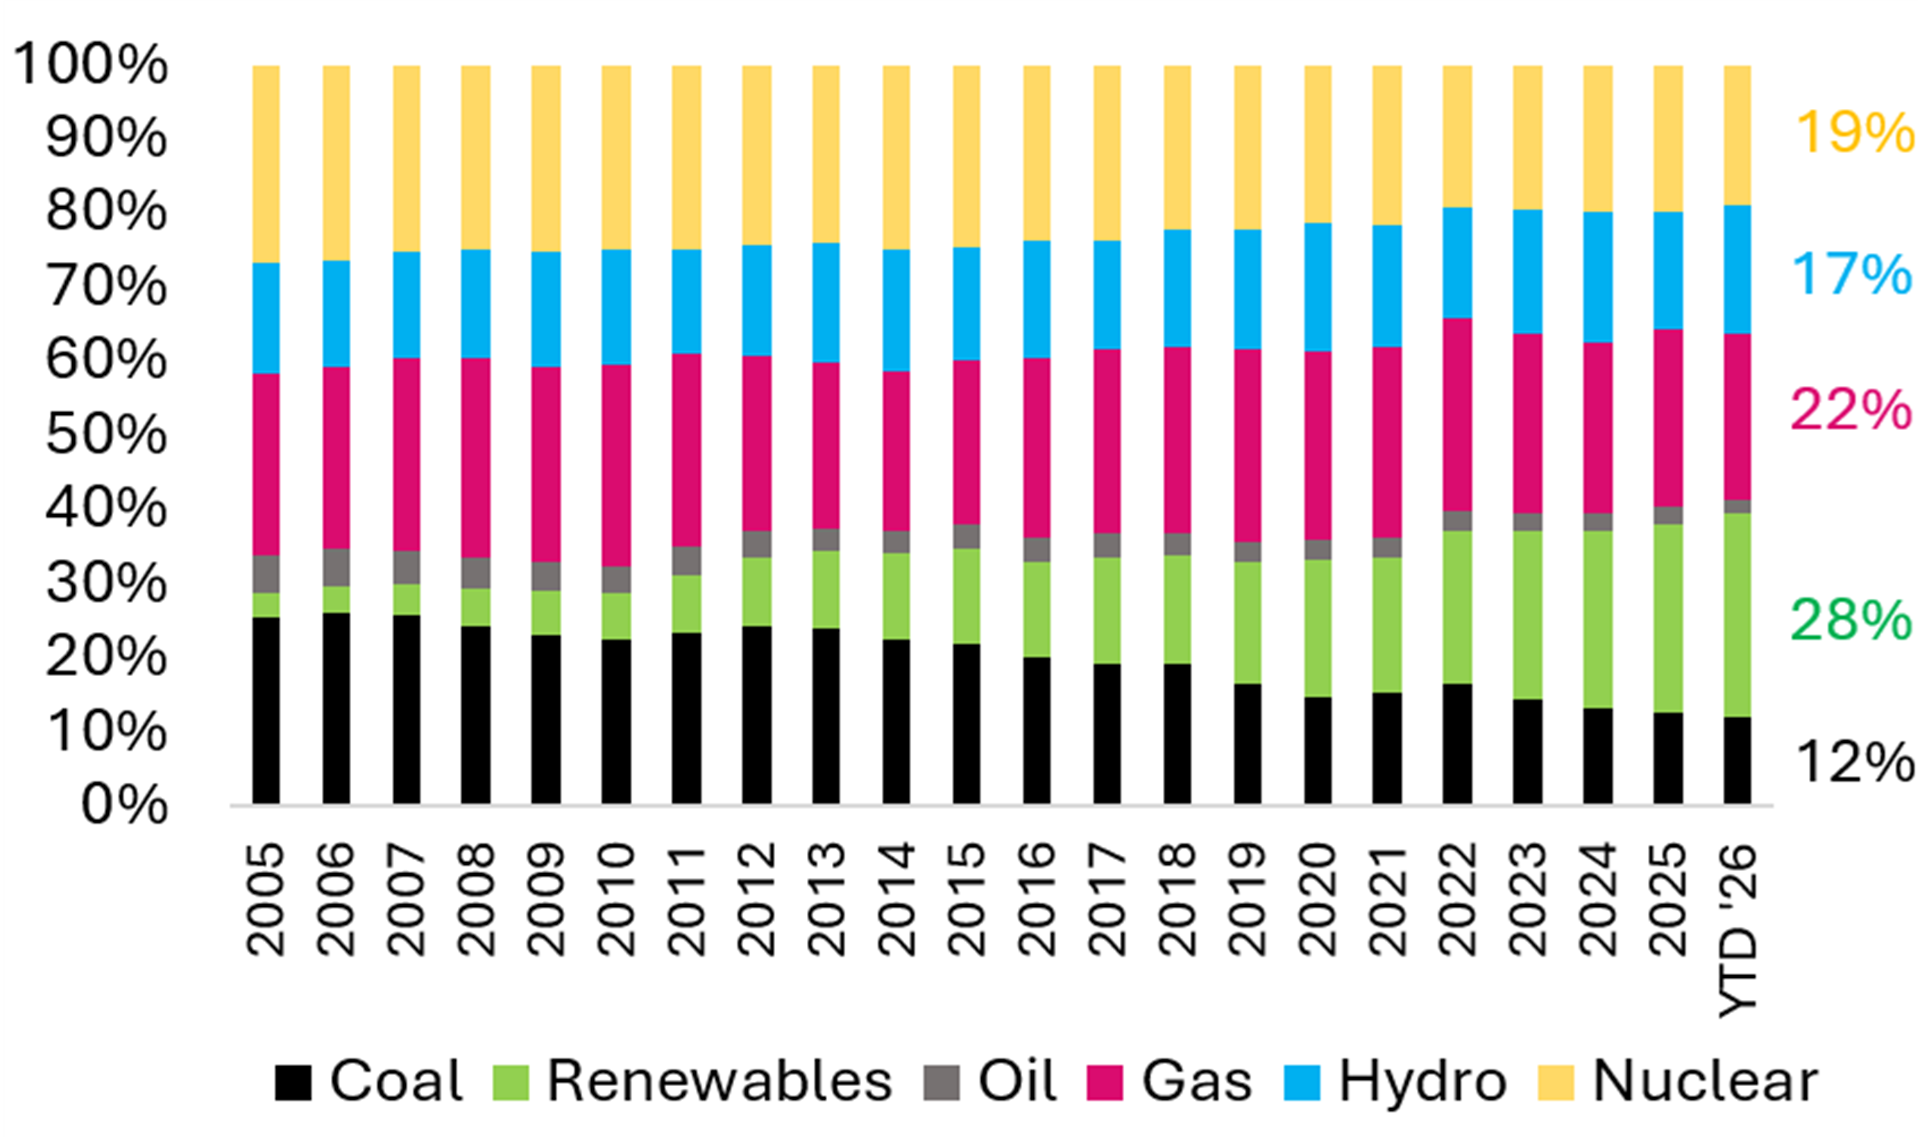
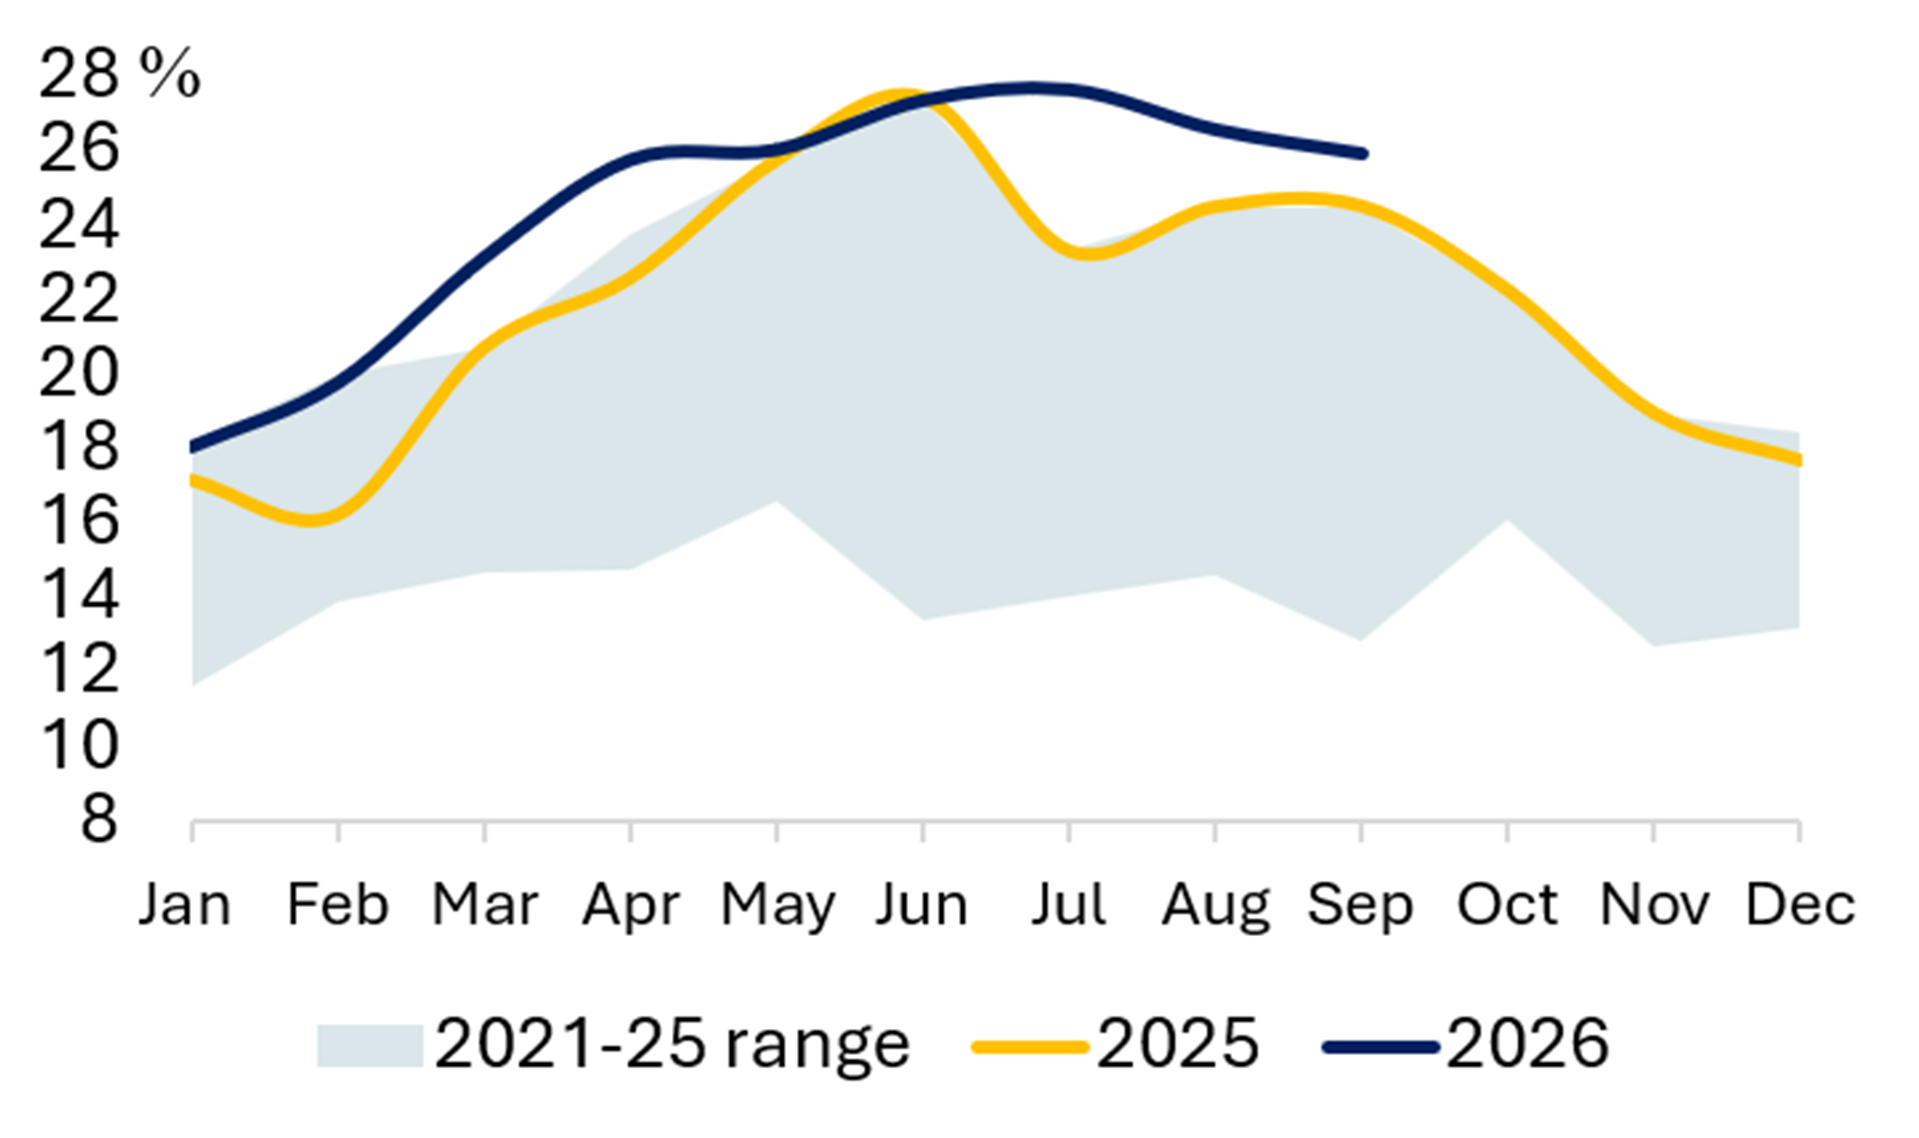

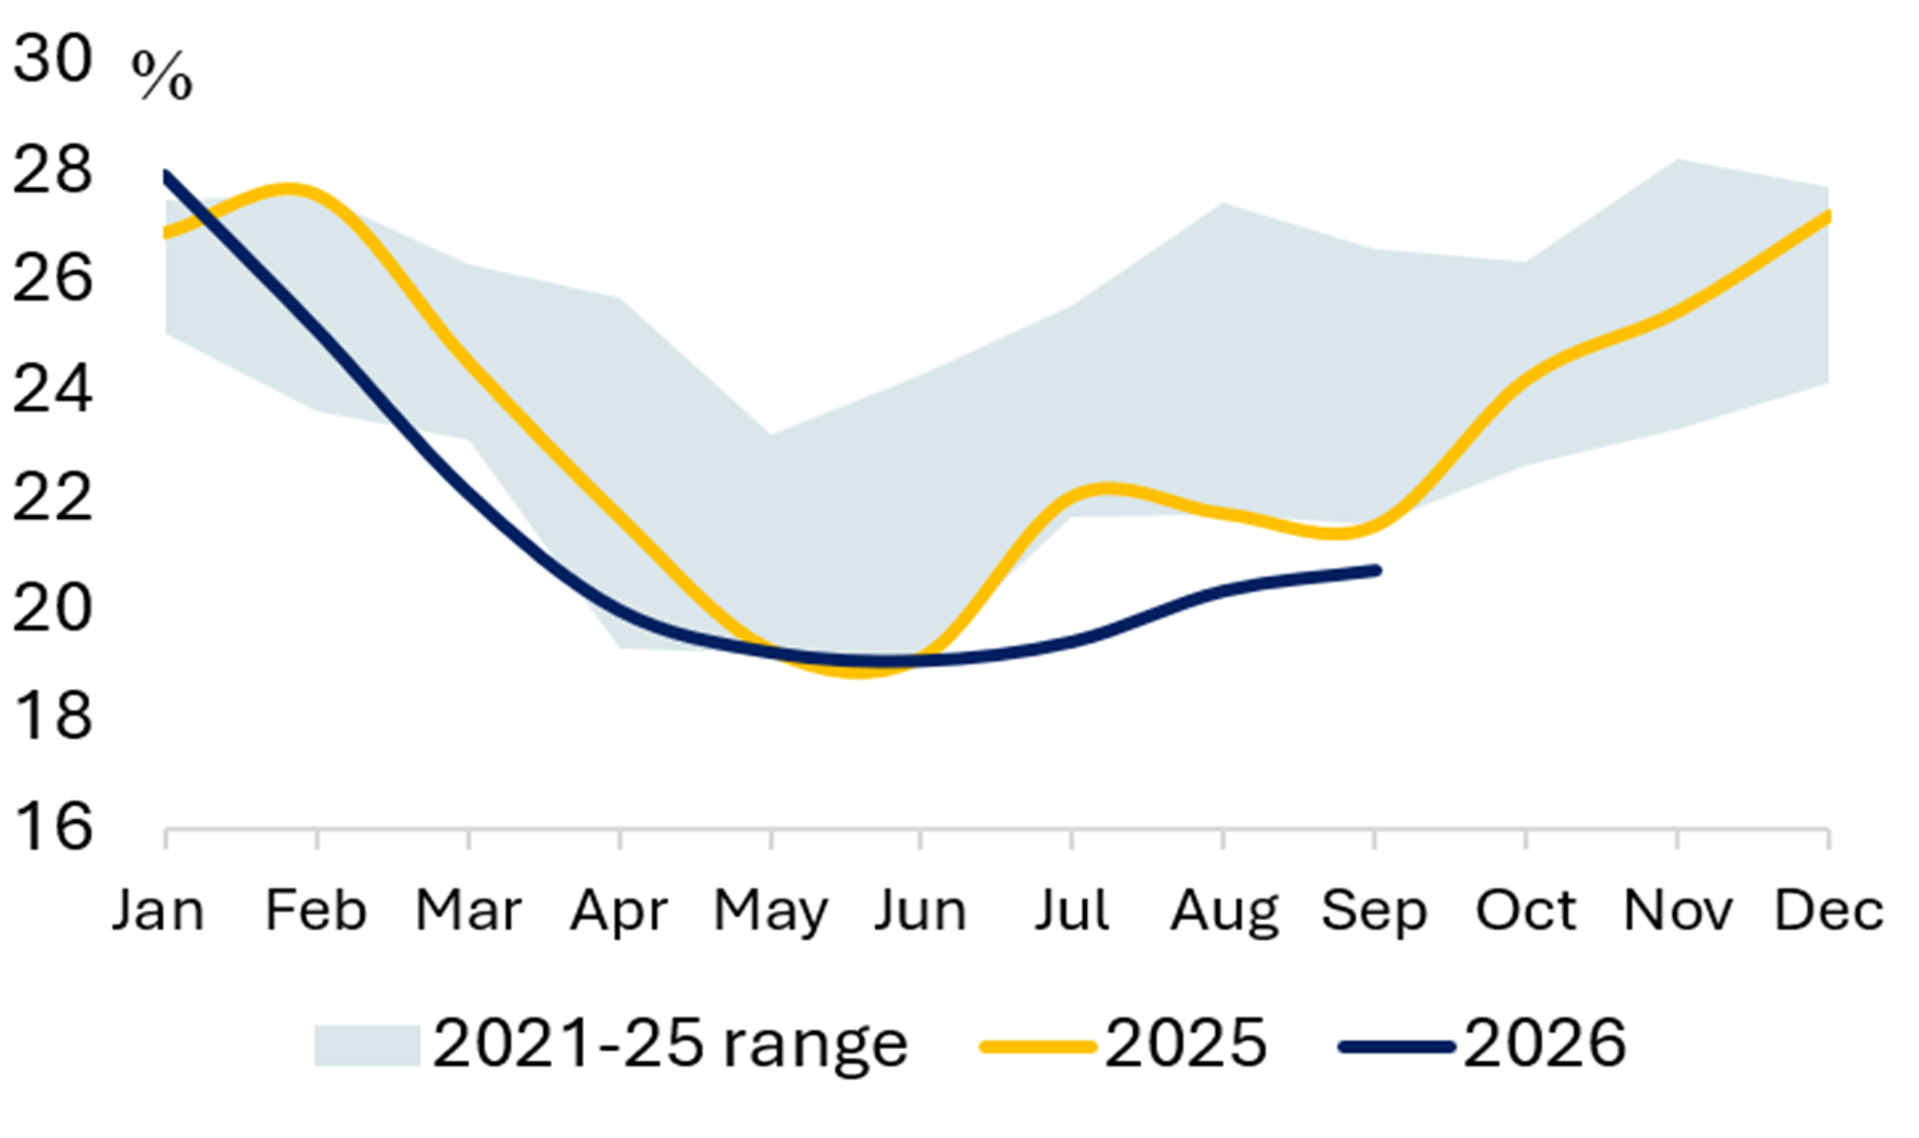
Exhibit 24 Share of Gas (%) Exhibit 25 Share of Nuclear (%) 
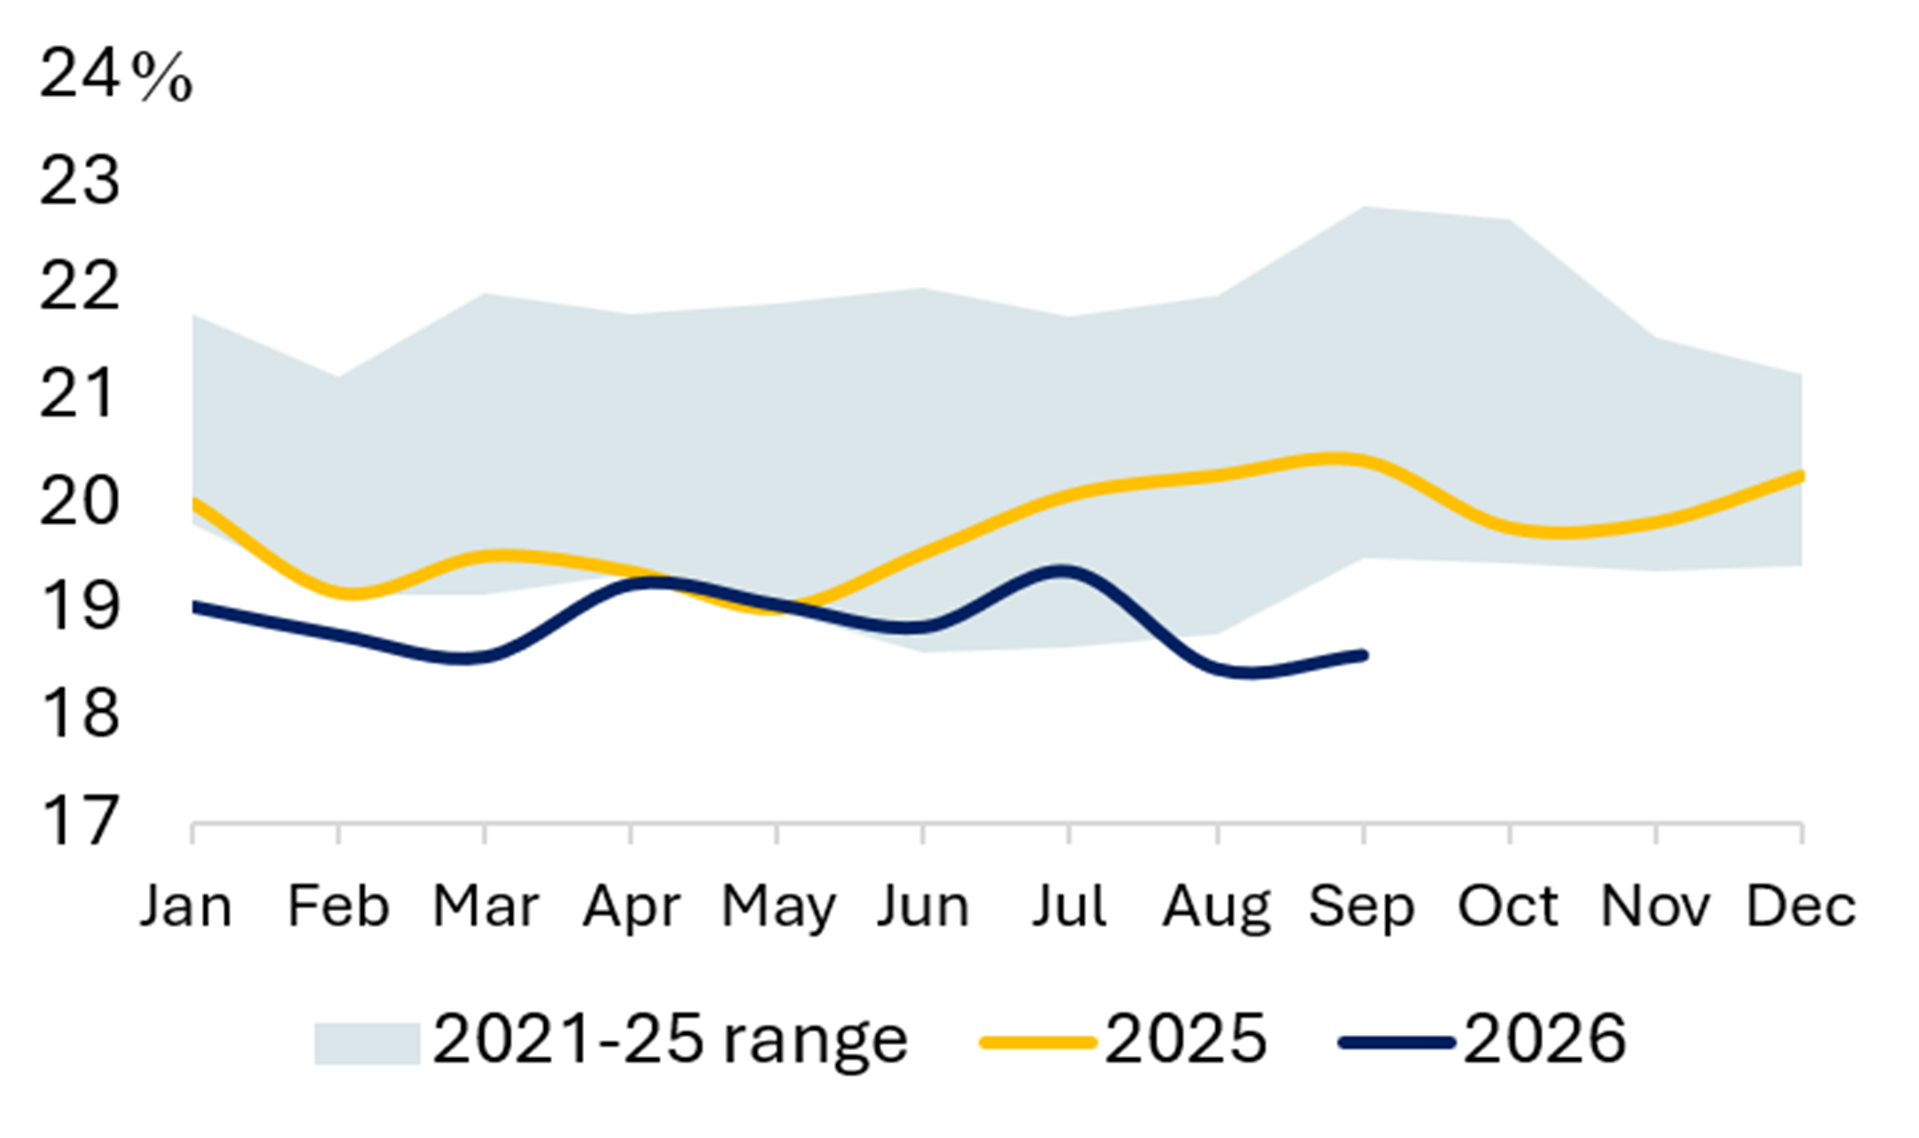

Source: Ember
USA
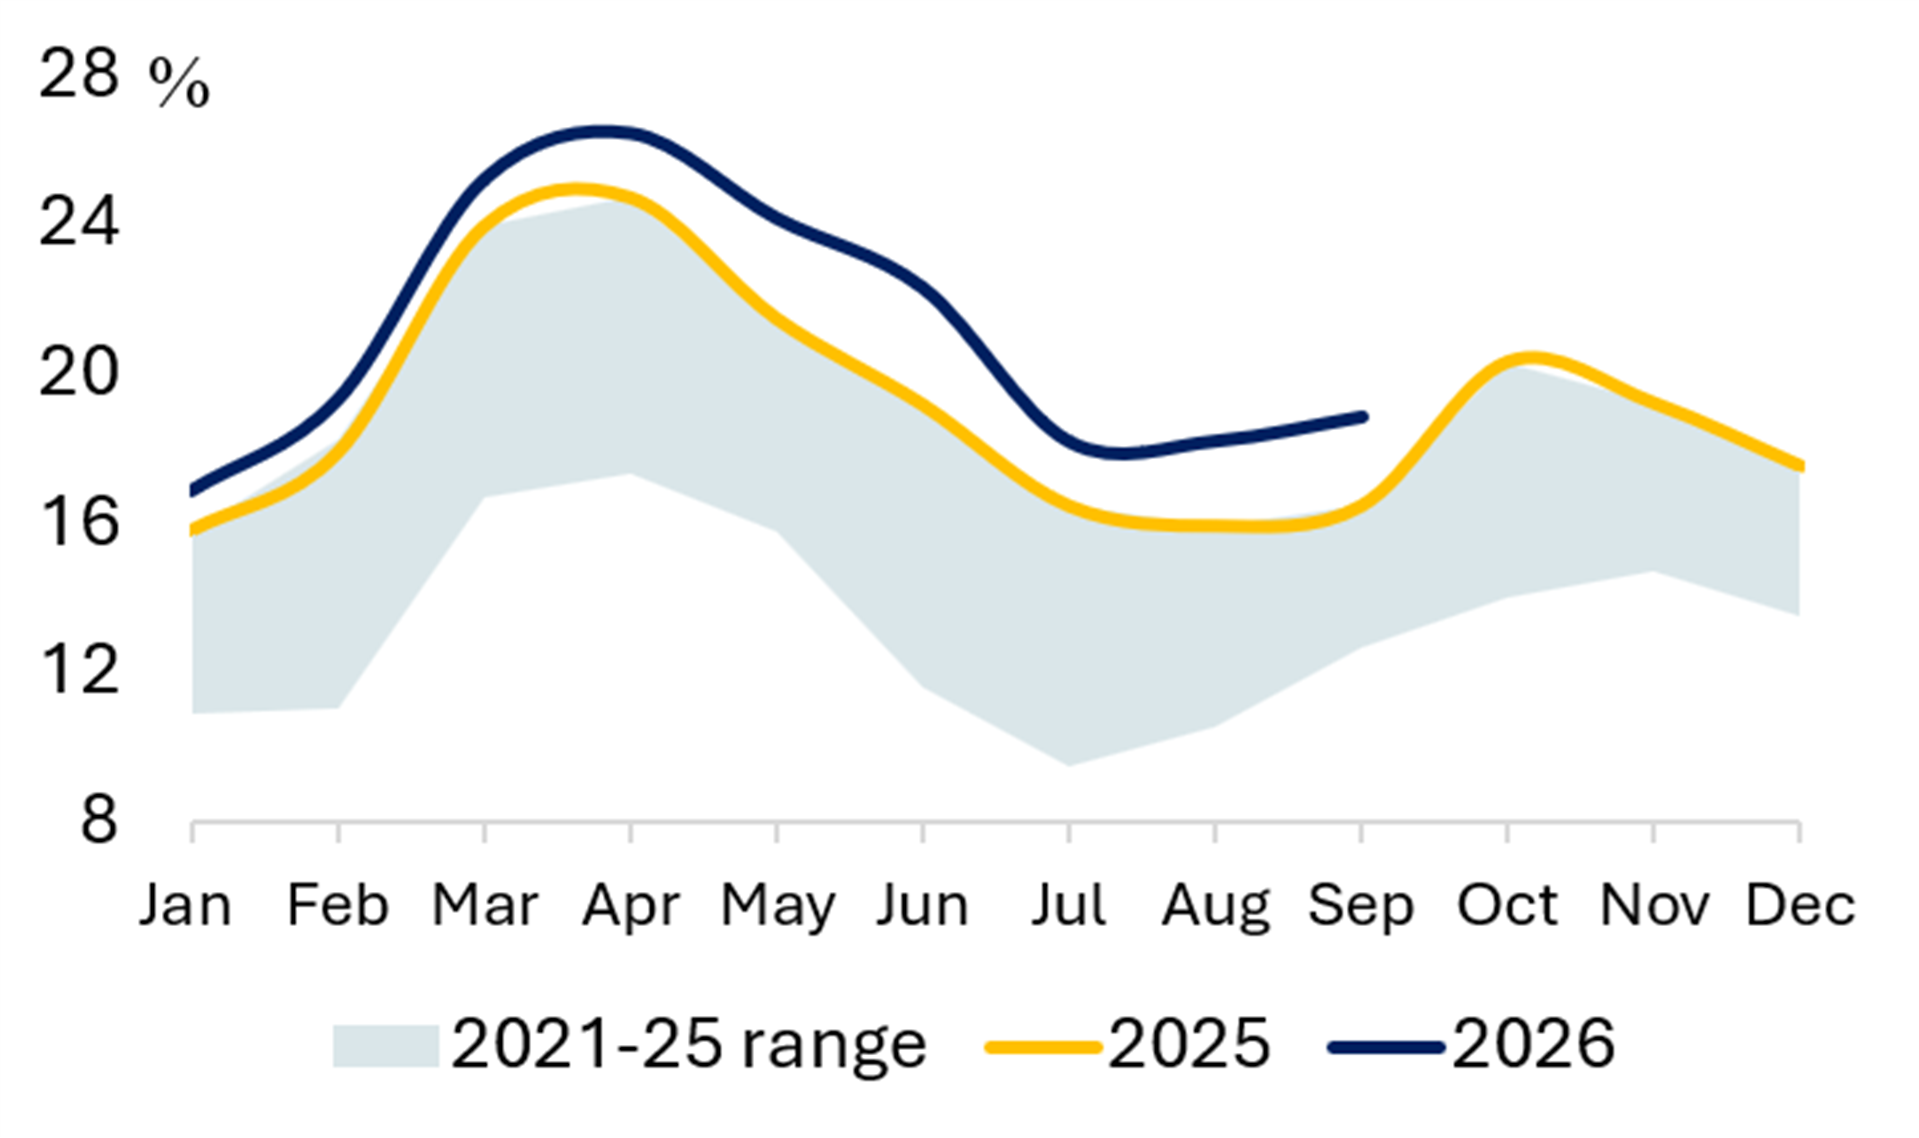
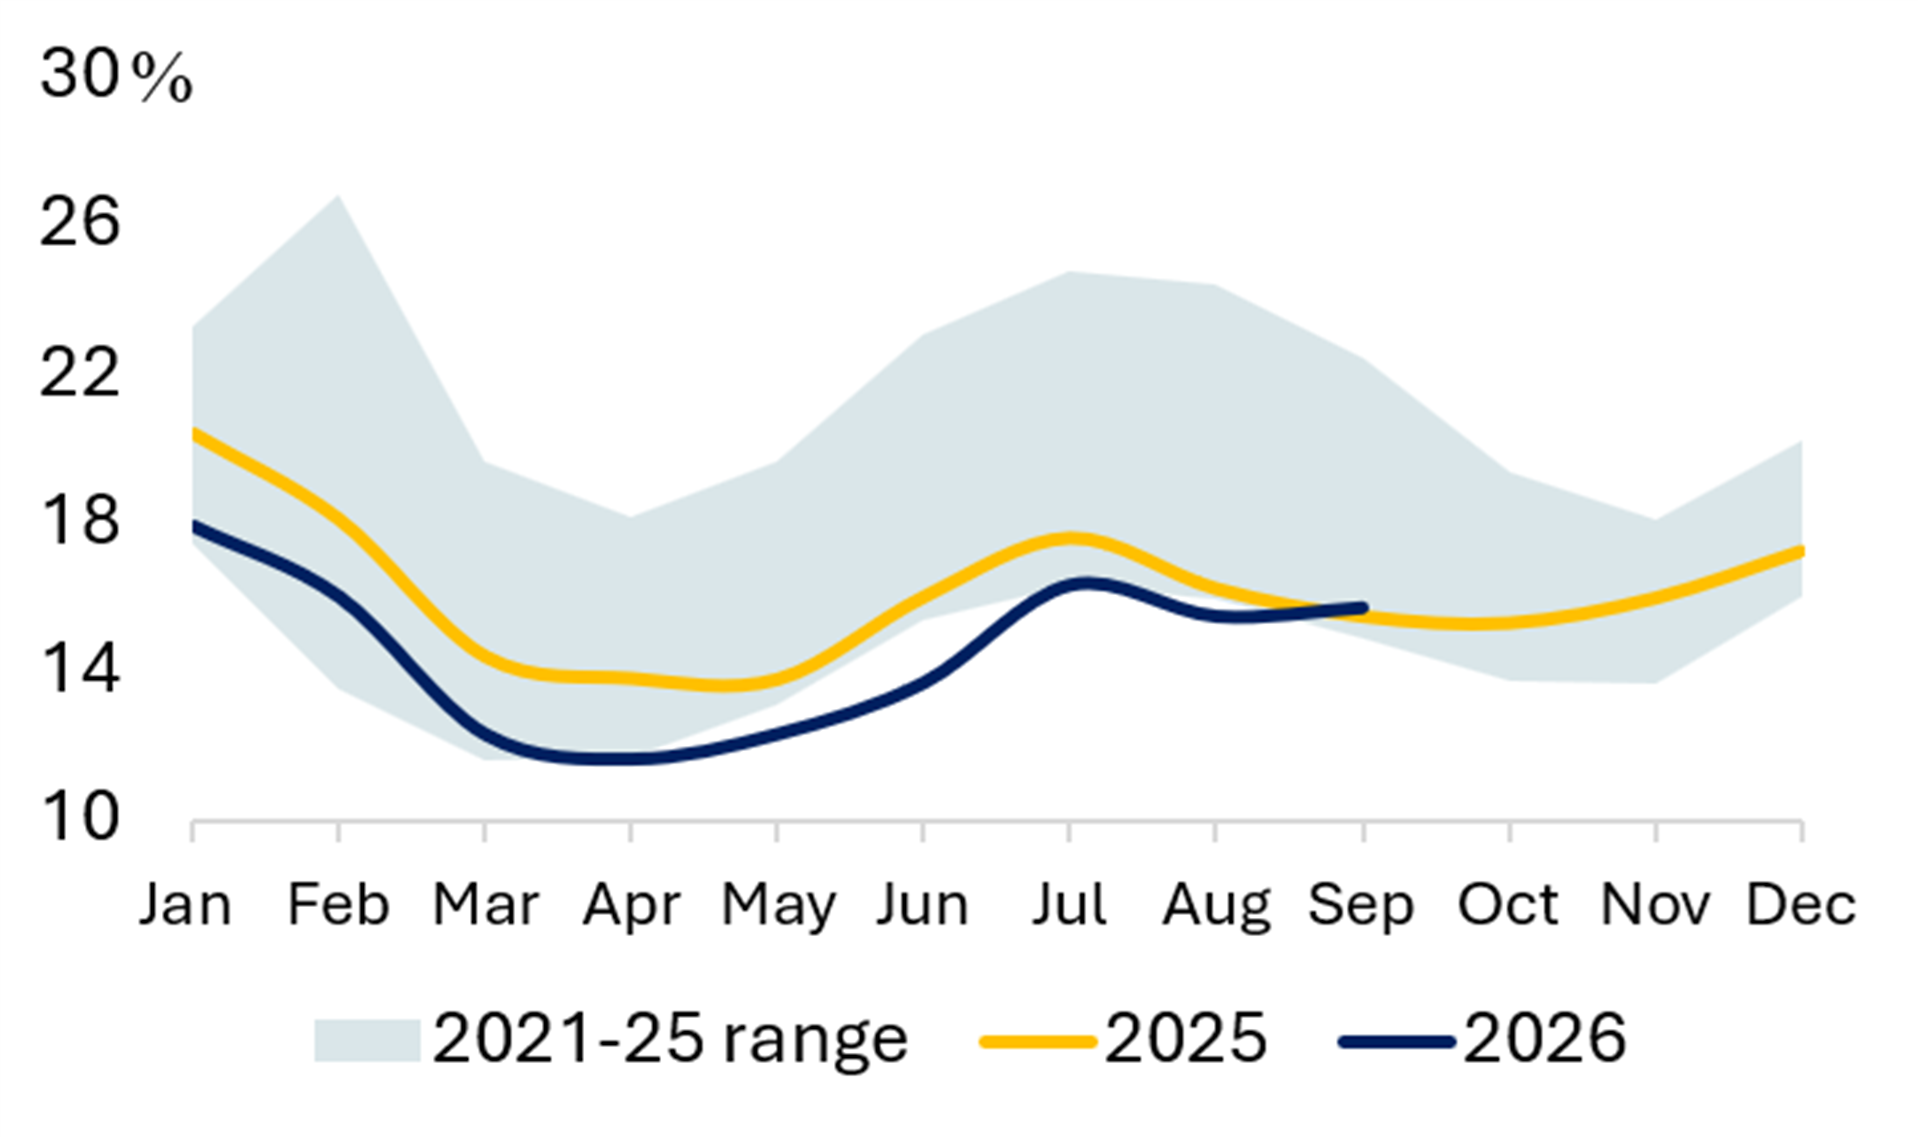
Exhibit 26 North America: Biggest Sources of Power in every State & Province

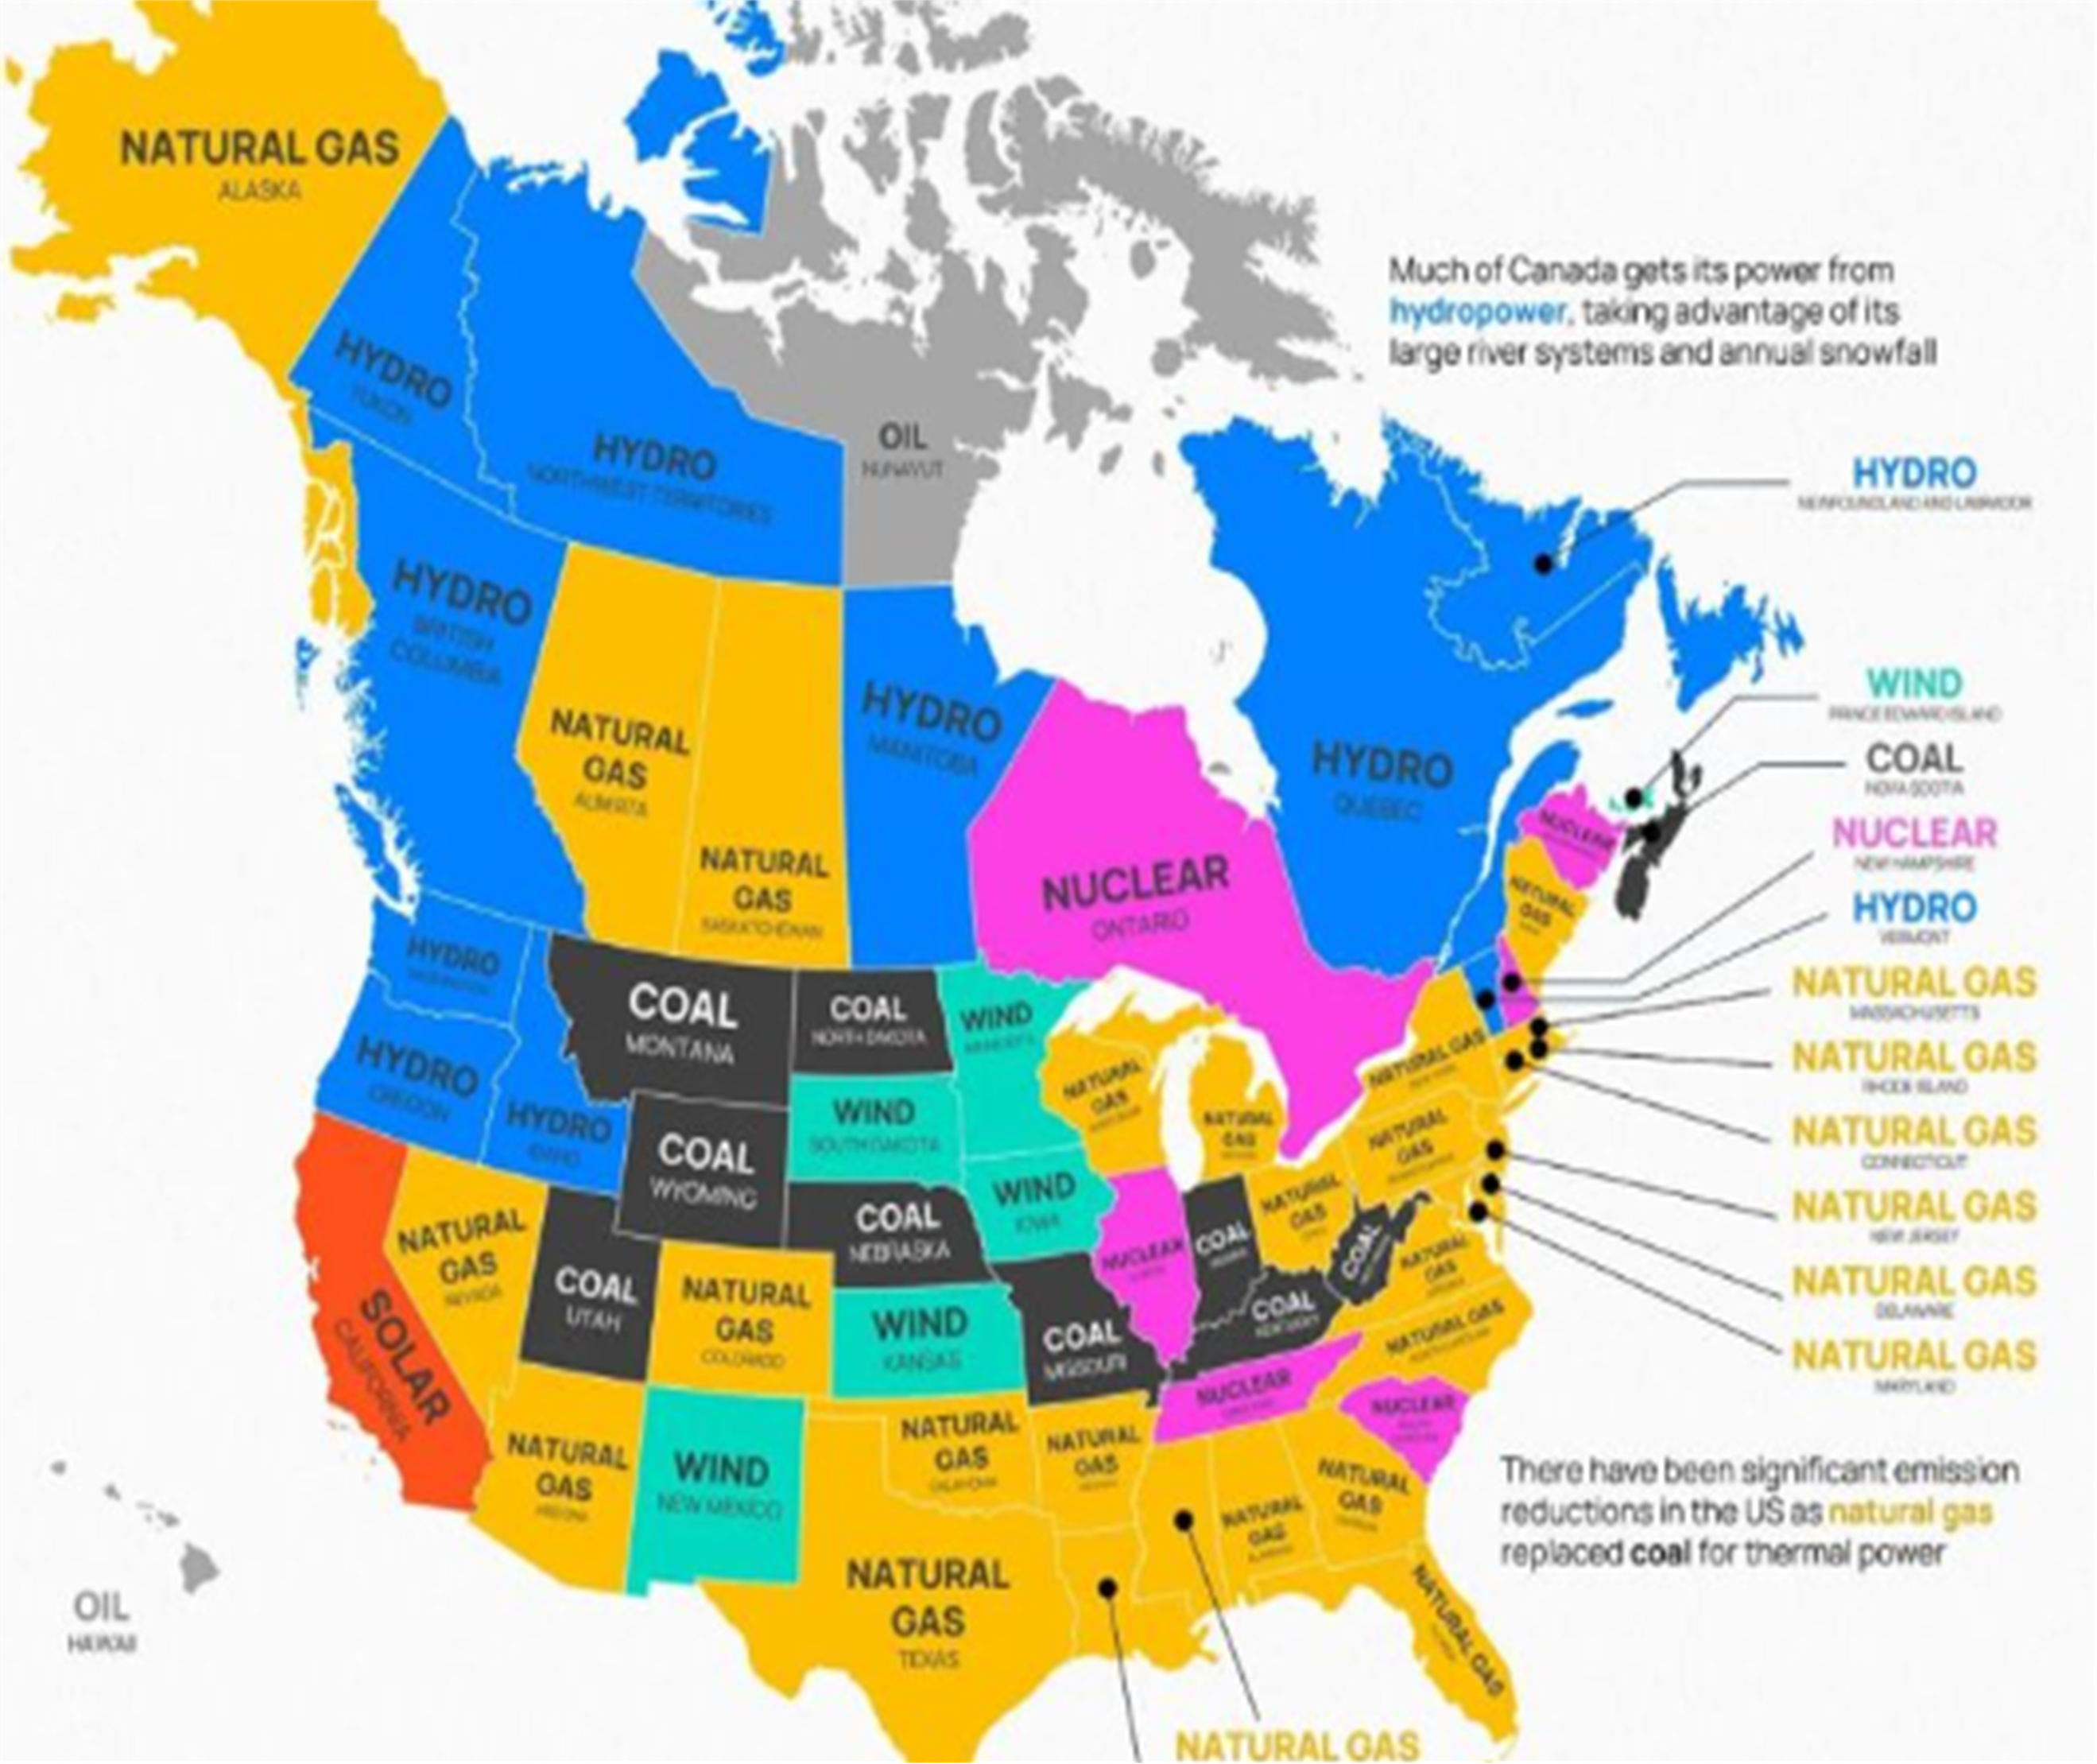
Exhibit 27 Power Generation Exhibit 28 Share of Gas (%) 
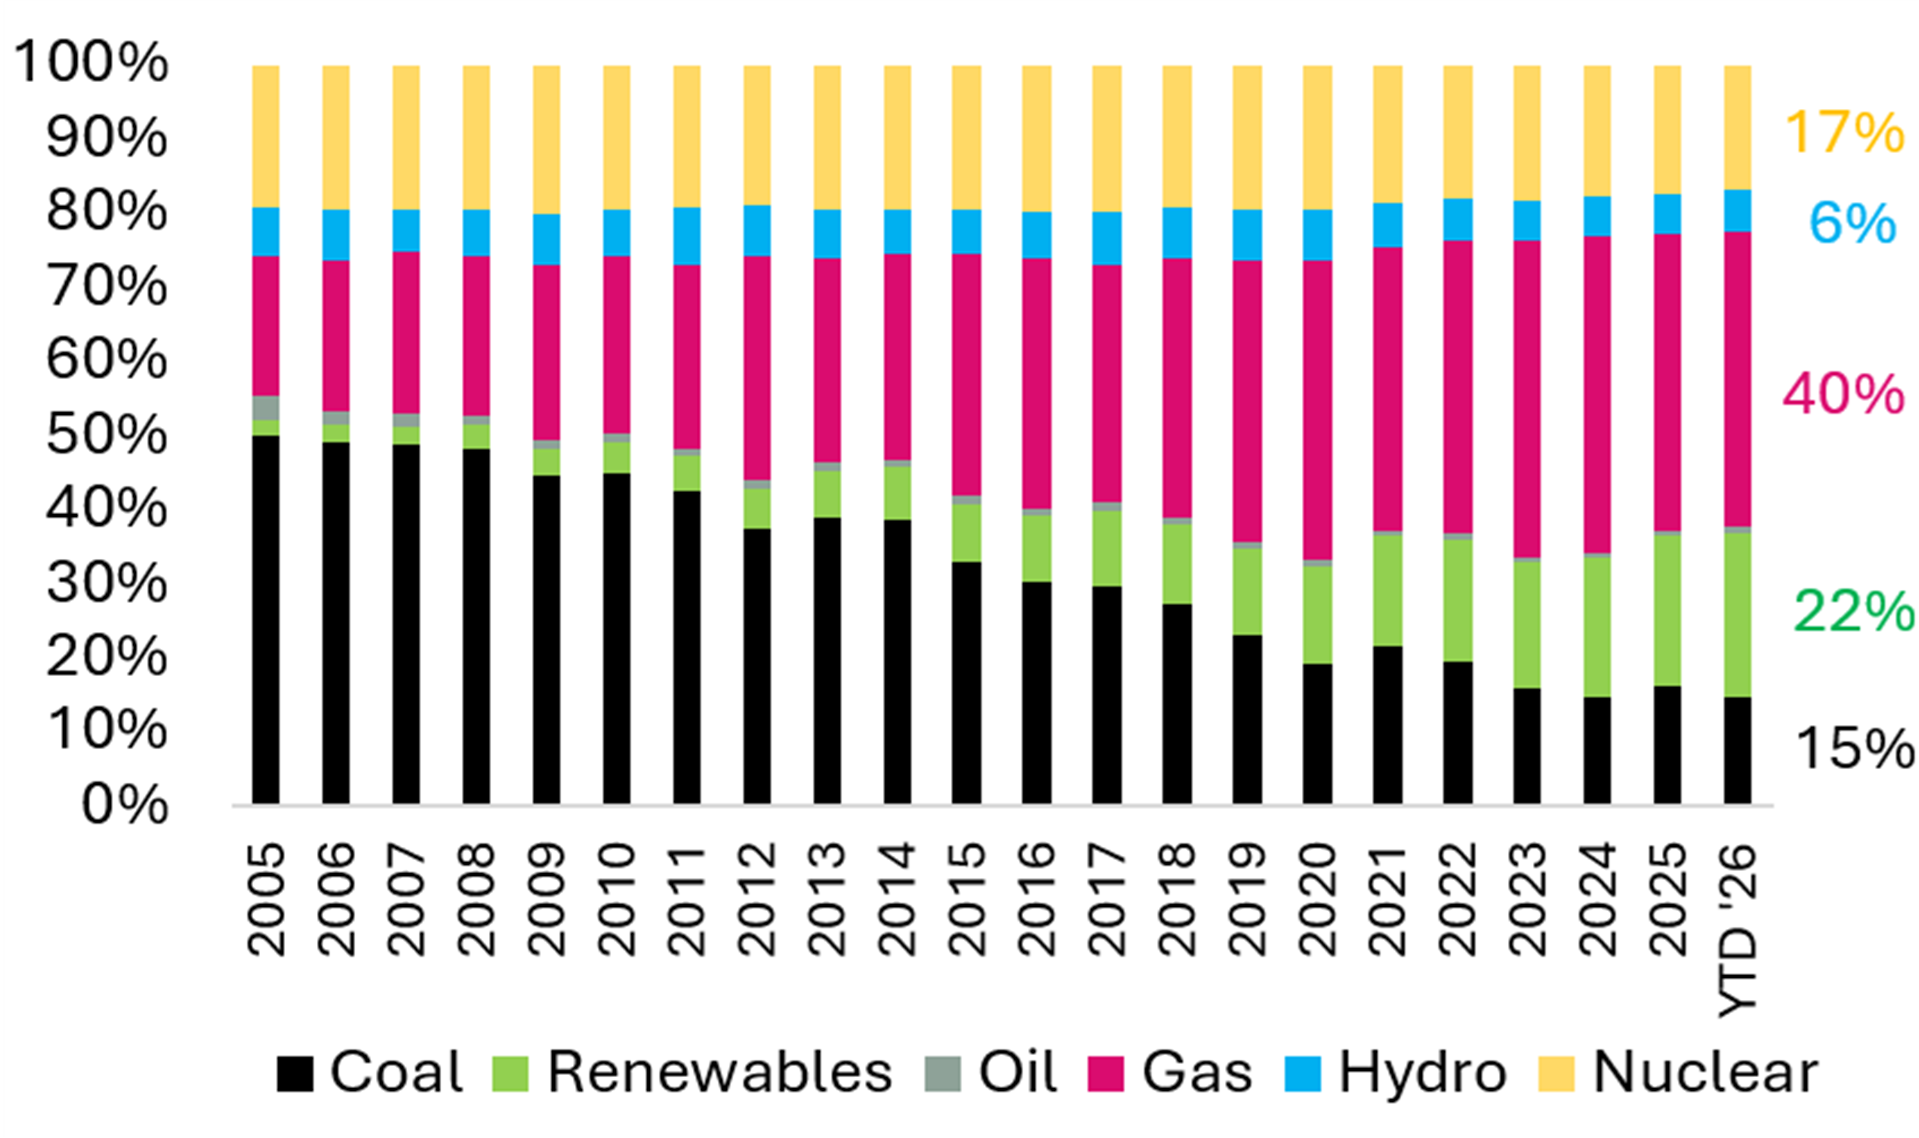
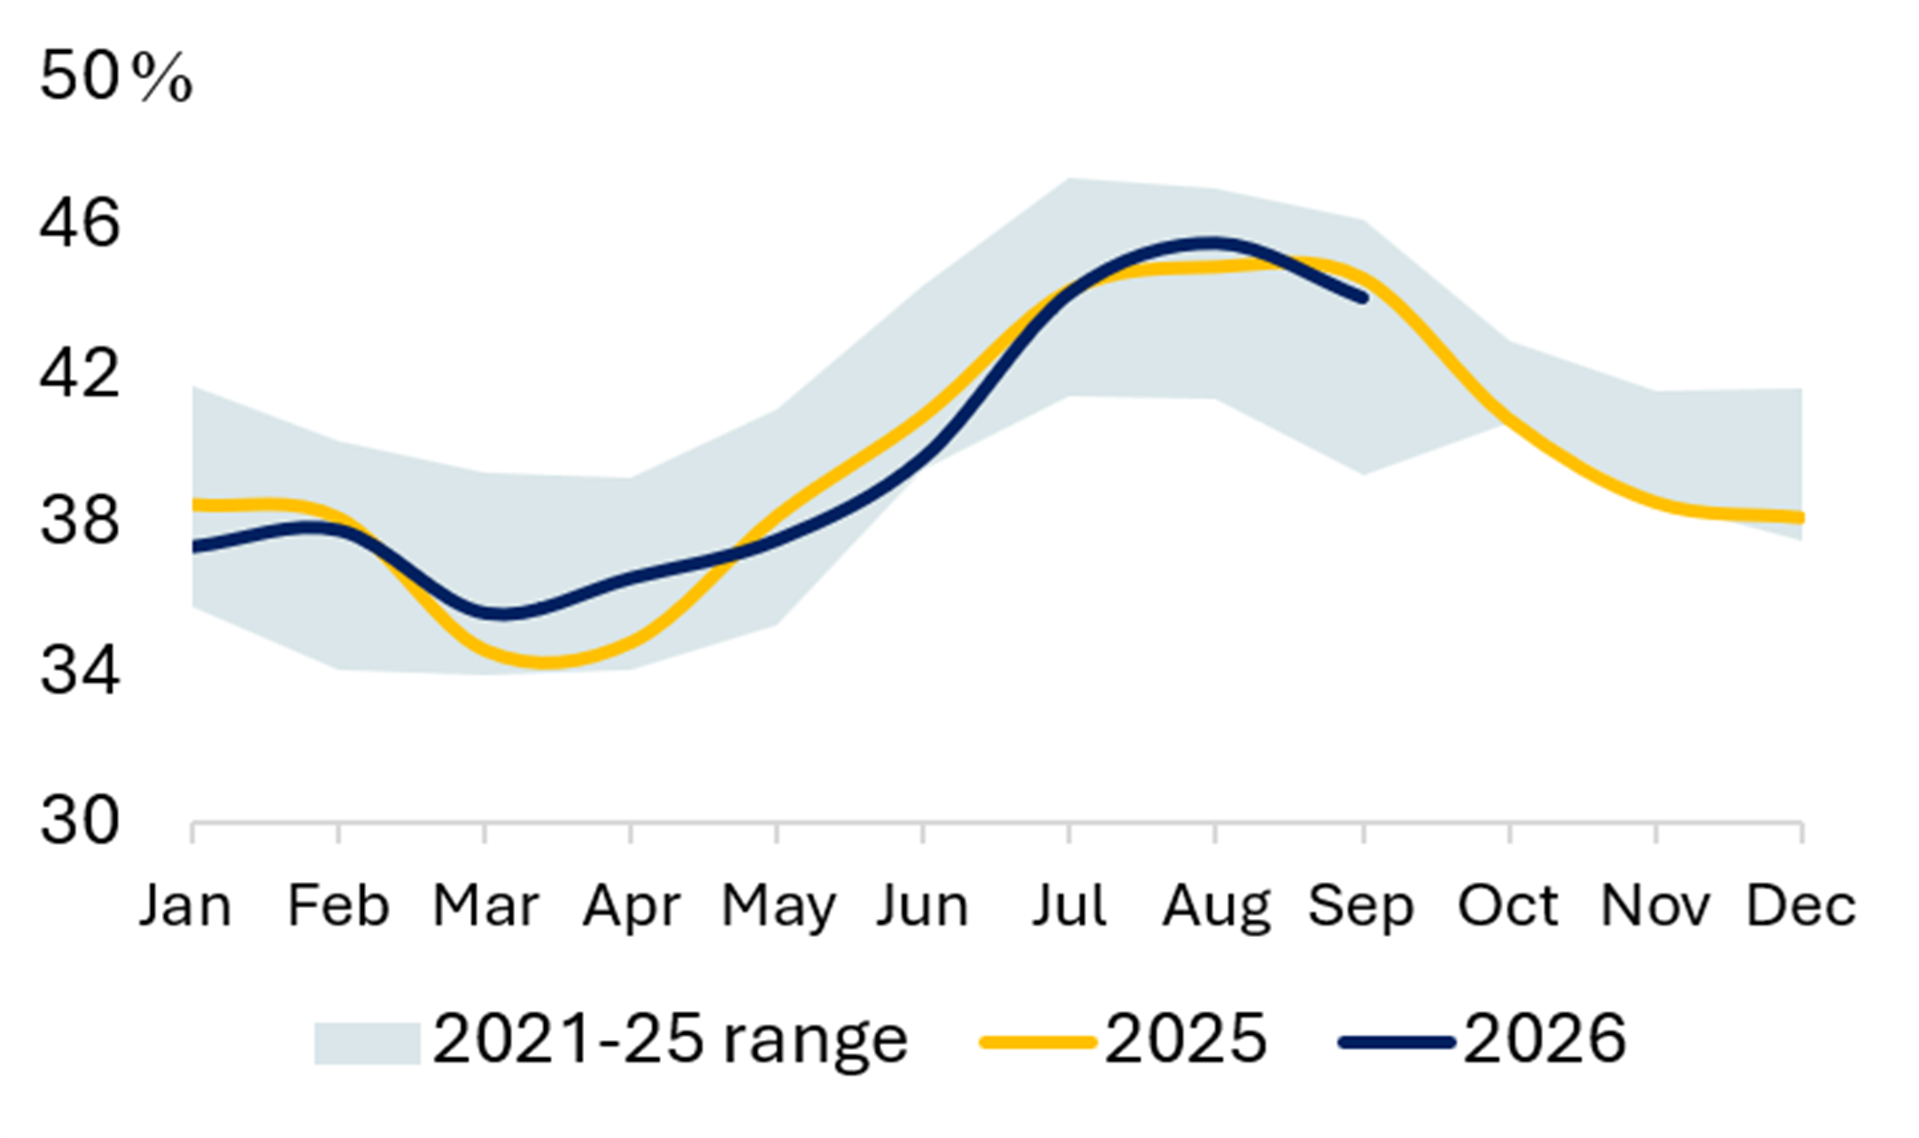

Exhibit 29 Share of Wind & Solar (%) Exhibit 30 Share of Coal (%) 

Source: Ember
TÜRKIYE
Exhibit 31 Power Generation Exhibit 32 Share of Coal (%) 

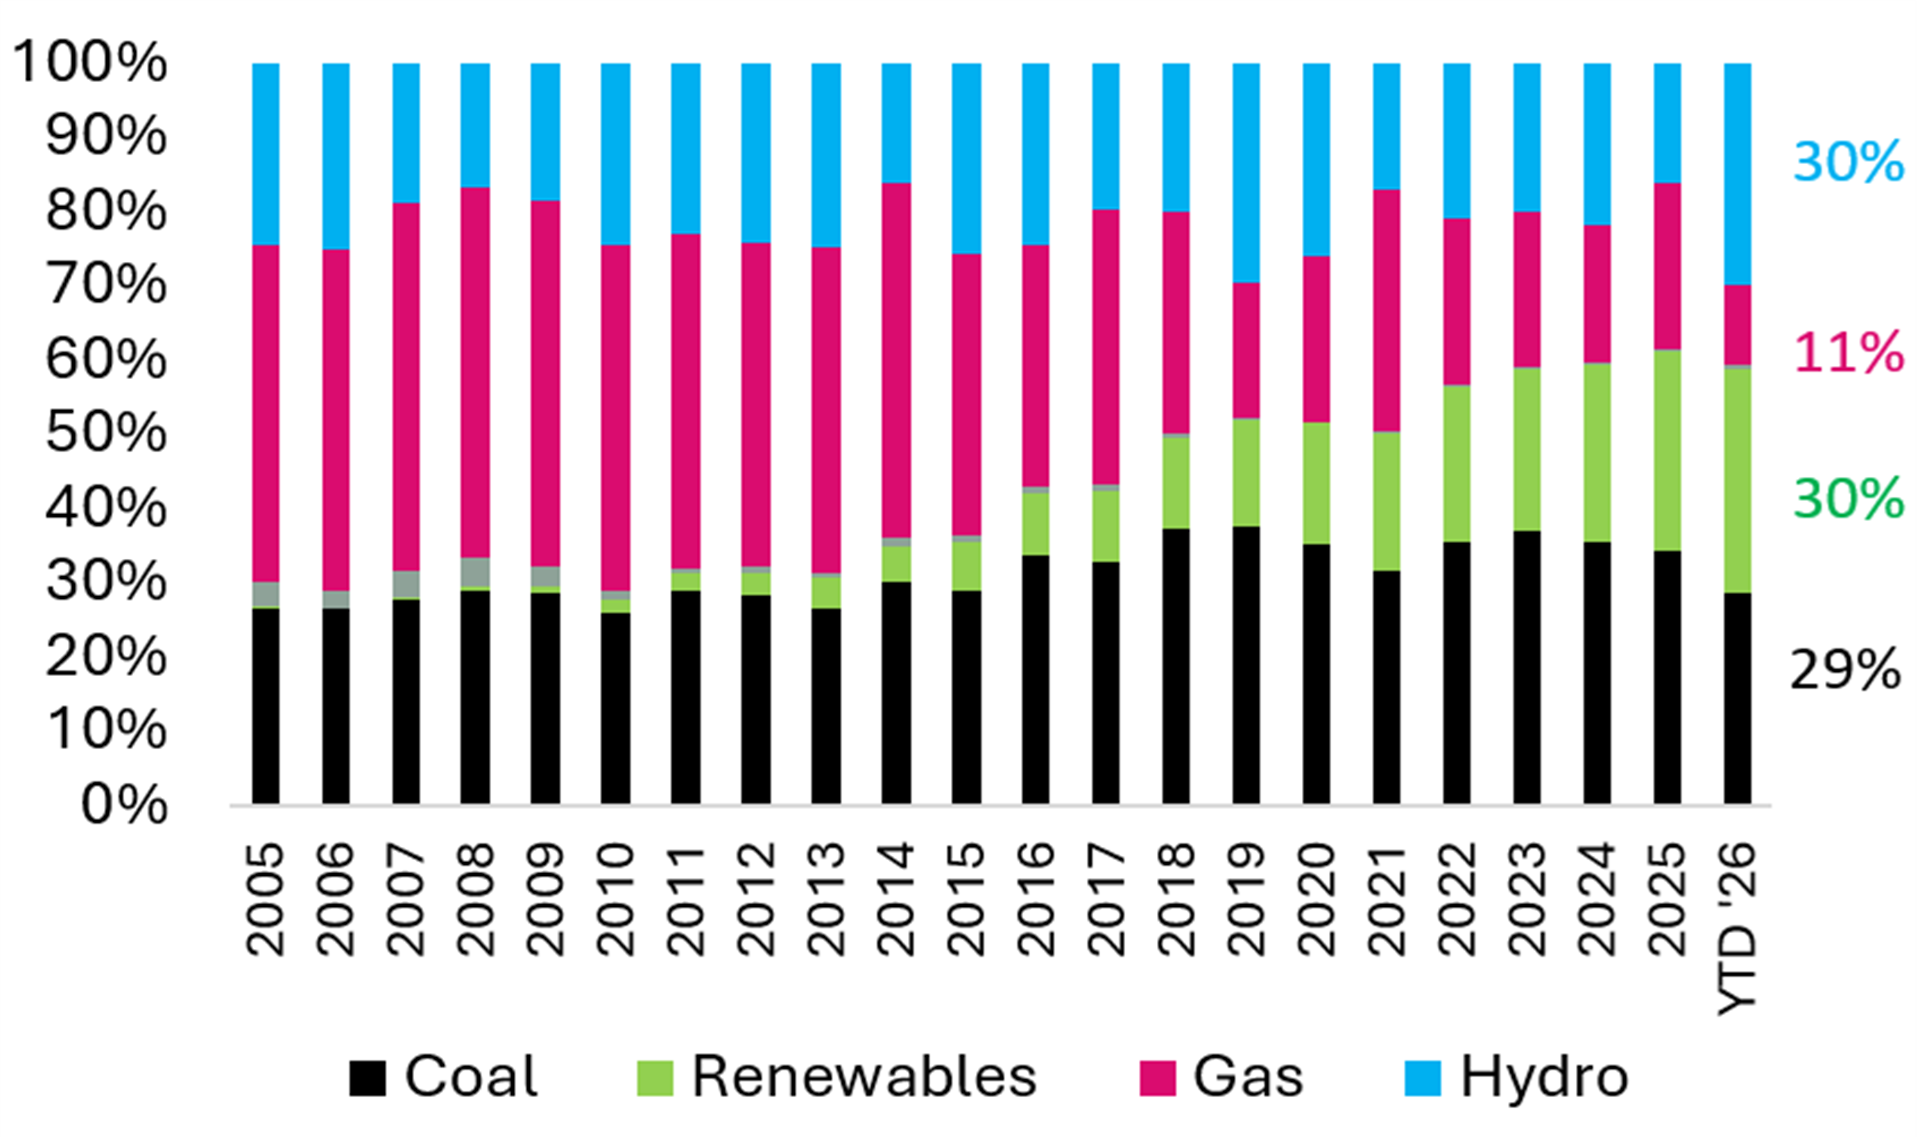
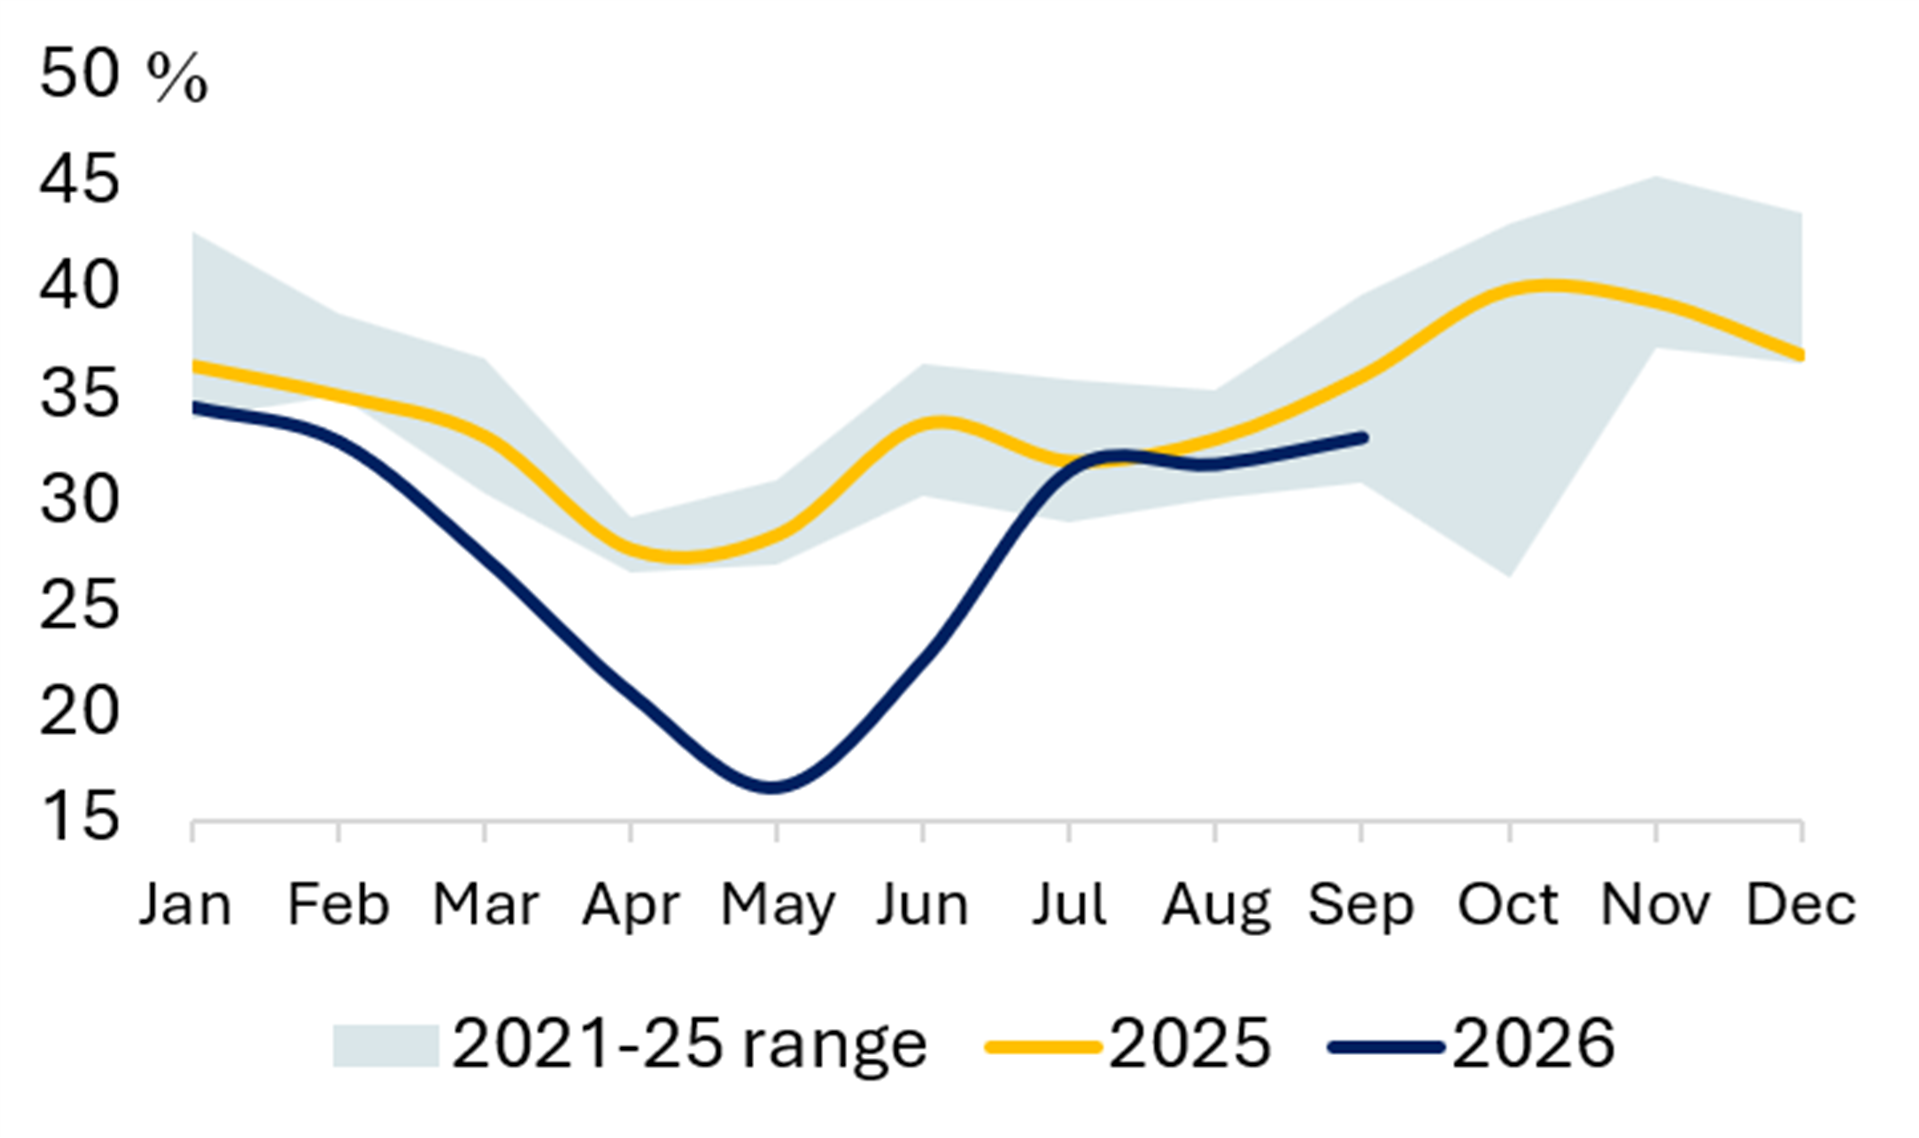
Exhibit 33 Share of Wind & Solar (%) Exhibit 34 Share of Hydro (%) 

INDIA
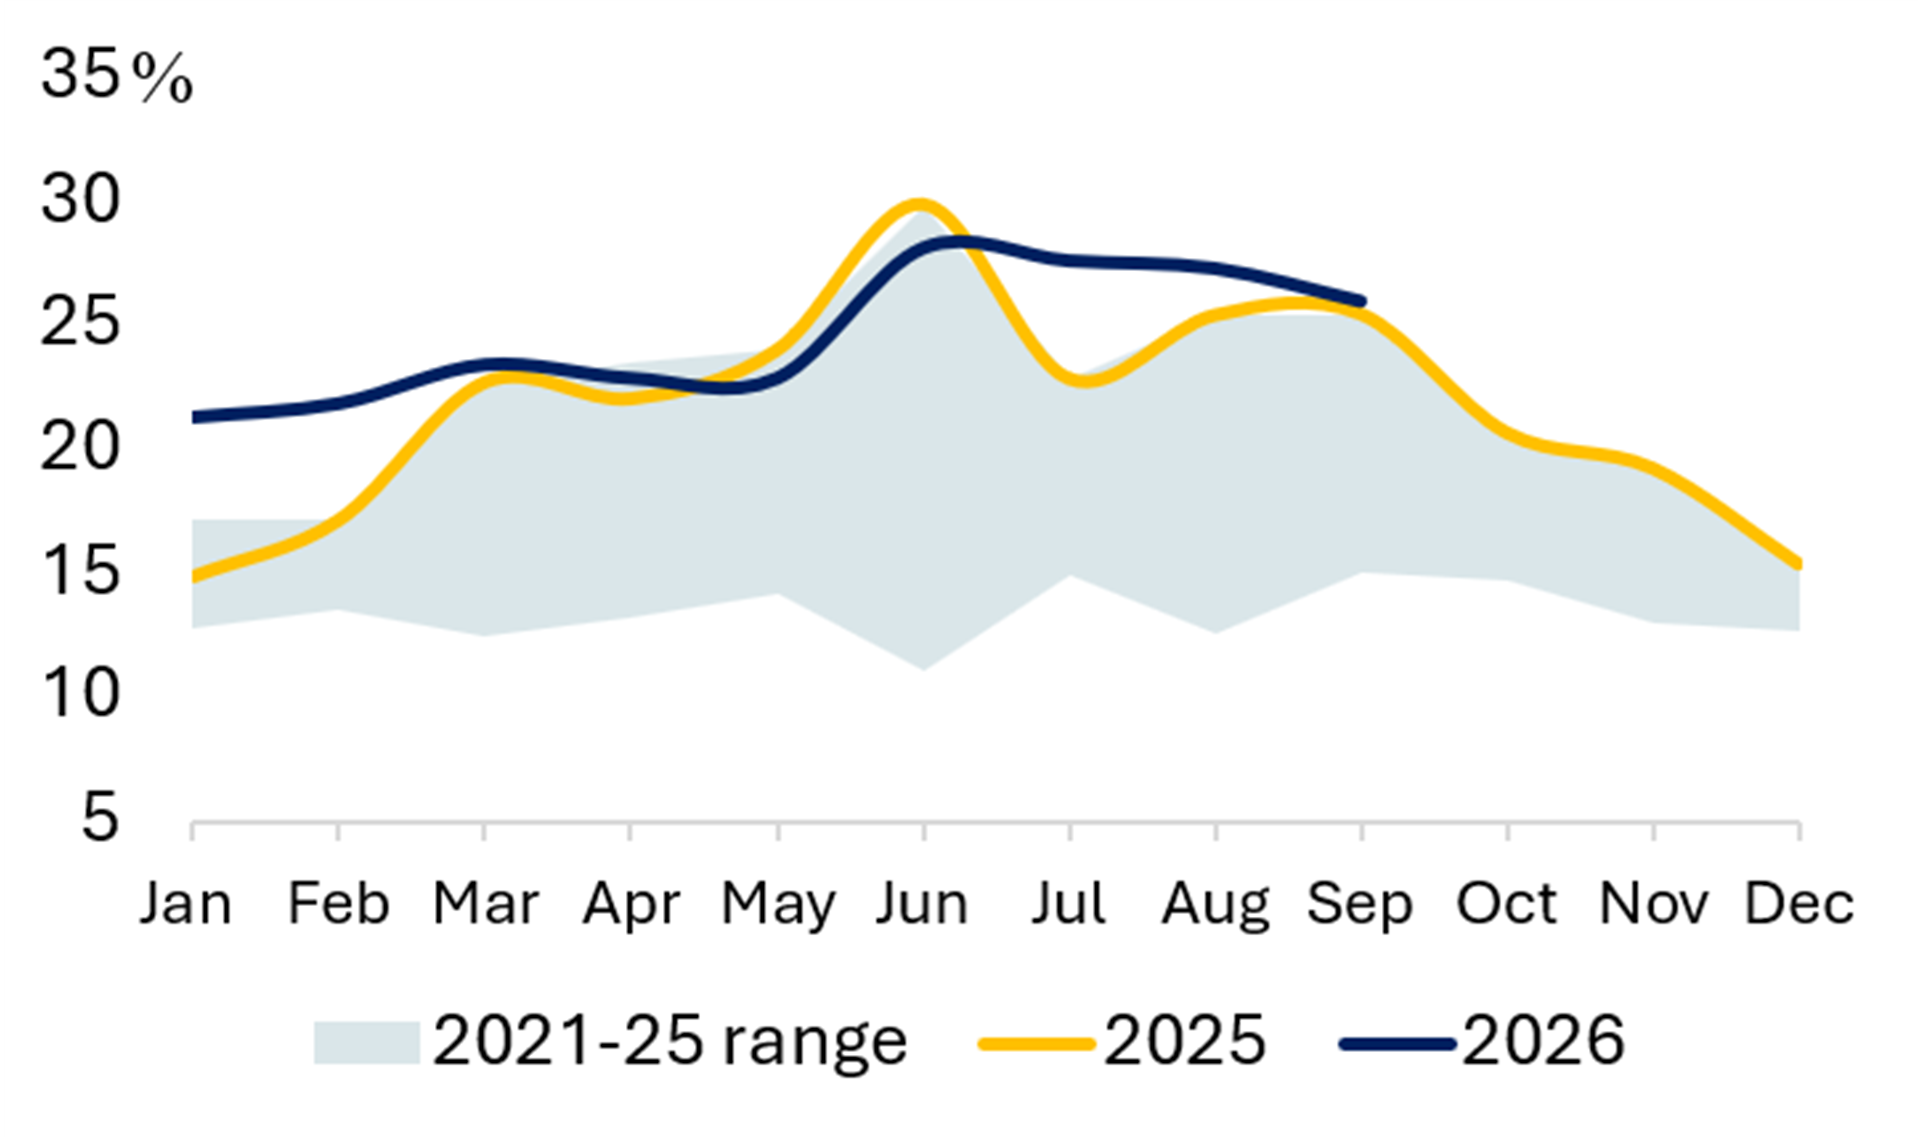
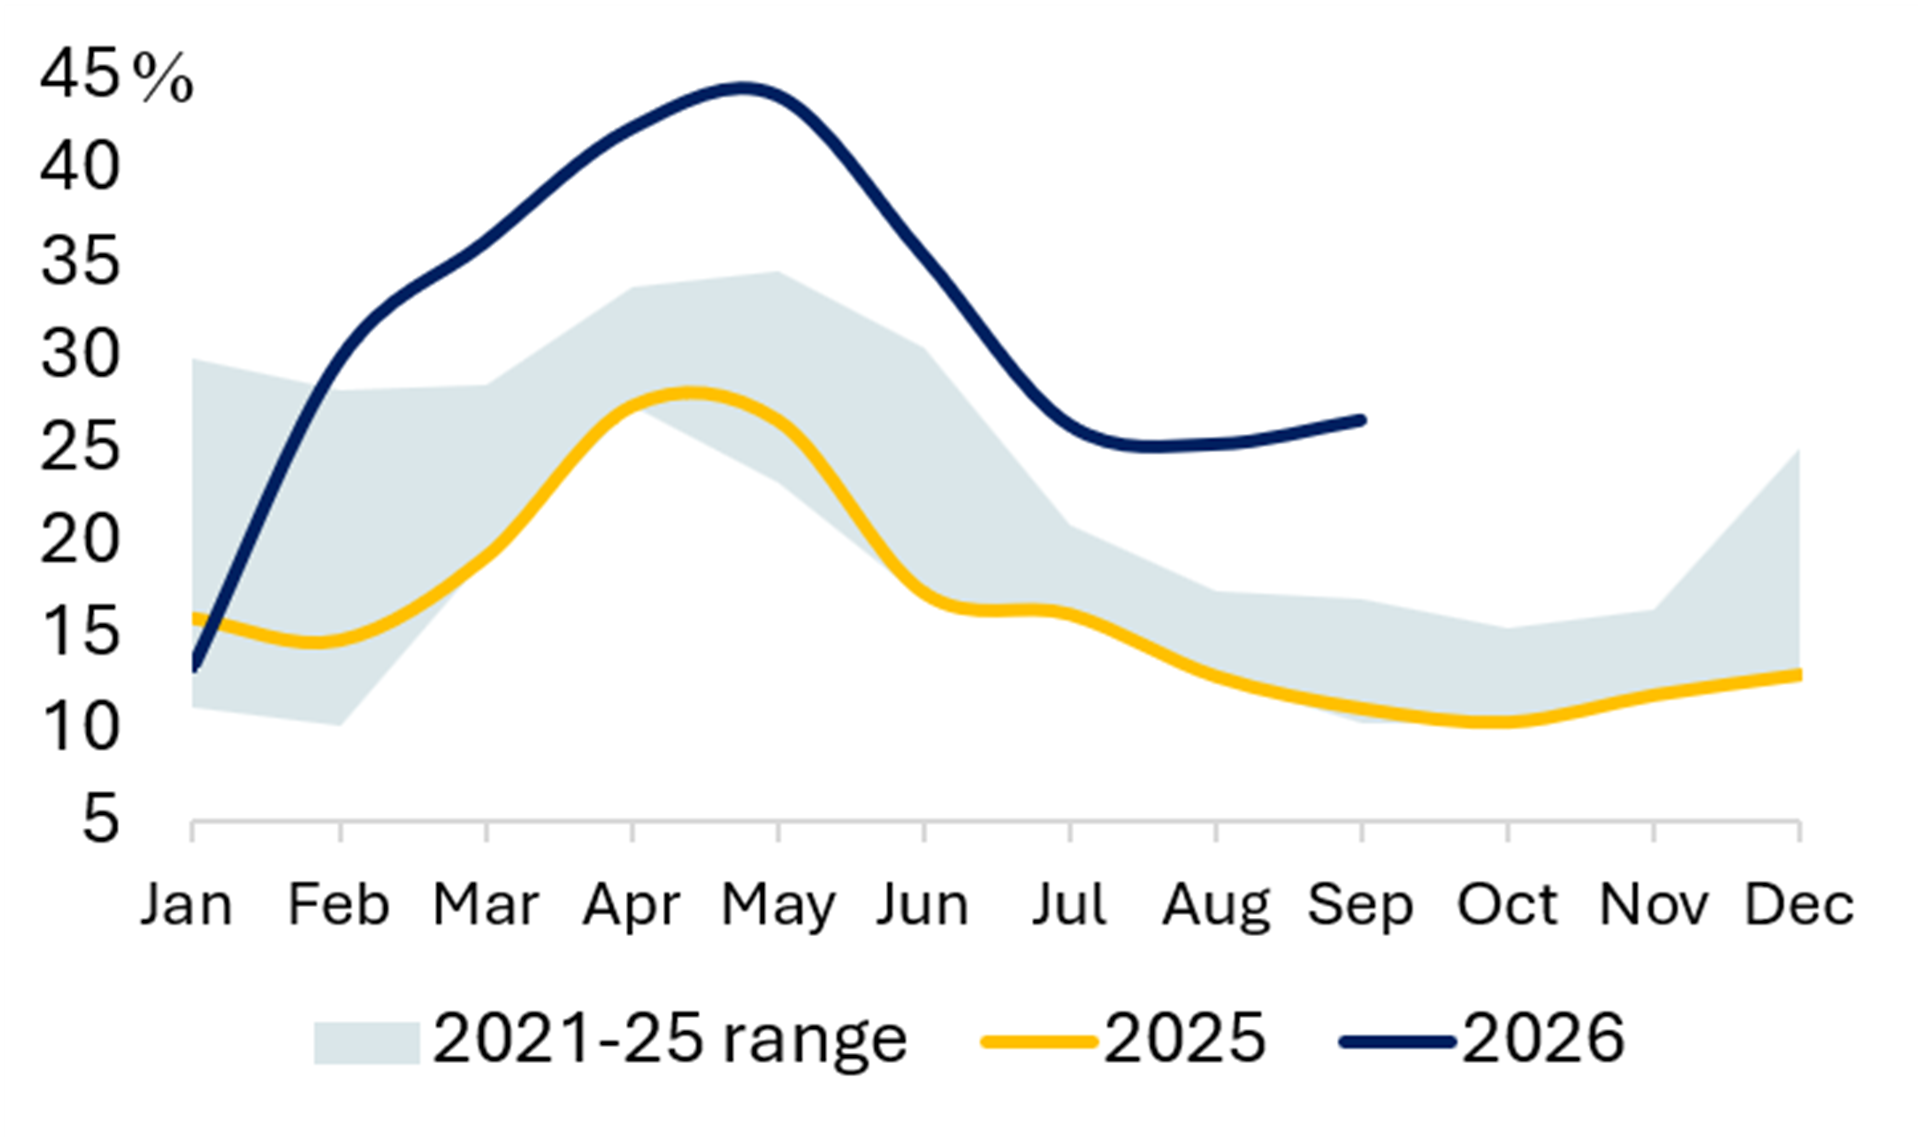
Exhibit 35 Power Generation Exhibit 36 Share of Coal (%) 

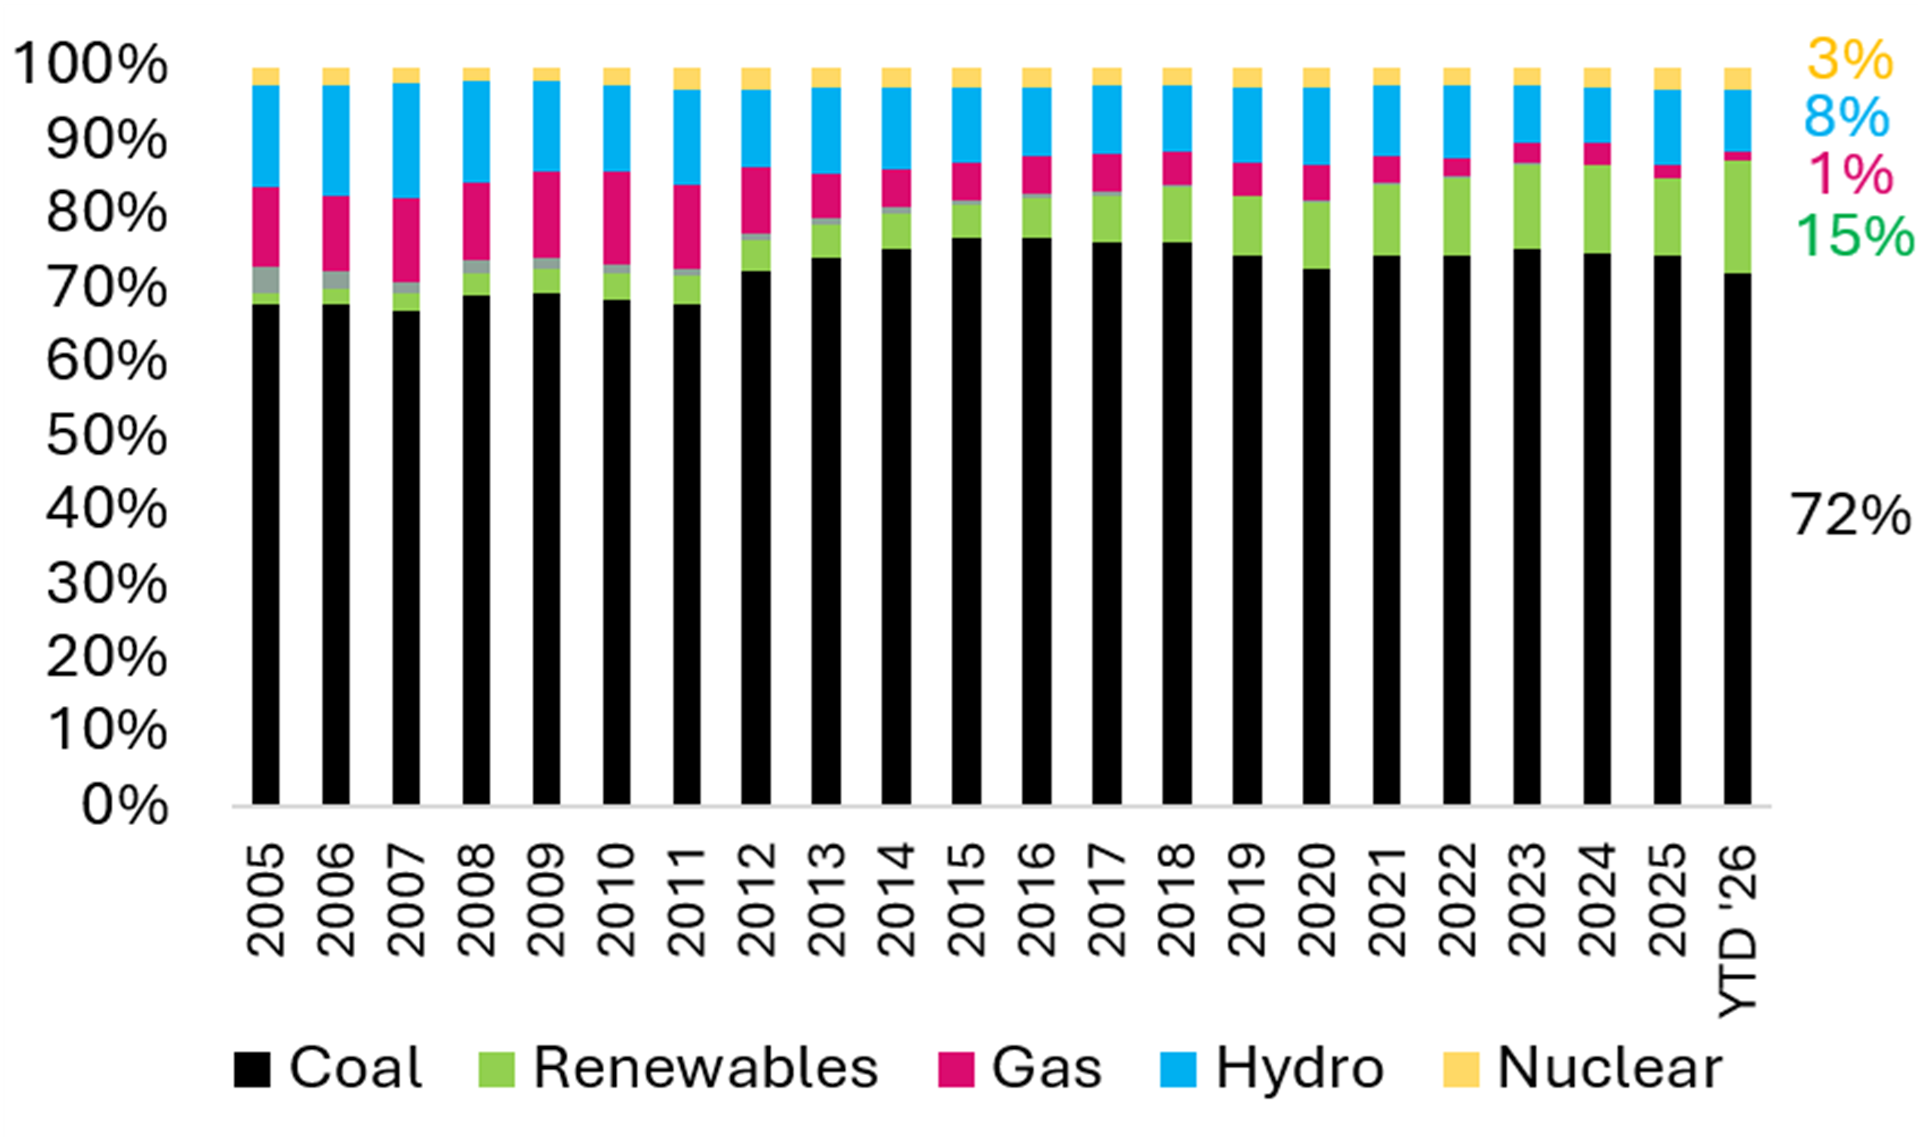
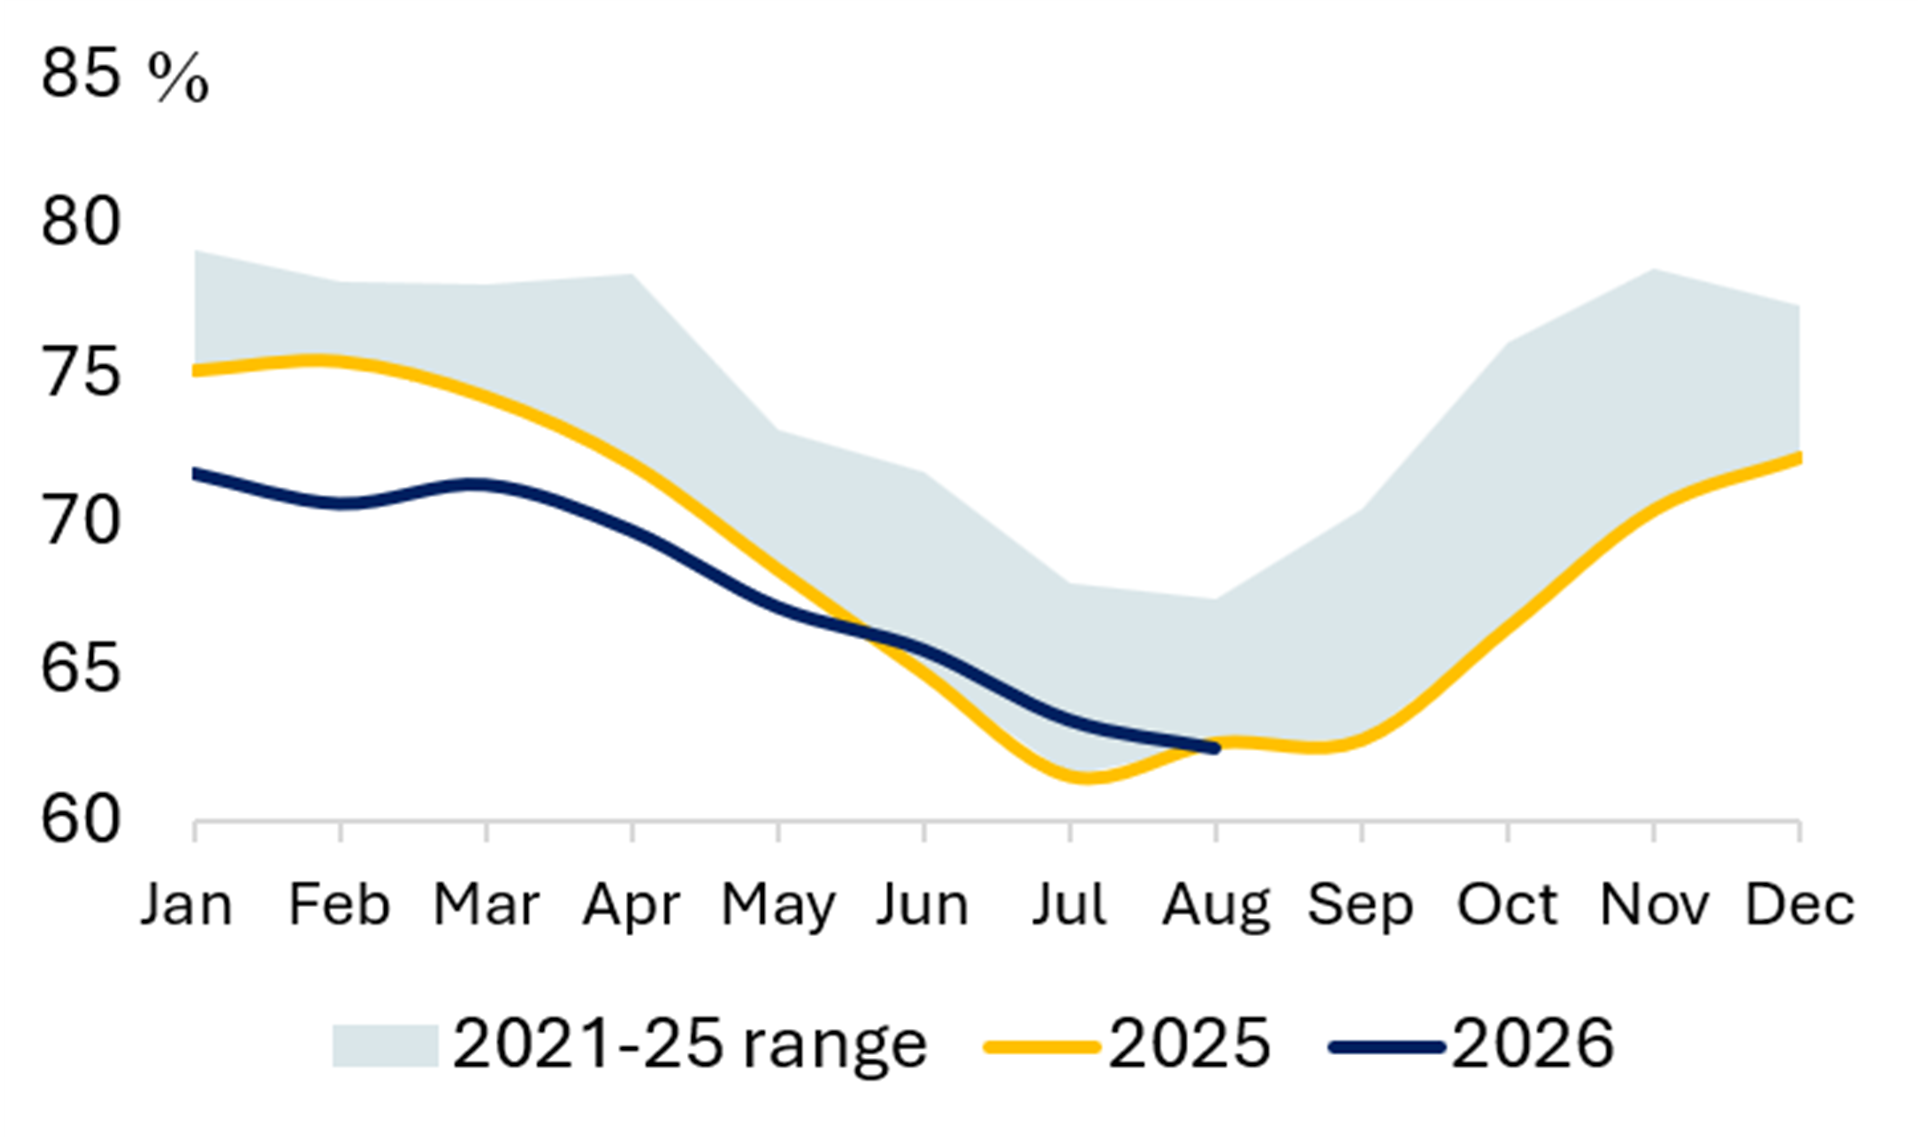
Exhibit 37 Share of Wind & Solar (%) Exhibit 38 Share of Hydro (%) 

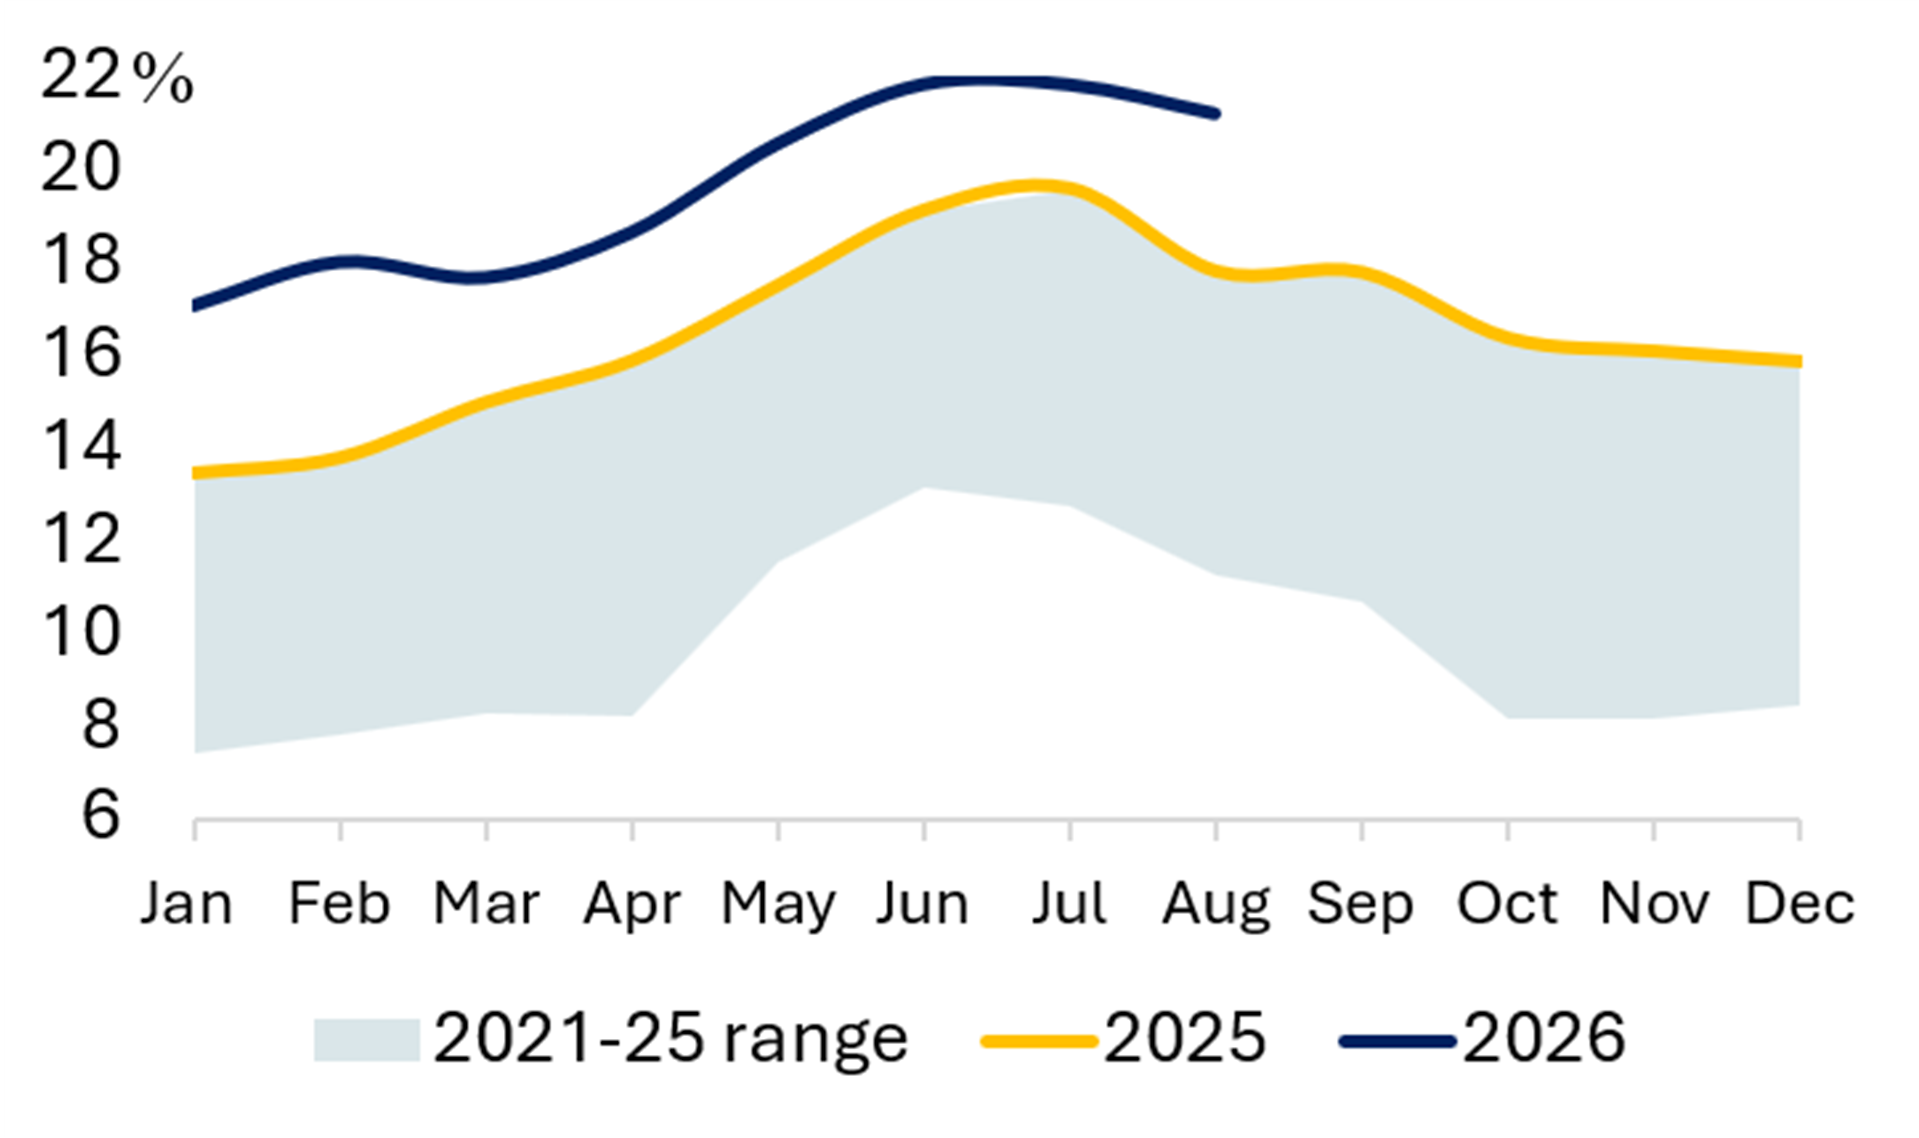
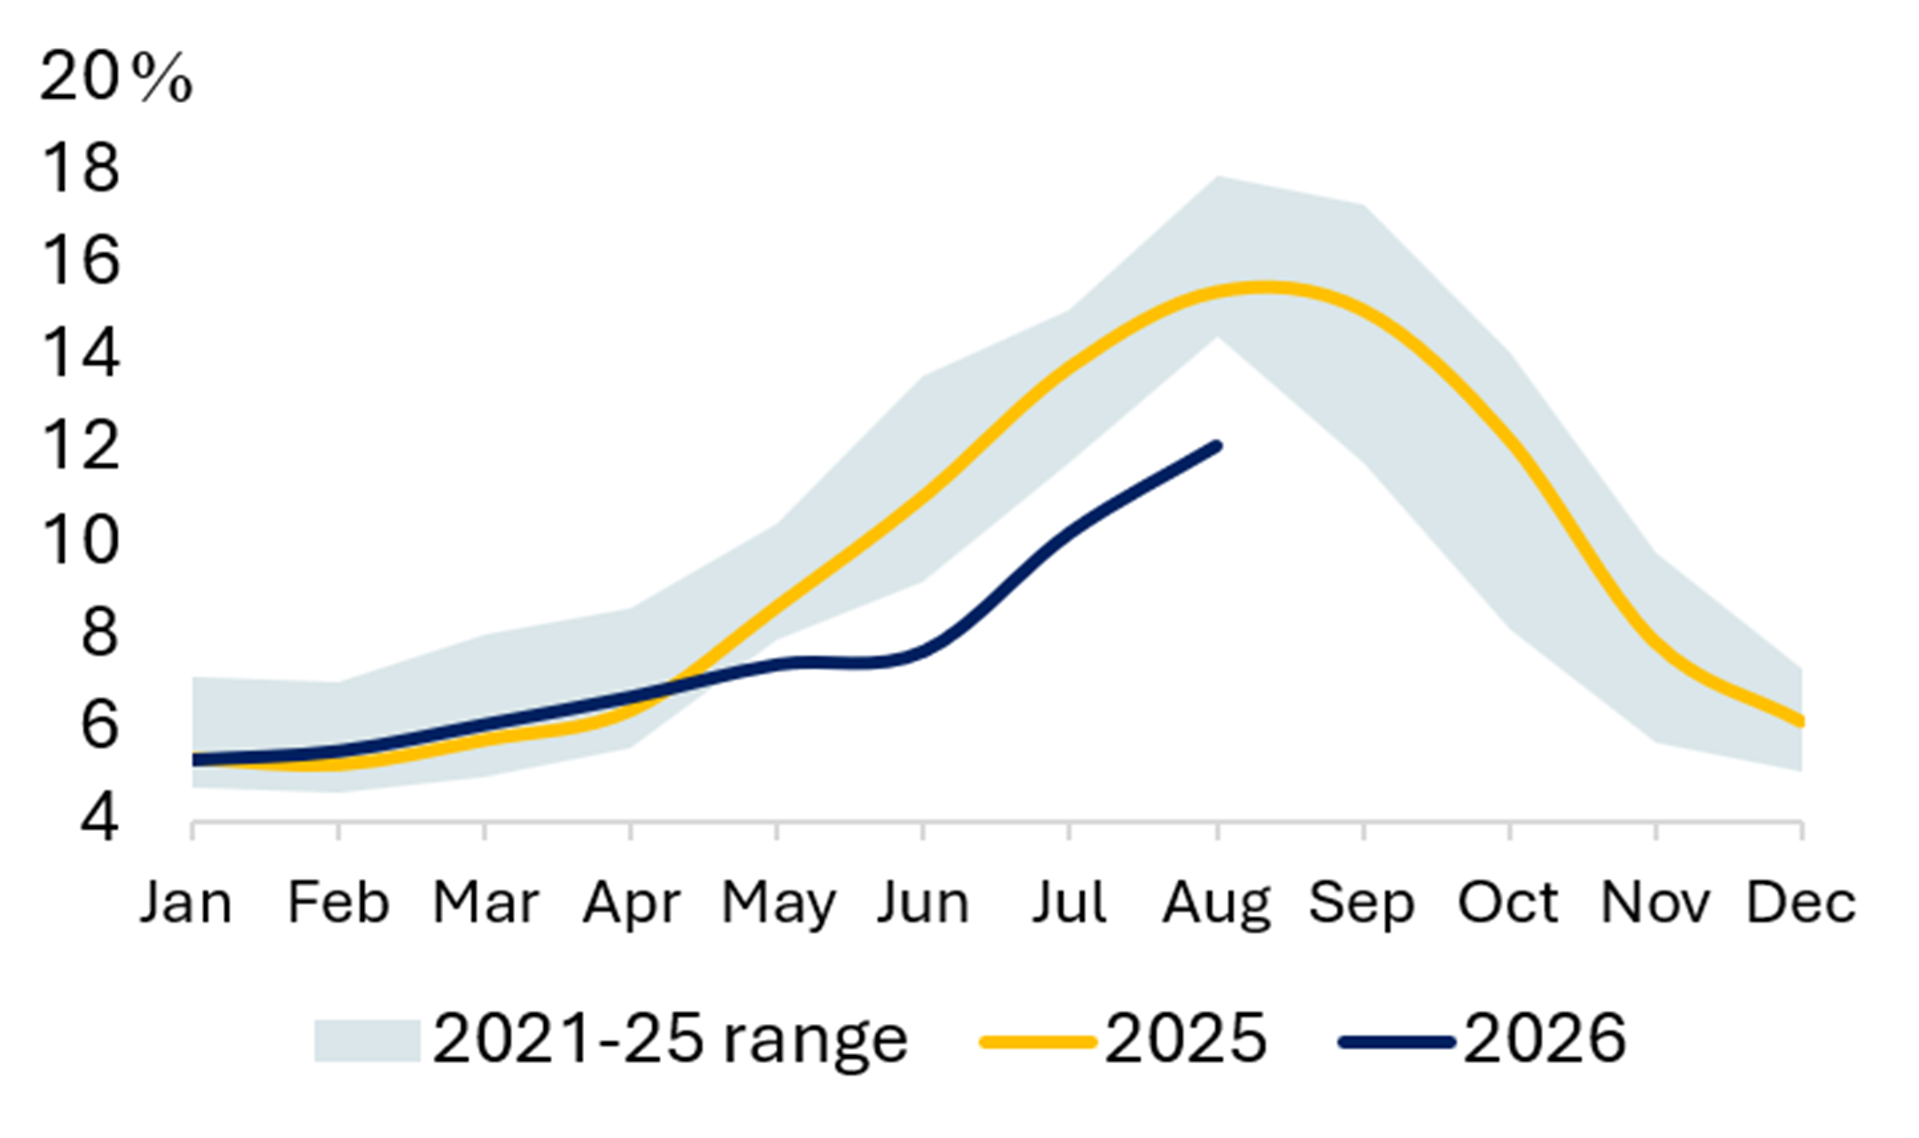
Source: Ember
CHINA
Exhibit 39 Power Generation Exhibit 40 Share of Coal (%) 

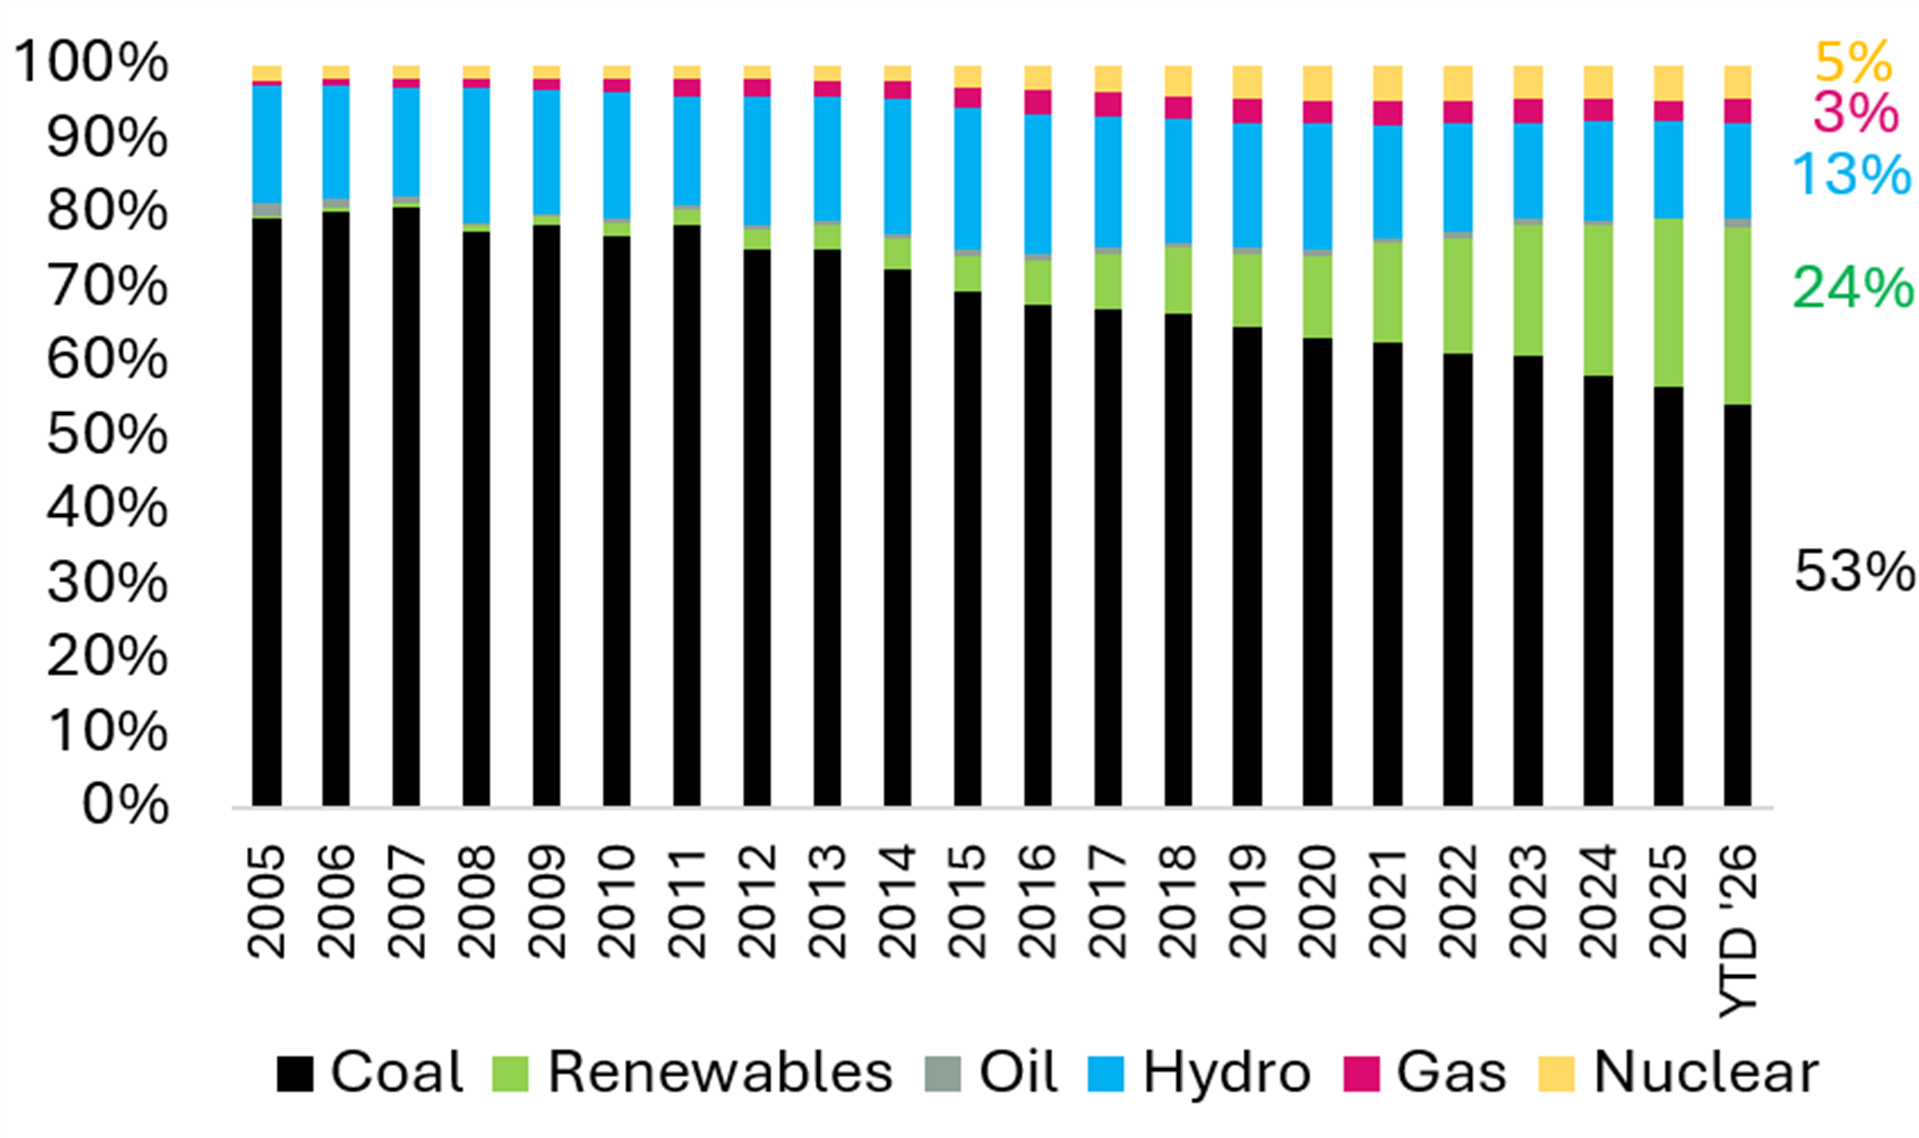
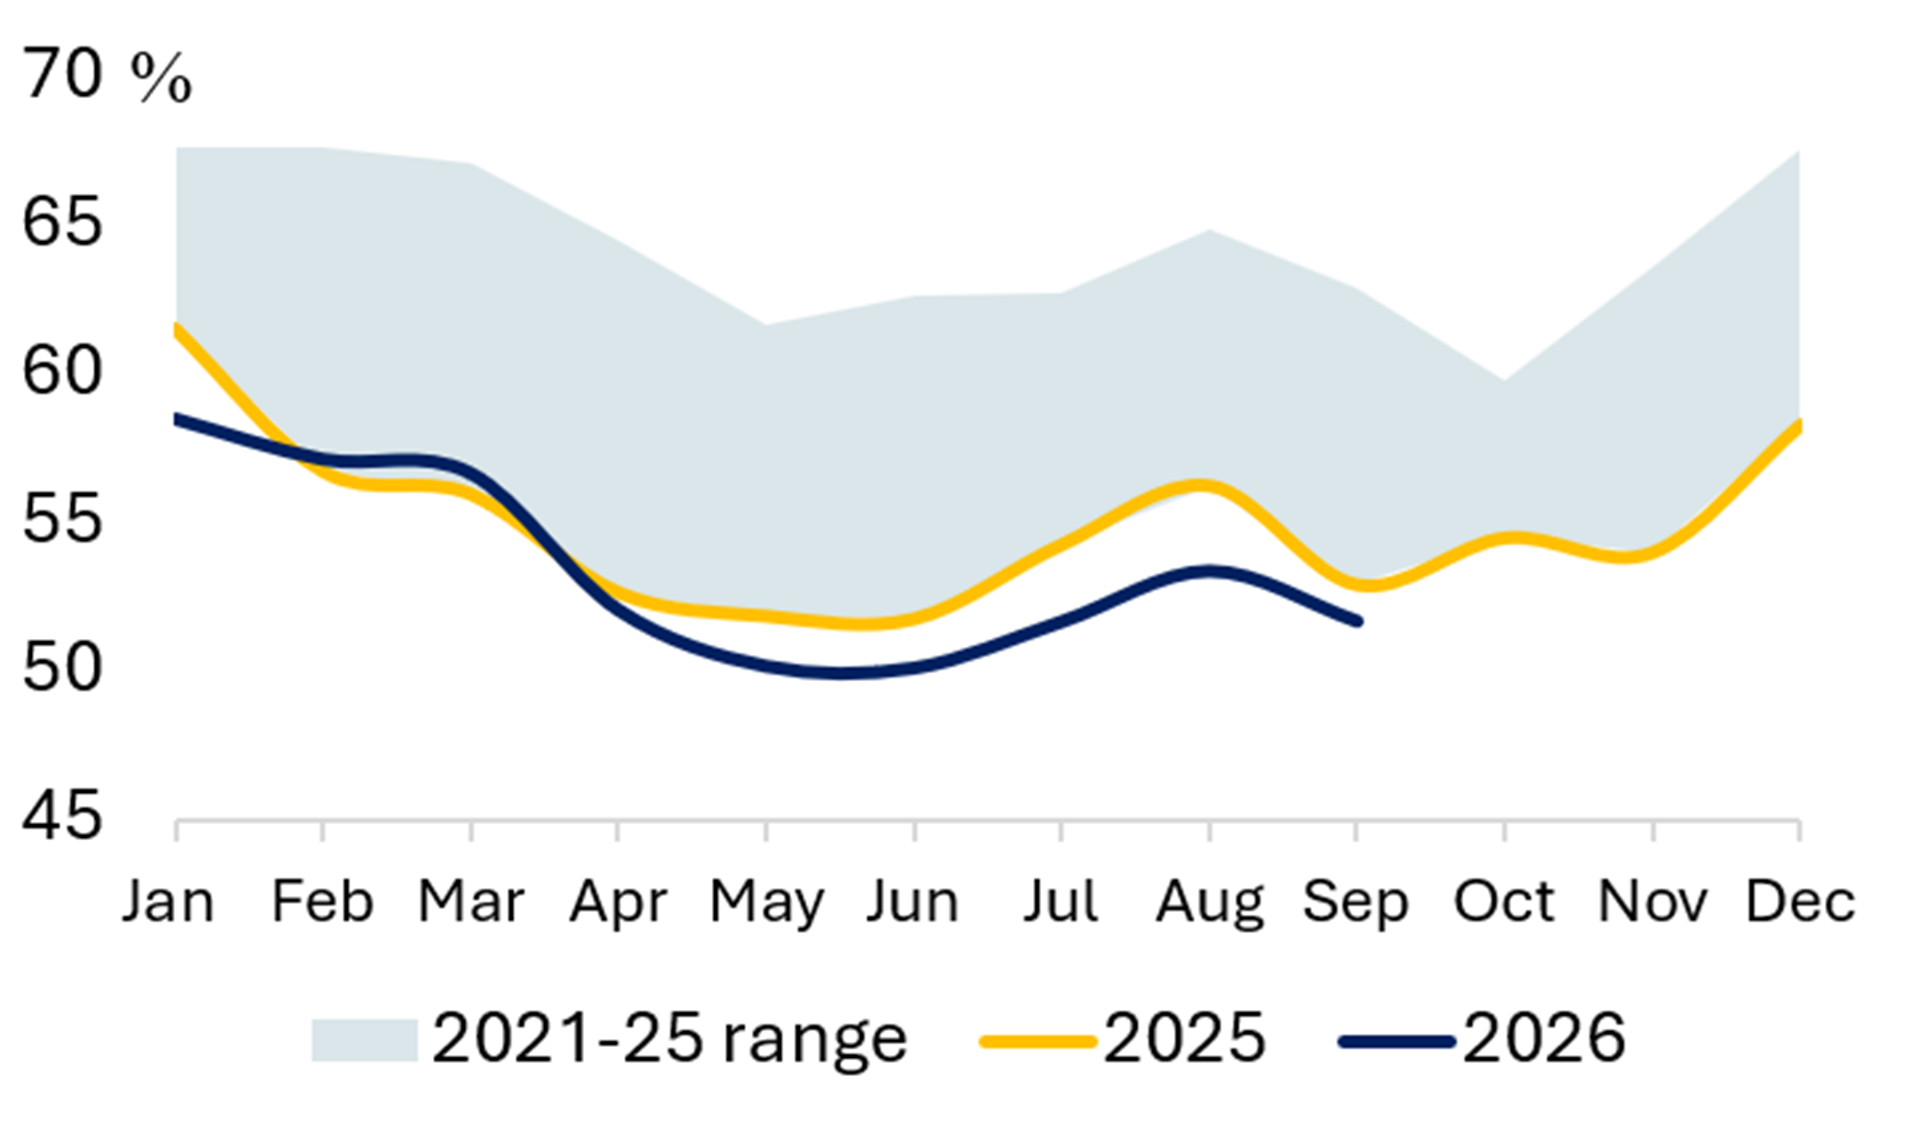
Exhibit 41 Share of Wind & Solar (%) Exhibit 42 Share of Hydro (%) 
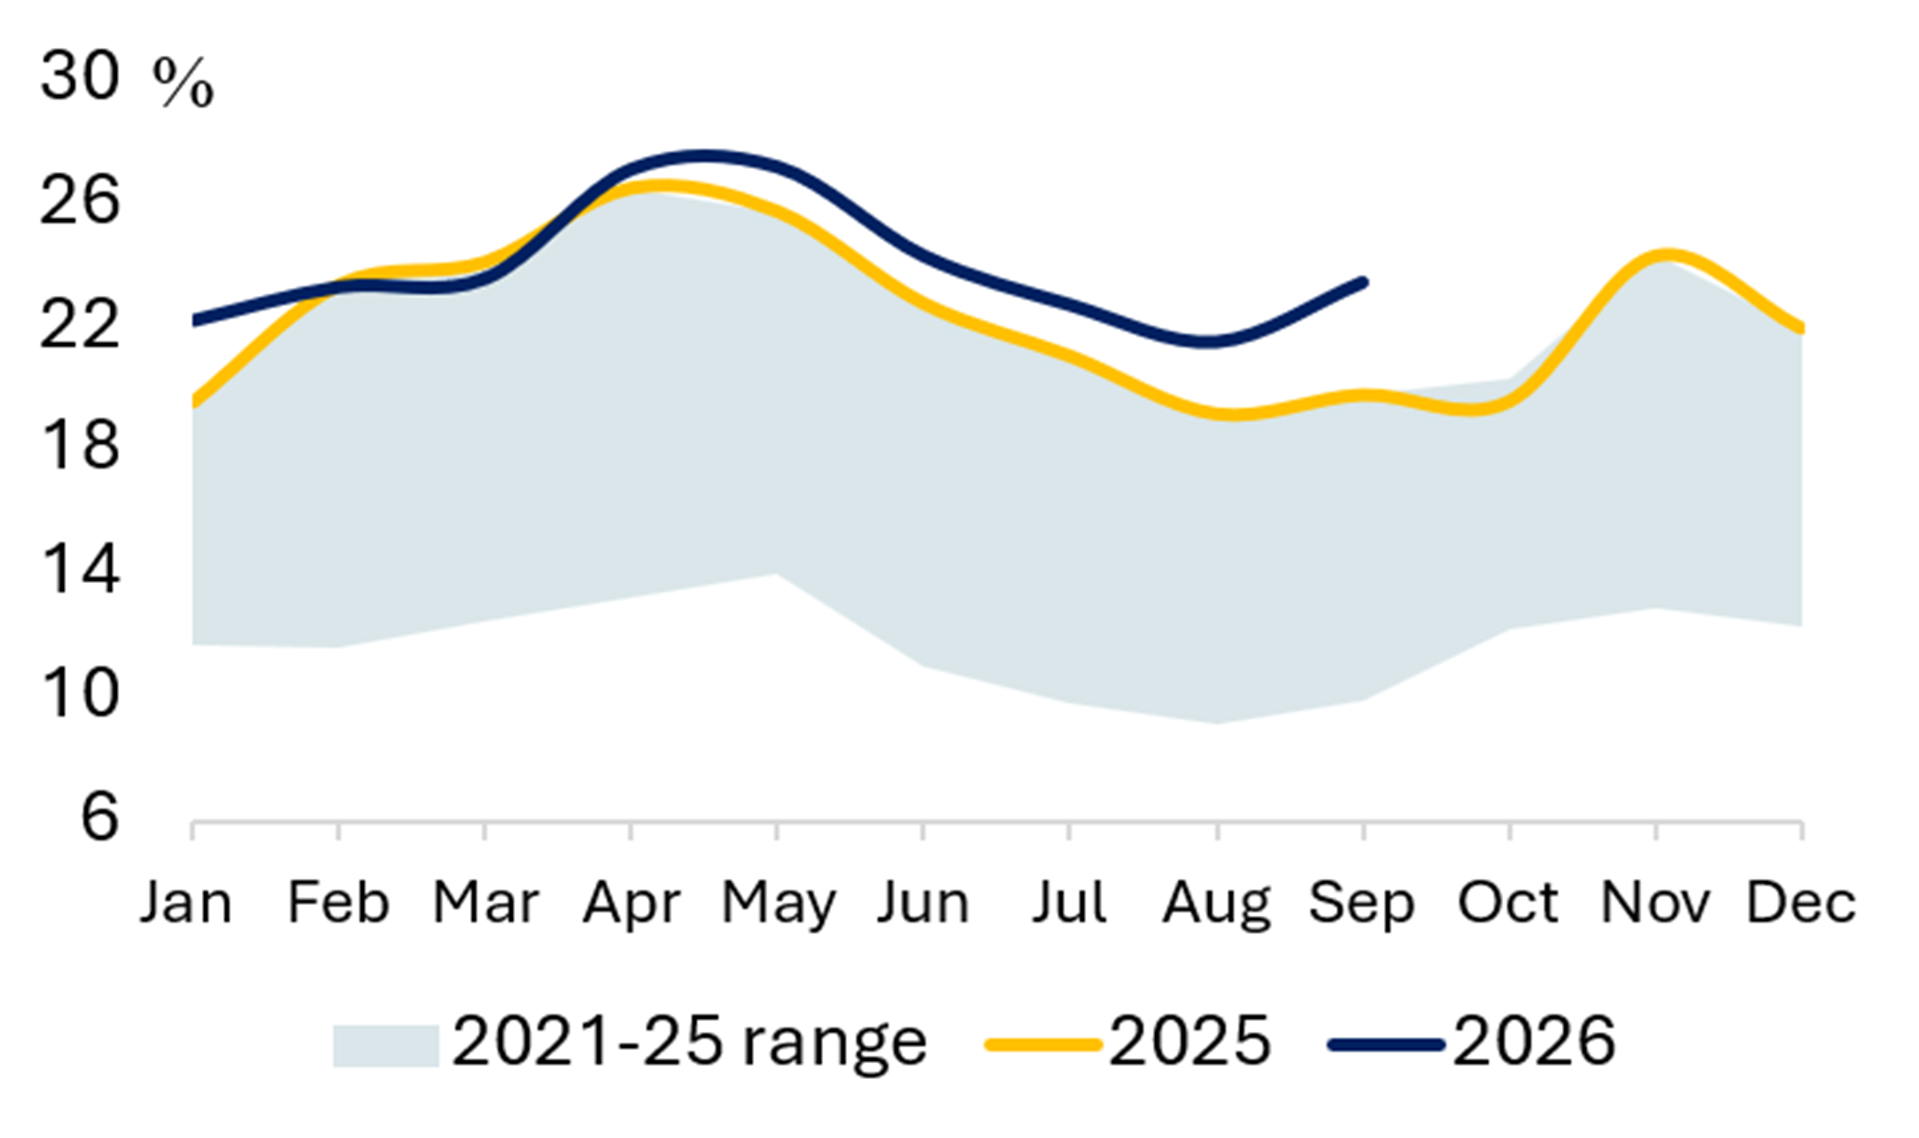
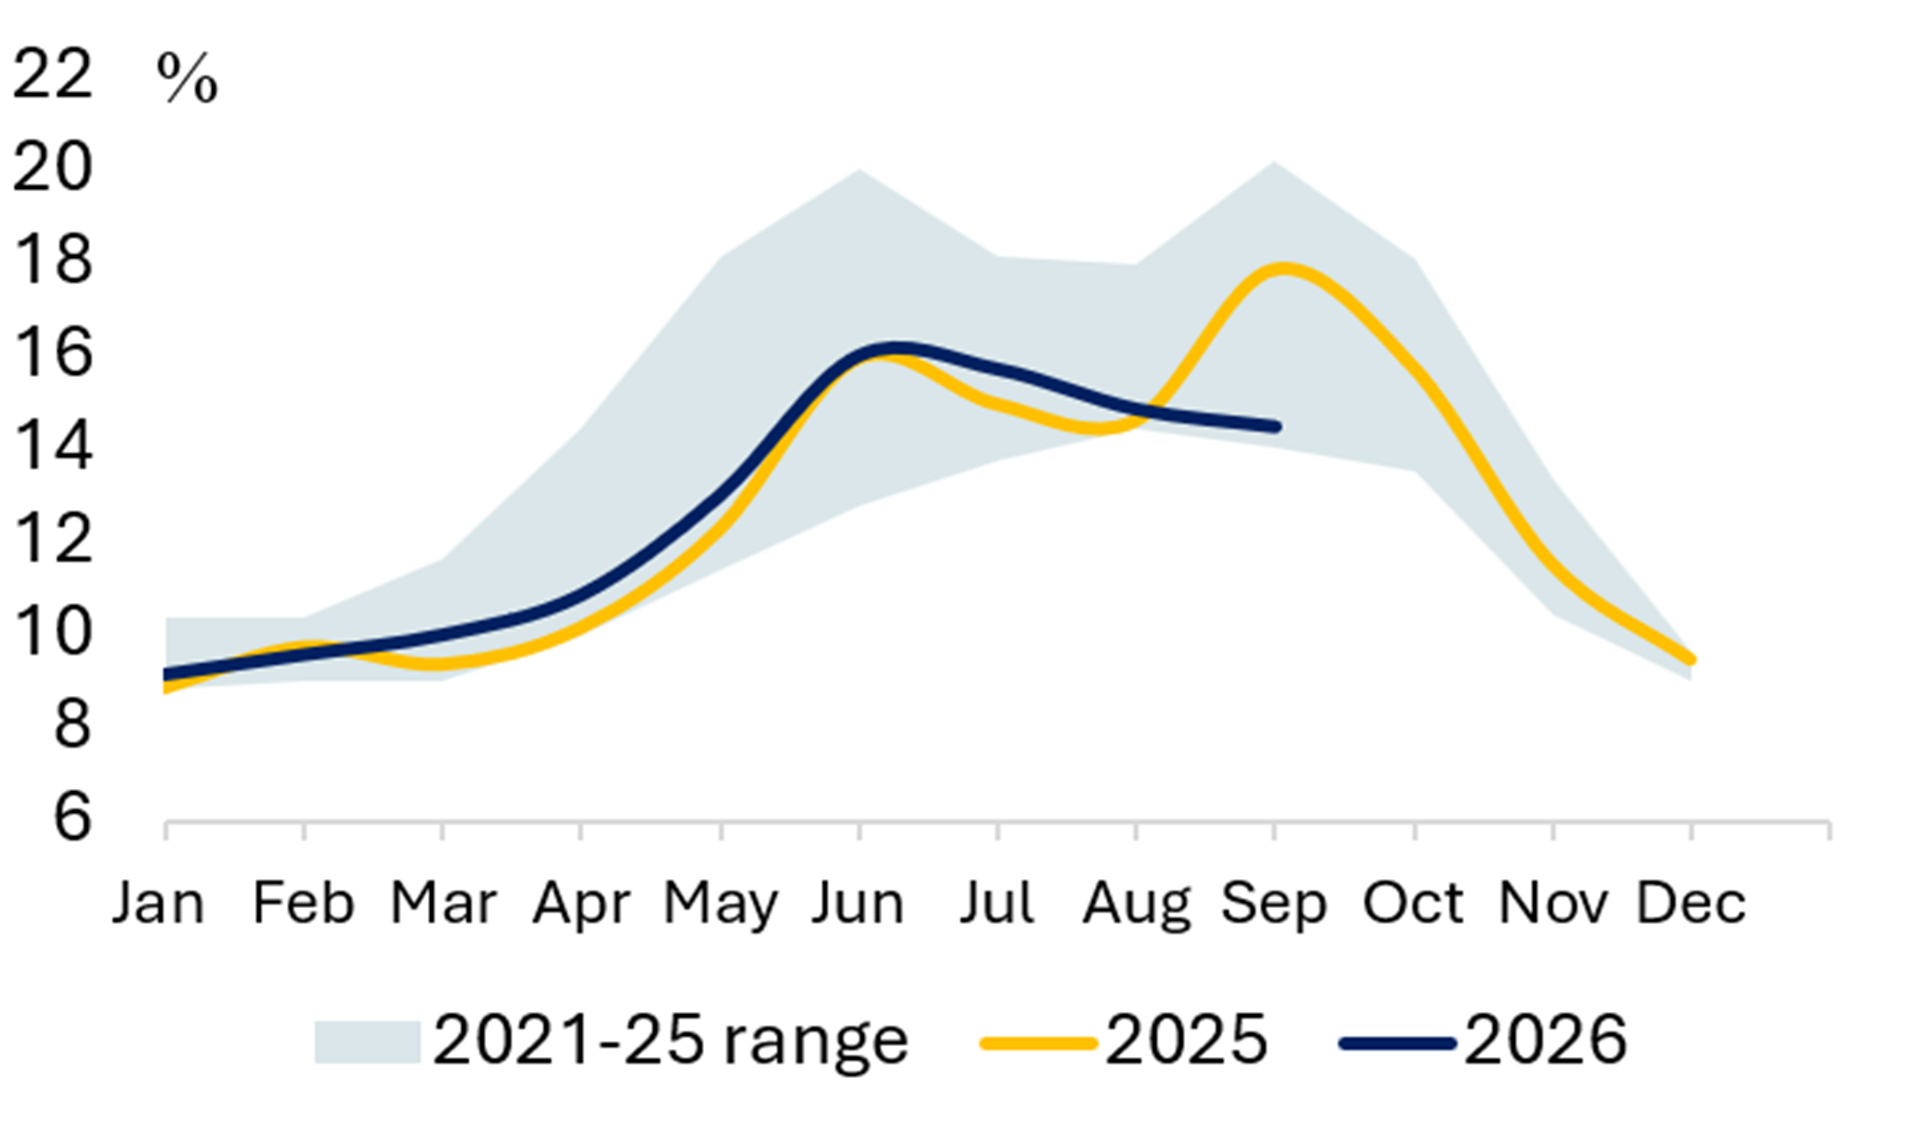

JAPAN
Exhibit 43 Power Generation Exhibit 44 Share of Gas (%) 
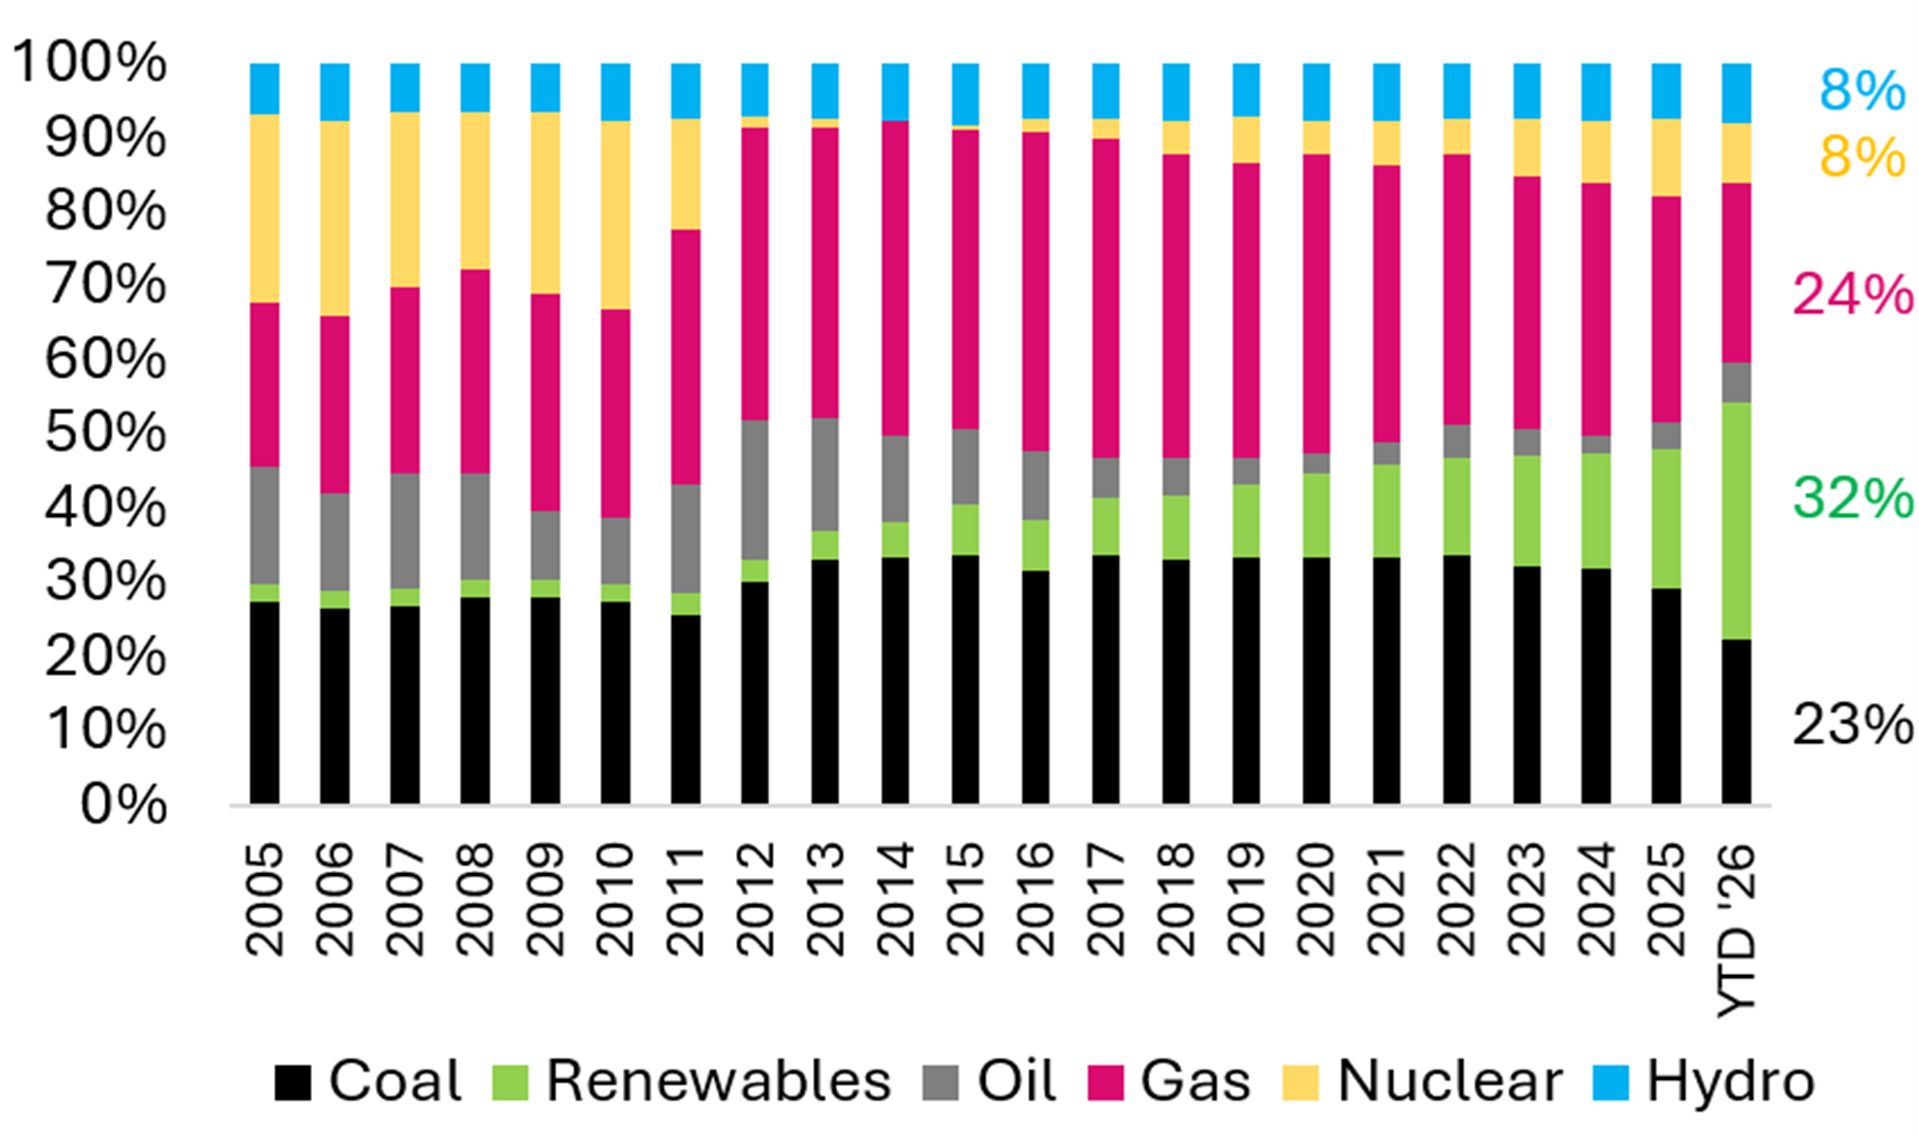
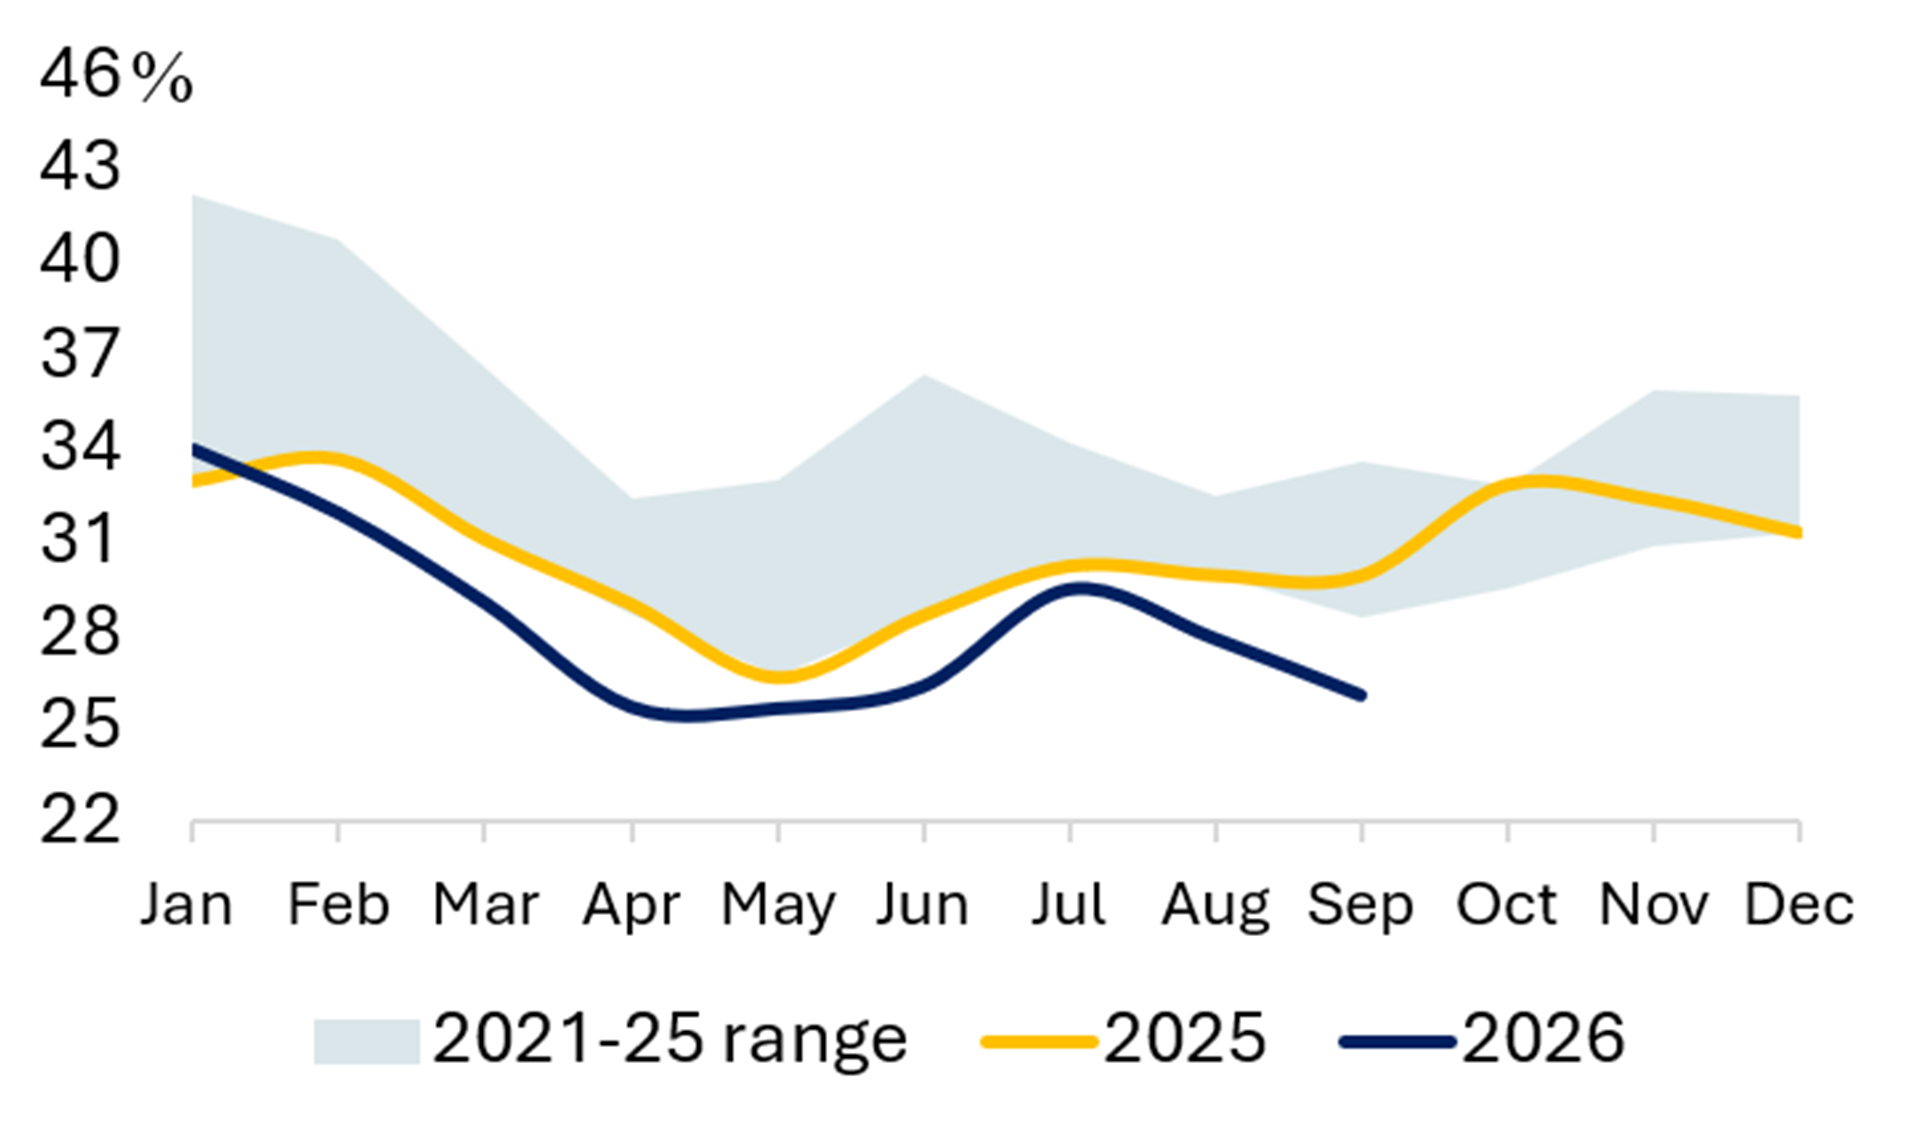

Exhibit 45 Share of Coal (%) Exhibit 46 Share of Wind & Solar (%)
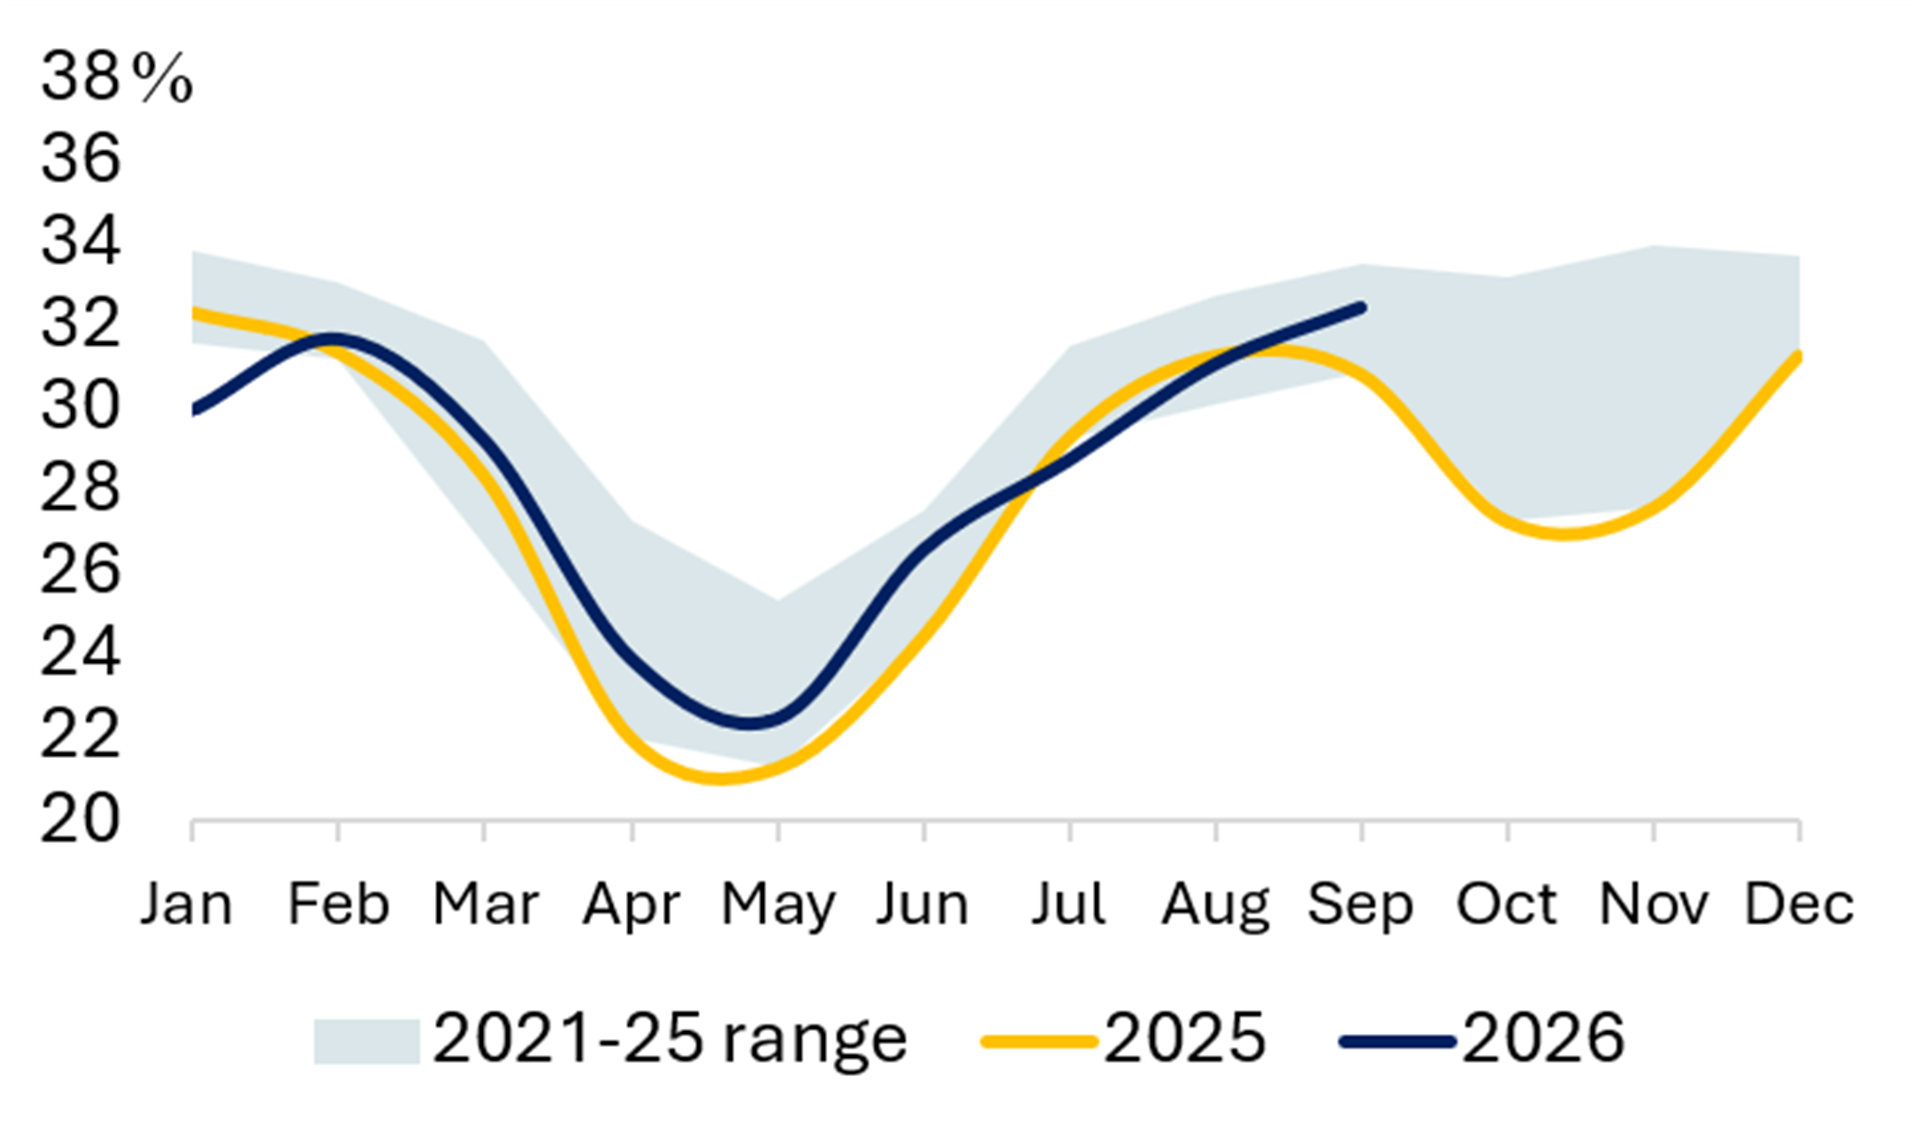
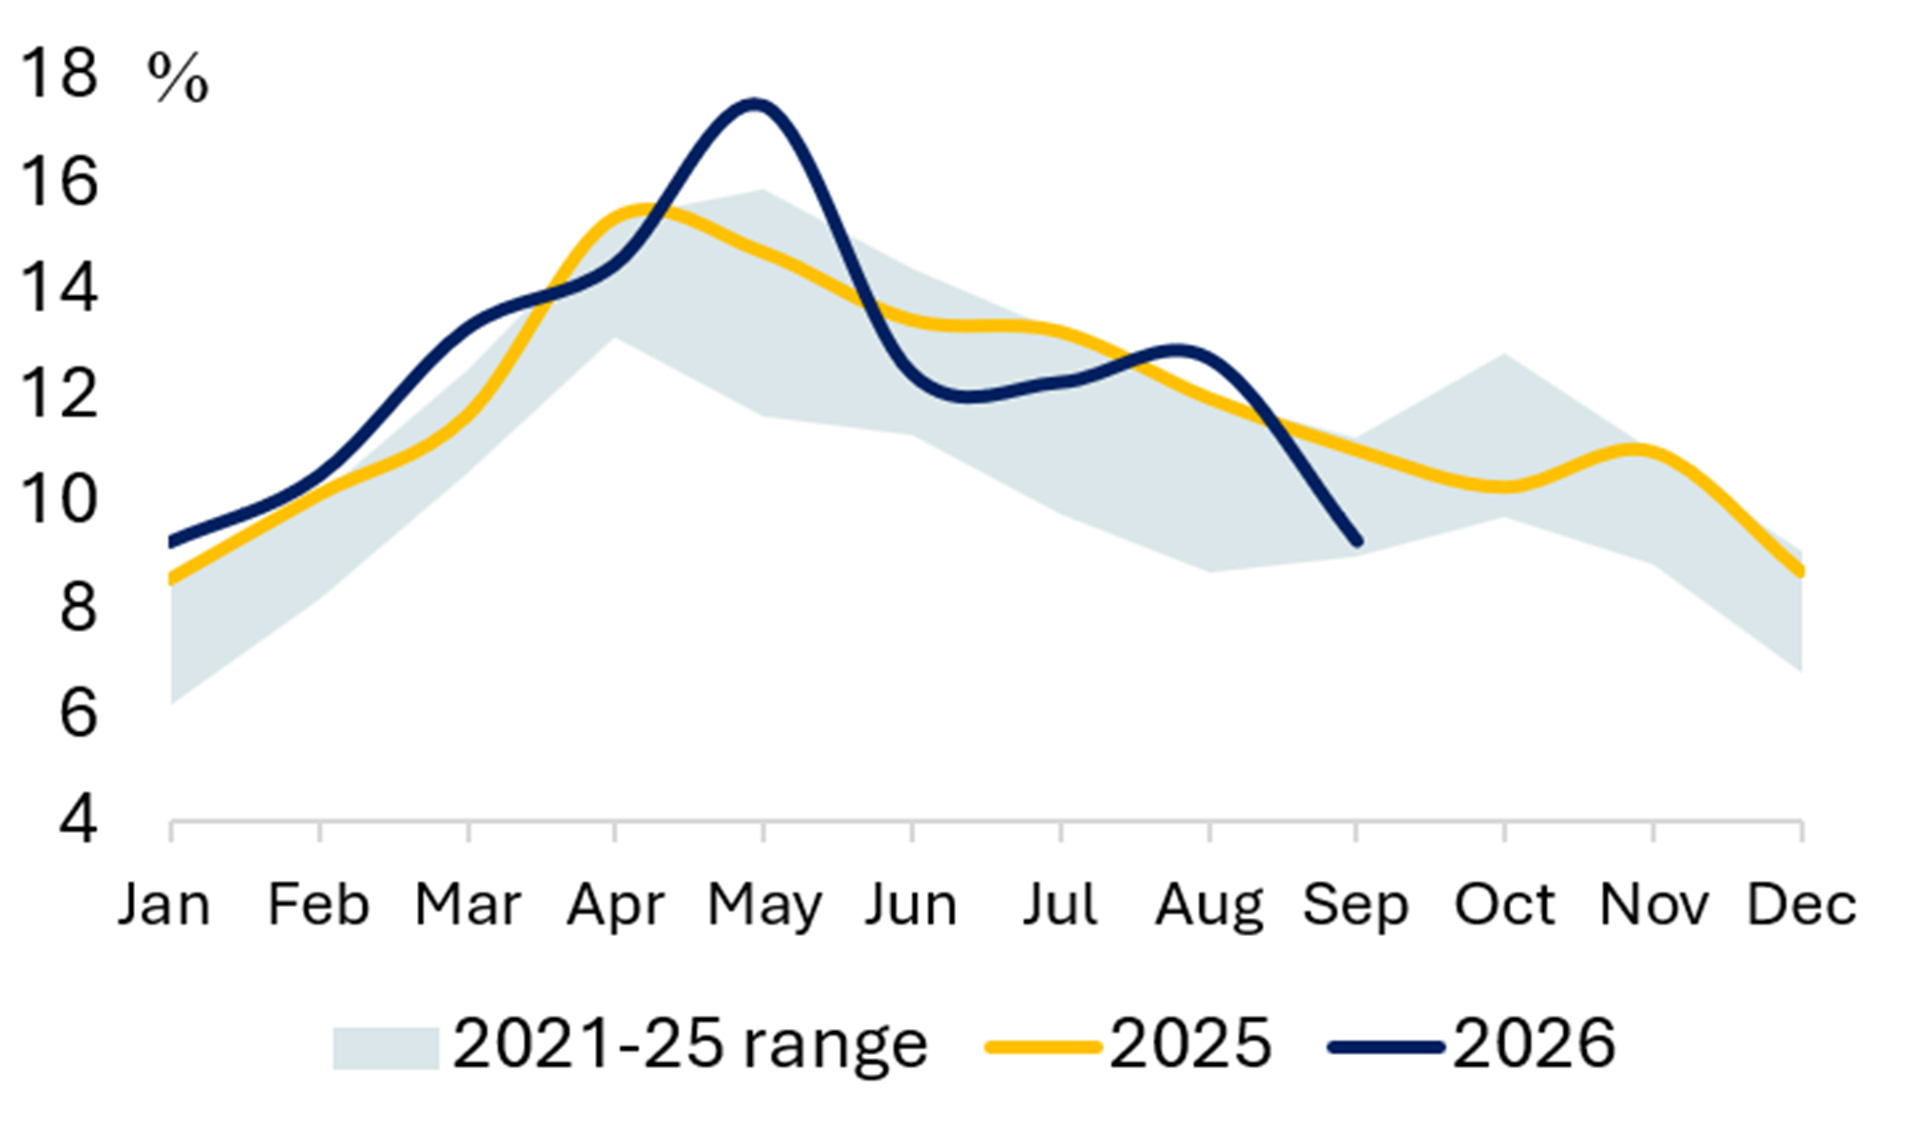

 Source: Ember
MIDDLE EAST – Energy Mix in Six Gulf Cooperation Council (GCC) Countries
Exhibit 47 Power Demand per Capita
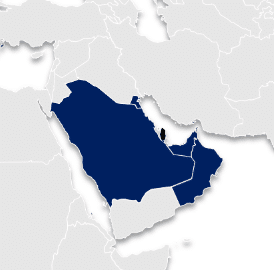
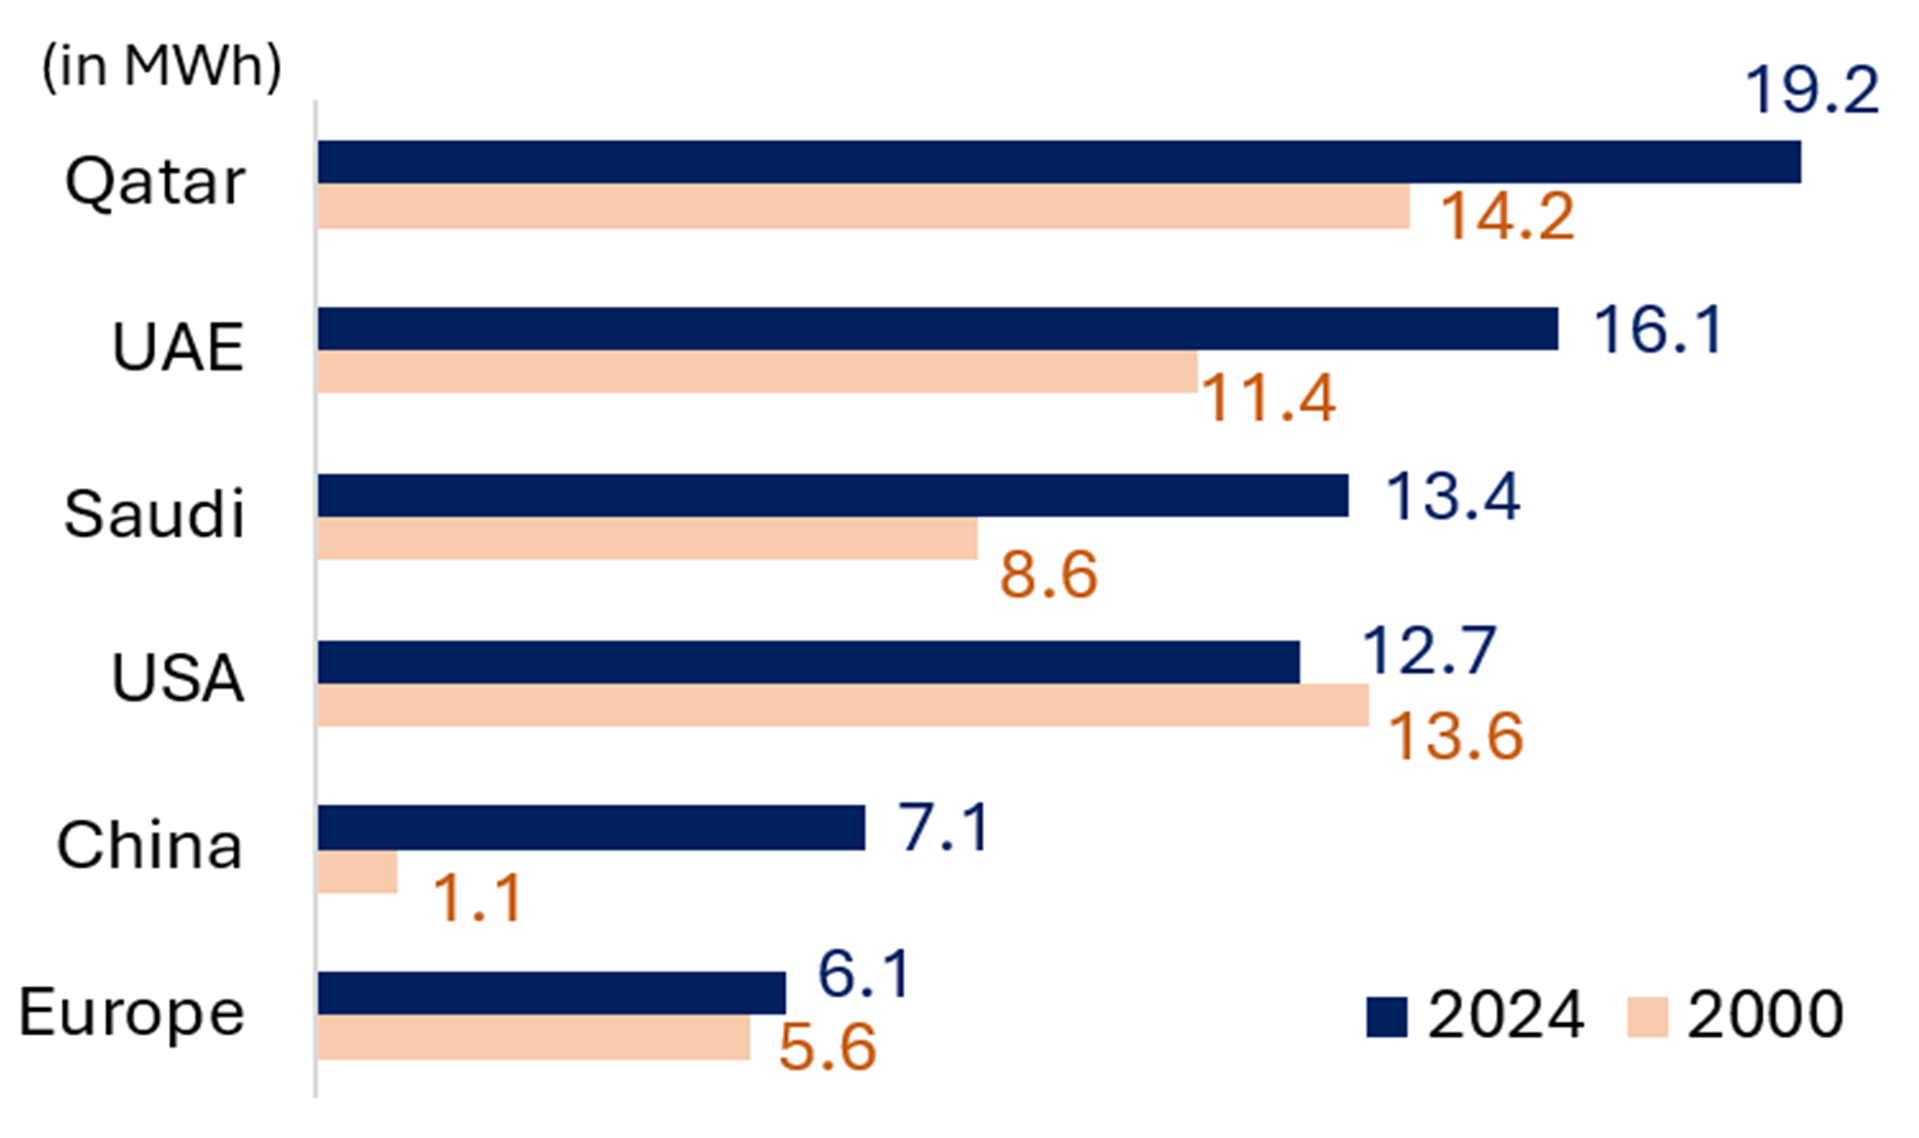

Exhibit 48 Saudi Arabia Power Gen (TWh) Exhibit 49 UAE Power Gen (TWh) 

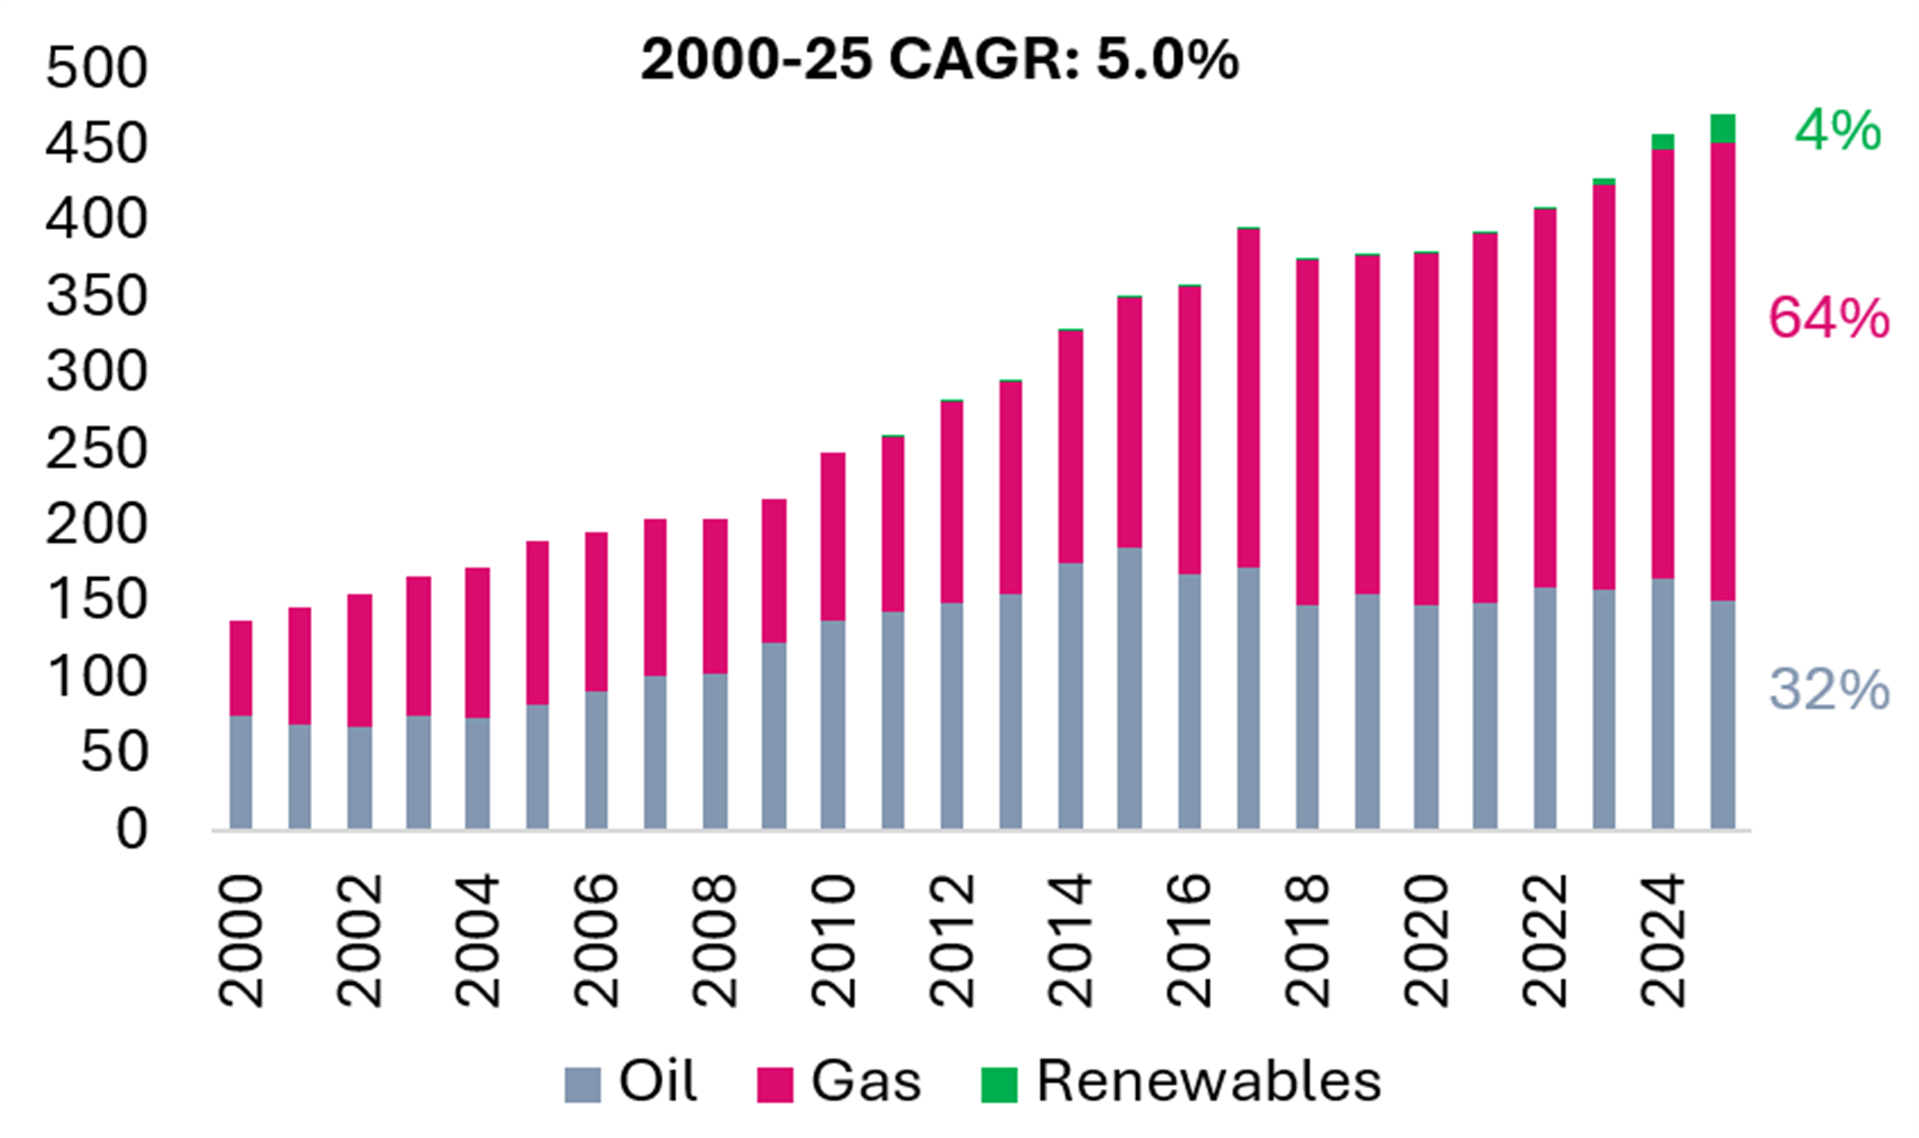
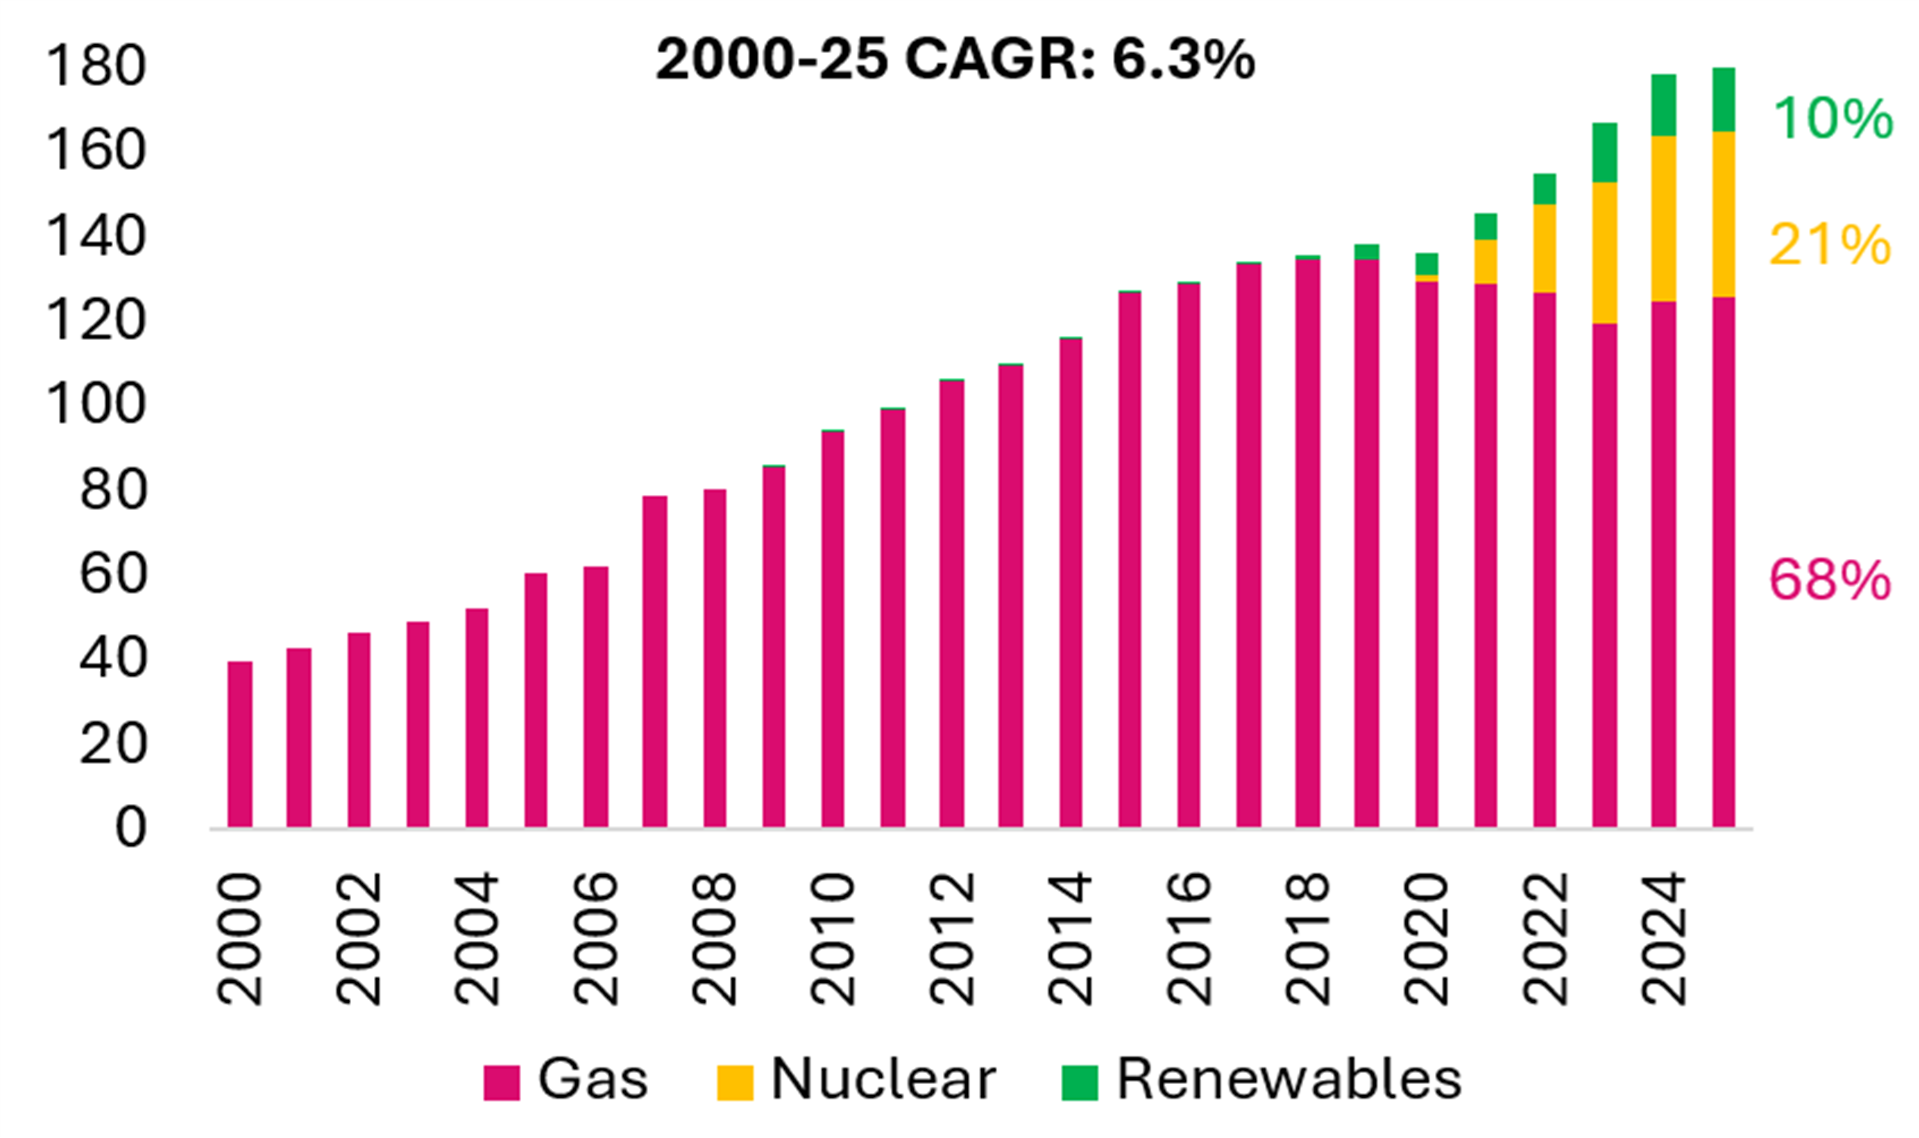
Exhibit 50 Qatar Power Gen (TWh) Exhibit 51 Kuwait Power Gen (TWh) 

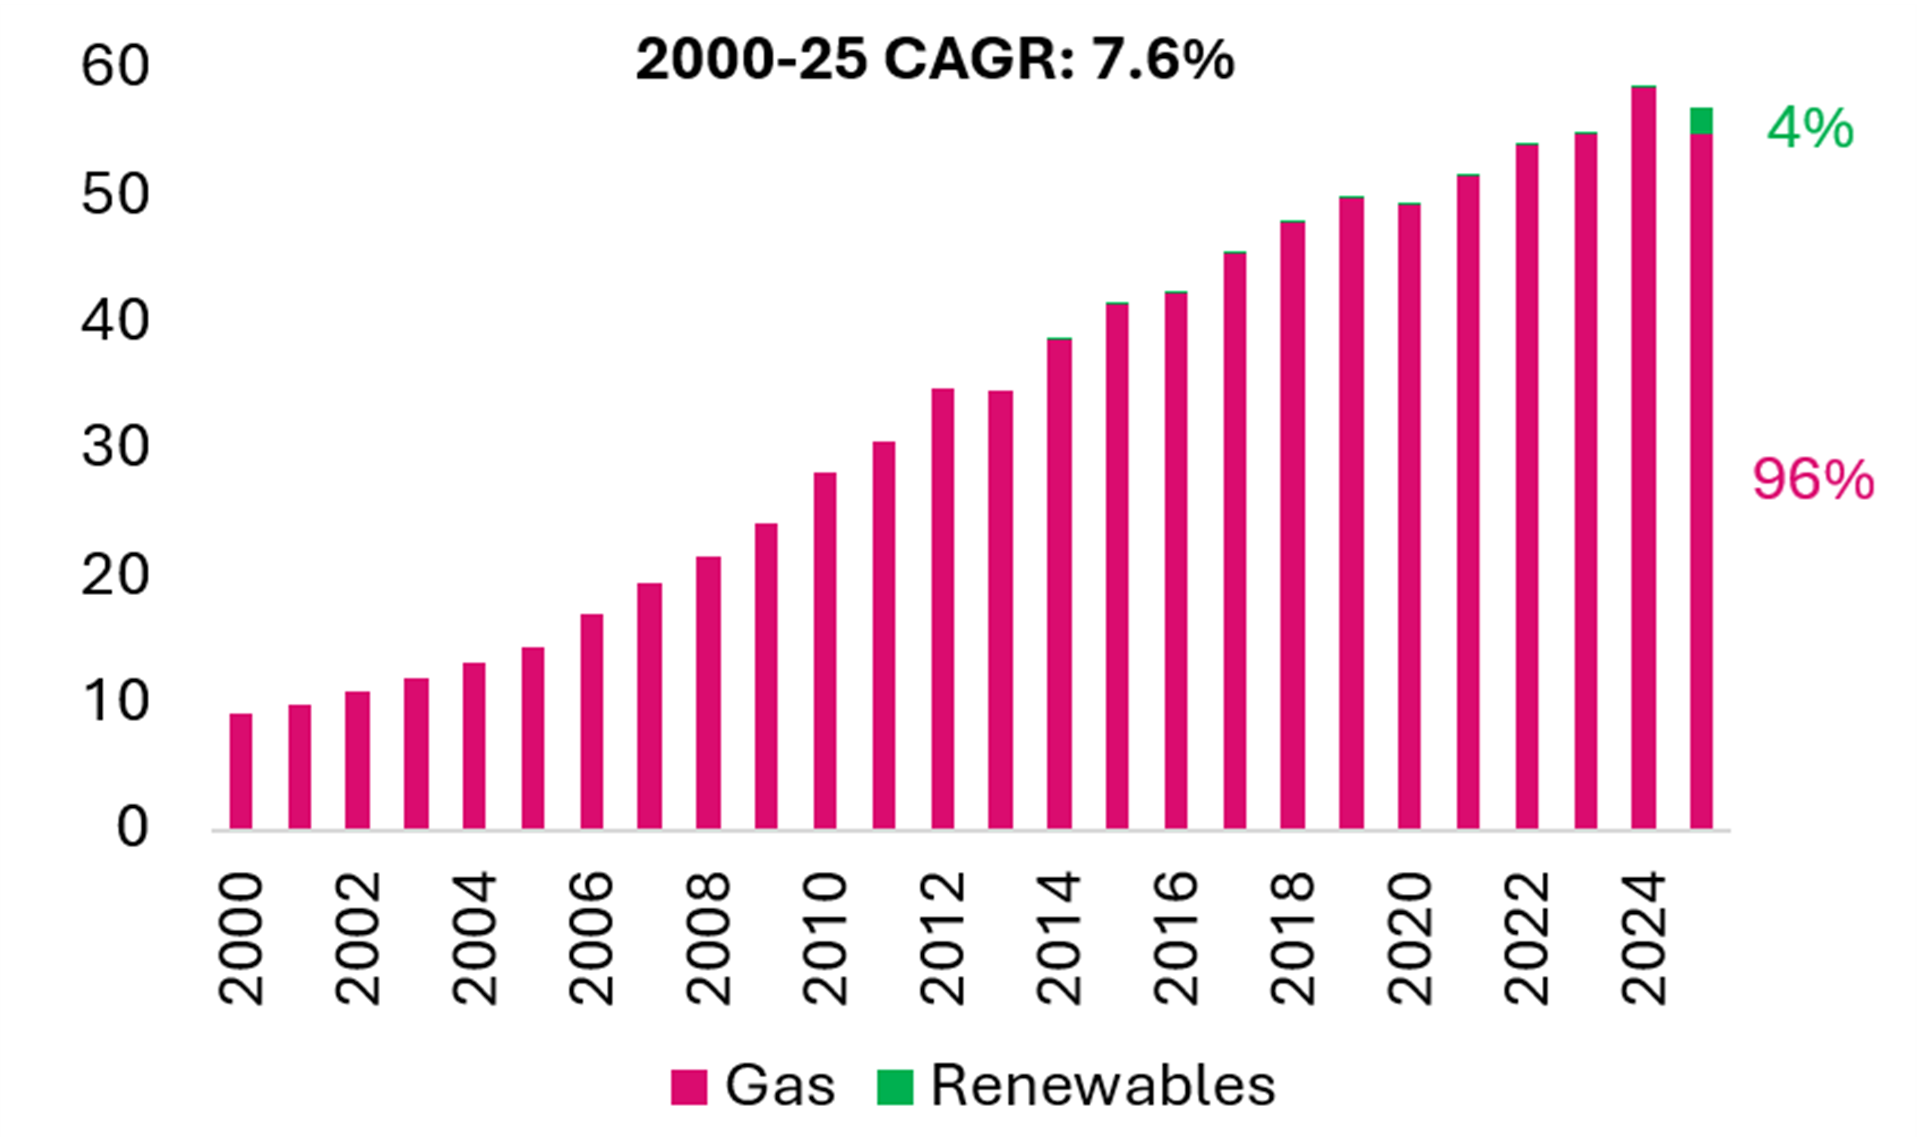
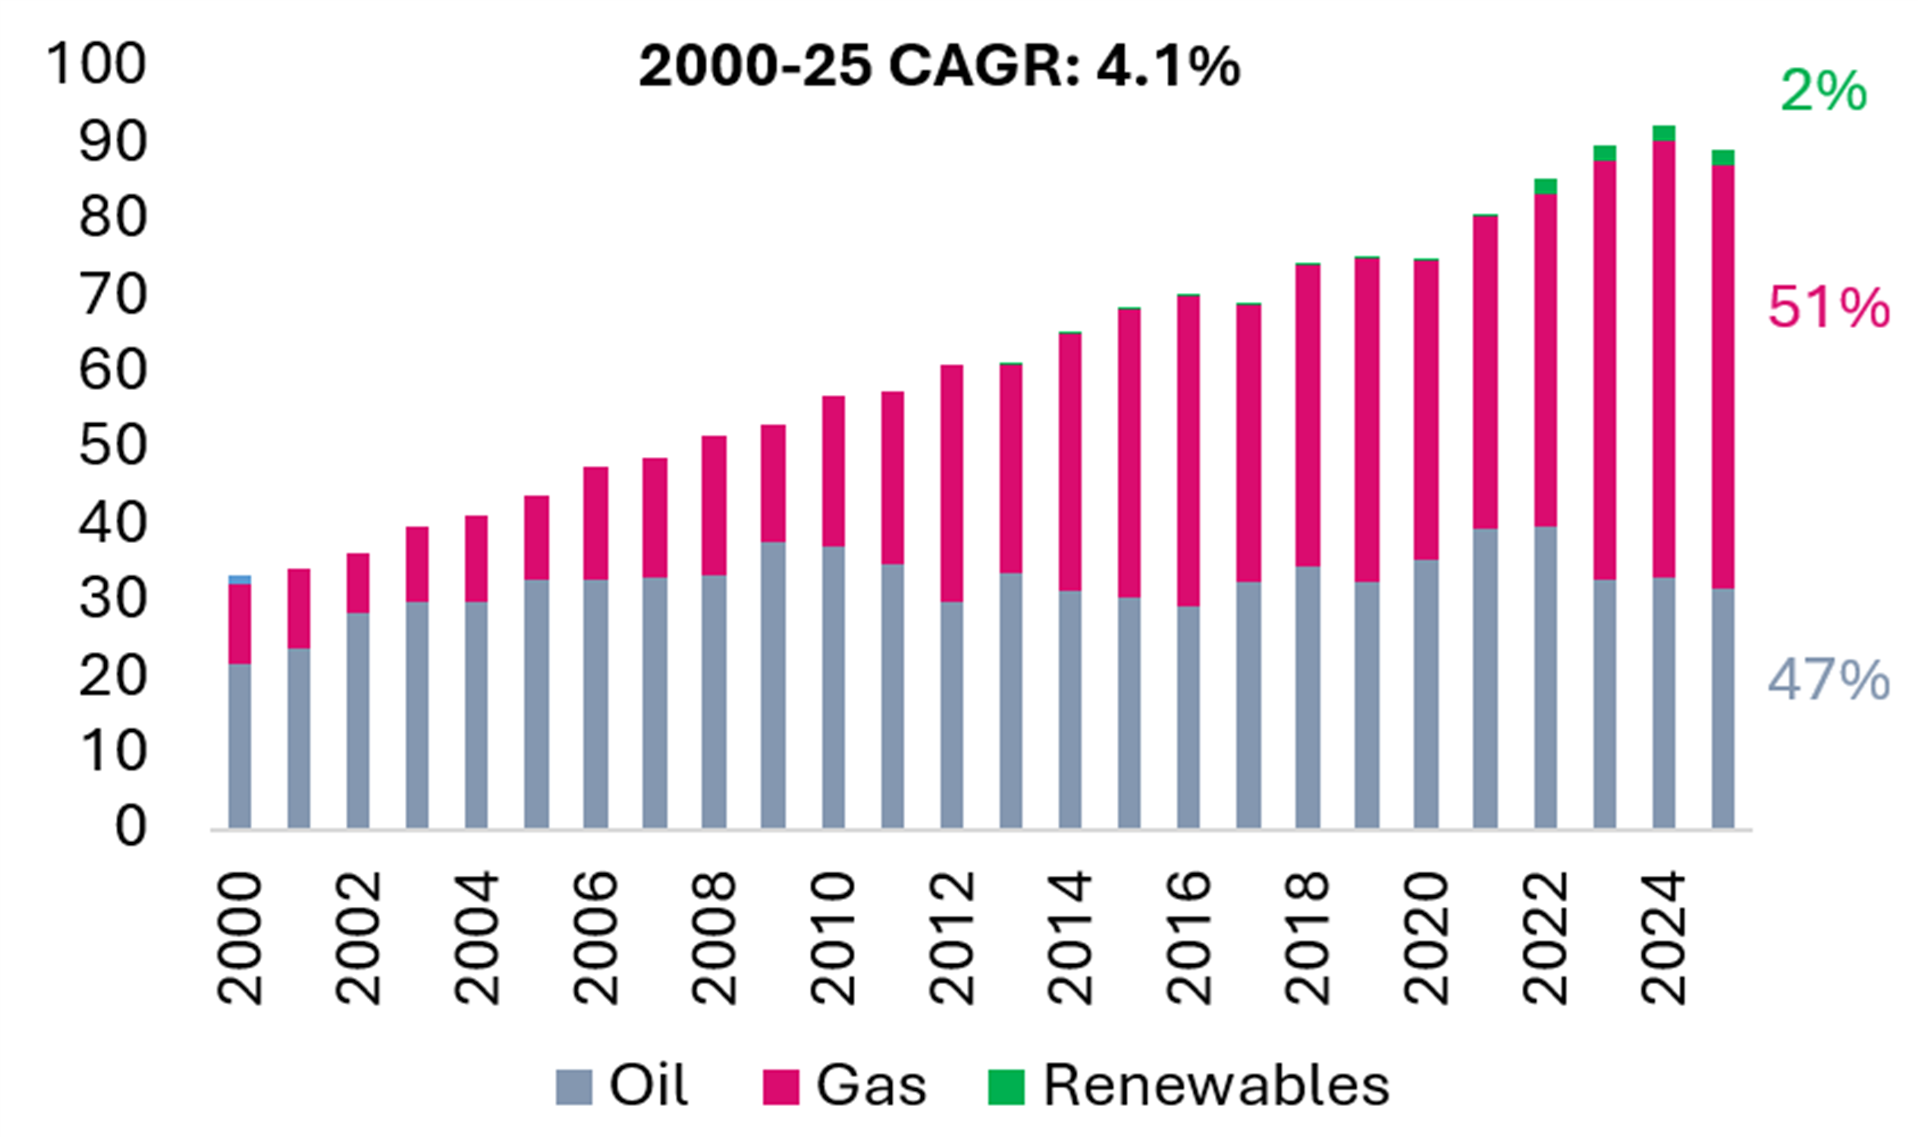
Exhibit 52 Oman Power Gen (TWh) Exhibit 53 Bahrain Power Gen (TWh) 

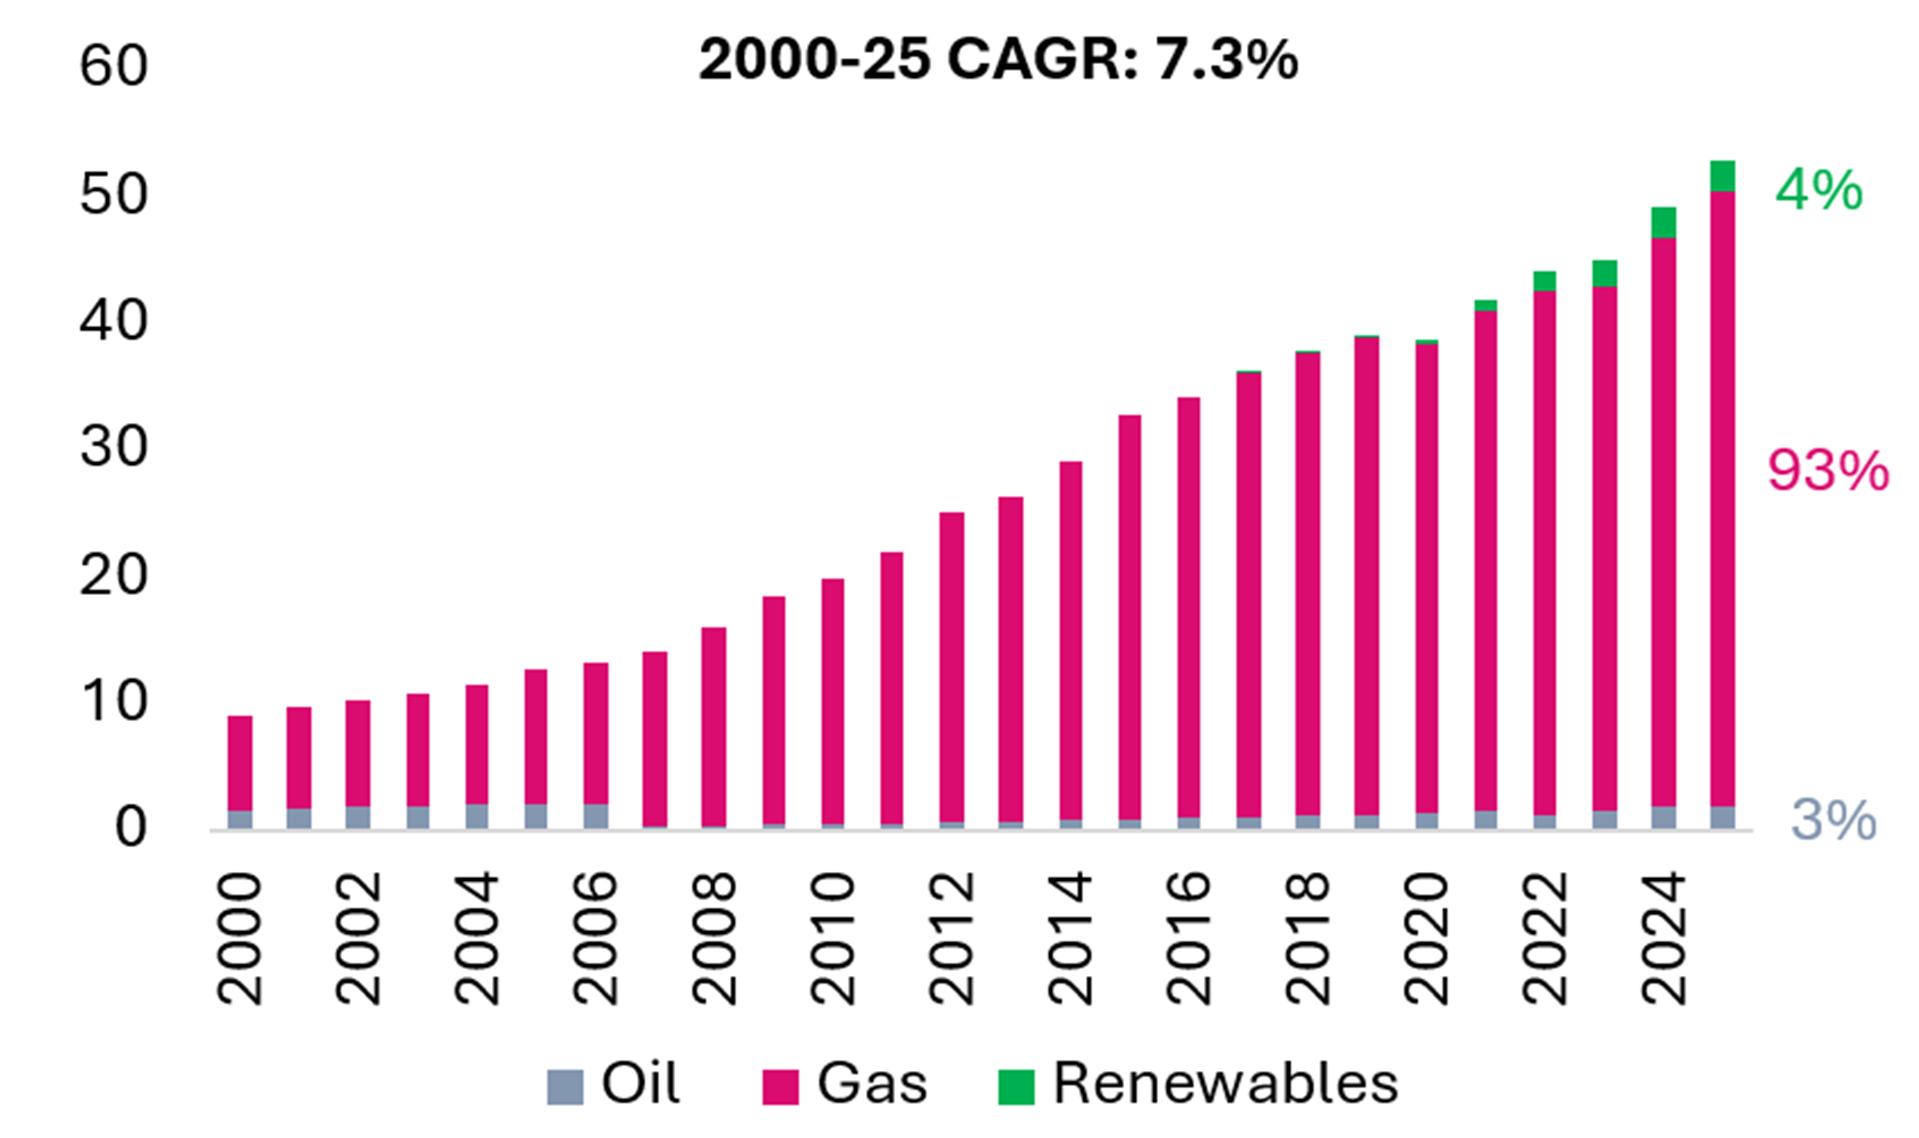
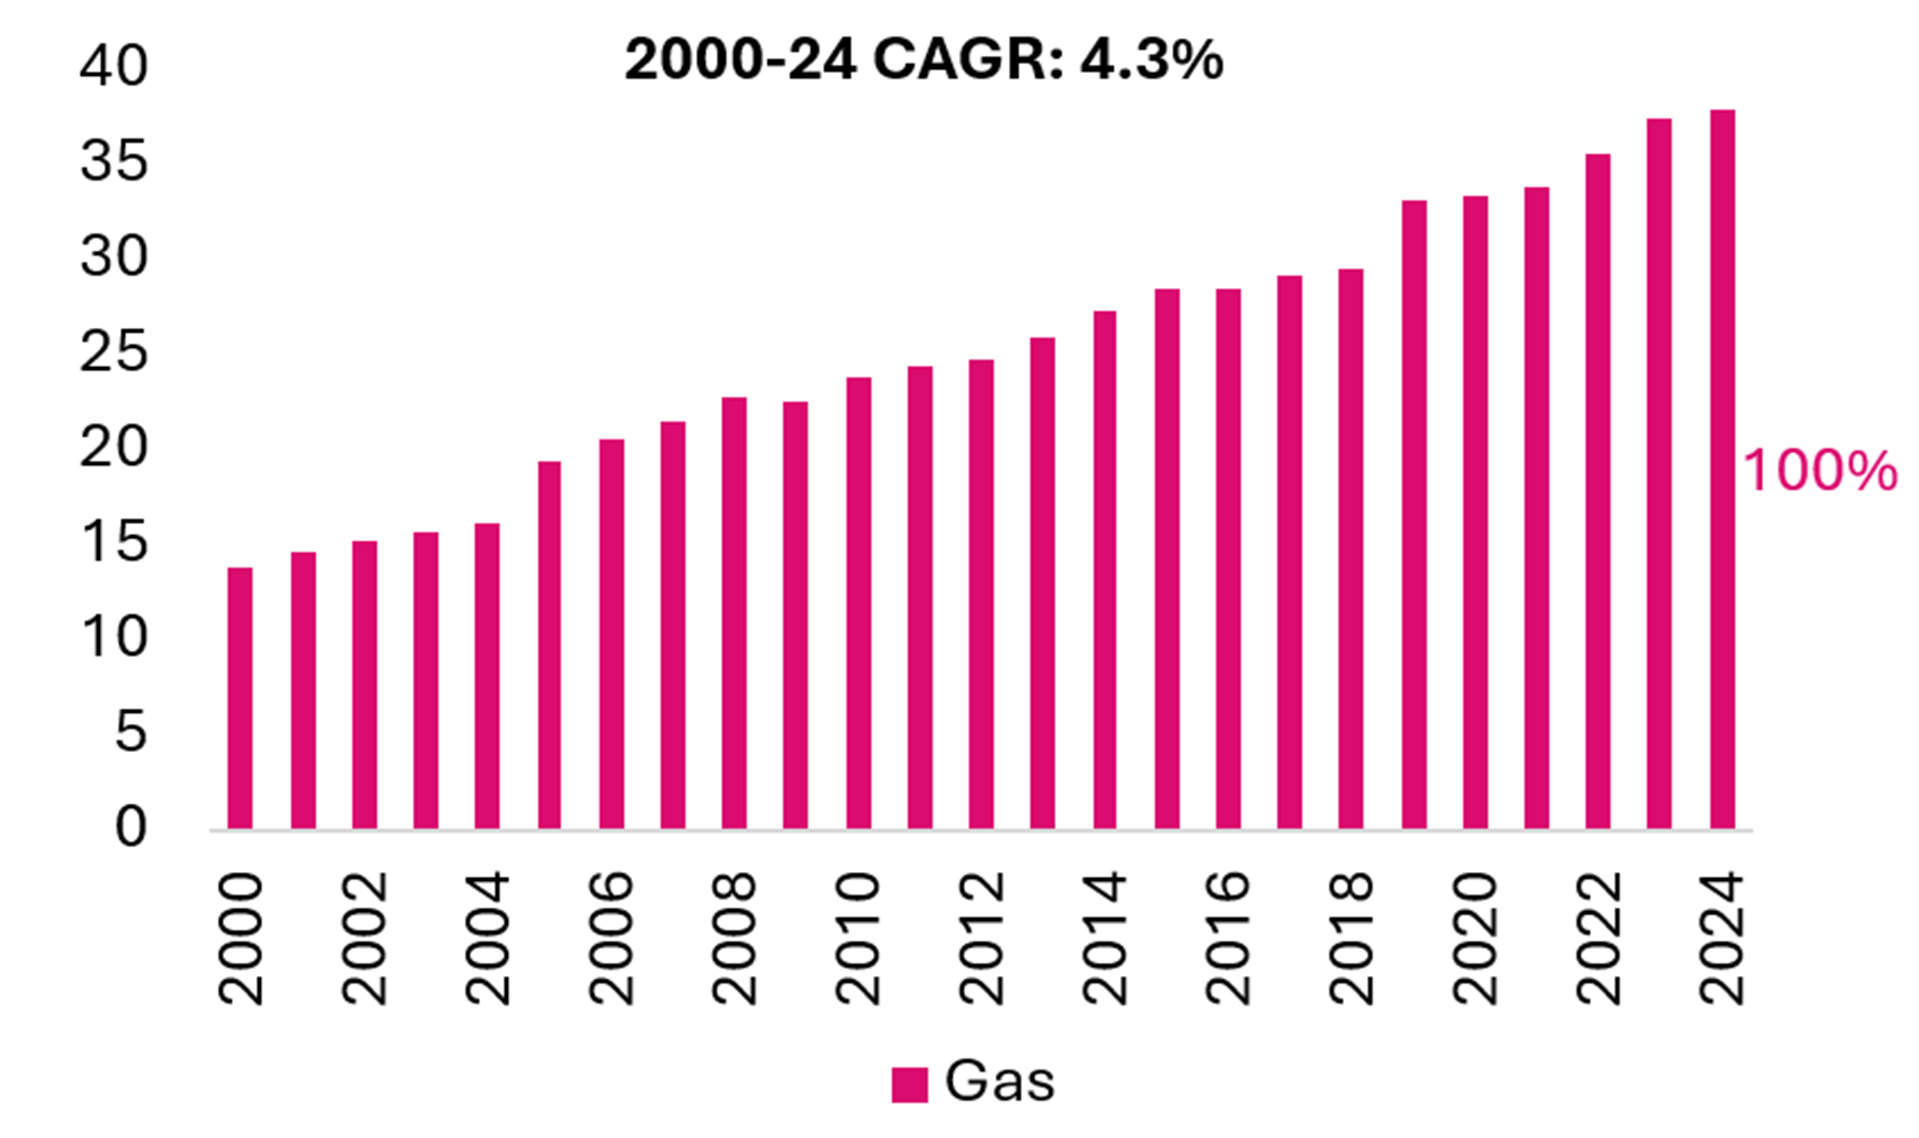
Source: Ember
Table 5 Non-US Utilities – Performance & Comparative Valuation

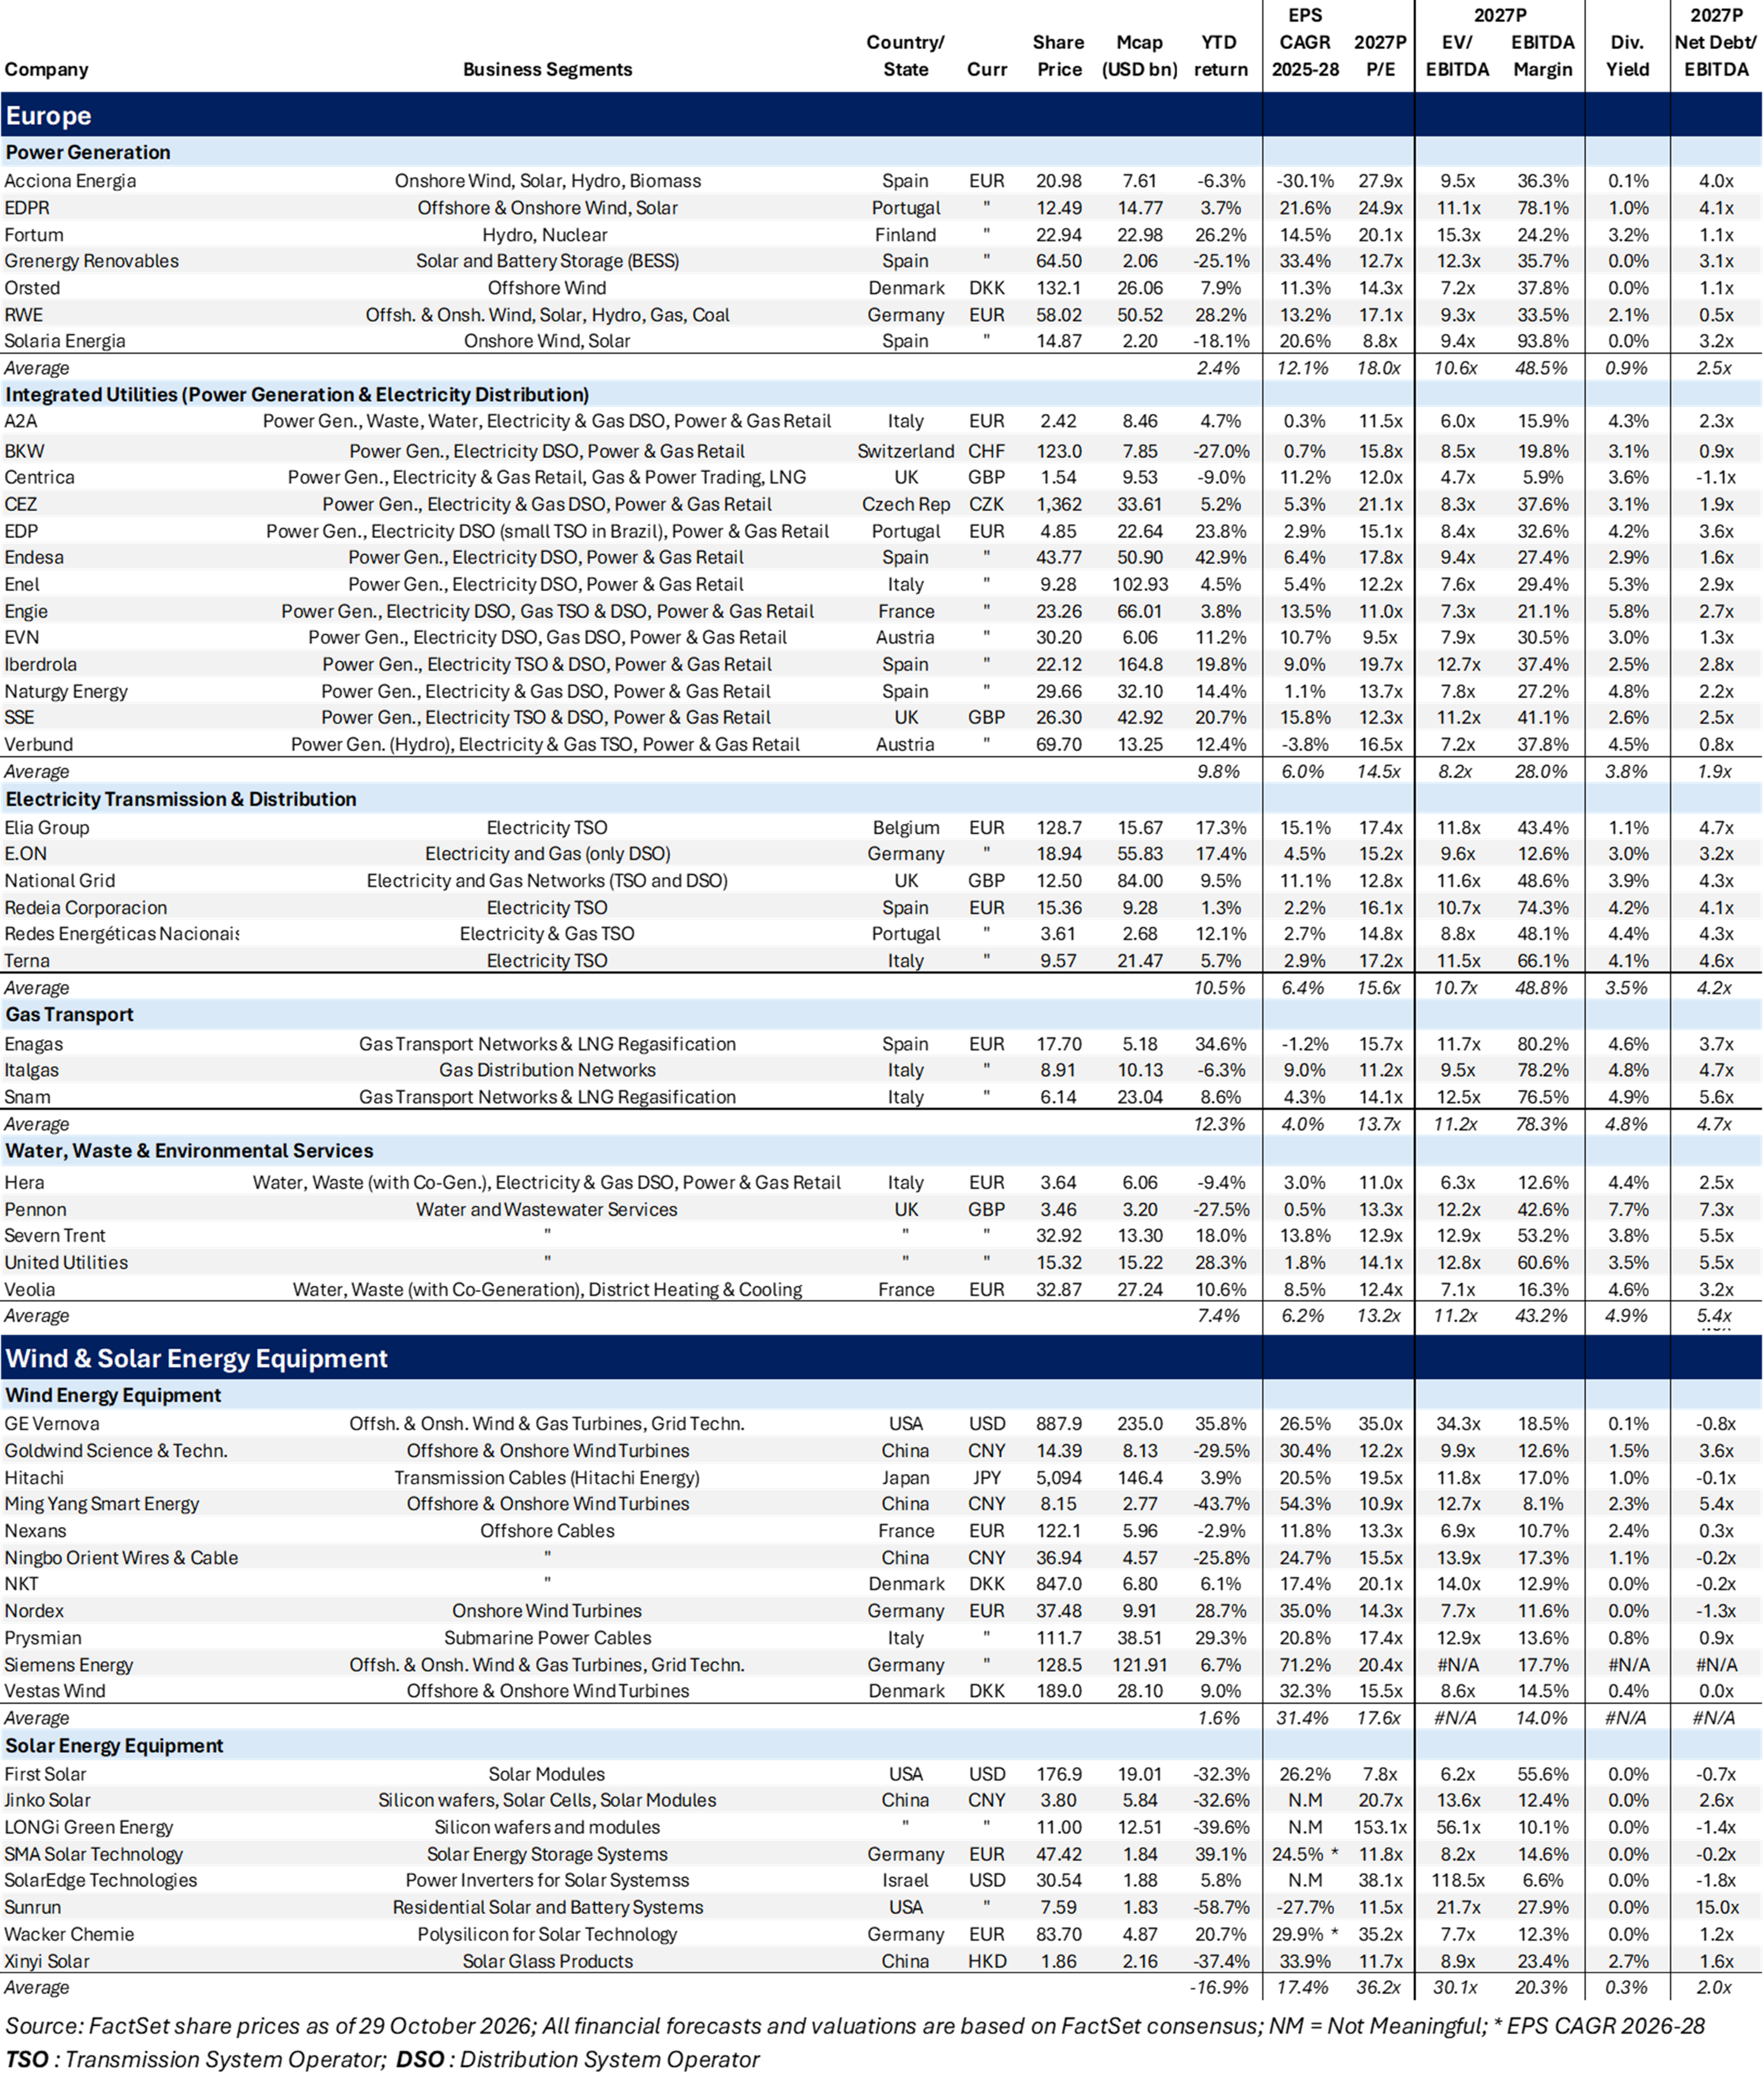

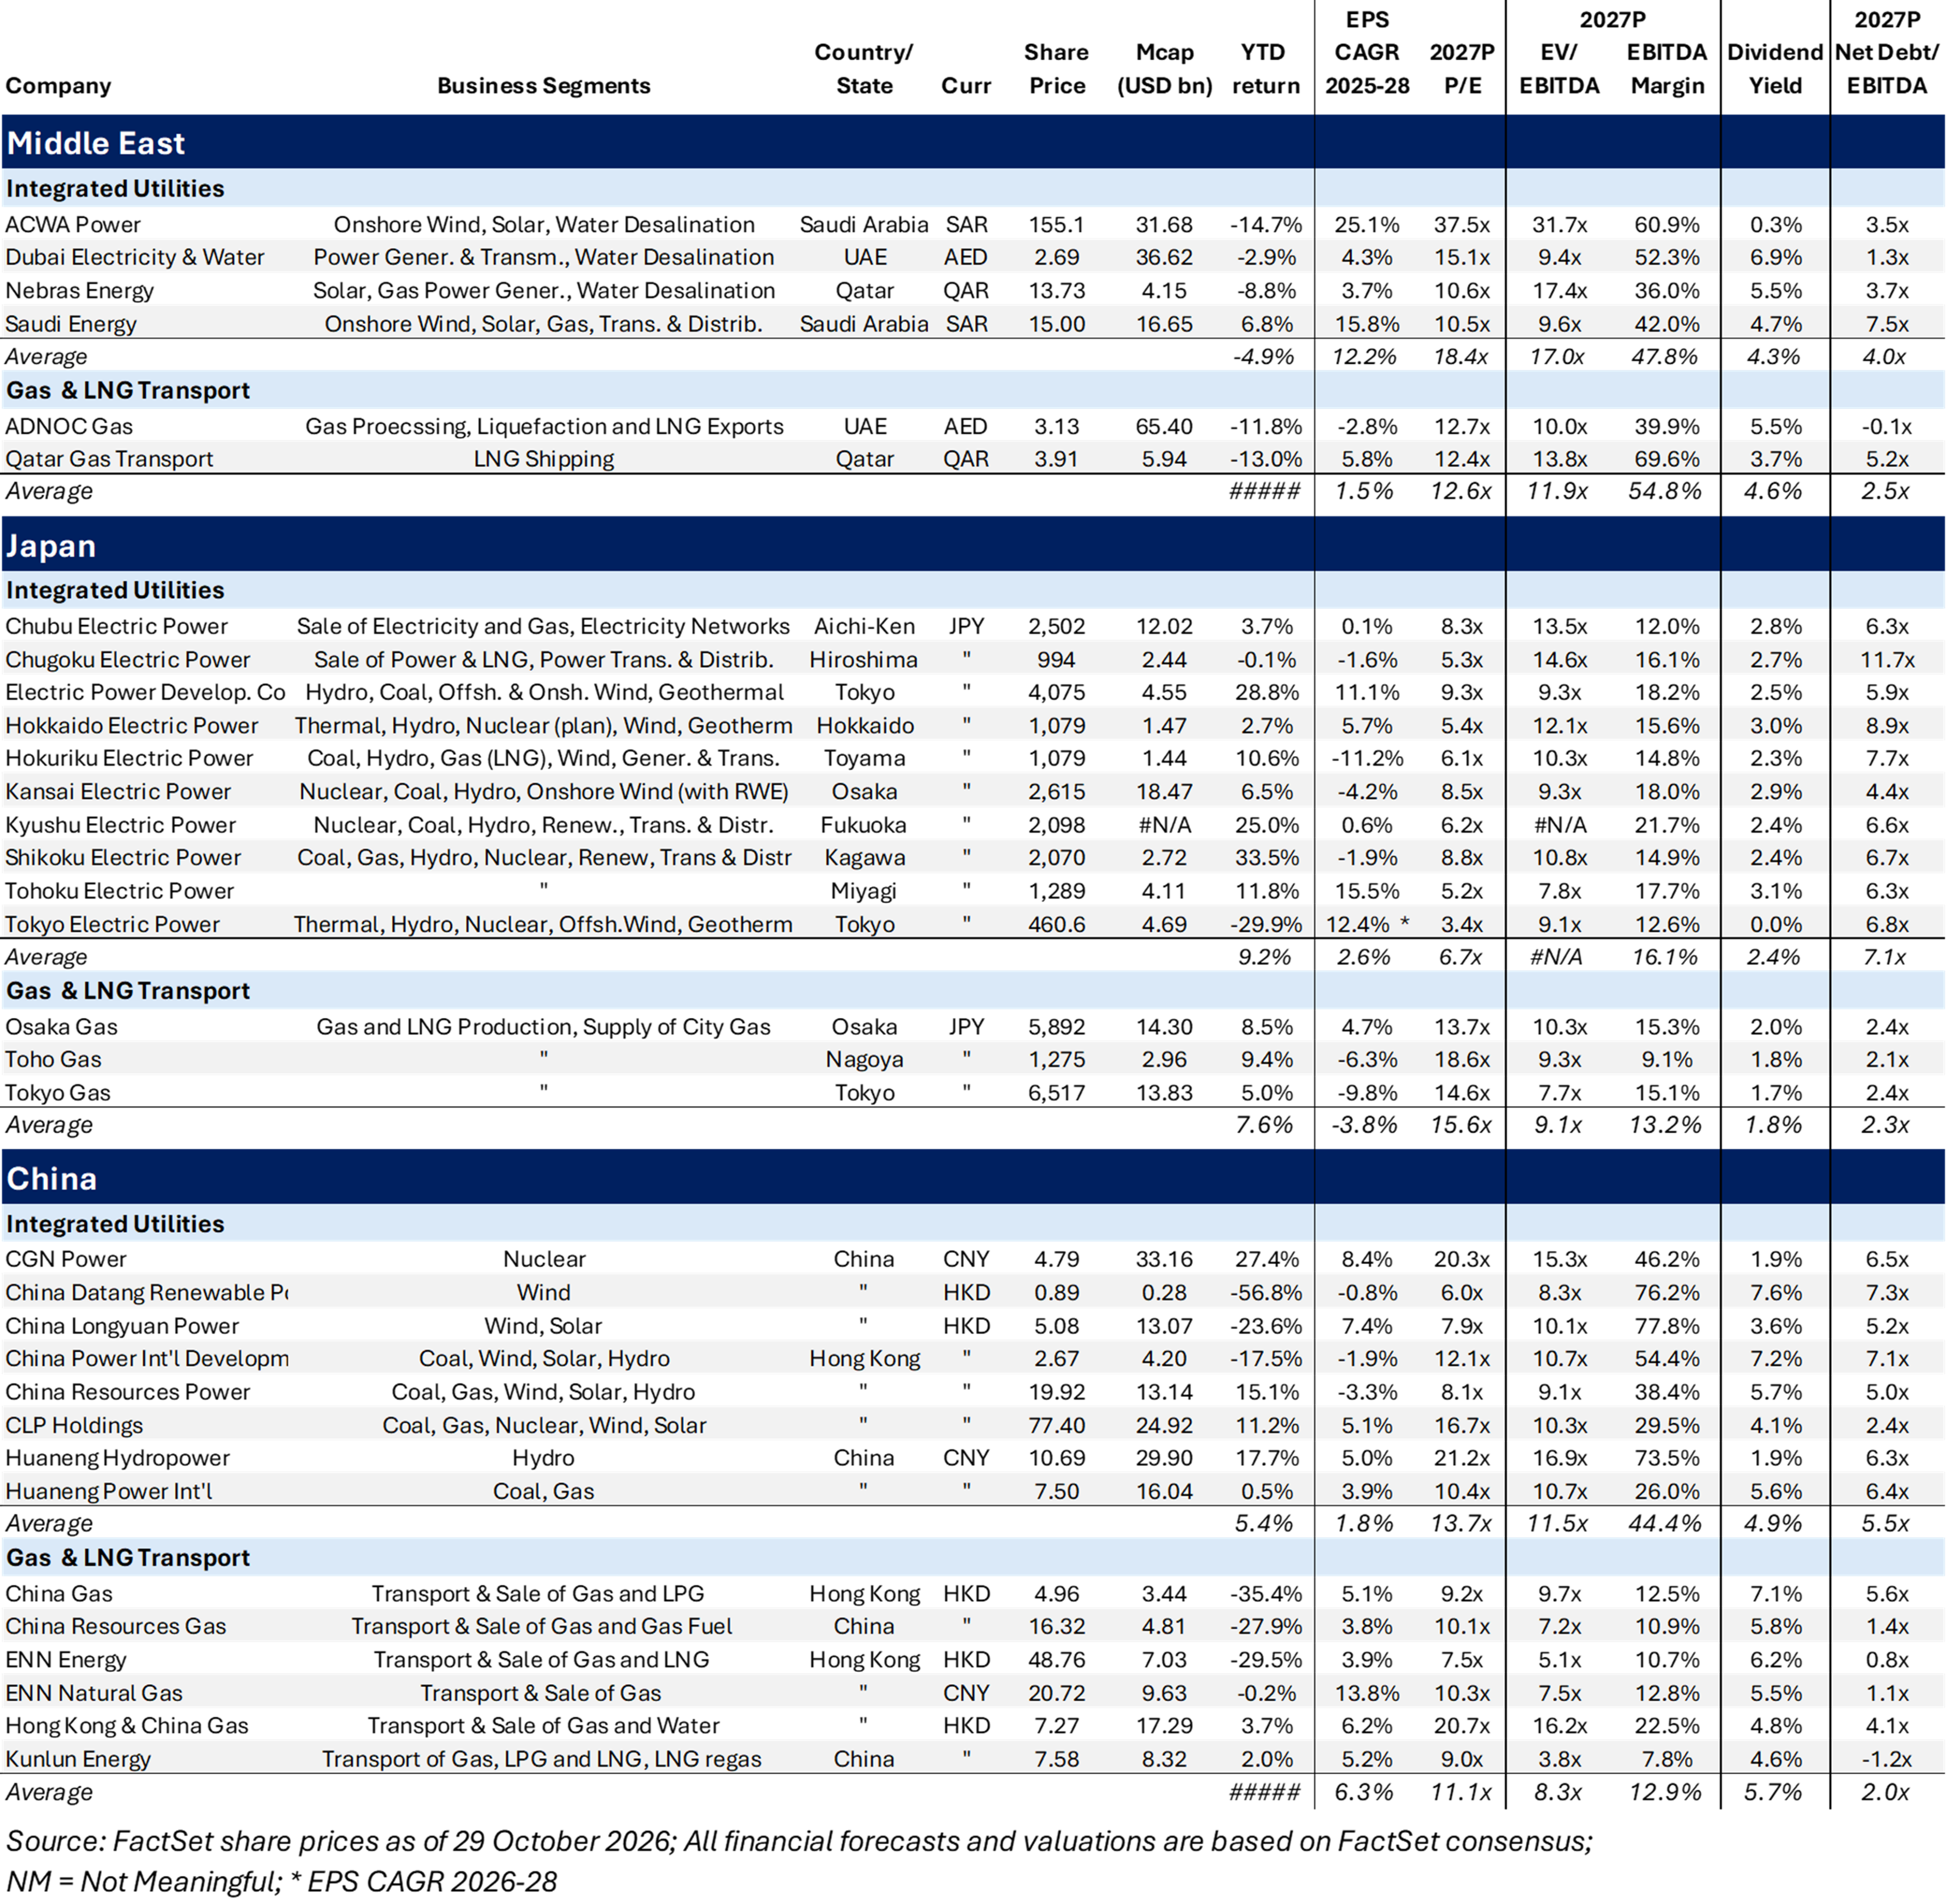
©Gabelli Funds 2026
249 Royal Palm Way, Palm Beach, FL 33480 Gabelli Funds TEL (561) 671–2100
This whitepaper was prepared by Jens Zimmermann, CFA, by Ashish Sinah, CFA, by Chong-Min Kang, and by Mitsuyoshi Kikuchi. The examples cited herein are based on public information and we make no representations regarding their accuracy or usefulness as precedent. The Research Analysts’ views are subject to change at any time based on market and other conditions. The information in this report represents the opinions of the individual Research Analysts as of the date hereof and is not intended to be a forecast of future events, a guarantee of future results, or investments advice. The views expressed may differ from other Research Analysts or of the Firm as a whole.
As of June 30, 2026, affiliates of GAMCO Investors, Inc. beneficially owned less than 1% of all companies mentioned.
Funds investing in a single sector, such as utilities, may be subject to more volatility than funds that invest more broadly. The utilities industry can be significantly affected by government regulation, financing difficulties,
supply or demand of services or fuel and natural resources conservation. The value of utility stocks changes as long-term interest rates change.
Investors should carefully consider the investment objectives, risks, charges and expenses of the Fund before investing. The prospectus, which contains more complete information about this and other matters, should be read carefully before investing. To obtain a prospectus, please call 800 GABELLI or visit www.gabelli.com
Returns represent past performance and do not guarantee future results. Current performance may be lower or higher than the performance data quoted. Investment return and principal value will fluctuate so, upon redemption, shares may be worth more or less than their original cost. To obtain the most recent month end performance information and a prospectus, please call 800-GABELLI or visit www.gabelli.com
Distributed by G.distributors, LLC., a registered broker dealer and member of FINRA.
This whitepaper is not an offer to sell any security nor is it a solicitation of an offer to buy any security.
For more information, visit our website at: www.gabelli.com or call: 800-GABELLI
800-422-3554 • 914-921-5000 • Fax 914-921-5098 • info@gabelli.com
Gabelli Funds, LLC is a registered investment adviser with the Securities and Exchange Commission and is a wholly owned subsidiary of GAMCO Investors, Inc. (OTCQX: GAMI).