NATO
The media has propagated the misconception that the U.S. pays the majority of NATO’s budget. However, this is not true. For clarification, NATO’s total annual operating budget is only about $3.6 billion, and the U.S. contributes roughly 15.8% of that, or about $570 million per year. This budget covers NATO’s headquarters, administration, and joint programs, not the military spending of its member countries. Claims that the U.S. pays hundreds of billions of dollars to NATO are incorrect because they dramatically exaggerate NATO’s budget and confuse it with national defense spending. Overall, NATO defense spending remains heavily skewed toward the U.S., which contributes roughly two-thirds of the total. (Table 1).
The confusion arises from conflating NATO’s common-funded budgets (for headquarters, command structure, joint operations, infrastructure) with the much larger U.S. national defense budget. NATO’s common budget represents just 0.2% of total Allied defense spending.
The U.S. contributes ~15.9% (through 2025; 14.9% from 2026), equating to roughly $750–770 million annually—less than 0.1% of total U.S. defense spending.
U.S. defense spending was $935 billion in 2024, rising to $980 billion in 2025, funding global U.S. military personnel, operations, bases, equipment, and R&D worldwide—not direct cash transfers to NATO.
U.S. forces and assets provide indirect NATO support via collective defense (Article 5), deterrence, and interoperability, but this is not a payment to NATO’s budget.
Direct U.S. contribution to NATO’s actual common budget remains minimal (~0.07–0.08% of U.S. defense total), emphasizing the distinction between national defense outlays and Alliance shared costs. This supports economic stability by avoiding disproportionate direct fiscal burden on U.S. taxpayers while enhancing collective security and growth through allied capability improvements.
NATO maintains a key defense spending target for its member countries, designed to strengthen the Alliance’s collective military capabilities and deterrence posture. This guideline, formally established as a political commitment at the 2014 Wales Summit, urges each ally to allocate at least 2% of its gross domestic product (GDP) to defense expenditures annually. The target traces its roots even earlier, to informal discussions among NATO defense ministers in 2006, but gained renewed urgency in 2014 following Russia’s illegal annexation of Crimea and escalating instability in regions like the Middle East.
Importantly, this 2% benchmark is not a direct financial contribution to NATO’s common budget (which funds the organization’s headquarters, staff, and joint operations through a separate cost-sharing formula). Instead, it represents a national-level political pledge to invest sufficiently in each member’s own armed forces, equipment, training, and readiness. The goal promotes fair burden-sharing among allies, reducing over-reliance on any single member—particularly the United States, which has historically shouldered a disproportionate share of NATO’s overall military capabilities.
Progress toward the 2% target has accelerated dramatically in recent years, driven by Russia’s full-scale invasion of Ukraine in 2022 and broader geopolitical tensions. In 2014, only three allies met or exceeded the guideline. By 2024, that number had risen significantly, and in 2025—for the first time since the target was set—all 32 NATO members are expected to meet or surpass the 2% threshold. Total NATO defense spending (including the U.S.) reached around $1.6 trillion in 2025, up notably from prior years.
Despite this widespread achievement, discussions within the Alliance continue to focus on those allies who only marginally meet the target or who face domestic pressures to sustain high levels of investment. Countries like Poland, Lithuania, Latvia, and Estonia have gone further, allocating well above 2%—often 3–4% or more—due to their proximity to Russia and heightened threat perceptions. Meanwhile, at the 2025 NATO Summit in The Hague, allies took an even more ambitious step by committing to a new long-term pledge: investing 5% of GDP annually in core defense and defense-related spending by 2035. This elevated goal underscores NATO’s evolving response to persistent security challenges and aims to ensure the Alliance remains militarily credible and adaptable in an uncertain world.
Overall, the original 2% target has evolved from an aspirational guideline into a broadly met standard, while ongoing allied dialogue emphasizes not just meeting minimums but continuing to enhance capabilities, interoperability, and equitable contributions to collective defense.
|
Source: SIPRI
NATO Spending Implications
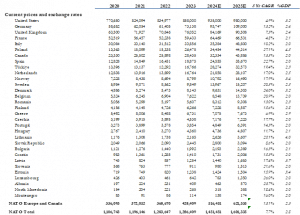
European NATO members’ defense expenditure in the ten years before the invasion of Ukraine stood at around 1.5% on average as a share of GDP. At the time, NATO members were expected to allocate at least 2% of their GDP to defense. That compares to circa 3.5% in the U.S., and 2.5% for NATO total, including the U.S. and Canada. NATO Europe, after the invasion of Ukraine in 2022, substantially increased defense expenditure to about 2.0% as a share of GDP. For context, if NATO members all raised spending to 3% of GDP, it would represent an incremental $300bn per year in new defense spending. In June of 2025, the NATO summit took place in The Hague, Netherlands. At the event, NATO members committed to a new set of spending and capability targets.
NATO members made the commitment to invest 3.5% as a share of GDP by 2035 to resource core defense requirements and to meet the NATO capability targets. In addition, they account for up to 1.5% as a share of GDP for investments that are less specific, e.g. investments to protect critical infrastructure and strengthen the defense industrial base. Overall, we estimate the European NATO members’ core defense expenditure in 2024 to be around $500bn. The three largest contributors are Germany with roughly $95bn or around 20% of the total, followed by the U.K. with $85bn and France with $65bn. That compares with around $950bn spent by the U.S.
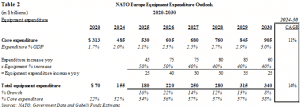
Core expenditure can be divided into two main segments: equipment, which historically contributed around 20% to NATO Europe total spend, and others. Others mainly includes personnel and expenses for operations and maintenance. After the invasion of Ukraine, equipment expenditure has grown disproportionately strongly, to about 30% of the total. This growth is best explained by a more rapid availability of equipment versus, e.g., the hiring and training of personnel. The three largest equipment contributors are the U.K. with around $30bn, Germany with $28bn, and France with $18bn. Overall, we estimate the total addressable European defense equipment market in 2024 to be around $155bn.
That $155bn compares to around $290bn in equipment expenditure in the U.S., which has around 30% of total U.S. defense expenditure over the past decade. While this 30% is likely a good guideline for a NATO Europe equipment share normalization long-term, we continue to expect a higher equipment share short- and medium-term in light of its more rapid availability. Based on conversations with industry participants, we continue to model a 40-50% share of the incremental annual defense spend to be allocated to equipment. As a result, we estimate NATO Europe equipment expenditure to grow at around 15% CAGR to $340bn by 2030.
This translates into multi-year increases in procurement of aircraft, missiles, air defense systems, armored vehicles, munitions, and ISR capabilities, as well as sustained demand for maintenance, repair, and overhaul services. For contractors, this means larger addressable markets, longer program backlogs, improved pricing power, and higher utilization of production capacity, which together support stronger revenue visibility and margin expansion. In effect, NATO spending targets act as a policy-driven demand floor for the industry, anchoring growth for prime contractors and tier-one and tier-two suppliers alike over the next decade.
Booming Defense IPO Market
Recent IPOs such as Firefly Aerospace (FLY), Karman Holdings (KRMN), Voyager Technologies (VOYG), Loar Holdings (LOAR), StandardAero (SARO), and AIRO Group (AIRO) highlight how defense and aerospace have become increasingly attractive sectors for investors, driven by powerful growth tailwinds including rising global defense budgets, geopolitical instability, modernization of military fleets, and sustained demand for aerospace aftermarket services.
This observation equally holds true for the European market. The IPO of Czechoslovak Group (CSG) in January 2026 valued the business at €25bn ($29bn) at the offer price, marking a landmark initial public offering by a defense firm. This transaction follows the spin-off of TK Marine Systems (TKMS), the former Marine Systems segment of German industrial conglomerate ThyssenKrupp (TKA), in October 2025. Looking ahead to the remainder of 2026, a key transaction is the pending IPO of the Franco-German defence group KNDS (formed by the merger of Krauss-Maffei Wegmann and Nexter).
These dynamics have improved the visibility and durability of revenue streams across defense manufacturing, MRO, space systems, and advanced aviation technologies, making the sector appealing for both growth and defensive capital. As a result, more companies are choosing to access the public markets, expanding the opportunity set for investors seeking exposure to long-cycle defense spending, resilient government-backed demand, and structurally higher levels of military and aerospace investment than in prior decades.
ONE CORPORATE CENTER RYE, NY 10580 Gabelli Funds TEL (914) 921-5000
This whitepaper was prepared by Tony Bancroft, Daniel Gleim and Michael Burgio. The examples cited herein are based on public information and we make no representations regarding their accuracy or usefulness as precedent. The Research Analyst’s views are subject to change at any time based on market and other conditions. The information in this report represent the opinions of the individual Research Analyst’s as of the date hereof and is not intended to be a forecast of future events, a guarantee of future results, or investments advice. The views expressed may differ from other Research Analyst or of the Firm as a whole.
As of September 30, 2025, affiliates of GAMCO Investors, Inc. beneficially owned less than 1% of all other companies mentioned.
This whitepaper is not an offer to sell any security nor is it a solicitation of an offer to buy any security.
Investors should consider the investment objectives, risks, sales charges and expense of the fund carefully before investing.
For more information, visit our website at: www.gabelli.com or call: 800-GABELLI
800-422-3554 • 914-921-5000 • Fax 914-921-5098 • info@gabelli.com