Introduction: Why the Wealthy Buy Teams
For many, ownership of a professional sports organization is the ultimate status symbol, granting access to an exclusive club and providing the psychic benefit that accompanies leading a passionate tribe with shared symbolism and history. Whether intended or not, team ownership has also proven to be an excellent financial investment with an estimated 15% annualized appreciation in the value of all “big four” US/Canada teams to over $500 billion:[1]
Exhibit 1 Aggregate Private Market Values for Teams of the Big Four
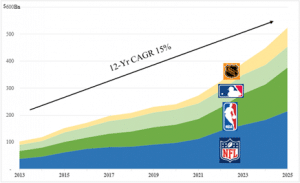
Source: Forbes Magazine annual estimates, Gabelli Funds estimates
Scarce storers of value (Defense): Much like gold and bitcoin, the number of sports franchises is structurally limited – in the US/Canada, 30 baseball and basketball teams, 32 football and hockey teams – with periodic expansions governed by leagues largely exempt from anti-trust law. Meanwhile, the recent loosening of restrictions to permit private equity and sovereign ownership should underpin demand for these luxury goods.
Secularly advantaged growth (Offense): Sports businesses exhibit characteristics desirable in any asset:
- Customers are literally fans, supporting economic resilience and pricing power
- High proportion of recurring revenue derived from media rights, sponsorships and seat/suite subscriptions
- Low capital intensity
- “The Anti-AI”: Sports have survived previous shifts in technology and taste and are likely to remain durable. Approximately three-quarters of Americans watch live sports while two-thirds have attended a big four game.2
- Recent rights deals with non-traditional media companies have underscored the power of live sports intellectual property even as traditional monetization models have been upended.
- A generational preference for live events opens new revenue opportunities for in-person shared experiences.
We believe we are in the early innings of public market participation in these trends with a growing roster of listed leagues, teams, venues, media and service partners, each with an idiosyncratic set of opportunities created by strong industry fundamentals, changing ownership priorities and innovative financial engineering.
[1] Using team value estimates published annually by Forbes Magazine. This 14.6% return compares favorably with 13.3% and 9.8% CAGRs for the S&P 500 and average gold price per ounce over the same time frame.
2 S&P Global Market Intelligence, 2025
The Business of Sports
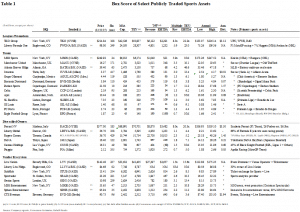
The predecessors to the “big four” traditional American professional sports leagues – Major League Baseball (MLB), the National Hockey League (NHL), National Football League (NFL) and the National Basketball Association (NBA) – generally began in the late 19th/early 20th centuries as regional organizations with part-time rosters.[1] Today those leagues generate over $45 billion in aggregate revenue, collectively worth nearly $525 billion (about the size of Johnson & Johnson or ~#15 in the S&P 500).
Although mix varies slightly by league, sports teams generate revenue from three primary sources: (a) Live Attendance; (b) Media Rights; and (c) Licensing and Sponsorship. Player compensation comprises the bulk of the cost of the product with the collective bargaining agreements (CBAs) governing each league guaranteeing the talent ~50% of revenue; venue rent and direct costs associated with the in-person experience are also significant though the three publicly-reporting big four US franchises (NY Knicks/Rangers and Atlanta Braves) remain consistently profitable.
Live Attendance
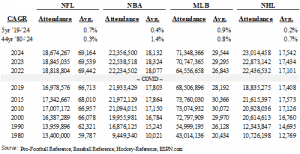
In person average attendance is generally limited by the number of teams in each league, the number of scheduled games each season and the capacity of stadiums/arenas. As all of those factors have expanded over the last several decades as has absolute attendance levels with high capacity utilization outside of years without labor disruptions or COVID. Price, however, has been a stronger contributor to attendance revenue growth with steady price increases for seats and food/beverage and the premiumization of overall fan experiences (e.g. exclusive suite access) evident to anyone who has attended a game.
[1] For brevity and ease of comparison, this whitepaper will focus primarily on the “big four” which is not to diminish the important of investment merits of other publicly-traded US and non-US sports assets, particularly leagues such as Formula One (FWON) and UFC (TKO) which possess incremental merits.
Table 2 Attendance Trends
Media Rights
Television license fees are the most important revenue stream for all major sports and are carefully negotiated to segment the viewing audience. Media rights have evolved from being primarily local to national reflecting a market shift from radio to broadcast television to cable to streaming. Cord-cutting has forced Regional Sports Networks (RSNs) such as Diamond Sports/Bally’s and MSG Networks to restructure their balance sheets and rights commitments and to explore new revenue streams (e.g. direct-to-consumer). The NBA’s most recent rights negotiation in August 2025 featured a shift to national rights that will generate an absolute increase in TV revenue but hit teams differently based on their own RSN situations. This is likely to be replayed as MLB attempts a national-driven model, possibly including league owned distribution, when all of baseball’s media rights mature in 2029. While these dynamics limit visibility on these revenue streams, prospective team buyers have taken comfort that at each step of media evolution, sports have served as backbone content commanding premium prices per rating point.
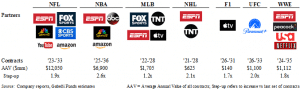
As shown in Table 3, sports rights dominate viewership with the NFL alone accounting for nearly three-quarters of the ratings of the top 250 programs in 2024. That partly explains why the media distribution services of the future have intensified their involvement in rights negotiations with Amazon securing Thursday Night Football and NBA games, Netflix commiting to MLB and WWE and AppleTV+ buying Formula 1, Major League Soccer and Friday Night baseball.
Table 3 2024-25 Viewership Share & 2024 Top 10 By Category
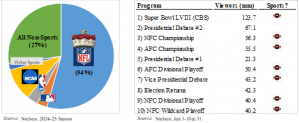
Table 4 Media Rights Summary
Licensing & Sponsorship
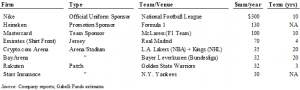
The final major sports revenue stream tends to be more idiosyncratic with some deals struck at the league level and disbursed pro-rata to each team and others signed locally. The latter tend to include stadium/arena naming rights and advertising as well as jersey/patch deals. Below we highlight some of the highest profile agreements.
Table 5 Notable Licensing & Sponsorship Deals
Cost Structure
The players in each of the Big Four are represented by powerful labor unions who bargain for everything from player salaries to working conditions under CBAs of varying duration. Each league has some form of revenue sharing between teams and players and from high revenue (typically large market) teams and lower revenue (typically smaller market) teams.
Table 6 Labor Agreements
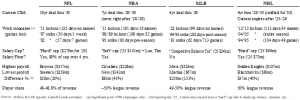
The major point of difference between the CBAs is the presence of a salary cap. The NFL and NHL impose strict limits on the amount each team may pay its players. The NBA has adopted a “soft” cap that imposes a luxury tax on payrolls above a certain threshold and includes other penalties (e.g. loss of draft picks) for repeat offenders.
MLB’s version of the luxury tax (called the Competive Balance Tax) is less punatitve, resulting in the largest disparity in team payrolls (131% difference between top and botom) and, arguably, the least competitive balance. MLB owners have vocalized their intent to address this situation, increasing the probability of a work stoppage after the 2026 season. However, hardening the cap, even with the addition of a floor, is likely to improve the health of baseball and lead to higher average transaction multiples.
Deals
Ownership
Whereas the US major sports leagues were largely founded as confederations of family businesses, large dollar values and the desire of later generations for liquidity have compelled each league to open their doors to institutional (private equity and sovereign wealth) and public market participants. We believe the aperture for non-family ownership will expand with rising values.
Table 7 League Ownership Guidelines

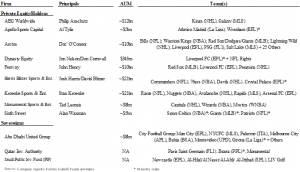
Notably several institutional investors have taken minority stakes in teams including those below.
Table 8 Active Institutional Owners of Sports Franchises
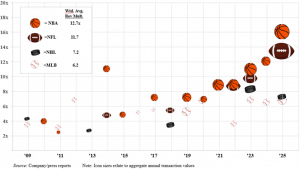
The velocity, size and revenue multiples implied by private transactions in the big four have increased considerably over the last fifteen years. As shown in Exhibit 2, a sizeble gap has opened between the NFL/NBA and NHL/MLB driven largely by different trajectories in audience delivery and media contracts. We think the gap will narrow given its magnitude and recent changes in game length and the likelihood of a salary cap in MLB.
Exhibit 2 Private Market Transactions
Finally, each league regularly considers expansions (summarized below) that typically entail fees shared pro rata with existing franchisees partly to compensate them for diluting their existing shares of league revenue from sources such as national media rights. For several years, MLB has actively considered expansion into markets such as Nashville, Salt Lake City, Portland and Montreal though final decisions may await clarity on baseball’s labor and media rights situations. The NBA is likely to entertain interest from Las Vegas and Seattle after this season. Meanwhile, the NFL may be seeking international expansion after successfully hosting games in the UK and Germany. Finally, often underappreciated are team moves which can reinvigorate the overall fan base often with new arenas and marketing investment.
Table 9 Team Moves/Additions

Extra Time: Other Dynamics
Beyond the Big Four
As acknowledged earlier, this paper has dedicated minimal time to the world’s most overwhelmingly popular sport, soccer (i.e. football) and ignored the second most followed sport (cricket). We’ve also paid relatively little attention to half the world’s population and the growing popularity of women’s sports – especially basketball – among both men and women. Demographics would seem to favor these sports and certain other emerging sports (e.g. e-gaming) though the rise of the WNBA and Formula 1, for example, appear to have expanded rather than cannibalized the viewing/revenue pie.
Sports Gambling
The 2018 US Supreme Court decision overturning the Professional & Amateur Sports Protection Act of 1992 (PASPA) has led to the rapid expansion of legalized sports betting in the US, a trend recently supercharged by the development of prediction markets (e.g. Kalshi) that effectively arbitrage existing regulatory requirements. Most teams/leagues have received little direct benefit from the legitimization of betting. However, sports betting, particularly prop bets (e.g. QB passing yards, number of strikeouts, first to score, national anthem length, etc.) have almost certainly increased viewership and engagement, enhancing the value of media rights. On the other hand, some would argue that increased visibility of gambling and recent/ongoing player involvement in altering betting outcomes erode the long-term integrity and value of sports. Each league walks a fine line in monetizing a sporting aspect that has and will always exist.
162(m)
Under existing law, §162(m) disallows the tax deductibility of compensation above $1 million for each “covered employee,” defined as named executive officers (NEOs). Among the changes the OBBA is set to unleash in 2027 is an extension of covered employees to include the five highest paid employees irrespective of whether they are NEOs. This would increase effective cash compensation costs for many public professional organizations, but especially public sports teams: the five highest paid employees of the Atlanta Braves, for example, would all be players making nearly an aggregate of $100m in 2026. Without a legislative fix or clever tax planning, this tax change could incentivize public teams to evaluate alternatives.
191 MASON STREET, GREENWICH, CT 06830 Gabelli Funds TEL (914) 921-5000
As of September 30, 2025, affiliates of GAMCO Investors, Inc. beneficially own on behalf of their investment advisory clients or otherwise approximately 30.99% of Atlanta Braves Class A, 5.77% of Class C, 5.21% of MSG Sports, 1.44% of Manchester United and less than 1% of all other companies mentioned
This document is not an offer to sell any security nor is it a solicitation of an offer to buy any security.
You should consider the ETFs’ investment objectives, risks, charges and expenses carefully before you invest. The ETF’s’ Prospectus is available from G.distributors, LLC, a registered broker-dealer and FINRA member firm, and contains this and other information about the ETF, and should be read carefully before investing.
To obtain a Prospectus, please visit https://gabelli.com/funds/etfs/
Gabelli Funds, LLC is a registered investment adviser with the U.S. Securities and Exchange Commission. Gabelli Funds provides discretionary investment advisory services primarily to open and closed-end investment companies. Gabelli Funds is a wholly owned subsidiary of GAMCO Investors, Inc. (“GAMCO Investors”), a Delaware corporation whose stock is traded on OTC Markets (OTCQX:GAMI).
For more information, visit our website at: www.gabelli.com or call: 800-GABELLI
800-422-3554 • 914-921-5000 • Fax 914-921-5098 • info@gabelli.com