European Utilities – Playing catch-up in 2025
Utilities stocks posted solid absolute returns in 2025 and have year-to-date (YTD) also outperformed the broader market as utility companies are not affected by trade tariffs and they benefit from growing electricity demand across the world as well as from lower interest rates. Accordingly, the MSCI World Utilities index has already rallied 13% in 2025 and has so far beaten the MSCI World index by a wide margin in 2025 (compared to 2024, when utilities trailed the broader market despite showing a solid absolute return of 10%, see Table 1).
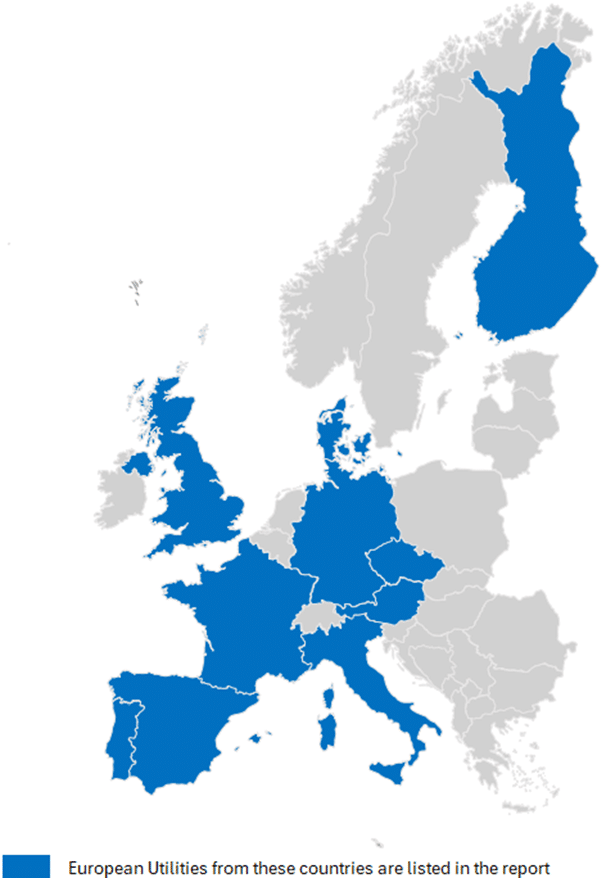
European utilities have rebounded from negative returns in 2024 and have posted YTD in 2025 the strongest returns in the utilities sector (compared to US utilities and the global utilities benchmark). In contrast to its US utilities peers, European regulated electricity network companies are fully insulated from any policy uncertainty surrounding the US Inflation Reduction Act (IRA). Thus, among our equal-weighted European Utilities sub-sector indices, European “Integrated Utilities” and “Electricity Networks” have returned YTD 20% and 18%, respectively, and have outperformed European “Power Generation” companies, which tend to have exposure to renewable energy markets in the USA. Finally, after four consecutive years of negative returns, the Global S&P Global Clean Energy Index has also started to rebound in 2025 on the back of lower interest rates and depressed valuations.
Table 1 Index Performances

Source: Thomson ONE
Exhibit 1 Indexed Share Price Development (1 Year)
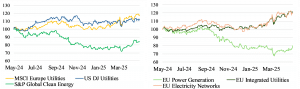
Source: Thomson ONE
Electricity prices and electricity demand in Europe
European electricity prices had hit unprecedented levels in 2022, when the war in Ukraine started and concerns over possible natural gas shortages in Europe had pushed prices for gas and electricity to record levels because European power prices are highly correlated to (and driven by) European gas prices. Europe’s “merit order principle” ranks power plants by their marginal (variable) costs for producing a single MWh of electricity. To economically optimize the available electricity supply, the cheapest technologies produce first (i.e. solar, wind and hydro with marginal production cost of close to zero), while the most expensive power plants (coal and gas) produce the last MWh to clear the market. Thereby, the most expensive power plant (which is gas-fired generation for which the gas price reflects the marginal production costs) determines the electricity price for all producing power plants, even for those with zero marginal production costs (i.e. solar, wind and hydro). This is called “uniform pricing” in Europe because all power plants receive the same price for their supplied electricity and it explains why gas prices set electricity prices in Europe (i.e. why both prices are highly correlated).
Exhibit 2 Merit Order determines Electricity Prices in Europe
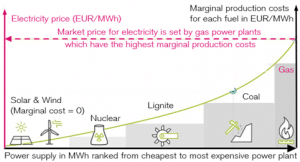
Source: Gabelli Funds
Supply shortages or even gas rationing could be avoided in Europe during 2022 because cheap Russian pipeline gas was quickly replaced with more expensive LNG imports. As a result, European gas prices started to decline in 2023 and in 2024 but stayed at elevated levels compared to pre-Ukraine war levels in 2020 (see lower section of Table 2). Accordingly, while European electricity prices have also declined in 2023 and in 2024 (along with gas prices), they have also not reached the pre-war levels of 2020 again. Quite the opposite, in 2025, electricity prices across Europe have started to gain momentum again as average wholesale power prices have already reached in Germany, Italy and the UK the crisis levels of 2021 again, when prices jumped in anticipation of the Ukraine war (see Table 2).
Table 2 Average Electricity, Carbon and Natural Gas Prices

Source: EMBER; Thomson ONE
Meanwhile, the electrification of different industry sectors continues to drive demand for electricity in Europe and in other key markets. In Q1 2025, Europe consumed 1,294 TWh of electricity, which accounted for almost 20% of total global electricity demand, thereby surpassing US power demand by about 20% (despite growing power demand for data centers in the USA, reflected by the strongest growth rate of 5.3% in Q1 2025). In addition, Europe reached about half of China’s electricity consumption in Q1 2025 (see Table 3). Together the four regions/countries listed in Table 3 (Europe, USA, China and Japan) accounted for about 70% the world’s electricity demand in Q1 2025.
Table 3 Quarterly Electricity Demand

Source: EMBER
European Utilities – Trends and Themes from Q1 2025 Results
Solid Q1 2025 results supported the ongoing share price recovery of European utilities stocks since the start of 2025 as most utilities reported EBITDA and net profit in Q1 2025, which met or exceeded consensus expectations. In addition, the vast majority of European utilities also confirmed the full year EBITDA or EBIT guidance or issued for the first time a full year guidance which was in line with consensus expectations. Several companies also raised their full year outlook already at the start of the year (see Table 4).
Table 4 European Utilities – Q1 2025 results beats and misses

Source: Company Information
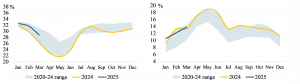
Lower wind load factors in Q1 2025: As it was widely anticipated and was well flagged by renewable electricity generators, wind power generation in Europe had suffered in Q1 2025 from lower wind speeds, which reduced the load factors and weighed on 1Q results of power generators. As a result, the share of wind and solar in Europe’s power generation stayed below 20% in Q1 2025 (see Exhibit 4 below), which was offset by a relatively high share of gas-fired power generation that hit with 27% the upper end of the 5-yr range in February 2025 (see Exhibit 5 below). However, wind and solar power generation has already recovered at the start of Q2 2025 as its share in Europe’s power generation has increased to 22% in April 2025, which is already close to the upper end of the 5-year range at this time of the year.
Tight supply chains: Furthermore, continuing cost increases and constrained supply chain capacity still remain the key reasons for a slowing build-out of electricity networks and renewable energy projects in Europe. The supply chain has also put more risk on the developer (full cost pass-through provisions, no liquidated damages and fewer warranties). But there is more discipline in wind project developments as Orsted has cancelled Hornsea 4 in the UK because the WACC has increased by 50bps since winning the bid in 2024 and one supplier had raised equipment prices following the original tender. Similarly, SSE increased its cost of equity hurdle rate by 100bps for offshore wind projects. Therefore, it is highly likely to see further offshore wind project cancellations of zero-subsidy projects in Germany and in the Netherlands as developers re-bid and seek projects with higher returns. However, to reach ambitious medium-term net zero emission targets, European governments still need large scalable renewable energy projects because alternative options (such as nuclear energy with small modular reactors) are still long-dated.
Lower profit margins in power trading: While profit margins of Integrated Utilities in Iberia were widely expected to normalize from more elevated levels in 2023/24, margins were more resilient than the consensus anticipated (which also explained the solid earnings beat of EDP). The recent power blackout in Iberia also reinforced the importance for grid investments, but uncertainty remains regarding the regulatory review in Spain, which will affect Spanish network operators Redeia and Endesa. Conversely, profit margins in electricity trading segments outside of Iberia came under pressure as earnings normalized at lower levels after trading operations had benefitted from exceptionally high price volatility in recent years. Accordingly, RWE’s trading result declined noticeably in Q1 2025 after RWE had already guided for an earnings normalization at lower profit level going forward.
More grid investments needed: The required build-out of power grids was a key focus in Q1 2025 following the Iberian power blackout, which highlighted again the importance of energy security, supply and affordability in Europe. Resilient and more flexible electricity networks will be crucial for adding intermittent wind and solar energy to the grid in order to reach the decarbonization targets set by European governments. In this context, German utilities (such as E.ON) have to wait for more clarity from the new German government about its decarbonisation policy targets, but E.ON sounded optimistic that these policies will also reflect higher allowed returns to incentivize grid investments. The Italian network operator Terna reiterated its commitment to increase grid capex and emphasised the need of ensuring system stability when integrating intermittent renewable energy into Italy’s electricity network.
Uncertainty surrounding IRA tax credits: For European utilities with exposure to the US renewables market, the political uncertainty surrounding clean energy incentives in the Inflation Reduction Act (IRA) remains a major concern. The revised version of the budget reconciliation bill intends to terminate Inflation Tax Credits (ITC) and Production Tax Credits (PTC) for clean energy projects that start construction 60 days after the enactment of the legislation. Conversely, the initially proposed bill had considered a gradual phase-out of these tax credits for projects placed in service in 2029, with 80% of tax credits still remaining in place in 2029, 60% in 2030, 40% in 2031 and 0% after that. The newly revised draft bill would also repeal the transferability option for tax credits and removes tax credits for renewable projects that lease out the facility.
European renewable utilities were mostly concerned about the requirement to start construction within 60 days. While it should be adequate for onshore wind and solar projects, which already start operating in 2026-27, it would significantly reduce or eliminate any chance for new projects starting after 2028. This would lead to a material reduction of growth capex for wind and solar projects in the US renewables market. However, capacity additions have already seen a material slowdown since late 2024 because the uncertain future of IRA tax credits directly affects the pricing and returns of new renewable energy projects.
Among European utilities, EDP’s solar and wind producing subsidiary EDPR is highly exposed to the US renewables market as it generates about 40% of its EBITDA with US wind and solar operations. Thus, the outcome of the new budget reconciliation will affect EDPR’s growth capex in the USA. EDP intends to present a new strategic plan in November 2025, which will provide more clarity about its growth strategy and renewables targets in the USA. Similarly, RWE and Orsted also have a large exposure to the USA with more than 10% of EBITDA coming from US renewables. Iberdrola, Engie and Enel are also exposed to US renewables, but the relative materiality of any developments remains much smaller.
Nuclear revival in Europe: An additional topic in Q1 2025 results was the potential revival of nuclear energy in Europe in general and in Spain in particular. The newly elected German government has dropped its long-held opposition to nuclear power and signaled to France that it will no longer block French efforts to ensure nuclear power is treated as renewable energy in EU legislation. While Germany has no plans to re-open its conventional nuclear power stations, it intends to invest in small modular reactors (SMRs) and in nuclear fusion, which, unlike fission, produces no long-lived nuclear waste. Now Austria is the only EU state, which strictly opposes nuclear power, while the Netherlands and Belgium have re-committed to nuclear energy after having previously pledged to shut down all nuclear reactors. In addition, Ministers from 12 EU member states with nuclear reactors said it was “imperative” that the EU recognised the “complementary nature of nuclear and renewable energy sources”.
Amidst the potential European nuclear renaissance, the political debate about the extension of nuclear reactors has become a key topic for utilities companies in Spain after the Spanish government and nuclear operators (Endesa, Iberdrola, Naturgy and EDP) had originally reached an agreement for a gradual shutdown of the country’s seven operating reactors between 2027 and 2035. While the political debate about nuclear energy has gained traction in Spain, the government has not announced any incentives that nuclear plant operators would receive for extending the useful lives of their plants because these companies have suggested in the past that without a guaranteed return any extension would be unprofitable. Endesa and Iberdrola are the largest owners of nuclear plants in Spain, with 47% and 43% of installed capacity, respectively. Naturgy has an 8% market share and EDP has 2%.
UK water sector under government review: After the UK’s privatized water sector was faced with several failures over the past years (water pollution, water shortages and floodings), the UK government has set up an Independent Water Commission to provide recommendations for the UK water regulator (OFWAT). The Water Commission has just released an interim review (the final review will be published later this summer), in which it calls for OFWAT to adopt a more supervisory approach to its oversight of UK water firms with regards to a tighter control on their financial and ownership structures than in the past.
In particular, the report proposes greater regional decision-making around local water systems and emphasizes the need for long-term investments. UK water companies should also be made more attractive to investors. While seven out of ten water companies are privately owned (one is a not for profit), the companies with the best operating performances are the three publicly trading companies (United Utilities, Pennon, Severn Trent). Therefore, the Water Commission is also considering the extent to which public ownership may have been a factor for this operational outperformance.
In this context, Severn Trent released a very bullish long-term guidance when it recently reported its FY 2025 results (period ending 31 March 2025). The company intends to double its EPS over the next 3 years (FY 2025-28) from GBp 112.1 in FY 2025 and the expected revenue growth related to outperforming specific “Outcome Delivery Incentives (ODIs)”, which are used by OFWAT to monitor and measure a water company’s operation performance, are a key part of this projected EPS growth. In particular, the guidance for FY 2026 includes at least GBP 25 million (post tax) in ODIs.
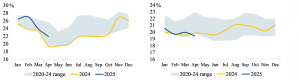
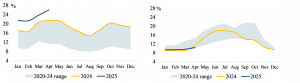
Power Tracker: Electricity Demand and 3 Biggest Fuels in Power Generation by Region
EUROPE
Exhibit 3: Power Demand (TWh) Exhibit 4: Share of Wind & Solar (%)
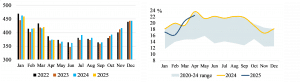
Exhibit 5: Share of Gas (%) Exhibit 6: Share of Nuclear (%)
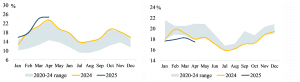
USA
Exhibit 7: Power Demand (TWh) Exhibit 8: Share of Gas (%)
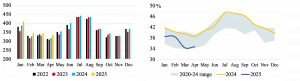
Exhibit 9: Share of Wind & Solar (%) Exhibit 10: Share of Nuclear (%)
CHINA
Exhibit 11: Power Demand (TWh) Exhibit 12: Share of Coal (%)
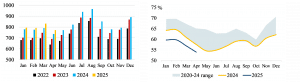
Exhibit 13: Share of Wind & Solar (%) Exhibit 14: Share of Hydro (%)
JAPAN
Exhibit 15: Power Demand (TWh) Exhibit 16: Share of Gas (%)

Exhibit 17: Share of Coal (%) Exhibit 18: Share of Wind & Solar (%)
Changing Fuel mix in Europe and around the World
Exhibit 19: Europe: Biggest Source of Electricity in each Country
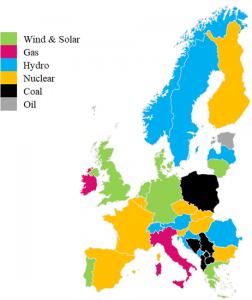
Exhibit 20: Europe Power Generation Exhibit 21: USA Power Generation
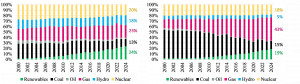
Exhibit 22: China Power Generation Exhibit 23: World Power Generation
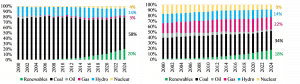
Source: EMBER
Table 5 Valuation table – European Utilities

Source: Thomson ONE, Gabelli Funds estimates (share prices and valuations as of June 5, 2025)
Jens Zimmermann, CFA
jzimmermann@gabelli.com
Ashish Sinha, CFA
©Gabelli Funds 2025
ONE CORPORATE CENTER RYE, NY 10580 Gabelli Funds TEL (914) 921-5100
This whitepaper was prepared by Jens Zimmermann, CFA, and by Ashish Sinah, CFA. The examples cited herein are based on public information and we make no representations regarding their accuracy or usefulness as precedent. The Research Analysts’ views are subject to change at any time based on market and other conditions. The information in this report represent the opinions of the individual Research Analysts’ as of the date hereof and is not intended to be a forecast of future events, a guarantee of future results, or investments advice. The views expressed may differ from other Research Analyst or of the Firm as a whole.
As of March 31, 2025, affiliates of GAMCO Investors, Inc. beneficially owned less than 1% of all companies mentioned.
Funds investing in a single sector, such as utilities, may be subject to more volatility than funds that invest more
broadly. The utilities industry can be significantly affected by government regulation, financing difficulties,
supply or demand of services or fuel and natural resources conservation. The value of utility stocks changes as
long-term interest rates change
Investors should carefully consider the investment objectives, risks, charges and expenses of the Fund before
investing. The prospectus, which contains more complete information about this and other matters, should be
read carefully before investing. To obtain a prospectus, please call 800 GABELLI or visit www.gabelli.com
Returns represent past performance and do not guarantee future results. Current performance may be lower or
higher than the performance data quoted. Investment return and principal value will fluctuate so, upon
redemption, shares may be worth more or less than their original cost. To obtain the most recent month end
performance information and a prospectus, please call 800-GABELLI or visit www.gabelli.com
Distributed by G.distributors, LLC., a registered broker dealer and member of FINRA.
This whitepaper is not an offer to sell any security nor is it a solicitation of an offer to buy any security.
For more information, visit our website at: www.gabelli.com or call: 800-GABELLI
800-422-3554 • 914-921-5000 • Fax 914-921-5098 • info@gabelli.com
Gabelli Funds, LLC is a registered investment adviser with the Securities and Exchange Commission and is
a wholly owned subsidiary of GAMCO Investors, Inc. (OTCQX: GAMI).