US Utilities – Trump Shuffles Cards; Utility Hand Strong
In the first quarter of 2025, the S&P Utility Index (SPU) returned 4.9% compared to the S&P 500 Composite’s return of -4.3% (See Table 1). Regulated utilities outperformed non-regulated power companies and the overall market primarily due to their defensive characteristics. Utilities are insulated from potential tariff impacts, while benefiting from lower interest rates, manufacturing onshoring and increased energy demand. The median first quarter 2025 return of our universe of 50 purely regulated electric, gas and water utilities was an even stronger 9.0%. (Statistics in appendix)

After two decades of flat growth, U.S. electric demand is set for its fastest growth since the 1950-70s. The mega-cap tech companies (hyperscalers) are aggressively courting electric utilities to build the infrastructure to power mega-data centers, some of which use as much power as small cities. In addition, ongoing electrification and manufacturing onshoring are adding to electric demand. Regulated electric utilities benefit from selling existing power capacity, adding power capacity (including batteries) and upgrading/expanding the transmission and distribution network. Natural gas utility and midstream companies benefit from an expected increase in gas demand to power growth.
Politicians and public utility regulators support the investment for economic and tax base reasons, but also the greater demand helps overall customer affordability. The Trump administration has adopted a more economical approach to meeting electric demand, which means more gas-fired generation, nuclear development, and ongoing renewable development. We expect the relaxation of some environmental and regulatory rules to help infrastructure development. However, potential changes to the 2022 Inflation Reduction Act (IRA) clean energy tax credits continue to concern investors in clean energy stocks. Utilities have shifted to expansion mode, driving higher capital investment, rate base growth, EPS growth, and consolidation. Our near-term utility outlook is favorable is based on the potential for higher EPS growth amid a slowing economy and a lower yield curve.

TOP TEN REASONS TO OWN UTILTIES: SUPPORTING THE POWER SURGE
1) Electric demand growth to accelerate driven by data centers, electric vehicles and manufacturing onshoring.
2) Policy makers (politicians, society) supportive of infrastructure investment because AI is considered a national security and defense issue.
a. New Administration to ease environmental rules and regulations.
b. Societal push for clean energy to continue and Inflation Reduction Act/Net Zero standards to drive clean energy investment for decades.
3) Long runway of rate base investment (infrastructure investment).
4) Consolidation/Takeover could accelerate due to existing assets being more attractive.
5) Healthy earnings and dividend growth potential (5-7%) could ramp up.
6) Reasonable valuation of 17x 2025 P/E multiple.
7) Competitive current return of 3.4%.
8) Financial engineering, including ongoing consolidation.
9) Potential for lower interest rates & economic slow-down.
10) Defensive profile insulated from tariff impacts.
CONCERNS
– AI data center related electric demand growth proves to be way too optimistic.
– Potential for higher interest rates.
– Equity raises to fund growth (In 2025, ETR, AEP, and more to come)
– Some utilities could mismanage growth.
– Weather event risks, particularly wildfires.

NEW ADMINISTRATION SHUFFLING THE DECK BUT UTILITY HAND IS EVEN STRONGER
Many of the Trump administration policy changes could benefit utility stocks, including less environmental regulation, manufacturing-onshoring and easier siting/permitting/development rules. As domestic regulated monopolies, utilities are generally insulated from the impact of tariffs, but relative stock performance could benefit from a slower US economy. On March 19, 2025, the FOMC downgraded its collective outlook for economic growth to 1.7% (from 2.1%) largely to reflect tariff impacts.
In 2025, the Ten-Year US Treasury Yield declined modestly to 4.23%, from 4.58%, at year-end 2024, but the entire yield curve remains elevated relative to the past two- decades. In the second half of 2024, the Fed lowered its overnight rate by 100-basis points to 4.25-4.50%, from 5.25-5.50%. Future cuts will depend on the data, but expectations are for at least two more rate cuts in 2025 (25-basis points each). A lower yield curve would benefit utilities via lower capital raising costs, higher valuations, and some customer bill mitigation. Further, lower short-term US treasury yields would improve the defensive appeal of utility stocks and their 3.5% median current returns (9-11% total returns).

ELECTRIC DEMAND GROWTH FASTER THAN INFRASTRUCTURE BUILD
After two decades of flat growth, most industry experts (consultants, investors, analysts, utilities) expect a rapid acceleration of electric demand. Even with uncertain variables like double-counting data centers, “deep-seek” – related efficiencies, and economic strength/weakness, electric demand will likely outpace the industry’s ability to build infrastructure. Based on actual announcements, we forecast roughly ~50 GW’s of data center demand will be added by 2030 with nearly 25-GW’s already contracted. As a result, electric demand grows 2.0-2.5% in 2025 and accelerates to 3-4% in 2026-2028 driven by more and larger data centers, EV-adoption and onshoring activity. Exhibit 3 highlights that the more recent US power demand forecast (55% over 2020-2040) have increased from previous forecasts.

HIGHER SALES-HIGHER CAPITAL INVESTMENT-HIGHER RATE BASE GROWTH! HIGHER EPS?
In recent weeks, some of the nation’s larger electric utilities have updated/highlighted material sales growth outlooks. In February 2025, American Electric Power (AEP) outlined its expectation for 20 GWs of data center demand by 2030 and annual retail sales growth of 8.8%, 8.4% and 8.9% (including commercial sales growth of 23.9%, 19.0% and 16.1%) in 2025, 2026 and 2027. Over 2025-2029, Southern Company forecasts 8% retail sales growth and 10 GWs of new data center demand. Entergy expects 6-7% annual retail sales growth (12-13% industrial sales growth) and 35 TWH of new industrial demand (more than half data centers).
While these are some of the leading beneficiaries, nearly every electric utility is experiencing above-average demand growth. Some electric utilities are nearly doubling their size (rate base) over the next five years. IDACORP sees 8.3% retail sales growth and 17% annual rate base growth. While current data center demand has been more focused on VA, PA, TX and CA, the Midwest, Southeast and many other regions plan large data center load. In addition, a growing number of gas utilities (ATO, OGS, NFG, WTRG, NWN, SWX) highlighted potential datacenter-related opportunities as natural gas has returned to political favor.

In 2024, electric and gas utility EPS grew nearly 9% driven by stronger sales growth and rate relief. Based on Thomson One consensus EPS estimates, utilities are expected to grow EPS 6.7% over 2024-2027. Regulated utility managements of 16 utilities target “5-7%” EPS CAGR, 14 target “6-8%”, 5 target “7-9%”, and one targets “6.5-7%”. PCG and CEG target 9% and 10% growth, respectively (Table 2). Most utility managements have been able to offset the higher cost of capital, rising expenditures and inflation with costs controls. However, First Energy (FE) and Sempra Energy (SRE) negatively surprised investors on year-end calls with strong EPS growth from a lowered base year.
On fourth quarter 2024 (January/February 2025) conference calls, most utility management teams expressed an “upward bias” to EPS outlooks based on the on higher capital budgets and accelerated electric demand. Entergy (ETR) raised its EPS growth target to “greater than 8%”. Others appear to have tailwinds necessary to raise expected growth rates over the next few years.


CARDS SHUFFLED AND NATURAL GAS BACK IN FAVOR
Meeting growing electric demand will require huge investment in the electric and gas grid as well as an “all of the above power” strategy (nuclear, gas, renewables, batteries and coal as a bridge). Trump administration policies place strong emphasis on the economics of energy development and minimal emphasis on carbon reduction.
U.S. Energy Secretary Chris Wright has called for “energy addition, not subtraction” and new EPA Chief Lee Zeldin has ordered reconsiderations of several EPA standards and regulations, which is likely to lead to new gas plants and coal plants life extensions. FERC Chairman Mark Christie publicly acknowledges the necessity of gas-fired power, the constraints of nuclear plants, public aversion to new coal, and intermittency of renewables. The new DOE has approved three LNG terminals and Trump has publicly called for the revival of previously-terminated large interstate pipeline projects like Constitution (Appalachia to New York). Natural gas has returned to favor and demand growth for datacenter power could be meaningful.
Even with important political support, building energy infrastructure is fraught with challenges and delays. The waiting period for new generation to interconnect on an existing transmission is 3-7 years and new lines require extensive siting, permitting and other regulatory reviews. Over the past several years, new natural gas plants had fallen out of favor and leading manufacturers (GE/GE Vernova, Siemens and Mitsubishi) stopped making them. New gas-fired turbine orders are on the rise, but the lead time for is now 4-5 years as manufacturing capacity, supply chain and contracted labor deplete. In addition, new gas-fired combined-cycle power costs $2.400/kw (3X the cost just 5-years ago). Further, the new administration has yet to address the 2022 Inflation Reduction Act (IRA) and the numerous 30-40% investment and production tax credits that help make projects more affordable.
UNCERTAIN TAX CREDITS, BUT CLEAN ENERGY TO DOMINATE NEW BUILD
Clean energy indices (ICLN -14% and TAN -25%) and renewable developer stocks (NEE -9% and AES -19%) have underperformed since November 5, 2024, reflecting IRA uncertainty. We do not expect tax credit clarity until a budget reconciliation bill is passed sometime mid-year 2025. Despite the uncertainty, renewables and battery storage dominate the new build market because they are economical regardless of tax credits and can be brought to market quicker than new gas or nuclear. Renewables are easier to site, permit and build than gas plants.
In 2024, the US added 46.2 GWs of new power capacity (~1,200 GW’s existing) and 94% of its was renewable or battery storage assets. (S&P Global Market Intelligence data).

The 10 largest owners of planned solar and wind resources expect to add 98.3 GWs of capacity through 2029, including 60.8 GWs of solar (NEE, EDF, AES, Invenergy) and 37.4 GWs of wind (Pattern, NEE, EDF, Orsted, Invenergy, Dominion). Through the end of the decade, 165 GWs of energy storage, onshore wind and solar photovoltaic projects that have been planned or permitted are expected to come online in the US, according to S&P Global Commodity Insights data.

We expect some changes to the IRA, including a halt to new offshore wind projects. However, offshore projects under construction, including Sunrise, Revolution, Vineyard 1, Coastal Virgina Offshore Wind have full support and endorsement from the states (VA, CT, NJ, NY, MA) and will likely move forward.
We agree with consensus (utility executives & power industry players) that clean energy (wind, solar, and battery storage) tax credits are at less risk because republican-led states (Texas and Florida) benefit disproportionately (80%/20%) from the economic development and thin republican margins in the Senate (53-47) and House (217-215). On March 9, 2025, 21 House members signed a letter supporting the credits and transferability provisions. Further, clean energy has significant societal support, state mandates and corporate ESG backing.
IRS’s “safe harbor” provision allows projects that have begun work (undertaken >5% of the project cost) to qualify for tax treatment under existing law. There are currently more than 70 GW of renewables and battery projects under construction (and tax-credit eligible) and many in earlier stages of development that have safe-harbored equipment to assure tax credits. As a result, renewables and clean energy will continue until gas-fired power and nuclear are available.
THE NUCLEAR OPTION SEEMS THE BEST BUT SEVERAL YEARS OUT
We expect a Nuclear Renaissance over 2030-2050 with support of federal, state and local governments, and, importantly, the megatech companies. Nuclear power is the most reliable form of power generation with capacity factors normally over 90% (meaning they run nearly all year long) and have a nearly zero carbon footprint. AMZN, GOOG, MSFT and META are pursuing nuclear power to fuel data centers and their financial resources offer enthusiasm for a nuclear revival. The US has 93 nuclear reactors (54 plants) in 28 states that generate roughly 19% of the nation’s power capacity, which compares to 104 nuclear reactors in 2013 and 20% of total US generation.
Southern Company’s Georgia Power’s Vogtle Units 3 and 4 (2023 and 2024) were the first new nuclear plants since Palo Verde (AZ) in the 1980s (TVA’s Watts Bar – 2016 excluded). Vogtle Units 3 & 4 were originally scheduled to be completed by 2016 and 2017, respectively, at a cost of $14 billion total. The final price tag was $30 billion, more than $16 billion over budget, and over six years behind schedule. The US probably will not add a large sale nuclear plant for some time, but existing nuclear plants will seek license extensions and some recently retired plants could return to service.
The existing non-regulated nuclear plants (depreciated and written-down) have become extremely valuable for their potential to be isolated with a “co-located” data center. However, the politics of supply and cost allocation have delayed the ability to contract. There are roughly 40 GWs of non-regulated nuclear power plants owned by CEG, VST, PEG (3), NEE (2), TLN (1) and D (1). In addition, recently (within 5- years) retired plants Three Mile Island Unit 1, Palisades, and Duane Arnold are being are expected to come back on line in 2028-2030.
Growing electric demand and the appetite for zero carbon power increases the likelihood that small nuclear reactors (SMR’s-300-MW‘s) become a reality. SMRs modular design is supposed to simplify construction, reduce timelines and require less land. The list of parties pursuing SMR’s is long and distinguished, including all hyperscalers, GE Vernova, Hitachi, major utilities, Bill Gates, Sam Altman. Several SMRs are in development and hope to be commercially viable in the early 2030’s, including by the following: NuScale (SMR), GE-Vernova (GEV), OKLO (OKLO), Kairos Power, Terra Power, Holtec, BWXT Technologies and X-Energy.
RECORD INVESTMENT (RATE BASE GROWTH) LEADS TO EPS GROWTH
In 2024, EEI member electric utilities invested $186.4 billion vs. $167.8 billion in 2023, which marks the twelfth consecutive year of record investment. Accelerated electric demand is leading to large increases in utility capital programs and rate base growth. Over the next several years, utility capital investment will continue to rise.

Investment is necessary across the board, including distribution ($51 billion, or 33%), generation ($37 billion, or 24%), transmission ($32 billion, or 20%), gas-related ($22 billion, or 14%) and other ($13 billion, or 8%). According to the DOE, almost 70% of electric infrastructure in North America is over 25 years old. Electric utilities are allocating a growing amount of capital to grid adaptation, hardening, and resilience (AHR) initiatives to make systems more resilient to hurricanes and wildfires.
AND EQUITY ISSUANCES
Utilities have ample ability to fund through operating cash flow, stock and debt issuances. Credit rating agency metrics reflect monopoly service areas, regulatory financial protections and the ‘public good’ nature of the product/service. The industry’s average parent-level rating has held at BBB+ since increasing from BBB in 2014.
Growing capital programs mean more equity issuances to fund growth over the next five years. In the first quarter of 2025, AEP issued $2.3 billion and ETR issued $1.3 billion. PCG issued large block $2.7 billion in December of 2024. We expect many more to come. Utility issuances can be accretive if issued above book value and regulators allow returns on the investment.
M&A: Utility and Energy Infrastructure Becoming More Valuable!
Since 1995, the U.S. electric and gas utility sector has been consolidating with over 155 acquisition announcements and 124 completed deals. Further consolidation is being pushed by even higher capital investment budgets and the benefits of economies of scale. The combination of accelerated energy demand and decarbonization results in double digit rate base growth and material debt and stock issuance. Smaller utilities with smaller balance sheets need help undertaking larger projects. Large global infrastructure players value the existing infrastructure, and an acquisition represents a ticket to participate in the growth potential.
In January 2024, BlackRock (BLK), the world’s largest asset manager agreed to buy Global Infrastructure Partners (GIP), the world’s largest infrastructure manager for $12.5 billion. Blackrock highlighted infrastructure as one of the most exciting investment opportunities owing to structural shifts, including de-carbonization, energy independence, domestic industrial capacity and on-shoring. Given accelerated power demand, energy infrastructure, (power generation, renewables, transmission, gas pipelines) has become increasingly valuable and development opportunities abound. Some recent announcements:
- On December 23, 2024, Iberdrola, (Madrid, Spain) closed on the acquisition of the last 18.5% ownership of Avangrid (AGR) for $35.75.
- On December 12, 2024, Energy Capital Partners closed on the purchase of Atlantica Sustainable Infrastructure PLC (AY) for $2.56 billion.
- On June 24, 2024, KKR acquired Emera’s interest in the Labrador Island Link, a 1,100 km high voltage transmission line in Newfoundland, Nova Scotia.
- On May 6, 2024, GIP and the Canada Pension Plan Investment Board agreed to acquire ALLETE (ALE) for $67.00 per share in cash (18% premium), or $6.2 billion including the assumption of debt. ALE owns/operates/develops renewables and multi-billion opportunities to build transmission assets.
- In late March 2024, VST closed on the acquisition of Energy Harbor’s nuclear (~4 GW) and retail businesses (~1 million customers). Energy Harbor owns the Beaver Valley 1 and 2, Perry, and Davis Besse nuclear plants and retail businesses. VST’s 2024 Adjusted EBITDA guidance is $3.7-4.1 billion (Energy harbor to add $700-900 million).
- In February 2024, GIP agreed to buy 50% of the South Fork and Revolution offshore wind (NY) projects from Eversource for $1.1 billion.
- In November 2023, CEG acquired a 44% stake in the South Texas Project Electric Nuclear Plant (STP), a 2,645- MW, dual-unit near Houston, TX, from NRG. Price implied 11.7x EV/EBITDA.
The ”Risk-On” Vs “Risk-Off” Performance See-Saw
Over the past few years, S&P industry sectors have been “see-sawing” in response to a fluctuating economic outlook as recession and inflation fears ebb and flow. In 2024, the S&P Utility Index returned 23.4% after being the worst performing of the S&P 500 Sector in 2023 (negative -7.1% total return). (Table 6). Expectations for a recession led to defensive stock out-performance in 2022, while a fear of missing out (FOMO) on the strong tech stock advances (exacerbated by the election) left utility stocks neglected in 2023. So far in 2025, a “Risk-Off” strategy in response to tariffs and economic slow-down have favored defensive and utility stocks. We consider many regulated utility stocks to be defensive growth.

We also highlight the poor total returns of the clean energy ETFs over each of the two years, with iShares Clean Energy ETF (ICLN) negative return of -25.7% and the Invesco Solar Index (TAN) negative return of -37.6% with recent underperformance driven by concerns that clean energy support has faded under a Trump/Republican administration.
Utility Stocks Trade at Reasonable Valuations
In 2025, utility stocks will benefit from their defensive characteristics given concern about tariffs and an economic slow-down. In addition, many electric and gas utilities could deliver higher EPS growth due to electric demand (and gas demand). Please see Table 7 for Utility Subgroup Metrics and appendix on page 10 for more utility stock financials.
- Electric utility valuation multiples have declined from 23x forward earnings in early 2020 and trade at 18.0X 2025 earnings estimates. Over the past twenty-five years, utility forward multiples have ranged between 10x and 23x earnings with a median of 16.8x.
- Independent Power Producers (IPPs), or merchant power companies, are highly leveraged to potential supply shortages. IPPs/merchants own power plants in non-regulated power markets, including PJM (Northeast/MidAtlantic), ERCOT (Electric Reliability Council of Texas), and CA, and provide marketing/power management services to customers. In 2023-24, the share prices of CEG, NRG, VST and TLNE rose dramatically and recent declines reflect concern about the economy, data center demand and political ability to co-locate plants next to data centers.
- Gas utility performance reflects improved investor sentiment and ongoing consolidation, but likely does not reflect potential increased gas demand. Gas utilities currently trade at 17.8x 2025 earnings estimates.
- Water utility two-year under-performance reflects the impact of higher interest rates on higher multiple stocks. Water utilities trade at the highest multiples due to their scarcity, small size, takeover premium, ESG value, and long-term growth potential through consolidation and privatization.
- Canadian electric and gas utilities have lower growth rates and higher current returns. Canadian provincial regulatory environments are more challenging (lower allowed ROEs and equity ratios) than many US utility jurisdictions.

Valuation
Over the past twenty years, electric utility multiples climbed from roughly 10x forward earnings to over 23x, driven by improving fundamentals, higher growth rates and lower interest rates from 2000-2022 (Exhibit 6). Electric utilities trade at ~16.6x consensus forward earnings estimates which is above (but near) the historical median.

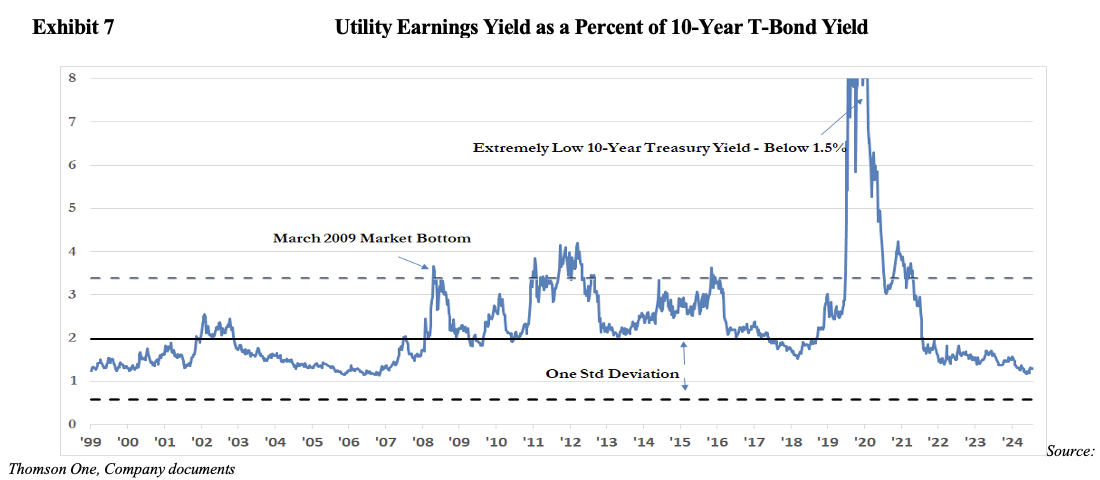
We consider the multiple attractive given higher utility earning growth rates and strong fundamentals. Given that long-term interest rates (specifically the 10-year and 30-year Treasury yields) have risen to 4.2% following a long-term secular decline since the late 1980’s, we measure the earnings yield (1/P/E) as a percentage of the 10-Year T- Bond Yield to gauge interest rate adjusted valuations. As can be seen in Exhibit 7, the current ratio of 135% indicates the sector P/E is modestly higher than its historical median relationship with the 10-Year T-Bond Yield.
Interest Rates and the Fed
Utility stocks are not bond proxies, and share prices are a function of earnings and dividend growth rates, but higher (lower) rates negatively (positively) impact stocks, given that future cash flows are impacted by the discount rate. In addition, current utility dividend returns become less compelling when returns on other investments increase, including Treasury yields. The current 6-month Treasuries yield over 5.0% and US Treasuries hold even greater defensive appeal than utilities. The factors below mitigate the negative impact of higher rates.
- Annual dividend hikes: Utilities target annual dividend increases, which serve to mitigate the negative impact of higher rates. In 2024, electric utilities increased the annual dividend by a median of 4.9%.
- ROE is set based on interest rates: A utility’s cost-of-capital, including equity returns (ROEs), is set by state PUCs and increases (decreases) as interest rates rise (fall).
- Annual riders minimize inflation risk: State PUCs and FERC regulatory principles have improved to include more frequent rate adjustments, which mitigate inflation risk.
- Utility stocks pay higher dividends than other sectors: The present value of a higher near-term dividend stream is less impacted by changes in interest rates than a lower near term dividend stream.
While utility dividend yields and 10-year U.S. Treasury yields are highly correlated and will likely remain so in the future, utility dividends have risen over time (most on annual basis) while the Treasury yield remains fixed. Utility stock prices, unlike Treasury bond prices, are likely to rise should earnings and dividends grow over time.
Conclusion
The utility sector offers a 3.4% current return and many utilities managements target 5-8% annual earnings and dividend growth. The utility business model represents a safer haven in the face of an economic slow-down, tariffs and/or inflation fears. In addition, accelerated electric demand provides support for EPS CAGR and the potential for even higher growth. We believe that the combination of strong utility fundamentals, and the potential for accelerated electric demand bode well for the relative performance of utilities.


Timothy M. Winter, CFA
(314) 238-1314
ONE CORPORATE CENTER RYE, NY 10580 Gabelli Funds TEL (914) 921-5100
This whitepaper was prepared by Timothy M. Winter, CFA. The examples cited herein are based on public information and we make no representations regarding their accuracy or usefulness as precedent. The Research Analysts’ views are subject to change at any time based on market and other conditions. The information in this report represent the opinions of the individual Research Analysts’ as of the date hereof and is not intended to be a forecast of future events, a guarantee of future results, or investments advice. The views expressed may differ from other Research Analyst or of the Firm as a whole.
As of December 31 2024, affiliates of GAMCO Investors, Inc. beneficially owned 7.09% of RGC Resources, 4.51% of National Fuel Gas, 2.82% of Southwest Gas, 2.18% of Northwest Natural, 1.58% of TXNM Energy, 1.49% of York Water, 1.04% of Black Hills, and less than 1% of all other companies mentioned.
One of our affiliates serves as an investment adviser to Hawaiian Electric or affiliated entities and has received compensation within the past 12 months for these non-investment banking securities-related services.
Funds investing in a single sector, such as utilities, may be subject to more volatility than funds that invest more broadly. The utilities industry can be significantly affected by government regulation, financing difficulties, supply or demand of services or fuel and natural resources conservation. The value of utility stocks changes as long-term interest rates change