US Utilities – Heating Up?
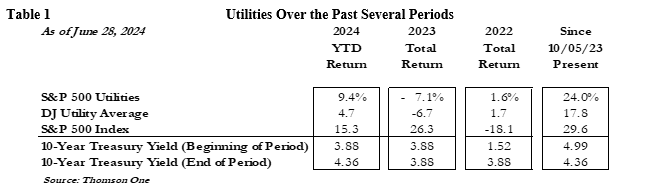
In the first half of 2024, the S&P Utility Index (SPU) returned 9.4%, which compared to the S&P 500 Composite’s return of 15.3%. (See Table 1). The SPU performance was heavily influenced by independent power producers, including Constellation Energy (CEG), Vistra (VST), and NRG Energy (NRG), as well as leading renewable developer NextEra Energy (NEE) and PS Enterprise Group (PEG). The potential for accelerated electric demand growth driven by technological innovation (artificial intelligence, data centers), electrification and manufacturing on-shoring led to a momentum shift into power stocks. Shares of non-regulated power plant owners and developers surged on the AI-data center theme. The median utility stock return was more muted as the 15-stock Dow Jones Utility Average returned 4.7% and the median of our universe of 50 electric utilities returned 4.5%.
After two decades of flat growth, US electric demand is on the verge of an acceleration not seen since the implementation of central air conditioning in the 1960-70’s. Some electric utilities have raised sales forecasts and grid operators have expressed concerns over potential shortages. In non-regulated power markets, Texas, New England, and the Northeast, merchant power plants benefited from selling power at higher market prices. Hyper-scalers (Amazon, Meta, Alphabet) are driving data center demand and require reliable (24/7/365), zero-carbon power (nuclear/wind/solar/battery storage). As a result, renewable developers (AES, NEE/NEP) have substantial opportunity to add wind, solar and battery storage and at enhanced margins.

Electric utilities will benefit from selling existing power capacity, adding power capacity (including batteries) and upgrading/expanding the transmission and distribution network. Efforts to meet growing demand and achieve de-carbonization targets enhance the favorable environment for regulated electric utilities. Public policy encourages infrastructure investment (rate base growth) and supports median 5-7% EPS CAGR targets. In 2024, lower inflation and lower gas prices have eased affordability headwinds. Surplus demand growth would further help mitigate customer bills by spreading costs over a greater sales base. Finally, the value of existing infrastructure has become more attractive to potential buyers and consolidation activity has picked up.
MACRO UPLIFT? – FED TARGETS RATE CUTS; ELECTION RHETORIC OVER SOON
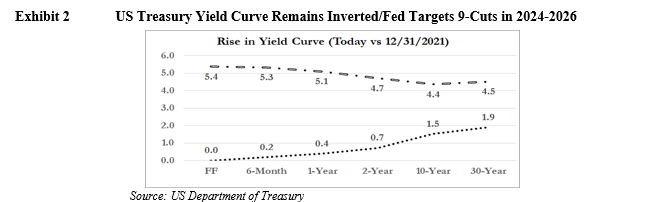
The Ten-Year US Treasury Yield rose to 4.4%, from 3.9% at year-end 2023, and the entire yield curve remains elevated relative to the past two-decades. Recent data indicates that the US economy may be slowing (1st quarter GDP revised to 1.3%), inflation has moderated to ~3% and the labor market cooled down. The Fed expects to lower the fed funds rate 5 times over the next eighteen months and nine times over the next two and a half years. Based on this forecast, short-term rates would be near 3.1% compared to 5.5% today. A lower yield curve would benefit utilities via lower capital raising costs, higher valuations, and some customer bill mitigation. Further, the lower short-term US treasury yields would improve the defensive appeal of utility stocks and their 4.0% median current returns (9-11% total returns).
Election-year rhetoric regarding climate change/energy policy concern some investors, but most utility executives and power industry players expect the transformation to a lower-carbon economy would continue in earnest under most election scenarios. Inflation Reduction Act (IRA) clean energy subsidies help the nation’s power needs and red states benefit from the subsidies. Many US states (~30) have renewable energy standards, including 22 with 100% clean energy targets. Texas is home to more renewables than any state in the nation and Florida has ambitious solar power plans.
TOP 10 REASONS TO OWN UTILITY STOCKS
1. Electric demand on verge of acceleration (AI + data centers + on-shoring + EV’s = Power Surge)
2. Utilities make more money by investing in infrastructure
- US (and world) need more energy, power and energy/utility infrastructure
- US (and world) public policy transforming to clean energy
- Retiring coal + intermittent wind/solar = supply concerns
3. Dynamics support long-term EPS and dividend growth
- 5-7% EPS and dividend CAGR targets
- 4.0% current return (9-11% total return)
4. P/E multiple (15.6x 2024E) vs historical range (10-22x)
- Relative P/E (Utility as Percent of S&P 500 is 80% vs range of (76-121%)
5. Ongoing consolidation (125 deals since 1995; 3 announcements in 2024)
- Allete (ALE) to be bought by Global Infrastructure Partners (GIP) for $67 per share in cash
- Avangrid (AGR) to be bought by 81.5%-owner Iberdrola for $35.75 per share
- Atlantica Sustainable (AY) to be bought by Energy Capital Partners for $22 per share in cash
6. Potential Consolidation Candidates (AVA, POR, IDA, MGEE, OTTR, PNM, NEP)
7. Recent and potential financial engineering
- Exelon (EXC)/Constellation Energy (CEG)
- MDU Resources (MDU)/Knife River (KNF)
- Southwest Gas (SWX)/Centuri (CTRI)
- Potential (OTTR, MDU, NFG, UGI, AQN)
8. Potential for lower yield curve (Interest rates)
9. Election year rhetoric over by year-end
10. Total return potential (4.0% Current return + 5-7% EPS CAGR) = 9-11%
UTILITIES TARGET STRONG EPS GROWTH CAGR’s
Based on Thomson One consensus EPS estimates, utilities are expected to grow EPS 6.6% over 2023-2026. Following first quarter 2024, managements of 18 utilities target “5-7%” EPS CAGR, 11 target “6-8%”, 2 target “7-9%”, and three target “6-7%”. PCG and CEG target 10% growth (Table 2). Most utilities managements have been able to offset the higher cost of capital, rising capital expenditures and inflation with costs controls. Accelerated electric demand growth would further support (even enhance) EPS CAGR targets.

ELECTRIC DEMAND TO ACCELERATE
After two decades of flat electric demand growth, most industry experts (consultants, investors, analysts, utilities) expect electric demand growth to accelerate. We loosely estimate that electric demand growth will approximate 2.0-2.5% (GDP growth minus efficiencies) in 2024-2025 and accelerate to 3-4% in 2026-2028 driven by more and larger data centers, EV-adoption and on-shoring activity. The electric utility sector was planning for electrification (EVs) and some manufacturing growth, but a more sudden and aggressive appetite from data centers and greater on-shoring activity has created in a significant wildcard variable. As can be seen in Exhibit 3, electric demand grew 9% from 2000-2020, and McKinsey and NextEra Energy forecast 38% power demand growth over the next two decades.

1. Data centers are increasing in number, size, and power intensity. Rising internet usage, videos, 3-D imaging and implementation of artificial intelligence (AI) is forcing technology hyperscalers (Amazon, Meta, Alphabet, etc.) to develop more, bigger and more power intense data centers. Data centers have grown dramatically in size from just a few MW’s to proposals of over 1,000 MW’s (equal to 500,000 homes). Consulting firms, agencies and power companies all forecast strong demand growth beginning in 2025-2026, including forecasts below:
- S&P Global – datacenter demand grows 85% to 61 GW’s and represents 10-12% of US electric use by 2028.
- Boston Consulting Group – datacenters could represent 7.5% of US electricity consumption by 2030.
- Electric Power Research Institute (EPRI) – datacenters consumption range from 4.6% to 9.1% of US electricity generation by 2030.
- McKinsey – data center demand CAGR of 15% over 2023-2030, which translates to 400 TWhs (60 GWs) or 8% of all U.S. power demand– up from 4% today.

2. New manufacturing facilities (computer chips, batteries). US manufacturing on-shoring is aided by incentives under the IRA and CHIPS Act. Some examples include the March 2024 Intel announcement of $8.5 billion in funding to build “fabs” in AZ, NM, OH and OR and an April 2024 TMSC announcement for $6.6 billion for TMSC to build a third “fab” in AZ.
3. Electrification. The public policy movement to replace technologies or processes that use fossil fuels (gas furnaces, boilers, internal combustion engines) with electrically-powered equivalents, such as electric vehicles (EVs) or heat pumps, will drive higher electric demand in some regions. The New England grid operator (ISO) expects heating electrification to turn the regional grid into a winter-peaking system sometime in the mid-2030s.
- The Edison Electric Institute (EEI) forecasts electric vehicle (EV) adoption to grow from 3 million EVs in 2022 to 26 million by 2030, creating a need for 140,000 EV fast charging ports, which would boost load by 1% annually. The Gabelli auto team expects annual electric vehicle sales in the US to grow from just over 1.4 million units to over 4.5 million units by 2030 and considers the electrification of the nation’s 290 million vehicles as inevitable.

PATIENCE PLEASE! BOTTOMS UP INDICATE INFLECTION POINT IN 2027
The pending power boom dominates industry discussion, but the June 2024 EIA energy outlook forecast only 3% U.S. generation growth in 2024 (and reflects warmer weather) and 2% in 2025. A Conference Board report noted that total electricity demand in the US has grown on average by about 0.6% annually since 2001, and previous concerns about a rapid rise in electricity demand tied to newer technologies, such as smartphones and internet usage, did not materialize. The Conference Board acknowledged that “this time might be different” and demand projections by utilities are “consistent with the sizeable investments in data centers and other technologies.” Hyper-scalers and manufacturers require lead-time to secure locations, grid connection, power contracts, permit and construct facilities. New larger proposed data centers would likely begin operating in 2026-2028 timeframe.
According to Grid Strategies, the US forecast of electricity demand is likely underestimated and highlights that recent year-over-year 5-year forecasts rose from a cumulative 2.6% to 4.7% growth (2023 FERC filings) with the more recent cumulative forecast for demand growth of 38 gigawatts (GW) through 2028.

Since 2023 FERC load forecast filings, several major electric utilities raised sales forecasts to reflect the needs of their customers.
- In the first quarter 2024, SO’s commercial sales grew 3.8%, including data center sales +12%, and total retail sales rose 1.7%. In February 2024, Southern Co. (GA, AL, MS) raised its 2025-2028 annual electric sales forecast to 6%, including Georgia Power’s to 9%, (previous forecast was 0-1%) with datacenters driving ~80% of the emerging load growth.
- Over 2024-26, American Electric Power forecasts total retail sales growth of 1.4%, 3.3% and 2.4%, including commercial sales growth of 4.5%, 7.6% and 4.1%. In 2023, AEP saw its OH commercial sales grow 7.8% primarily dominated by datacenters. Current service requests range between 10 GW to 15 GW of incremental load by 2030. The large 11-state utility intends to update its load forecast in the Fall 2024
- On June 25, 2024, NiSource (NI) disclosed ~2.6-8.6 GW of potential load growth in its NIPSCO service area primarily from data centers, (previous forecast was 2.3-2.5 GW). The utility highlighted 30 data center inquiries and 6 active projects being studied (~8.6 GW by 2035), which requires a material capacity buildout.
- At its June 7, 2024 Analyst Day, Entergy (ETR) forecast 8-9% industrial sales CAGR from 2023-2028 driven by data centers and Gulf Coast industry (chemicals, gases, transportation). The utility noted 5-10 GW’s of hyperscale data centers not in its base plan.
- In November 2023, WEC Energy Group raised its 2026-28 annual electric demand growth forecast to 4.5-5.0%, from 0.7%, to reflect data center and technology demand. Microsoft plans a $1 billion data center near Milwaukee on a science/technology hub developed in collaboration with Foxconn.
GROWING LOAD CAN HELP IMPROVE AFFFORDABILITY
Regulated utilities and retail customers (residential & commercial) benefit from higher sales and revenues, but also by spreading fixed costs over a larger sales base. The integration and cost allocation of serving large industrial load will be an important consideration by regulators and consumers advocates In Exhibit 7 , PG&E (PCG) outlines that its expected addition of data centers would lower customer bills by 1-2% and electric vehicles by an additional 2-5%.

Several utilities have filed for special rates or rate re-designs to protect customers and offset infrastructure costs necessary to serve the added load. American Electric Power Co.’s Ohio and Alliant Energy’s Iowa utility requested a new billing category for data centers and crypto- mining designed to protect customers.
WHERE ARE DATA CENTERS AND WHERE ARE NEW ONES GOING?
As of March 2024, the Electric Power Research Institute (EPRI) counted 10,655 datacenters worldwide, with about one-half in the US. The world’s largest datacenter market is in Dominion Energy’s Loudoun County, VA service area where 94 datacenters require nearly 4 GW of capacity. Favorable areas for data centers are in areas with ample power capacity, excess transmission and strong fiber networks, including Northern VA, Silicon Valley CA, Dallas, TX, Phoenix, AZ, Atlanta, GA and Portland, OR.

Many proposed data centers are significantly larger (as large 1,000 MW’s) than existing data centers (10-50 MW’s), and require more infrastructure, including reliable power (24/7/365), grid access and grid redundancies. They would prefer to be near dedicated zero-carbon power plants (nuclear/wind/solar/battery storage), which makes nuclear plants ideal. Nuclear power generation can deliver 24/7/365 reliability with zero carbon emissions. However, traditional regulated utilities own most of the nation’s nuclear plants and cannot be “pulled’ from customers to sell directly to hyper-scalers.
Hyper-scalers are exploring locations with nearly every utility across the US and want to move quickly given the competitive environment of AI. S&P Global estimates that Texas (specifically the Dallas-Fort Worth Metropolitan Area) and Virginia (Northern Virginia/ metropolitan DC region), which are served by Dominion Energy and Sempra’s (SRE) Oncor, will experience strong growth.

We consider the Midwest (upper and lower), Texas, Mid-Atlantic, Southeast and South-Central to be regions with power capacity, transmission access and favorable business climate to attract data centers. In June of 2024, Alphabet announced $2.3 billion in investments in three data centers in Columbus, Ohio (American Electric Power) and Amazon’s bought 400 acres in the same area. The area is attractive due available land, power, reasonable electric rates and an interregional 765kv transmission backbone running from IN to VA. In February 2024, Entergy (ETR) announced that Amazon Web Services planned to locate a $10 billion data center campuses in MS. We consider the Northeast and New England (except for Pennsylvania) to be less favorable given challenges adding infrastructure and tighter supply margins.
US POWER EQUATION SEEING COAL AND GAS RETIREMENTS
In 2023, the US had ~1,200 GWs of power capacity, including 215 GWs of renewables (74 GWs of utility-scale solar (6%) and 141 GWs of wind capacity (12%). Natural gas represented 42% of output, nuclear 19%, coal 17%, wind 11%, hydro 6% an solar 4%. By 2025, EIA forecasts coal will decline to 15%, natural gas to 41%, while solar rises to 7% and nuclear 19%, wind 11%, hydro 6% stay flat.

Based on planned retirement schedules, coal’s rapid decline will continue, and all new capacity will be renewable, battery-storage and/or natural gas-fired (excluding the 2.2 GWs Vogtle nuclear expansion scheduled for 2023-24). Over the past decade, less-efficient nuclear (13 retirements since 2013) and gas power plants were retired and replaced with highly efficient natural gas plants and renewable generation.
POWER DEMAND TO EXCEED SUPPLY
Over the near-term, the tech sector’s power appetite could prove to be too much for the realities of the slower moving power network. US power demand was already forecast to increase due to EVs & re-shoring of manufacturing with tight conditions due to the great power transformation from coal to renewables. According to NERC’s Annual Long-Term Reliability Assessment-December 2023, the Northeast and Western half of the U.S. face an elevated risk of blackouts in extreme weather conditions and parts of the Midwest and Central South areas could see power supply shortfalls during normal peak operations. To address the growing risk, NERC recommends new gas capacity and transmission investment.

WHO HAS “NON-REGULATED POWER’ TO SELL?
Independent Power Producers (IPPs), or merchant generators, are the most leveraged to potential supply shortages. IPPs/merchants own power plants in non-regulated power markets, including PJM (Northeast/MidAtlantic), ERCOT (Electric Reliability Council of Texas), and CA, and provide marketing/power management services to customers. In 2023-24, the share prices of CEG, NRG, VST and TLNE have risen dramatically. Table 3 for financial and market data.

Texas (ERCOT) expects to continue to see well-above average load growth and Winter Storm URI highlighted the potential power and gas price volatility that could benefit merchant power players. Given favorable subsidies and contracts, nearly 30% of state capacity is intermittent renewable energy. ERCOT projects reserve margins get extremely tight, and the state legislation created the Texas Energy Fund (TEF) to encourage more reliable gas-fired generation. As of June 27, roughly 56 GW’s of proposed gas-fired capacity applied, which represents over 30% of existing 145 GW’s of capacity. The TEF is only set-up to cover 10 GWs but legislators are considering expanding the program. Largest owners of TX merchant power plants below:

IPPs and merchant power companies are higher risk than utilities and highly correlated to commodity prices (power prices). Since 1995, the sub-sector IPPs has experienced “boom-bust: periods and bankruptcies of key players, including AES, Enron, Dynegy, Mirant, Calpine, NRG, Talen. As a result, private equity owns many of the nation’s non-regulated power plants. Further, regulatory frameworks have evolved to promote cleaner energy and lower carbon emissions, which hampers the long-term value of fossil-fired IPP assets.
THE NUCLEAR OPTION SEEMS THE BEST BUT SEVERAL YEARS OUT
Nuclear power is the most reliable form of power generation with capacity factors normally over 90% (meaning they run nearly all year long) and have a near zero carbon footprint. The US has 93 nuclear reactors (54 plants) in 28 states that generate roughly 19% of the nation’s power capacity, which compares to 104 nuclear reactors in 2013 and 20% of total US generation. Prior to the 2022 IRA, several older nuclear units retired as low gas prices (and therefore power prices) made them uneconomic. However, the IRA provided a floor price via production tax credit of ~45/MWH and an increased focus on data center/zero carbon power has breathed new life into the future of nuclear power.
These strong attributes (zero-carbon, reliable, economies of scale) augur for building more nuclear plants. However, the challenges of building new nuclear capacity are significant and there have only been two nuclear units built in US over the past 40-years. Southern Company’s Georgia Power’s Vogtle Units 3 and 4 (2023 and 2024) were the first new nuclear units to come online in the U.S. since Palo Verde (AZ) in the 1980s (TVA’s Watts Bar – 2016 excluded). Approvals from the Nuclear Regulatory Commission (NRC), permitting, planning, and construction takes several years, and the costs are often underestimated. Vogtle Units 3 &4 were originally scheduled to be completed by 2016 and 2017, respectively, at a cost of $14 billion total. The final price tag was $30 billion, more than $16 billion over budget, and over six years behind schedule.
- The Nuclear Shot Heard Around the World: On March 4, 2024, Talen (TLNE-90-OTC) announced a deal to sell its digital infrastructure campus (data center and crypto mining facilities) to Amazon Web Services Inc. for $650 million. The campus is adjacent to its Susquehanna nuclear plant (2,200 MW’s) near Berwick, PA, which allowed TLNE to directly supply 960 MW of zero-carbon power to the data center campus. On June 24, 2024, AEP and EXC requested FERC hold hearings about potential cost shifting (pulling load of system) that harms utility customers. Should FERC approve, the Talon/Amazon deal increases the value of merchant power plants (especially nuclear) as hyper-scalers are less price elastic and could contract directly. There are roughly 40 GW’s of non-regulated nuclear power plants owned by CEG, VST, PEG, NEE, TLN and D.
- Small Nuclear Reactors Could Be the Power of the Future: The US probably will not add a large sale nuclear plant for some time, but existing nuclear plants will seek license extensions and some recently retired plants could return to service. Further, the appetite for zero carbon power increases the likelihood that small nuclear reactors (SMR’s-300-MW‘s) become a reality. To date, the NRC has certified one small reactor design, NuScale Power (SMR), which took a decade and cost $500 million. Below we highlight some entities pursuing SMR’s:
– NuScale Power Corporation (SMR) (Portland, OR
– Terra Power (Bill Gates, founder, funder and Chair)
– Holtec International,
– GE/Hitachi (GEH)
– X-Energy, a start-up in Maryland,
– Westinghouse (owned by Brookfield and Cameco)
THE US PLANS TO ADD LOTS AND LOTS OF WIND, SOLAR and BATTERIES
From 2024-2028, 112 GW’s of capacity (mostly coal) is scheduled for retirement. In 2023, the US added 46.0 GW (38.5 GW generation and 7.5 GW storage) of new capacity online in 2023, including 19.4GW’s of solar, 11.1 GW’ of gas, and 6.3 GW’s of wind.
1 Terawatt (TW) = 1,000 Gigawatts (GW) = 1,000,000 Megawatts (MW) / 1 MW = ~ 500 homes
As of April 2024, proposed new capacity for 2024-2028 totaled 370 GW’s (63% solar, 26% wind, and 9% gas). Another 130 GW’s of energy storage, including 72.8 GW’s of battery storage, is expected 2024-2028.

Wind and solar power is intermittent with capacity factors between 30-50% compared to gas and coal, which are much higher. As a result, more renewable capacity is need to replace coal and gas-fired power. Over 2024-28, S&P Global forecast 328 GW of new wind and solar energy will be added in the US market, complemented by 37 GW of battery storage. The nation’s largest power developer, NextEra Energy (NEE) forecasts that US total power capacity (all sources) needs to nearly double from 1.2 TWs in 2020 to 2.1 TW’s by 2040. (see Exhibit 13)

Over the past two decades, renewable power technology and economics have improved dramatically. In addition, the 2022 Inflation Reduction Act (IRA) provides tax incentives to encourage accelerated clean energy investment through at least 2032. NEE highlights that renewables are lower cost (Onshore wind $25-50; Solar $40-60; CC gas $70-85; SMR $115-140; CC Gas with CCS $115-125) than other types and can be deployed quicker. As such, NEE expects US renewable output to represent 43% of total fuel mix by 2030 (18% today).

WHO’S BUILDING THE CLEAN POWER?
Tighter power markets, increasing renewable portfolio standards and growing demand specifically for clean power makes for a very favorable renewable development market. NextEra Energy (NEE) is the largest renewable owner (34 GW’s), and expects to add 36.5-46.5 GW’s over 2024-2027, including 2024-25 14.1-17.1 GW’s (7.4-8.3 GW’s solar/3.5-4.4 GW’s of wind; 2.6-3.5 GW’s of storage) and 22.4-29.4 GW’s in 2026-27 (5.5-7.1 GW’s wind; 11.1-14.1 GW’s of solar; 5.2-7.2 GW’s storage. Other large owners, include AES Corp (owns 18 GW’s; 13 GW backlog; and 66 GW project pipeline), Berkshire Energy, Brookfield, and Iberdrola/Avangrid and private developers Invenergy, Apex, and Hecate.

LONG WAITING LIST TO CONNECT NEW POWER TO GRID
Power developers have aggressive plans but face long waiting lists (often 3-7 years) to interconnect to the grid. As of April 2024, the US had more than 2.2 TW of interconnection queue capacity seeking to connect to the grid and renewables accounted for over 94%, according to Regulatory Research Associates. The transmission system was not designed to handle massive renewable additions, particularly given wind/solar intermittency. In March, the FERC largely affirmed a final rule to address that backlog, with reforms establishing a new penalty regime for missed interconnection study deadlines and tougher financial requirements for developers. The ability to site new renewables is key to successful development, which entails not only finding locations where the wind/sun resources are strong, but near transmission/substation interconnections, and a constructive local planning council. NEE and AES highlight competitive advantages of scale, experience and access to technology as well as site locations.

RECORD INVESTMENT (RATE BASE GROWTH) YEAR-AFTER-YEAR LEADS TO EPS GROWTH
In 2023, EEI member electric utilities invested an estimated $167.8 billion, which marks the eleventh consecutive year of record investment. This compares to an estimated 2022 record investment of $150.8 billion ($136.6 billion in 2021) in utility infrastructure, including distribution ($51 billion, or 33%), generation ($37 billion, or 24%), transmission ($32 billion, or 20%), gas-related ($22 billion, or 14%) and other ($13 billion, or 8%). Over the next several years, utility capital investment will continue to rise.
- Clean energy transformation (coal retirements, on/off-shore wind, solar, and storage).
- Electric transmission and distribution (grid modernization, hardening, undergrounding).
- Electrification, EV charging, efficiency, etc.

Electric utilities are allocating a growing amount of capital resources on power grid adaptation, hardening, and resilience (AHR) initiatives to make systems more resilient to hurricanes and wildfires. According to the DOE, almost 70% of electric infrastructure in North America is over 25 years old. In 2023, EEI member utilities invested $57 billion in electric distribution and $30.7 billion in electric transmission compared with $51.3 billion and $31.7 billion in 2022.

Utilities have ample ability to fund through operating cash flow, stock and debt issuances. Credit rating agency metrics reflect monopoly service areas, regulatory financial protections and the ‘public good’ nature of the product/service. The industry’s average parent-level rating has held at BBB+ since increasing from BBB in 2014. Electric utility industry credit quality has generally improved over the past decade.

State Public Utility Commissions As Important As Ever For EPS Growth
Utility regulation generally remains supportive of investment, but some PUCs are more constructive than others. See Exhibit 20. Many jurisdictions have adopted changes to rate design, such as forward test years, rate mechanisms and adjustment clauses to allow timely recovery and return on costs associated with various capital investment programs (environmental, pipe replacement) and weather normalization. The allowed returns on equity (ROE) set by PUCs play a major role in utility earnings growth.

In the second half of 2023, a handful of disappointing rate cases, including Illinois electric and gas cases for Ameren (8.72%) and Exelon (8.94%) and Avangrid’s United Illuminating (9.0%) in Connecticut. On a positive note, several larger utilities saw jurisdictions raise allowed ROEs, including North Carolina (Duke Energy 10.1%, from 9.6%) and California (PG&E/10.70%, SCE/10.75%, SDG&E/10.65%) experienced a formulaic ROE increase by 70 basis effective January 1, 2024. In addition, Georgia approved a rate settlement to recognize the over-budget Vogtle Nuclear Units, and several other cases were generally constructive.
ALLOWED ROE’S TICKED UP “SLIGHTLY’ BUT ROE SPREAD TO RATES NARROWED
Rate case activity reached record-high levels in 2023, with nearly 165 decisions (106 electric or gas equity return determinations) driven by inflation, interest rates and growing utility capital spending plans. A general rule of thumb is that State PUC’s and ratepayers will tolerate 2% -4% bill inflation per annum and rate requests above that will be mete with controversy.

In the first quarter of 2024, the average authorized ROE for electric utilities rose modestly to 9.66% (12 cases), above the 9.60% for the year 2023 (63 cases) and 9.54% (53 cases) for the full year 2022. For gas utilities, the Q1 2024 average ROE was 9.78%, up from the9.64% for 2023 (9.53% average 2022). In 2023-24, utility allowed ROEs rose modestly as a function of interest rate after declining over the past 30-years. The spread between the allowed-ROE and the 10-year U.S. Treasury yield is currently 530-basis points, and it has ranged between 500-900 basis points over the past few years. During the 1990s, the utility sector averaged roughly 400-600 basis points spread. PUCs historically have taken a gradual and measured approach to changes in authorized ROE levels.


LONG TERM TRANSMISISSION PROJECTS EARN FERC FORMLA RETURNS
Investment in the electric grid has become a national infrastructure priority because its upgrade is required to support zero carbon power, reliability and data centers. FERC regulated transmission projects are priorities because of generally higher ROE’s and favorable forward-looking formulaic rate treatment. In 2023, EEI member utilities invested $30.7 billion in electric transmission compared with $31.7 billion in 2022. The Midwest Independent System Operator (MISO) is leading the transmission upgrade process with its $100 billion long-term planning projects (LTRP), and awarded/approved Tranche 1 (2022) transmission projects, totaling $10.3 billion and spanning IA, IL, IN, MI, MN, MO and WI. Winning bidders, included:
- Ameren (AEE) – $1.7-1.8 billion
- Xcel Energy (XEL) – $1.0-2.0 billion
- Fortis (FTS) – $1.0-1.5 billion
- WEC Energy Group (WEC) – $800 million.
The projects are expected to be in service in 2028-2030. LRTP projects help accommodate the influx of renewables needed to meet state and utility clean energy goals. We expect Tranche 2 multi-billion projects to be awarded in late 2024. The ISO New England electric grid expects $1 billion in annual transmission investments through 2050 to support the clean energy transition and could still face potential resource adequacy challenges. NE-ISO is attempting to integrate 40 GW of resources in the ISO’s interconnection queue, 46% of which are battery storage. Over the next few years, we expect FERC to solidify numerous policy directives and incentives, including ROE methodology, transmission planning and the interconnect process, as well as the need to alleviate the clean energy logjam, and gas pipelines
Infrastructure Becoming More Valuable! Buyers Circling the Wagons;
In January 2024, BlackRock (BLK), the world’s largest asset manager agreed to buy Global Infrastructure Partners (GIP), the world’s largest infrastructure manager, for $12.5 billion. Blackrock highlighted infrastructure as one of the most exciting investment opportunities owing to structural shifts, including de-carbonization, energy independence, domestic industrial capacity and on-shoring.
In the first half of 2024, Blackrock/GIP and other investment giants KKR & Co. Inc., Brookfield, and Energy Capital Partners LLC announced acquisitions of renewables platforms and utilities. Given accelerated power demand, energy infrastructure, (power generation, renewables, transmission, gas pipelines) has become increasingly valuable and development opportunities abound. Some recent announcements:
- On June 24, KKR acquired Emera’s interest in the Labrador Island Link, a 1,100 km high voltage transmission line in Newfoundland, Nova Scotia. In addition, KKR agreed to buy Germany’s Encavis (7 GW by the end of 2027) renewable developer for $3 billion.
- On May 6, GIP and the Canada Pension Plan Investment Board agreed to acquire ALLETE (ALE) for $67.00 per share in cash (18% premium), or $6.2 billion including the assumption of debt. ALE owns/operates/develops renewables and multi-billion opportunities to build transmission assets.
- In late March 2024, VST closed on the acquisition of Energy Harbor’s nuclear (~4 GW) and retail businesses (~1 million customers). Energy Harbor owns the Beaver Valley 1 and 2, Perry, and Davis Besse nuclear plants and retail businesses. VST’s 2024 Adjusted EBITDA guidance is $3.7-4.1 billion (Energy harbor to add $700-900 million).
- In February 2024, GIP agreed to buy 50% of the South Fork and Revolution offshore wind (NY) projects from Eversource for $1.1 billion.
- On May 28, Energy Capital Partners agreed to buy Atlantica Sustainable Infrastructure PLC (AY) for $2.56 billion.
- On May 17, Iberdrola, (Madrid, Spain) , agreed to buy the 18.5% ownership of Avangrid (AGR) for $35.75.
- In November 2023, CEG acquired a 44% stake in the South Texas Project Electric Nuclear Plant (STP), a 2,645-MW, dual-unit near Houston, TX, from NRG. Price implied 11.7x EV/EBITDA.
Activism
- On April 22, 2024, SWX issued 14.3 million shares of CTRI at $21 per share and privately placed 2.6 million shares to Ichan. SWX owns 81% of the outstanding 88.5 million shares valued at roughly $1.6 billion, or $22 per SWX share. Icahn owns 10.8 million shares and Corvex owns 4.1 million.
- On May 15, 2023, Elliott announced its ownership and recommendations to NRG Energy outlining a path to shareholder value after meaningful under-performance. Elliott owns 13% of shares.
- Ichan owns 5.3 million shares of American Electric Power (AEP)
We expect more acquisitions of renewable and other energy platforms, including entire utilities. Other acquisitive infrastructure players, include Blackstone, Macquarie, Argo, and Summit. Utility financial engineering (subsidiary acquisitions, spins, and/or divestments) remains active, but takeover activity of investor-owned utilities has slowed in recent years. Since 1995, the US electric utility sector saw over 155 acquisition announcements and 124 completed deals.

Merger activity declined during the pandemic-impaired 2020-21 COVID-19 era. In 2023, three deals were announced, one deal closed, and one agreement terminated. The three announcements were Dominion agreed to sell its natural gas distribution utilities to Enbridge, NextEra sold Florida City Gas to Chesapeake Utilities, and Entergy’s agreed to sell its Louisiana natural gas distribution business to a Baton Rouge-based private equity firm, Bernhard Capital. On February 1, 2023, Infrastructure Investment closed on the acquisition of South Jersey Industries (SJI) for an $8.1 billion enterprise value, or $36.00 per share (53% premium and ~15x EV/EBITDA multiple). The terminated deal was Avangrid’s acquisition (announced October 2020) of PNM Resources (terminated on January 2, 2024).
In 2023, several utilities pursued 20-49% equity interest sales, including completed deals: NiSource sold to Blackstone a 19.9% equity interest in NIPSCO (IN electric and gas utility) for $2.2 billion (i32.5x LTM P/E and 1.85x rate); FirstEnergy Corp. (FE) sold a 49% equity stake in FirstEnergy Transmission, LLC (FET) to Brookfield Super-Core Infrastructure Partners for $3.5 billion; and Duke Energy sold 20% of its Indiana utility to GIC Partners for $2.1 billion.
Investor-owned utilities prefer organic rate base growth (pay 1x rate base) to the takeover of rate base at a multiple of rate base. Regulated utility acquisitions can lead to a lengthy regulatory approval process and require onerous concessions. In addition, a higher cost of capital hampers some buyers’ willingness to engage. Most utilities are focused on ambitious investment programs then face challenges steering deals through a complex state and federal regulatory approval process. However, the sector remains ripe for consolidation as smaller companies face growing challenges to fund growth opportunities and need greater economies of scale.

The 2024/2023/2022 Performance See-Saw
In 2024, the S&P Utility Index has recovered 9.4% year-to-date after being the worst performing of the S&P 500 Sector in 2023 (negative -7.1% total return). (Table 5). Despite solid EPS track-records and outlook, utility stock performance continues to be hampered by the higher yield curve over the past thirty-months (2 1/2 years). Over 2022-24, S&P industry sectors have been “see-sawing” in response to a fluctuating economic outlook as recession and inflation fears ebb and flow. Expectations for a recession led to defensive stock out-performance in 2022, while a fear of missing out (FOMO) on the strong tech stock advances has left utility stocks somewhat neglected.

We also highlight the poor total returns of the clean energy ETF’s over each of the two years, with IShares Clean Energy ETF (ICLN) negative return of -24.7% and the Invesco Solar Index (TAN) negative return of -32.6%.
Utility Stocks Trade at Historical Discounts On Relative P/E
Higher interest rates explained much of the under-performance, but utility stocks were also impacted by handful of other developments, including concern growth targets could moderate due to higher cost of capital, wildfire issues, a December 2023 punitive Illinois rate decision, and uneconomic offshore wind projects.
Please see Table 6 for Utility Subgroup Metrics and appendix on page 21 for more utility stock financials.
- Electric utility valuation multiples have declined from 23x forward earnings in early 2020 to less than 16x 2024 earnings estimates. Over the past twenty-five years, utility forward multiples have ranged between 10x and 23x earnings with a median of 16.4x.
- The gas utility performance reflects recovered investor sentiment offset by greater challenges to maintain earnings outlooks. Gas utilities currently trade at 15.8x 2024 and 14.9x 2025 earnings estimates despite significant consolidation activity at higher multiples.
- The water utility under-performance reflects the impact of higher interest rates on higher multiple stocks. Water utilities trade at the highest multiples due to their scarcity, small size, takeover premium, ESG value, and long-term growth potential through consolidation and privatization.
- The six Canadian electric and gas utilities have lower growth rates and higher current returns. Canadian provincial regulatory environments are more challenging (lower allowed ROEs and equity ratios) than many US utility jurisdictions.

Valuation
Over the past twenty years, electric utility multiples climbed from roughly 10x forward earnings to over 23x, driven by improving fundamentals and higher growth rates (Exhibit 24). Electric utilities trade at ~15.0x consensus forward earnings estimates which is below the historical median. We consider the multiple attractive given higher utility earning growth rates and strong fundamentals.

Given that long-term interest rates (specifically the 10-year and 30-year Treasury yields) have risen to 4.3% following a long-term secular decline since the late 1980’s, we measure the earnings yield (1/P/E) as a percent of the 10-Year T-Bond Yield to gauge interest rate adjusted valuations. As can be seen in Exhibit 25, the current ratio of 175% indicates the sector P/E is modestly higher than its historical median relationship with the 10-Year T-Bond Yield.

Interest Rates and the Fed
Utility stocks are not bond proxies, and share prices are a function of earnings and dividend growth rates, but higher (lower) rates negatively (positively) impact stocks, given that future cash flows are impacted by the discount rate. In addition, current utility dividend returns become less compelling when returns on other investments increase, including Treasury yields. The current 6-month Treasuries yield over 5.0% and US Treasuries hold even greater defensive appeal than utilities. The factors below mitigate the negative impact of higher rates.
- Annual dividend hikes: Utilities target annual dividend increases, which serve to mitigate the negative impact of higher rates. In 2023, electric utilities increased the annual dividend by a median of 5.0%.
- ROE is set based on interest rates: A utility’s cost-of-capital, including equity returns (ROEs), is set by state PUCs and increases (decreases) as interest rates rise (fall).
- Annual riders minimize inflation risk: State PUCs and FERC regulatory principles have improved to include more frequent rate adjustments, which mitigate inflation risk.
- Utility stocks pay higher dividends than other sectors: The present value of a higher near term dividend stream is less impacted by changes in interest rates than a lower near term dividend stream.
- While utility dividend yields and 10-year U.S. Treasury yields are highly correlated and will likely remain so in the future, utility dividends have risen over time (most on annual basis) while the Treasury yield remains fixed. Utility stock prices, unlike Treasury bond prices, are likely to rise should earnings and dividends grow over time.
Conclusion
The utility sector offers a 3.9% current return and many utilities managements target 4-8% annual earnings and dividend growth. The utility business model represents a safe haven in the face of recession and/or inflation fears. In addition, the transformation of the utility sector from fossil fuel-fired to renewables provides the environment for strong annual earnings and dividend growth. We believe that the combination of strong utility fundamentals, and the potential for accelerated electric demand bode well for the relative performance of utilities.