With industry cross currents and economic uncertainty on investors’ minds, 21 leading automotive companies and their managements spent two days in Las Vegas at our 46th Annual Automotive symposium constructing an intellectual mosaic to help investors navigate the coming year within the automotive industry.
While the two primary “I”s on investors’ minds were Inflation and Interest Rates, a third “I” was nevertheless omnipresent as well: Innovation. Though every one of the presenting managements face some degree of external pressure, nearly every speaker over the course of our two days in Las Vegas discussed how recent investments in technology were helping companies perform in the current environment and prepare for days ahead.
This reflections piece attempts to capture the spirit of our symposium, initially with key analyst takeaways summarizing the two days. The report then delves into industry-specific data to frame the environment in which our companies operate. We conclude with takeaways on the companies themselves.
CHARGING FORWARD: MOVING TOWARDS AN ELECTRIFIED WORLD
Despite near term concerns about parts availability, labor shortages, inflation, and the impact of higher interest rates, our fireside chats overwhelmingly focused on the longer term prospects for the automotive ecosystem, where the rise of the Electric Vehicle remains the predominant opportunity (or challenge) for the industry.
We highlight below some of the major topics discussed, along with our thoughts on the future as the industry works through near term challenges with innovation and reinvention.
Exhibit 1 Wallbox EV Charger Content (Green)

• POINT 1: EV’S REQUIRE INVESTMENT
– It was clear in the minds of all participants that the EV Era would move forward unabated by broader macro and geopolitical conditions. Massive investment by OEMs on new models, coupled with accelerated rollouts of charging stations are set to be met by attractive and relatively affordable models that should increase BEV sales. The long term livelihood of nearly all of our presenters will be impacted by their ability to adapt to the EV world.
• POINT 2: SUPPLY CHAIN PAIN NOT OVER JUST YET
– While presenters spoke to some improvement in semiconductor chip availability and logistics, problems still persist across both the original equipment and aftermarket supply base to such a degree that production and shipping predictability remains incredibly difficult.
– As a result, low inventory – a factor that has contributed to help dealers reach all-time highs in per unit gross profit – will likely persist and keep the status quo for longer than anticipated.
• POINT 3: INFLATION BENEFICIARIES
– As expected, aftermarket parts retailers and distributors have been well positioned to pass along rising input costs in both DIY and DIFM channels as the less discretionary nature of most auto repair parts allows for pricing pass-through. OE suppliers have been less fortunate and have largely struggled with non-contractual cost increases that have accelerated over the past year.
• POINT 4: USED VEHICLE CHALLENGES, NEW VEHICLE OPPORTUNITIES FOR DEALERS
– Dealers must now contend with declining used vehicle prices – a double-edged sword, as the risks associated with declining prices may also make used vehicles more affordable and palatable for consumers and lead to greater unit sales.
LIGHT VEHICLE MARKET OUTLOOK:
Pressures to abate in 2023?
2022 began as a year of relative optimism, with hopes that chip shortages, and supply chain and labor challenges that beset the automotive industry for the better part of 2020 and 2021 would be subsiding. Instead, China’s “Zero-COVID” policy drove considerable shipping challenges earlier in the year, while Russia’s invasion of Ukraine caused massive disruption within the European wire harness industry beginning in March. When coupled with both raw material, labor, and purchased component inflation, what began as a year that showed some promise, has led to a highly challenging environment. Exhibit 2 (below) shows North American light vehicle production by month, with the inconsistent nature of production schedules apparent.
Exhibit 2 2020-22 NA Monthly Light Vehicle Production 2021-22

Source: Ward’s
The most visible sign of the impact inconsistent supply had on the industry was the lack of vehicle availability on US dealer lots. US consumers were not fully able to take advantage of low interest rates, high used vehicle prices and strong balance sheets during the first half of the year as the Seasonally Adjusted Annual Rate (SAAR) of sales for new vehicles was artificially constrained by a lack of production. Dealers spoke to a relatively healthy demand environment, but one simply without sufficient product to move. As we move towards the back half of 2022, the pivot by the Fed to raise rates, along with what is likely to be continued decline in used vehicle prices, has further clouded the demand picture.
Exhibit 3 US Monthly Light Vehicle SAAR 2021-22
(Millions)

Source: Ward’s
Dealer Inventory Remains at Historical Lows
The declines in light vehicle inventory that began in May 2020 and subsequently got worse throughout the remainder of that year and into 2021 only recently have abated to a small degree. Even with modest relief to the tune of an added 500,000 units at the end of October, dealer days’ supply stood at roughly 35 days vs. a pre-Covid “sweet spot” in the 55-60 day range.
Most dealers speak to a new environment where considerably more models are now purchased via order, with potential sales inhibited by lack of product.
Exhibit 4 US Monthly Dealer Inventory, 2020-22
(Units in thousands)

Source: Ward’s
We continue to believe that this lack of inventory has created a great deal of pent-up demand that is likely to smooth downside cyclicality in US Auto Sales in the event the US economy falls into a period of recession. With the automotive market coming off of lower highs, we would expect a “higher low” from a production standpoint. Additionally, while automakers have enjoyed greater profitability per unit with inventory at historically low levels, nearly all would like dealers to be more adequately inventoried than current levels. Conversations indicate that a happy medium exists at around the 2.5 million-unit range. This ultimately means that production must grow in excess of demand by one million units in order to re-supply domestic dealers with product.
The Spring Loaded Recovery (Take Three?)
For the second year in a row, we find ourselves looking at an auto industry that should be enjoying the release of a considerable amount of pent-up demand given the supply related challenges that have reduced sales since the beginning of 2020. Instead, much of what we spoke about a year ago remains the same as supply chain challenges, various COVID related issues, and unpredictability of automaker production schedules continue to prevent an orderly and predictable recovery for the supply base.
What has changed, unfortunately, is that the broader economic outlook has become cloudier. While consumer balance sheets appear to be in good shape, vehicle affordability has clearly been impacted by rising interest rates and the coming decline in used vehicle prices that impact the amount that a consumer can get for a trade-in on his or her used vehicle. While we still predict sales to recover over the course of the next four years, the rate of increase will ultimately be determined by factors that were seemingly more predictable at a year ago.
Exhibit 5 US Light Vehicle Sales 2019A-26P

Exhibit 6 North American LV Prod. 2019A-26P

Source: Ward’s, Gabelli Funds estimates
From a stock perspective, the backdrop is generally positive, as the likelihood for production declines in the coming years is very low. Additionally, a slowing in inflation and broader declines in commodity prices including steel should turn from headwinds to tailwinds beginning in 2023 and help earnings for original equipment suppliers. This is likely underappreciated by the stock market, which continues to assume a coming contraction in earnings. Additionally, we look forward to hearing from companies over the coming year as to how they grow their electric vehicle supply portfolio in a manner that is both profitable and cash flow generative.
AUTO DEALERS: CROSS CURRENTS BEGIN BUT ENVIRONMENT REMAINS SUPPORTIVE
2022 served as another year where automotive dealers found themselves in a “best of all worlds” situation, as a lack of vehicle inventory enabled retailers of new automobiles to enjoy massive increases in gross profit per unit. For the second consecutive year, most sales at the retail level were those that had to be ordered in advance as available vehicles on dealer lots remained at historic lows. When coupled with improvements in the customer experience that drove gross profit add-ons from a Finance & Insurance perspective, as well as an economic recovery that drove increases in miles driven to help parts and service operations, every publicly traded dealer reached records in earnings per share in 2022.
As we look into 2023, much of the foundation for another excellent year remains. Lower available inventory coupled with increases in parts and service are likely to keep profitability high. However, economic crosswinds in the form of higher interest rates and declining used vehicle prices are challenges that every dealer is going to need to contend with for the better part of 2023 and into 2024.
We continue to believe strongly in the dealer model, more so now than at any point. Automotive dealers’ ability to thrive during 2020 in spite of a global pandemic served as an affirmation of the franchised dealer business model’s resilience. Lessons from the pandemic, combined with what is likely to be a more disciplined automaker base (at least in the medium term), have informed our view that dealers have become structurally more profitable entities with higher trough earnings than the market appreciates. We expect these businesses are set to increase earnings with lower fixed costs and drive considerable cash flows to either invest organically, use for M&A, or return to shareholders over the next several years.
Table 1 Top Public Dealership Groups in the United States, 2021 (by new units)
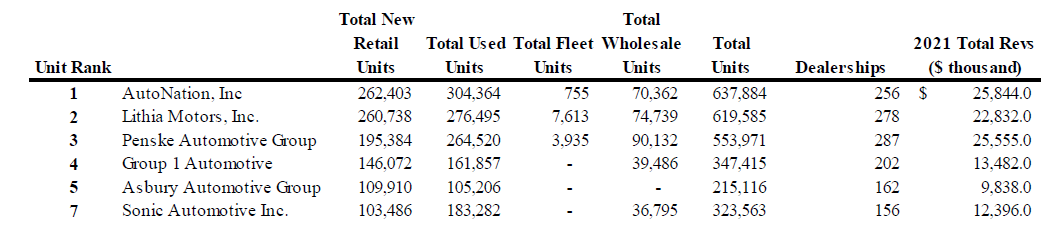
Source: Automotive News
Dealers 101
To refresh, franchised auto dealers are diversified businesses that generate sales and profits from four distinct operating lines: 1) new vehicle sales, 2) used vehicle sales, 3) parts & service, and 4) finance & insurance. While new vehicle sales constitute the majority of an auto dealer’s revenues, dealers historically have relied heavily on the higher margin service & parts business to cover fixed costs and generate considerable gross profit. Dealers benefit from a variable cost structure in which primary fixed costs consist of building maintenance, administrative overhead, and base advertising. A dealer’s sales force is generally compensated via commission, helping maintain dealer profitability at low new vehicle sales levels by naturally reducing SG&A. To highlight this, AutoNation, Penske, and Lithia all reported positive EPS in 2009 and again in 2010 despite the largest percentage decline in new unit sales since World War II. In 2020, as automotive repair remained an “essential” activity in the spring despite COVID-related shutdowns, service bays remained open and enabled dealers to continue to generate positive operating income.
Dealer Model Driven by Parts & Service
Table 2 (right) provides a snapshot of the public dealers’ businesses by revenue (excluding Penske’s Commercial Vehicle operations).
While the top portion of the table highlights what appears to be a model driven largely by variable operations (selling more units), the bottom depicts a more telling reality. Dealerships draw a considerable percentage of their profits from the combination of selling Used Vehicles along with providing Aftermarket Parts & Service; line items largely independent of broader cyclicality within the new vehicle market. This unique feature of the operating model is a primary reason (but not the only one) that dealers remained vibrant despite COVID.
We note that the high percentage of gross profit derived from new units in 2022 is likely to be somewhat temporary in nature. Clearly, the per unit profitability about which we have written will not last in perpetuity. The extent to which normalization will occur remains to be seen, though our confidence in the underlying business model focused on fixed operations remains strong as ever.
Table 2 Franchised Dealer Operating Model (2022E)

Source: Company filings, Gabelli Funds
(a)Note: PAG revenues for light vehicle business only
Lack of New Vehicle Production Impacts on New and Used Prices
As noted above, franchised dealers typically generate between 60 and 75% of their revenues from the sale of both new and used vehicles. Before internet-driven price discovery flourished over the past 6-7 years, gross margins for new vehicles ranged in the 7% range, with Used Gross margins hovering around 8-9%. This meant that gross profit for a typical $25,000 new vehicle in 2010 was roughly $1,700-1,800, with a $15,000 used vehicle generating nearly $1,300.
Over the past decade, mix shifts towards larger Crossovers, SUVs and Light Trucks along with expensive new drivetrain and electronics content have driven average selling prices (ASPs) for both new and used vehicles substantially higher, offsetting the aforementioned pricing transparency that has dramatically cut margins for new and used vehicles.
However, the 2021 supply/demand dynamics explained earlier in this piece naturally led to a significant rise in used vehicle prices – a dynamic that turned only recently. With fewer vehicles produced and available, used vehicles acted as a natural substitute for new units. Manheim’s Used Vehicle value index, after initially dropping in March of 2020, rocketed to all-time highs throughout the spring and summer months as dealers sought to satisfy demand with “nearly new” vehicles as they waited for their lots to be repopulated as OEMs restarted production. While the benefits of this boom in used prices were myriad, dealers must now contend with the impacts of a depreciating used vehicle environment.
Exhibit 7 Manheim Used Vehicle Value Index

The rapid decline in used vehicle prices will likely cause some disruption across the automotive ecosystem. While affordability of used vehicles will improve, owners of used vehicles will have less equity to use for trade-ins for both new and used vehicles. Additionally, with fewer trade-ins with which to work (on artificially low new unit sales), sourcing of quality used units remains problematic.
It is our opinion that abnormalities in the traditional relationship between new and used prices and unit sales will continue until new vehicle production increases and prices can normalize for new retail consumers.
Dealers Profitability in the New Era
The ultimate question for dealers is what earnings should look like in an operating environment once production increases and inventory normalizes. To illustrate how far operating metrics have shifted, we detail below AutoNation and Penske’s third quarter per unit metrics over the last four years.
Table 3 Dealer 3Q Same Store Unit Metrics, 2019-2022

Source: Company filings
As shown in Table 3 (above), per unit profit metrics at publicly traded dealers reached new historical highs in 3Q of 2020. Both AutoNation and Penske saw gross profit per new unit reach nearly $5,500 and $6,000, respectively, with corresponding increases as well in F&I per unit. It remains to be seen what is the new normal dealer profitability per unit once inventory stabilizes. With that noted, OEMs across the board have realized they can maximize profitability by producing fewer vehicles, focusing on content per unit, and reducing costly (and brand dilutive) incentives.
Additionally, 2020 tested dealer-operating models in such a way that businesses learned they could generate greater profitability with considerably lower overhead. For example, AutoNation had SG&A/Gross Profit (an important metric for dealer profitability) well above the 70% range. In the interim, while the aforementioned benefits to Gross Profit Per Unit have clearly played a role, the company has enjoyed nearly a 1,500 bps improvement to around 57% for 2022E. This level of success has led to a strategic shift by management toward keeping this metric in the mid-60% range whenever values eventually compress for new vehicles. Essentially, dealers are better prepared to earn more with lower fixed costs.
Dealers ready for EVs: a matter of when
Dealers are investing heavily in training and some tooling in anticipation of the coming EV models they will sell and support. With the potential for CapEx for service bay changes to be high, dealers spoke to a balance required between showroom updates and EV service bay support. What will be of considerable interest is how OEMs and dealers interact as it relates to EV inventory. Automakers continue to point to more of a bespoke vehicle-on-demand ordering for EVs in these early days of the EV era. If OEMs see advanced purchasing as the appropriate model in the future, some dealer per unit profitability would clearly be at risk (offset by a lack of inventory carrying cost).
Exhibit 8 Ford F-150 Lightning EV

Source: Google Images
THE ELECTRIC AGE SET TO EXPLODE
EV’s spurs battery and charging opportunities
Our two days in Las Vegas (along with any stroll in the convention center at the SEMA show) confirmed the undeniable momentum of vehicle electrification. With OEMs largely touting their coming EV models set to roll out over the next several years, nearly all suppliers that presented at the Waldorf felt compelled to either promote their own exposure to the EV space or defend their business model as either propulsion-agnostic or somewhat protected against the coming EV onslaught.
Apart from what appears to be a very attractive set of new platforms from legacy automakers and new industry participants for consumer enjoyment, there also appears to be a growing opportunity for medium duty trucks within the Last Mile delivery space for commercial usage of EVs. This is a still growing area where affordable Electric vehicles operating within a defined daily radius and can be fast charged provide a quality value proposition for owners.
Additionally, there has been recently passed legislation in the United States supporting EV adoption through both producer and consumer tax credits, helping set the environment for massive growth in the EV space.
EV GROWTH – FRAMING THE DISCUSSION
Similar to a year ago, we expect annual global electric vehicle sales to grow from 6.5 million units in 2021 to 39 million by 2030 and the total number of electric vehicles on the road to grow from 16 million to 224 million over the same period (Tables 4 & 5 below). This includes both battery electric/fully electric vehicles (BEVs) and plug-in hybrid electric vehicles (PHEVs).
Table 4 Global Electric Vehicle Sales 2020A – 2030P

Table 5 Global Electric Vehicle Population

Regulations Remain a Primary Driver
While an increasing breadth of consumer options that are both more attractive and more affordable will have a clear impact on an EV ramp, government support (or mandates in some respect) remains the primary driver behind EV growth. This is most clear in China and Europe, where either state-mandated or climate-driven laws are set to phase out Internal Combustion Engines in consumer vehicles nearly entirely over the next 15-20 years.
Automakers are met with the choice of whether to compete or risk missing an opportunity on a market entirely. Exhibit 9 (below) depicts the coming regulatory hurdles ahead for automakers by geography. Initially, smaller countries such as Norway (2025) seeking 100% Zero Emissions Vehicle (ZEV) sales will aim to eliminate ICE sales, followed by larger markets such as China and Japan, who both target 100% electrified (including hybrids) sales in 2035.
European automakers must reduce average CO2 emissions targets for new passenger cars from 130 g/km in 2015 to 95 g/km by 2020 and 60 g/km in 2030 and face heavy fines for exceeding targets, which we believe could serve as a €30 to €35 billion industry headwind over the next decade. Simply put, automakers cannot be compliant without producing electric vehicles. Nearly all have made what is becoming an easy decision to make the expensive shift.
Exhibit 9 Global Emissions Regulations/ICE bans

Source: International Energy Agency (IEA)
In the U.S., California originally announced plans to ban sales of internal combustion engine vehicles by 2035. Washington, New York, and Massachusetts have followed suit, with others likely to join.
More Cost Effective Batteries Support Broader EV Adoption
While policy driven bans on Internal Combustion Engine vehicles have pushed automakers to change investment and development plans to produce EVs, the ultimate success of these initiatives will likely rest on the creation of, not only attractive, but affordable vehicles. To that end, battery development plays an incredibly important role.
Inflationary pressures on raw materials and purchased components ramped considerably in 2022 and continue to call into question producers’ ability to reduce battery costs toward the long-term “holy grail” target of $100 per kWh. While some of these issues are likely to be temporary and supply chain driven, much of the affordability issues battery producers’ face will rest on their ability to work down addressable cost curves. GM, in its recent investor day, spoke to the ability to reach $85/kWh by 2025 on the back of improved production techniques, simplified pack designs, standardized platforms, increasing order size, continued penetration of high energy density cathodes, and economies of scale.
Exhibit 10 Average Lithium-ion Battery Pack Prices 2013A – 2026P

Source: Bloomberg NEF
The Battery EcoSystem
The EV Battery Industry is estimated at roughly 200 GWh (Giga Watt Hours) of production capacity in 1H22 – with the vast majority of battery OEMs residing in Asia. Notably – four suppliers – CATL, LG Energy Solutions, BYD and Panasonic – hold more than two-thirds of total market share (see Table 6 below). Market share can fluctuate given the growth profile of the industry with most participants currently in the process of either expanding manufacturing capacity or green-fielding new plants at a rapid rate.
Table 6 Battery OEM Capacity Deployed for EVs and Estimated Market Share

Source: SNE Research, Batteriesnews.com, Company Reports, Gabelli Funds Estimates
Exhibit 11 Leading Lithium-ion Battery Cell Manufacturers
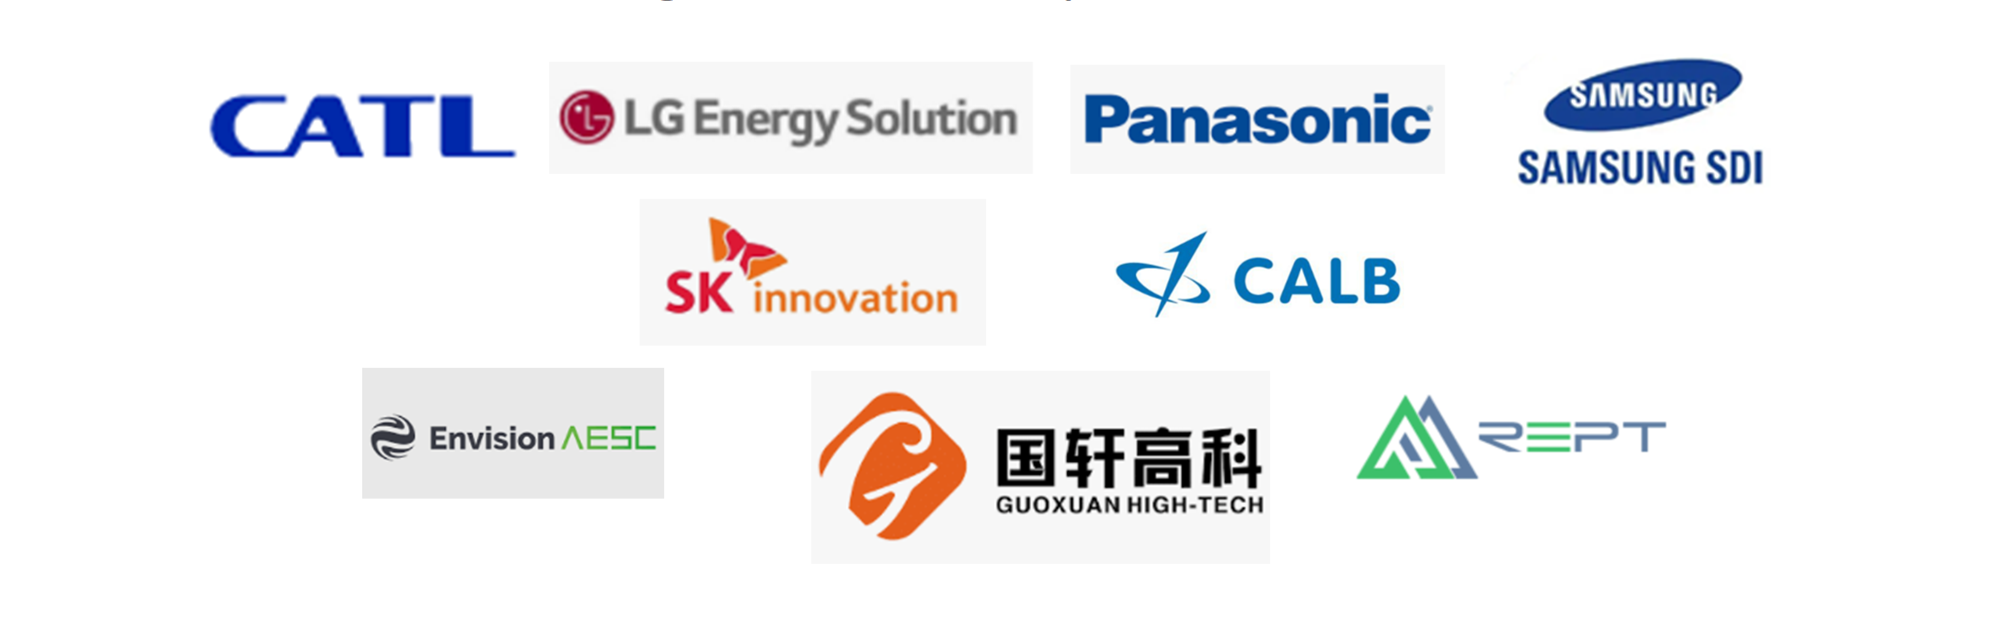
Source: Company websites
Lithium Ion Batteries Explained
A lithium-ion battery generates power (DC) through a chemical reaction as lithium ions move from the anode to the cathode during discharge (see Exhibit 12 below). During the charge phase – lithium ions transition back from the cathode to anode. This process is repeated continuously through up to thousands of battery cycles. Lithium-ion batteries are valued for their: 1) high energy density versus other rechargeable batteries (including nickel metal hydrides, nickel cadmium, and lead acid batteries) making them smaller and lighter; 2) greater relative power (output); and 3) long life cycles as they are rechargeable.
Exhibit 12 Lithium-ion Battery Illustrated

Source: Panasonic
Investing in the Automotive Battery Through Legacy Suppliers
Investing via public companies in the automotive battery itself provides limited options to a degree, with most capacity (and publicly traded companies) residing in China or South Korea. Raw materials suppliers in the Lithium Ion battery supply chain (those that provide Lithium, Nickel, etc.) provide a more direct way than most but remain outside the auto industry.
At our conference, Dana Incorporated (DAN), whose competence is in thermal management for Internal Combustion Engines, is being utilized to support production of EVs through battery cooling systems. Modine (MOD) – another supplier with a long history in the automotive heating and thermal solution segment is similarly developing technologies for batteries in buses and off highway vehicles. A year ago, Gentherm (THRM) spoke to growth in battery temperature management as a result of its long history in seat heating systems.
Similarly, companies such as Aptiv (APTV) and Lear (LEA) in the wire harness space, support increased electrification in vehicles, including the battery powertrain.
Charging Stations – Another “Fuel” of Adoption
European charging solution company Wallbox spoke at our conference this year and reiterated that EV adoption would largely hinge not only on vehicle model proliferation, but also massive investment in growth in charging infrastructure. Globally, Wallbox sees the need for upwards of 100 million chargepoints (at over 12.5 million charging stations) installed for passenger electric vehicles by 2030, a 10x ramp from what will likely be near 10 million by the end of 2022. Similarly, Blink Charging (BLNK), expects US EV Charger sales to increase from roughly 500,000 chargers in 2021 to 1.8 million by 2030, with the total number of charger sales over the next decade to add up to just shy of ten million chargers.
Exhibit 13 US Charging Needs by 2030

Charging solutions are likely to take several forms, with Home and Business Charging systems in the 7-22 kW range (according to Wallbox, over 70% of all charging occurs at home and work) the overwhelmingly greatest need. Public Charging stations utilizing Level 2 (60-150kW) chargers will likely constitute the next greatest set of charging equipment needs, while “superfast” 150-400kW Public DC fast chargers will likely find some level of demand for highway driving and/or other specialized cases.
Most recently, charging companies have sought to work together with public utilities on “bi-directional” charging that provide opportunities to integrate renewable energy, battery storage (via the vehicle itself) and the broader electrical grid. The opportunity to reduce energy costs, reduce dependency and stress on the grid, along with the potential for carbon emission reduction all combine to increase the opportunity that exists within the charging space.
USED VEHICLES: NEAR TERM CHALLENGES MEAN THE STRONG GET STRONGER
To review, the U.S. Used Vehicle market is highly fragmented, consisting of ~43,000-used vehicle dealerships (~27,000 independent dealers and ~16,000 franchised dealerships) with the largest dealer (KMX) commanding less than 2% market share and the top 100 dealers collectively holding approximately 7% market share.
With roughly 40 million units of annual sales per year, the US Used Vehicle market is roughly 2.5 times the size of the new vehicle market and historically somewhat less cyclical given the substitution dynamics (in more challenged times, typical new vehicle purchasers move down market to purchase pre-owned vehicles).
2022 has proven to be among the more challenging environments in the Used Car market in some time. The aforementioned acceleration in Used Vehicle pricing has created considerable headwinds for industry participants. A lack of new vehicle production, detailed at length in the preceding pages, drove consumers that would otherwise purchase a new unit to purchase late-model, low mileage used units to the point where many potential buyers, particularly those in the near prime or subprime credit bracket, were simply priced out of the market.
Now that used vehicle prices have begun to decline for a variety of reasons (better new unit availability, higher interest rates, slowing economic conditions), dealers in the space must contend with the potential for a gross profit crunch if vehicle turnover is not quick. This difficult environment means that only those with excellent sourcing capabilities will flourish, and those groups that need to rely on auction markets for inventory will find operations more difficult.
Omnichannel – What a Difference a Year Makes
All public dealers have strengthened their online presence over the past year in a way that has helped them achieve greater share, most notably from independent used vehicle dealers. Not only have dealers’ investment in omnichannel assisted in the sale of vehicles to consumer, but also just as importantly in sourcing. By including features such as instant assessment and price guarantees, dealers have availed themselves to more potential supply to sell at either franchised locations or used-only stores. This has led to an increased pool of available vehicles along with the ability to avoid expensively sourcing from auctions.
Exhibit 14 Carvana Car Vending Machine

Source: Carvana
However, what a difference a year has made. Last year, Carvana (CVNA) enjoyed a $50 billion equity cap and a growth trajectory that had investors questioning the viability of the in-store model. This year, as growth rates have stalled, EBITDA remains considerably negative and cash burn a massive concern. Questions at the conference in 2022 regarding online sales revolved far more around whether the online-only model was economically viable and if so, at what scale. While the movement in used car prices and lack of available supply has made the operating environment difficult for the online-only model, a lack of confidence in the business model’s resiliency has clearly impacted share price for both CVNA and smaller peer Vroom (VRM).
With that in mind, the appropriate model appears to include some degree of brick-and-mortar need. Traditional dealers continue to invest in omnichannel efforts as most consumers opt to handle a good portion of their transactions online prior to conducting a test drive – a feature of the dealer model that does not appear to be losing its appeal. Ultimately, the more dealers such as AutoNation and Penske can illustrate meaningful growth from their used only/omnichannel endeavors for investors, the more potential exists for valuation multiple expansion.
AUTOMOTIVE AFTERMARKET OUTLOOK
INTRODUCTION: PEOPLE NEED TO DRIVE
Driving is not going away anytime soon. Nothing highlights this factor more than the last three years of growth in the $300 billion aftermarket. Starting in 2020, YoY miles driven fell 40%, 25%, and 13% in April, May, and June respectively (Exhibit 15). Given these unprecedented lows (miles driven only fell to -3.6% in 2008), investors feared aftermarket demand would plummet. However, during that same period, ORLY, AZO and AAP posted positive monthly comps of 16%, 22% and 8% respectively. Nearly three years later, 2022 has experienced 3-year growth rates that have averaged +23% indicating the aftermarket continues to be an essential business.
Exhibit 15 Sharp decline in miles 2Q2020 miles driven vs 2Q2020 Aftermarket comps (driven by DIY)

Source: Federal Highway Administration (fhwa.dot.gov), company filings
In 2Q2022, miles driven reached 2019 levels; however, all aftermarket companies posted strong results with ORLY, AZO, and AAP posting 26%, 26% and 13% 3-year stacks respectively (Exhibit 16) showing that people realized they needed to maintain their car. In this aftermarket update, we will review the aftermarket fundamentals, underlying catalysts, and potential risks, all while reiterating aftermarket resistance to economic volatility.
Exhibit 16 3Q2022 miles driven growth relative to 2019 vs 3Q2021 3-Year Aftermarket comp growth

a) Data on Valvoline Instant Oil Change segment, b) AZO quarter ending May 31
Source: Federal Highway Administration (fhwa.dot.gov), company filings
A REVIEW OF INDUSTRY BASICS
The Automotive Aftermarket Suppliers Association (AASA) projects the $329 billion light vehicle aftermarket to grow to $401 billion by 2025. Demand fell in 2020 in response to the COVID pandemic and less on-road travel; however, the AASA estimates 2021 rebounded by 15% and is projecting an additional +20% growth over the next four years.
Exhibit 17 The US LV Aftermarket Continues to Grow (2010-2022E)
($ in billions, USD)

Source: AASA
We estimate that parts account for $190 billion of the aftermarket after excluding tires and labor. Parts sales are divided into two segments: commercial “do-it-for-me” (DIFM) and retail “do-it-yourself” (DIY). Specific to the Big 4, it is estimated that ~$140 billion would be considered the addressable market. Due to the significant increase in 2020 DIY demand, the DIFM parts market is roughly the same size as the DIY market using wholesale numbers (Exhibits 18 & 19). According to the AASA, complexity, changing consumer demand, and telematics will drive DIFM market share over the next several years.
Exhibit 18 DIY Market Size 2001-2020
($B)

Exhibit 19 DIFM Market Size, ex-Labor 2001-2020
($B)

Source: AZO Presentation
McKinsey has estimated that the global aftermarket can grow to $2.7 trillion in 2030, from ~$740 billion, driven by new technology.
AFTERMARKET ECOSYSTEM
There are approximately 285 million light vehicles on the road in the US operated by ~240 million licensed drivers. The aftermarket is comprised of the replacement parts and labor that keep these vehicles operating after the initial sale. Servicing those vehicles are individuals working on their own cars (DIY), 130,000 repair outlets, and 100,000 gas stations that also do repair work. Roughly 220 warehouse distributors and 35,000 parts stores provide components to this fragmented buyer population. Over 1,000 aftermarket parts suppliers exist in North America, with tens of thousands of other manufacturers located in low-cost countries around the world.
The traditional or “three-step” parts distribution system consists of the warehouse distributor (WD), the jobber, and the end-user or installer (Exhibit 20). The leaders amongst WDs and jobbers continue to be NAPA (Genuine Parts), CARQUEST (now part of Advance Auto Parts), and O’Reilly Automotive. The largest service chains include Midas, Jiffy Lube, and Monro Muffler Brake (MNRO). While the three-step system produces lower margins for distributors, this system remains efficient and provides the broadest range of parts deliverable within the shortest amount of time. The ability of new forms of distribution to gain share, most notably e-commerce, will depend on the ability to meet required delivery speeds of 30-45 minutes after an order is received.
In the retail “two-step” system, parts are distributed directly through consumer accessible chain stores, the largest of which are AutoZone, Advance Auto Parts, and O’Reilly Automotive, as well general retailers such as Costco and Wal-Mart. In this system, the DIY chain or retailer acts as both distributor and retailer (Exhibit 20). In the OE Service “two-step” system, part suppliers ship products to a dealer service group (e.g. Ford or Toyota), which typically warehouses the product and ships it off to franchised vehicle dealers and other repair operations.
Exhibit 20 U.S. Automotive Aftermarket Channels

Source: Gabelli Funds
Amazon has been speculated to be investing in the automotive aftermarket channel. While it will take massive investment to build out the necessary inventory and distribution, the ~$200 billion aftermarket parts industry is one of the largest retailing segments in which Amazon does not currently participate. Traditional e-commerce competitors such as US Auto Parts, have utilized both distribution systems, either going directly to the consumer, or through a WD or jobber/retailer which is a much lower margin business. Previously, these competitors have not achieved the same distribution proximity, and therefore delivery speeds, as brick-and-mortar competitors. AMZN has instituted a platform to go directly to the installer base, wherein the consumer buys on AMZN and connects with a local repair shop via the site. We have seen little traction on these types of platforms. However, in China, Alibaba purchased into CarZone and QCCR, which integrated the whole supply chain.
AFTERMARKET DRIVERS
The automotive aftermarket is traditionally driven by four primary dynamics: 1) the number of vehicles on the road; 2) the age of the vehicle population; 3) employment and wage growth; and 4) the number of miles driven by consumers. Until the recent volatility surrounding COVID, aftermarket growth has remained in the 1-4% range over the past thirty years, proving to be recession resistant.
Recession Resistant – Aftermarket Posts Strong Comp in 2009 Amidst ~10% Unemployment
The aftermarket is resistant to recessionary pressures. This is best exemplified by the average 5.7% comp posted in 2009 when unemployment reached 9.9% (Exhibit 21). While we do not know what 2023 will bring, we believe that economic ambiguity (along with unprecedented low vehicle supply) will drive owners to maintain vehicles over buying new.
Exhibit 21 Aftermarket comps remain strong during high rates of unemployment (2007-2009)

Source: Company filings, Bureau of Labor Statistics
More Vehicles on the Road – +20% Growth in the Aftermarket Sweet Spot and Trend Towards Personal Vehicles
A swell in personal vehicle demand due to COVID fears, low new/used vehicle inventory, and a projected +25% growth in the aftermarket “sweet-spot” are strong tailwinds for the industry. U.S. Vehicles in Operation (VIO) grew consistently over the last ten years (Exhibit 22) driven by an improving economy that bolstered new vehicle sales and manufacturing quality that reduced scrappage rates. However, VIO in the aftermarket ‘sweet spot,’ or those aged 6-11 years, fell from 81 million in 2015 to 70 million in 2020. This is due to lower vehicle sales during 2008-2011 (the Great Recession) that entered the aftermarket at lower rates than previous model years. This “air pocket” is expected to reverse to 88 million by 2025 (Exhibit 23) or a +25% growth in vehicles that drive aftermarket demand (Exhibit 23).
Exhibit 22 US Light Vehicle Population 2010-2024E
(millions)

Source: AASA, Experian
Exhibit 23 Number of Vehicles in Sweet Spot 2013-2025P
(millions)

Source: AASA, IHS Markit
The AASA expects VIO to grow to 292 million in 2025 versus 283 million in 2021 in response to personal vehicle demand driven by suburbanization, a fear of mass transportation, and new household formation as the percentage of young adults living with a parent declines from 52%. Low new vehicle and high used vehicle prices provide support to the tail-end of vehicles on the road as owners are forced to invest in maintaining vehicles longer with few other options.
Vehicle Age Drives Aftermarket Growth
COVID and low vehicle inventory levels have boosted the trend of older vehicles on the road. Prior to COVID, improved vehicle quality drove the average age of a car on the road to 11.8 years (Exhibit 24). As owners are able to drive vehicles longer, they are more willing to invest in repair and replacement of parts. We believe this additional investment has effectively expanded the age range of the “sweet spot,” or age in which the owner sees value in repairs. In response to recent economic uncertainty, historic lows in new vehicle supply, and high used vehicle prices many consumers have decided to maintain their vehicles longer. Both of these recent and historical trends should drive aftermarket age and replacement demand.
Exhibit 24 US Light Vehicle population ages with low inventory, higher quality parts

Source: AASA, IHS Markit
An older vehicle parc bolsters the sale of alternators, starters, brake calipers, and brake master cylinders, as these parts are generally only replaced later in a vehicle’s life. Higher numbers of replacement jobs generate more aftermarket demand as service providers diagnose ancillary problems in these older vehicles as well.
Miles Driven to Grow: Preference for Personal Vehicles, Suburbanization, and Return to Work
Miles driven (outside of warranty) is a historic indicator of broader vehicle wear and tear. However, from the beginning of the COVID pandemic, there was a clear spread between miles driven and aftermarket demand. We attribute this to: 1) owners of older vehicles tend to be essential workers; and 2) stimulus and time. First, previously declining categories exposed to vehicles 12+ years of age have seen strong growth. Stimulus dollars supported low-income consumers in 2020/2021 who are more likely to own older vehicles. Total spending by low-income consumers did not change in 2020 relative to down 7% for higher income consumers. This allowed for investment in older vehicles to keep them on the road for an additional replacement cycle. Further, appearance and performance categories significantly outperformed in 2020. These products are not tied to miles driven, but an indication of time, money and interest by the end consumer.
Going forward suburbanization in response to COVID, distrust of mass transportation and a return to work trend has supported continued growth in miles driven in 2022. According to Google mobility (via AASA), workplace mobility is still down double-digits relative to 2019; however, resident-related miles driven are up 7% and the US DOT data indicates that commuting miles are less than 25% of total miles traveled.
We note however, that gas prices are now $3.65 vs $3.40 a year ago (and $2.11 in 2020) may pressure miles driven in the near-term. Previously at this conference, aftermarket companies have stated that prices above $3.50 may hinder consumers’ interest in driving, as these prices would impact discretionary income.
Exhibit 25 U.S. Vehicle Miles Driven 2012-2022
(billions)

Source: US Department of Transportation Federal Highway Admin
Exhibit 26 U.S. On Highway Gas Prices
(price per gallon)

Source: eia.com
NEW TECHNOLOGIES PROVIDE SIGNIFICANT OPPORTUNITY
Although the effects of future electric vehicle penetration are debated, the industry has shown that the adoption of CASE technology (Connected, Automated, Shared and Electrified) has created profit opportunities. More newly designed parts, the redesign of existing replacement parts, complex, higher priced repairs, and increased miles driven should drive growth. McKinsey estimates that shared mobility, data connectivity and upgrade services will lead to a $2.7 trillion global aftermarket in 2030 vs. $740 billion in 2016. However, those that cannot invest will most likely lose share.
Electric Vehicle Penetration a Disruptor and a Catalyst
Electric vehicles can disrupt the aftermarket via: 1) lower required cost of aftermarket work: and 2) penetration of the 285 million car parc. We estimate that EV’s require 30-40% less aftermarket repair than ICEs and our projections indicate that EV’s will account for 5% of the total car parc by 2030. However, the transition towards “electrified,” and “autonomous” including the adoption full hybrids, mild hybrids, and ADAS technologies will drive part demand and the value of those parts. The AASA projects that vehicles with some level of ADAS technology will account for ~40% of the market by 2030 and the total addressable market will grow 4x by 2030, driving significant aftermarket value.
• EV’s require 15-40% less aftermarket work than traditional ICEs. We estimate that the typical TSLA requires 30-40% less repair work than a typical ICE over 180,000 miles or 20 years (excluding any warranty offers). We note that AAA has released information that EV’s require ~85% of the maintenance costs of a typical ICE. Of course, as EVs age and new models penetrate the market, the numbers change. NADA has recently provided data that EVs require more service visits per year vs. to ICE peers (2.9x vs 2.3x) and require more services per visit (3.9 vs 2.8).
• Electric vehicles will account for 5% of the aftermarket by 2035. The AASA estimates that electric vehicles will only comprise 5% of the vehicles 8+ years old by 2035 (Exhibit 27). We are projecting EV’s will account for 2.2% of those vehicles six years and older by 2030. Using our previous analysis, 2.2% of the aftermarket car parc would require 35% less work, or be a 140 bps drag on demand by 2030 (Table 7). Parts that have growth opportunities include tires, suspensions, non-engine drivetrain, sensors, monitoring systems, HVAC, infotainment/content and battery refurbishment, battery inverters and battery technology.
Exhibit 27 US car parc by vehicle age, 2021-2035 (millions)

Source: MEMA/AASA Industry Overview – Gabelli Conference
Table 7 Full Electrification Not a Large Percentage of the aftermarket (+6 year old vehicles) by 2030

Source: MEMA/AASA Industry Overview – Gabelli Conference, EV-Volumes.com, and Gabelli Funds estimates
• Electrification and ADAS technology to drive aftermarket growth. As shown in Exhibit 28, traditional categories such as filters, chassis and brakes are only expected to grow by 0-2% per year; however, ADAS and electrification technologies are expected to grow at 6% and 15% per year respectively, contributing to ~50% of expected aftermarket growth through 2045. Further, the AASA expects electrification to grow 39% through 2030 and 153% in total through 2045. The growth in these higher priced, higher value parts should drive aftermarket earnings as historically, the aftermarket has been able to push through prices of new technology while maintaining a strong margin.
Exhibit 28 Aftermarket Growth by Product Category (2021-2045)

Telematics and Technology Investment Drive Share Gains for Dealers/Larger Aftermarket Chains
As vehicles age, owners are less likely to bring cars to dealers for service (Exhibit 29) as: 1) OE warranties only cover work earlier in the life of a vehicle; and 2) owners of older cars tend to be more price sensitive and look for lower cost work done by independent service chains. Previously, it was hypothesized that dealers would take share as the increasing use of technology created cybersecurity issues that could lock out aftermarket parts suppliers due to OBD-II (on-board diagnostic standards) access restrictions, making it more difficult to reverse engineer these parts. However, last year, Massachusetts passed the pro-aftermarket “right to repair” measure, which enables aftermarket providers access to vehicle data for the purpose of service and repair. Federal regulation supporting the aftermarket is expected to follow. This reduces any risk that only dealers will have access to telematics and data within the car.
Exhibit 29 Vehicle owners trend towards independent repair shops as vehicles age

Source: Automotive Aftermarket Suppliers Association
Going forward, we believe that dealers and large repair chains will take share due to the increasingly large investment required to repair complex vehicles and optimize telematics/data. Complexity in parts is raising costs of doing business, providing an advantage for larger organizations, including both dealers and large repair chains that have the diagnostic and tool capability to complete these jobs. The question will be whether these shops can leverage the topline growth into margin as costs rise.
E-tailing: Opportunities to Gain Share and Barriers to Entry
“We had years of e-commerce penetration in 12 months” – AASA Vision conference in 2021. While it is difficult to estimate the size of aftermarket e-commerce, we estimate that e-commerce sales grew from $12 billion in 2019 to ~$38 billion in 2022 (Exhibit 30). Most aftermarket players spoke to e-commerce doubling during the pandemic with little expectations of a reversal. However, it is still estimated that the aftermarket is one of the least penetrated industries at ~12% e-commerce penetration. Large pure play e-commerce players such as AMZN and smaller players such as PRTS are looking to gain share by going directly to the customer via online inventory and cutting out brick-and-mortar storefronts. However, industry experts expect that only ~$1 billion of AMZN’s automotive e-commerce sales relate to Big 4 categories and that much of the accessory and discretionary market had already transitioned to online over the last 5-10 years. As 100% online competitors look to disrupt the original landscape the large distributors need to prove that they can: 1) maintain this share by building out superior omnichannel models; and 2) maintain pricing in the face of potential pricing pressure.
Exhibit 30 COVID drives e-Tailing growth

Source: Hedges & Company, CaRiD Investor
Industry experts believe that the immediacy of parts and service needed by professional installers has hindered e-tailing penetration.
• Distribution capacity as a barrier to entry. DIFM customers often require delivery speeds of 30-45 minutes across 100,000 of SKUs. We believe that e-commerce players will have to build out automotive parts distribution capacity similar to ORLY’s over 55 million square feet of distribution and selling capacity, which is 100% focused on the distribution of auto parts, to meet similar delivery speeds. This distribution capacity serves as a barrier to entry. Given low distribution capacity specific to auto parts, e-commerce disruptors will have to vastly increase distribution capacity to compete in the DIFM market and meet 30-minute delivery times. Non-automotive e-commerce distribution competitors will also have to manage the low inventory turns of ~1.3x specific to the aftermarket industry. We currently estimate that AMZN has about 200 million square feet of fulfillment capacity and an additional 150 million square feet of distribution logistics across all products sold via AMZN: holiday gifts, Wholefoods, toys, etc.
• Tech is complicated, service is needed. Currently, a significant portion of online sales are buy-online, pick-up-in-store which indicates a certain level of service required by the DIY market. To meet service requirements, online competitors will need to dramatically increase SG&A expenses on personnel specific to parts technology or attempt to build out a crowd-sourced platform of specialists that opt to provide advice. We believe that DIY would transition to online competition easier than DIFM.
• Acquisitions in the future? In China, Alibaba took a 50% stake in CarZone and QCCR, integrating automotive e-commerce, warehouse/retail distribution, and repair services. As distributors continue to maintain share for the above reasons, there could be a similar merger in the long-term. In the shorter term, PRTS is a potential acquisition target.
• The potential for pricing pressure. E-commerce players increase market price transparency. Private label parts that often do not meet the same quality as distributor brand labels are sold at +20% discounts. This spread and online transparency may pressure margins at brick-and-mortar storefronts.
POTENTIAL HEADWINDS
Share Gains and Consolidation Drive International Expansion and Questions of Future Margin Expansion
It has become increasingly transparent since the COVID first hit that the “big are getting bigger.” The big 4 averaged 3-year stacks of over 22% and were able to gain share as smaller competitors or large-box retailers could not maintain inventory or keep stores open. This most likely drove further consolidation of the market. The question remains as to how much larger the top distributors can get before running into slower growth, margin pressure and supplier issues.
Fewer domestic growth opportunities driving international growth: Company-owned stores at AZO, ORLY, AAP, and NAPA (GPC) composed 49% of the parts stores in the U.S (60% including NAPA’s independent stores). Overall, the top ten aftermarket parts providers constituted 53% of U.S. parts stores in 2012, up from 32% in 2003 (Table 8). Given continued market consolidation, the Big 4 are expanding globally with GPC acquiring AAG in Europe, O’Reilly announcing an acquisition in Mexico and AZO accelerating growth in Latin America. We believe that global market expansion is a sign that future domestic growth may be tempered. However, the DIFM market also remains an opportunity. DIFM is more fragmented than the DIY market, with professional installers often looking to local jobbers to source parts.
Supplier pressure and margin deceleration: Consolidation of buying power has significantly altered aftermarket parts sourcing (driving significant distributor margin), which may drive suppliers to opt for new partnerships or new distribution channels. The pressure of consolidating distribution and low cost sourcing may lead to supplier interest in different distribution channels such as e-commerce and more integrated supply/distribution chains.
Table 8
2021 Top 10 US Auto Parts Distributors
1. AutoZone Inc. 6,115
2. O’Reilly Auto Parts 5,873
3. Advance Auto Parts 4,998
4. Genuine Parts/NAPA* 1,280
5. Pep Boys 1,000
6. Fisher Auto Parts 500
7. Auto-Wares 300
8. Replacement Parts, Inc. 175
9. Automotive Parts Headquarters 130
10. Hahn Automotive 90
Note: By US store count, Genuine Parts company-operated stores only (not inclusive of 4,618 independents)
Exhibit 31 Top Ten Auto Parts as a % of Store Population

Source: ORLY via AAIA Factbook
Interest Rate Increases Pressure Suppliers as Ability to Pass through Price is Limited
As a result of their market dominance, the Big 4 are leveraging size advantages to extract extended payable terms and increased volume rebates from vendors. Aftermarket supplier agreements (often referred to as factoring) now allow the distributor to pay for a good in up to 360 days. Instead of holding the receivable on the balance sheet for the full 360 days, the supplier sells the receivable to the distributor’s financial institution for cash. The cost of the spread (the amount of the receivable less the upfront cash) is the discount factor, which is typically set at SOFR+. Once the supplier receives the cash from the finance institution/bank, both the cash and the expense (discount factor) are booked. During the last several years of low interest rates, suppliers utilized this inexpensive form of financing to extend terms and compete for clients while retailers pushed AP/Inventory ratios above ~130% (slightly elevated due to supply chain and inventory issues) reducing net working capital and freeing up cash flow for investments and repurchases. Over the last year, the SOFR rate has increased from basically flat to just under 4% at 3.8%. If a company was holding $1 billion in receivables from the banks, an interest increase of nearly 4% would equate to an additional ~$40 million expense. The aftermarket suppliers have been managing this cost in 2022. Previously, distributors have suggested that any such interest rate costs would most likely be passed along similar to any other input costs (e.g. labor, freight), but recent inflationary pressures of +10% placed on the consumer may inhibit ability to pass through these prices. We note that after years of steady growth, further expansion of these terms is most likely limited, reducing the large free cash flow growth of the past decade.
Worst Supply Chain Crisis Since WWII
During our 2021 conference, AZO stated that the aftermarket was experiencing the worst supply chain crisis since WWII. Inputs such as steel, semi-conductors, and resins inflated, container prices were up 6x and labor supply declined driving up wages. These issues were exacerbated by the sharp fall in demand in mid-2020 that was then followed by a sharp increase in demand driving uncertainty around optimal inventory levels. All of these factors have driven significant cost pressures in the market and CPI of motor equipment and parts is estimated to be up ~+10% with the distributors quoting price increases nearing 10%. While most of the aftermarket participants at the conference noted some easing of the supply chain, issues exist. This is best exemplified by the FED’s Global Supply Chain Pressure Index which indicated a rapid 4x growth in 2021 that began easing in 1Q 2022 (Exhibit 32). These factors will most likely drive some of the supply chain towards Southeast Asia, Mexico and even locally in the US.
Exhibit 32 Increasing Costs of Vehicle Maintenance and Repair (CPI Index data: 2012-2022)

Source: AASA via Federal Reserve Bank of New York, Global Supply Chain Pressure Index
Increasing Costs vs Consumer Elasticity
As mentioned, increasing complexity and advanced technologies, along with the aforementioned cost increases, have been driving aftermarket pricing. There are two main reasons for this: 1) higher quality of parts has allowed vehicles to remain on the road for longer – increasing the value of aftermarket maintenance; and 2) new technology, such as ADAS and sensor-based technologies have driven up the complexity and value of aftermarket parts. Since 2012, the CPI for Vehicle Maintenance and Repair has gone up +40% and over 10% in the last year. We believe that at some point the additional costs of ownership will weigh on the consumer; however, the current spread between buying vehicles versus repairing a vehicle is high as the prices of new/used vehicles continues to climb.
Historically, aftermarket distributors have been able to push through prices while maintaining margin and suppliers maintain gross profit dollars. However, we note that at some point these higher costs in tandem with the significant inflation that the economy is currently experiencing may weigh on consumer spending habits.
Exhibit 33 The Increasing Costs of Vehicle Maintenance and Repair (CPI Index data: 2012-2022)

Source: FRED CPI Data
A SIDE NOTE ON THE COLLISION MARKET
The increasing levels of complexity in the vehicle has also led to conversation regarding the ~$40 billion collision repair industry. While ADAS technology and the transition towards a more electric automated vehicle was expected to be a headwind over the last few years, the collision industry has been growing. High collision areas (such as the bumper) are now complete with sensors to support ADAS technology. The cost of repair of these more connected parts has been driving up the price and value of repair and replacement. However, recently the high costs of these repairs have led to higher total loss rates as the cost of repair is no longer preferable to scrapping the vehicle at salvage auctions.
Two factors have also divided the collision industry. While miles driven are in line with 2019 levels, congestion and repair claims continue to lag. However, the additional cost of repair and lower congestion that leads to faster driving accelerated total loss as a percentage of claims in 2020. As used vehicle prices increased and the resulting value of repair on a vehicle increased in value, total loss plateaued in 2021. Thus, the collision industry has been more impacted by COVID, reduced congestion, and a reluctance to return to work while salvage auctions have actually benefited.
Exhibit 34 Total Loss Vehicles as % Total Claims (2013-2021)
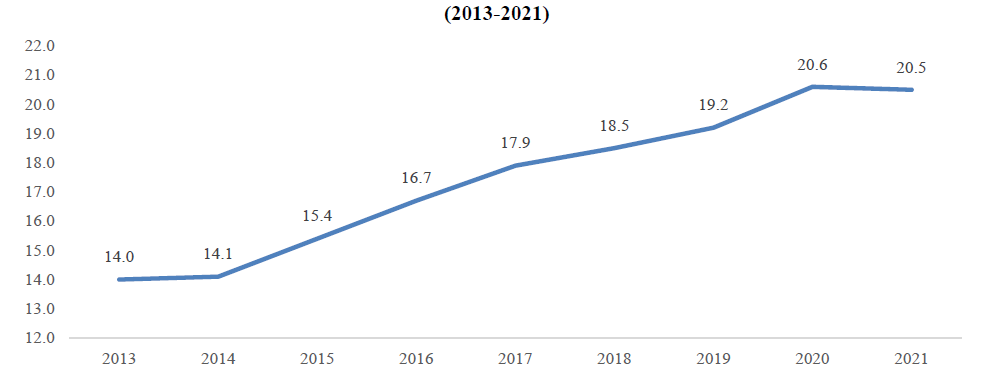
Source: CCC Information Services
AutoNation (AN – $119.17 – NYSE) Structurally More Profitable

COMPANY OVERVIEW
AutoNation, Inc., based in Fort Lauderdale, FL, is the largest automotive retailer in the United States, owning and operating 336 new vehicle franchises from 243 stores. The company sells 32 different new vehicle brands, with 89% of new units sold manufactured by Toyota (incl. Lexus), Honda, Ford, General Motors, FCA US, Mercedes Benz, BMW, Nissan, and Volkswagen (incl. Audi and Porsche).
HIGHLIGHTS
• AutoNation spoke to Mike Manley’s background as an automaker CEO (Formerly head of Jeep) as helpful in understanding the strategic vision he has for the company. Heavily data driven, Manley is seeking to expand AutoNation’s interactions with customers, including in the parts & service area to create more touch points. Further, Manley brings with him an understanding as to the expected evolution of electric vehicles within the automotive ecosystem that should allow the company to best prepare itself for the innovation ahead.
• AutoNation’s acquisition of CIG provides the company a finance subsidiary whose offerings will most likely be tailored to the used vehicle market, and not against the captive finance subsidiaries of the OEMs that provide financing for new vehicles. Over the past several years, AN has made considerable efforts to create tailored, branded products under the AutoNation Drive Pink label – first with parts – CIG adds more options in this space.
• The company spoke at length about expectations for inventory at the dealer level – perhaps the most important topic for dealers going forward. The company sees very little in the way of OEM incentive to overproduce (a negative practice for decades). Automakers have learned how to be more profitable with lower levels of inventory, utilizing far lower incentive levels to move product. While inventory will likely rise as production capacity improves, AN does not see the industry headed back to the 3.7 million-unit pre-Covid inventory level.
• Increases in used vehicle values for the past three years have pushed consumers away from leasing (given newfound equity in the vehicles they were trading in). This has created a headwind for dealers on the used vehicle side as they have had fewer opportunities to source high quality used units.
• Regarding online sales, 90% of AutoNation used sales start with some sort of online search. With that said, very few consumers take delivery of a vehicle without coming into a dealer. AutoNation has the capability to driveway deliver- though depending on distance the act may not prove economically viable.
• AutoNation USA, the company’s used car store rollout, is seeing headwinds on the construction side.
Table 1 AutoNation Earnings Model

Source: Company data and Gabelli Funds Estimates
Table 2 AutoNation Private Market Value Analysis

Brian C. Sponheimer (914) 921-8336 Gabelli Funds 2022
bsponheimer@gabelli.com
AutoZone, Inc. (AZO – $2,516.28 – NYSE) DIFM Opportunity

COMPANY OVERVIEW
AutoZone, Inc., headquartered in Memphis, TN, is the largest specialty retailer of automotive parts and accessories in the United States. The company sells to both the DIY (Do-It-Yourself) and DIFM (Do-It-For-Me) markets. As of FY2022, the company operated 6,168 stores in the United States and Puerto Rico, 703 in Mexico, and 72 in Brazil.
HIGHLIGHTS
• AZO has proven the ability to drive earnings growth regardless of underlying economic cycles. EPS grew at a 5-year and 3-year CAGR of 22% and 24% respectively through topline growth and share repurchases. The company has repurchased $34 billion or +150 million shares since 1998, with only 19 million shares outstanding today. New store openings add ~3% to topline growth per year.
• Approximately 70-75% of the domestic auto business is DIY. This customer has been resilient throughout the cycle and supported by the expert advice from an in-store AutoZoner. The commercial customer, 25-30% of the business, now accounts for $4.2 billion of sales and has seen nearly 30% growth in 2022. Even with the DIY mix, only 15% of the business is considered to be discretionary, such as wash and wax, hubcaps, etc, with the remaining portion of the business failure and maintenance.
• Despite 10% inflation in cost of goods sold, AZO has maintained gross profit margin of 52% as the industry has remained disciplined and the company has been able to pass through price. This is largely due to the non-discretionary nature of the parts sold. New and used car prices have grown over 30% and AZO’s consumer has been faced with investing in their vehicle versus buying at these levels and economic uncertainty.
• There are two significant factors driving the outsized DIFM growth of 27%: 1) investment in the DuraLast brand that provides DIFM customers with confidence and support and 2) investment in product assortment that placed more parts, closer to customers driving AZO up the “first-call” list. The improved availability has been tied to technology investments that have reduced delivery times by 15-20%. In addition, while the company has benefitted from eight straight quarters of double-digit growth, they only account for 4-5% of DIFM market share with significant opportunity to continue to expand.
• AZO was able to pick up share during industry-wide supply chain challenges which should support higher than average growth rates. The company was able to outpace competitors during this period through flexibility with its DuraLast brand and its prior focus on diversifying the supply base. While some challenges remain in certain categories, the supply chain has improved.
• AZO generated ~$3.7 billion in EBITDA in FY2022 and spent $670 million in CapEx providing the company with significant free cash of +$1.5 billion for investments in growth and repurchase of shares. Management stated that they would continue to trend towards the 2.5x net debt/EBITDAR target from their current levels of 2.1x.
• While some investors are concerned over the impacts of “deflation” on 2023 comp results, AZO and other presenters, highlighted continued drivers of inflation including wage rates (which grew 5x and are extremely sticky), higher interest rates, and overall macroeconomic inflation. The aftermarket has a deep history of passing through these prices, while maintaining prices after periods of inflation. These factors should continue to support 2023 comps. Further, after significant periods of DIY growth in response to previous stimulus packages, DIY traffic remains stable. The consumer has been remarkably resilient and has walked into this cycle with a much bigger balance sheet.
Table 1 AutoZone Earnings Model

Table 2 AutoZone PMV Analysis

Source: Company data and Gabelli Funds estimates
A. Carolina Jolly, CFA (914) 921-7762 Gabelli Funds 2022
cjolly@gabelli.com
CarParts.com (PRTS – $5.24 – NASDAQ) New Model Disruption

COMPANY OVERVIEW
Headquartered in Torrance, California, U.S. Auto Parts (PRTS) is a leading online provider of aftermarket auto parts and accessories. PRTS sells to individual consumers through the flagship website at www.carparts.com and online marketplaces. The website, and mobile-friendly platform, provide customers with a comprehensive selection of over 731,000 SKUs with detailed product descriptions, attributes and photographs. PRTS online sales channel and relationships with suppliers eliminate intermediaries in the traditional auto parts supply chain to offer a broader selection of SKUs than can easily be offered by offline retailer competition. In 2021, PRTS reported $0.04 of earnings on adjusted EBITDA of $17 million and revenue of $580 million.
HIGHLIGHTS
• The company has doubled revenue from $290 million in 2019 to a projected +$600 million in 2022 and is on trend to expand EBITDA margin by 300 bps to ~5% by focusing on conversion, site speed, “click-to-ship,” etc. 90% of the work was basic “blocking-and-tackling” with the remainder being technology improvements. Management believes carparts.com is most likely taking significant share and outpacing other e-commerce peers by leveraging these operational improvements and driving both traffic and conversion rate.
• PRTS’ average selling price is approximately $65 per unit while the average order value is in the “low” hundreds range. The company has an expansive data science team that helps optimize price points based on elasticity of customer base and has helped navigate the inflationary environment. The supply chain crisis worked in PRTS favor as the company was already vertically integrated and had significant presence and history of shipping from Asia.
• Relative to brick and mortar peers, management believes the company does not need as much “duplicative” inventory as PRTS’ customer base is willing to wait a few days to save money. The price differential between PRTS and the brick-and-mortar competitors may be as high as 50%. PRTS customer is predominately DIY for now, although the company is executing on strategy to drive DIFM growth. The company does not sell batteries due to the immediacy of need and recycling requirements.
• PRTS was able to capture share and gain traction during the COVID-19 pandemic as consumers stayed home to work on their cars and shop online. There was a further boost by the 2021 stimulus package that supported demand. However, the company believes that some of this share gain is sticky as 2Q2022, which faced the most difficult 2Q2021 stimulus comp, was able to generate revenue growth of 12%.
• If there is more economic turmoil, PRTS is fairly recession resilient and came out of the 2008/2009 recession basically flat. Vehicle owners need to fix their vehicle and during a downturn may choose the cheaper product or transition to private label as PRTS does not believe there is significant DIY brand loyalty. In terms of electric vehicle penetration, PRTS is 90% engine train agnostic as the majority of their sales are not drivetrain specific.
Table 1 CarParts.com Earnings Model

Source: Company filings and Gabelli Funds estimates
Table 2 CarParts.com PMV Analysis

Source: Company data and Gabelli Funds Estimates
A. Carolina Jolly, CFA (914) 921-7762 Gabelli Funds 2022
cjolly@gabelli.com
Commercial Vehicle Group (CVGI – $6.56 – NASDAQ) Mix & Margin Transition

COMPANY OVERVIEW
Commercial Vehicle Group (CVG) is a provider of components and assemblies into two primary end markets (1) global vehicles (2) U.S. technology integrators (warehousing). The company provides components and assemblies – including electric wire harnesses, plastic components, vehicle structures, and accessories – to vehicle OEMs and aftermarket products for fleet owners. Additionally, CVG sells mechanical assemblies to warehouse automation and to U.S. military technology integrators. We estimate the company will earn $0.70 per share on $1.0 billion of revenue and $60 million of adjusted EBITDA in 2022.
HIGHLIGHTS
• Management highlighted its efforts this year to restructure and reprice up to 80% of its legacy contracts – which are now contributing to meaningfully improve operating margins and FCF generation during 2H22, which should continue into 2023. Over the next twelve months – CVGI looks to address 20% of its business that has not been repriced – a reflection of management’s longer-term focus on improving the company’s overall margin profile.
• New business wins are a continued focus for CVGI – totaling $143M of annualized revenue YTD – Two-thirds of which for EV electrical systems (low and high voltage wire harness systems and distribution boxes). Management continues to leverage the company’s expertise in this product field – and highlighted that average CVGI EV content per vehicle is roughly 2x when compared to an ICE vehicle. As a reminder, CVGI is targeting mainly the commercial vehicle EV market working with many new start up builders and to a lesser extent legacy Truck OEMs.
• Part of management’s strategic playbook is the growth of CVGI’s aftermarket business – which is currently 11% of total sales. Over the last twelve months – management has invested in the segment – including establishing a dedicated manufacturing facility for seating products and launching an ecommerce platform to drive incremental sales.
• Warehouse Automation – which is also part of management’s strategic growth plan – remains in a holding pattern after AMZN (an estimated 80% of segment revenue) paused warehouse expansion initiatives. While management has a positive outlook on this product – given attractive longer-term secular tailwinds (mainly growth in ecommerce market share as a % of total consumer purchases) – reacceleration in revenue growth is not anticipated until the midpoint of 2023.
• The company also highlighted efforts to circumvent supply chain headwinds – exacerbated by COVID – and also further vertically integrate as management shifts a fair amount of its supply base from China. CVGI is building two new plants in Mexico and North Africa – respectively – to support its seating and wire harness operations. These actions are expected to create a more efficient supply chain – reduce working capital as a % of sales – as well as eliminate ocean freight total costs by up to 50%.
Table 1 Commercial Vehicle Group, Inc.

Source: Company filings and Gabelli Funds estimates
Table 2 Commercial Vehicle Group, Inc.

Source: Company filings and Gabelli Funds estimates
Matthew S. Brooklier (914) 921-7724 Gabelli Funds 2022
mbrooklier@gabelli.com
Dana Incorporated (DAN – $17.76 – NYSE) EV Full Speed Ahead

COMPANY OVERVIEW
Dana Incorporated, based in Maumee, OH, is a world leader in providing power-conveyance and energy-management solutions that are engineered to improve the efficiency, performance, and sustainability of light vehicles, commercial vehicles, and off-highway equipment. Enabling the propulsion of conventional, hybrid, and electric-powered vehicles, Dana specializes in the supply of driveline products (axles and driveshafts), power technologies (sealing and thermal-management products), and genuine service parts for light and heavy vehicle manufacturers.
HIGHLIGHTS
• Dana CEO Jim Kamsickas spoke to the acceleration of EV platform rollouts. Last fall, DAN held an analyst day detailing its many opportunities in the electric vehicle space across light, commercial and off-highway vehicle markets. To that end, content per vehicle opportunities for Dana on electric vehicles is considerably larger than on typical Internal Combustion Engine models.
• Kamsickas spoke to supply chain disruptions that have beset the auto industry as forcing a rapid rethinking of how parts are sourced and delivered on a global basis. Dana has invested heavily into understanding how best to source nearly all materials and purchased components, with some conclusion that “near-shoring” would become more prevalent and the “days of moving everything around the world” were over.
• The company believes its biggest operating challenges remain in Europe, where not only have the aforementioned supply chain issues continued to a degree but high energy prices are likely to play a considerable role in the behavior of Dana’s customer base (and less so for DAN).
• One of the many indirect challenges from a move to electric vehicles would be the potential disruption in the labor market. With EVs requiring considerably fewer parts, the auto industry will likely require fewer production plants across the supply base. The challenge for companies such as Dana will be transitioning a workforce to one more software-skills driven.
• Any transformational M&A is highly unlikely. Dana spoke to the potential opportunity the GKN light vehicle business would have provided three years ago before it was purchased (in whole) by Melrose. Dana has moved on to make a number of more “boutique” type acquisitions that provide technology that it can lever across each of its end markets. Investors should expect more of the same, as CEO Jim Kamsickas spoke to his background and comfort in M&A.
Table 1 Dana Incorporated Earnings Model

Source: Company data and Gabelli Funds estimates
Table 2 Dana Incorporated Private Market Value Analysis
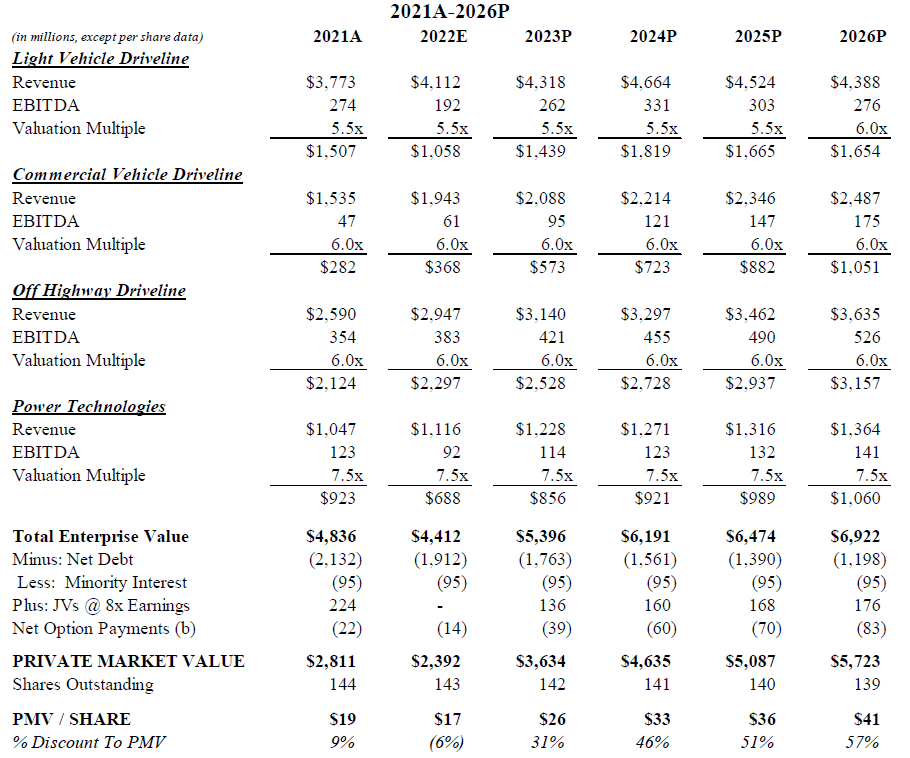
Source: Company data and Gabelli Funds estimates
Brian C. Sponheimer (914) 921-8336 Gabelli Funds 2022
bsponheimer@gabelli.com
Donaldson Company (DCI – $60.62 – NYSE) Diversity Rules

COMPANY OVERVIEW
Donaldson Company, based in Minneapolis, MN, is a global manufacturer of worldwide filtration systems and replacement parts. The company’s products include air and liquid filtration systems and exhaust and emission control products. Donaldson has two reporting segments: a $2.3 billion Engine Products business and Industrial Products, which generated $1 billion in sales for the fiscal year ending July 31, 2022.
HIGHLIGHTS
• Donaldson and its CEO Tod Carpenter continue to advance its strategy of tech driven filtration solutions for its customer base with the goal of creating proprietary “razors” to support a razor blade model with upwards of 65% of its revenue recurring in nature.
• For its fiscal year ending July 31, 2023, the company continues to see strong growth along with the opportunity for margin expansion, driving what the company expects will be record earnings per share.
• Margin expansion (100bps) appears to largely be under Donaldson control, with inflation abating and pricing opportunities for the company to recover from what was a highly challenging FY22. Supply chain improvement will be critical, but tangible evidence exists of better parts available. DCI noted up to 120-125 critical parts were difficult to source a year ago down to 10 as of the conference.
• The company’s aftermarket business – typically a solid indicator of broader economic expansion or recession, continues to perform well. DCI sees this cycle as somewhat different from others given that any sort of broader weakness in demand is unlikely to require any destocking by DCI customers. This means that any pullback will likely be more muted than others will.
• Price increases are likely to normalize back to annual increases as inflation subsides. Currently the company sees its independent and aftermarket channels being easier to achieve price increases than its OEM customers.
• M&A opportunities continue to be found in filtration adjacencies such as medical and pharmaceuticals along with food and beverage. DCI believes it can adjust products for nearly any end market it desires to enter.
• From an electrification perspective, DCI will likely be able to provide content on hybrid diesel engines along with hydrogen fuel cell trucks. While full market turnover to pure battery electric vehicle share would be negative for the company, it is an unlikely risk in the near term to medium term.
Table 1 Donaldson Earnings Model

Source: Company data and Gabelli Funds estimates
Table 2 Donaldson PMV Analysis

Source: Company data and Gabelli Funds estimates
Brian C. Sponheimer (914) 921-8336 Gabelli Funds 2022
bsponheimer@gabelli.com
Garrett Motion (GTX – $7.55 – NYSE) Catalyst Rich Turbo Company

COMPANY OVERVIEW
Garrett Motion, headquartered in Rolle, Switzerland and East Brunswick, NJ, is a leading technology supplier for the automotive industry. The company designs, manufactures and sells highly engineered turbocharger and electric-boosting technologies for light and commercial vehicle original equipment manufacturers (“OEMs”) and the global vehicle independent aftermarket as well as automotive software solutions.
HIGHLIGHTS
• Despite consternation in the minds of investors regarding electrification, Garrett sees the automotive turbo business as vibrant and growing. Given the technology required to help automakers and commercial vehicle manufacturers meet emissions requirements for ICE vehicles along with the fact that Garrett operates in an essential duopoly with BorgWarner (BWA), GTX remains optimistic about near and medium term impacts from the move to EVs.
• Hybridization of ICE vehicles represents the greatest growth opportunity for Garrett, and one likely underappreciated by a market so focused on BEV growth. Though roughly 30 million of the 100 million or so vehicles expected to be produced in 2030 will be BEV, the available market for ICE will remain sizeable, with turbocharged hybrids continuing to grow share.
• The company believes it is too early to say the supply chain has fully stabilized given unpredictability out of the company’s Chinese operations. Additionally, while larger logistics providers seem to have become healthier, there remains challenges for smaller operators whose pace of improvement is less rapid.
• Garrett has no restrictions from its Preferred shares that would prevent the company from exploring an M&A deal. With that said, the target environment is not huge and any M&A would need to be geared toward the acceleration of turbo technology. Use of cash would likely be geared towards payment of accrued dividends and preparation for Preferred conversion.
• FCF generation remains the company’s biggest opportunity – one that can help accelerate its balance sheet transformation and improve its standing in the eyes of its potential investor base. Along those lines, the company noted that is considering an investor day to help educate interested parties on the company’s opportunities ahead.
• GTX is looking forward to the mandatory conversion of its preferred shares (which require among other hurdles two consecutive quarters of >$600mm of TTM EBITDA). The company is considering payment when appropriate of the $172 million of PIK dividends that have accrued.
Table 1 Garrett Motion Earnings Model

Source: Company data and Gabelli Funds estimates
Table 2 Garrett Motion Private Market Value Analysis

Source: Company data and Gabelli Funds estimates
Brian C. Sponheimer (914) 921-8336 Gabelli Funds 2022
bsponheimer@gabelli.com
Genuine Parts Company (GPC – $183.92- NYSE) DIFM Exposure Drives Growth Opp

COMPANY OVERVIEW
Genuine Parts Company, located in Atlanta, Georgia, is a premier global distributor of “consumables” such as automobile replacement parts, industrial bearings, and mechanical power components. The auto parts business encompasses a network of warehouses and jobber stores under the NAPA brand and is the company’s largest and best-known operating segment.
HIGHLIGHTS
• After successfully executing on a portfolio optimization strategy in which the company divested its electrical and office products several years ago, GPC has focused on the high-growth Automotive and Industrial segments. The automotive distribution business, marketed under NAPA, has 6,000 locations in the US that mostly sell to the DIFM customer (DIFM is 80% of NAPA revenue). The industrial segment, mostly marketed under Motion, has conveyance, automation, robotics, and power transmission end markets. GPC is focused on growing both businesses.
• GPC is a global distributor. After NAPA generated double-digit annual growth rates by entering New Zealand and Australia, the company entered Europe in 2017. The benefits of being in Europe are significant. Specifically, the maturing electric vehicle (EV) market in Europe provides insights into change and growth in the other regions. Recently, the Industrial (Motion) segment acquired KDG to further expand and accelerate growth in high growth end-markets.
• GPC has managed to expand EBIT margin by 50 bps to 9.0% during a period of ~10% cost inflation. The industry has been very rational from a pricing dynamic and has passed through price increases. It is important to remember that over the last 10 years there has been no inflation within the aftermarket which reduces the uncertainty around pricing pressure on the consumer. The company has been able to push through price and noted that there are 290 million vehicles on the road driven by increasing complexity that also support price.
• GPC experienced similar levels of inflationary pressures as peers. Similar to other commentary, management noted some easing of the supply chain and moderation in inflation. The spot market for transportation has come down (ocean), port congestion is improving, but labor remains tight. Going forward, the company is targeting 6-8% growth via additive bolt-on M&A and NAPA’s current growth rate of ~6%.
• The industrial segment has seen incredible broad based strength, breaking correlation with the PMI. GPC has more exposure to automation, robotics, and conveyance relative to previous cycles, which is outsized growth. KDG, Motion’s new acquisition, has doubled the segment’s automation business. GPC believes that factories will continue to look at companies like Motion to identify more solutions. The current voice of the customer remains optimistic. Further, near shoring remains a medium-term opportunity for the end segment.
• GPC continues to see inventory opportunities that drive working capital efficiencies. While interest rates remain high, suppliers continue to participate in aftermarket financing programs, which provide beneficial rates.
• Technology is at the core of the GPC’s business including managing supply chain, sales strategy and interaction with customers and is driving results. Electronic interaction with customers’ accounts for 20% of total customer interactions.
Table 1 Genuine Parts Company Earnings Model

Source: Company data and Gabelli Funds estimates
Table 2 Genuine Parts Company PMV Analysis

Source: Company data and Gabelli Funds estimates
A. Carolina Jolly, CFA (914) 921-7762 Gabelli Funds 2022
cjolly@gabelli.com
Gentex Corp. (GNTX- $28.63 – NASDAQ) Flexibility and Optionality

COMPANY OVERVIEW
Gentex Corporation, headquartered in Zeeland, MI, designs and manufactures vision systems, dimmable devices, connectivity and sensing systems for global vehicle markets. The company also manufactures dimmable aircraft windows for the aviation industry and commercial smoke alarms and signaling devices for the fire protection industry.
HIGHLIGHTS
• Gentex spoke to opportunities to integrate the vehicular user experience seamlessly with everyday life via its acquisitions of Homelink and ITM. Through Homelink, the company provides software enabled capabilities to link consumers with their properties, including garage door opening and security systems. Similarly, the company has developed technology to communize every tolling protocol in the country to allow for driving anywhere under one account. These technologies will be critical as electrification grows. Funds are typically raised for infrastructure investment via gas taxes – which obviously go away with EVs. Therefore, should governments adopt a more user-driven tax on road usage, tolling technology will become critical.
• As one of the more profitable auto suppliers from a margin perspective, Gentex has theoretically had the most to lose regarding supply chain and logistics issues that have impacted the auto industry. While the company has ably handled challenges it has faced through initiatives such as proactive purchasing of raw materials, remaining problems have required more changes to be made. This includes product re-designs including reductions in the number of parts. GNTX sees supply chain issues as being a headwind for at least the next 6-9 months.
• GNTX sees its aerospace business, a pre-pandemic $25mm revenue line, at approximately $100 million at maturity.
• New products for GNTX will include camera-based technologies for driver and cabin monitoring (leaving child in vehicle, etc.) that continue to push towards greater consumer safety.
• Pricing for product and value will be a particular focus for GNTX over the next year as it negotiates to recover lost profitability along with protecting itself against future production disruptions.
• GNTX spoke to its balance sheet’s net cash position as more geared towards preparations to make larger acquisitions such as Homelink and less to be conservative regarding weathering automotive cyclicality. Additionally, with shares moving downward from Q3 earnings, the company expects to see a pickup in share repurchases.
Table 1 Gentex Corp. Earnings Model
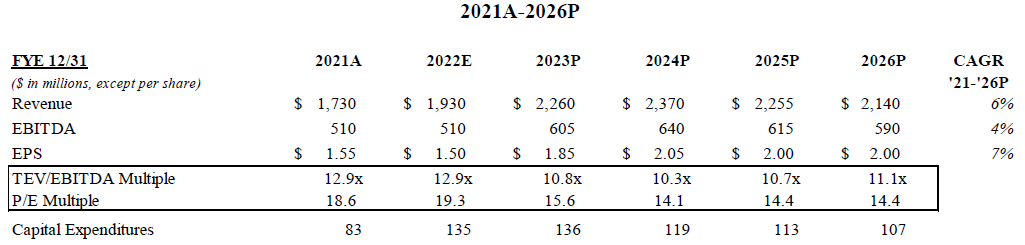
Source: Company data and Gabelli Funds estimates
Table 2 Gentex Corp. PMV Analysis

Source: Company data and Gabelli Funds estimates
Brian C. Sponheimer (914) 921-8336 Gabelli Funds 2022
bsponheimer@gabelli.com
Hyliion Holdings (HYLN – $2.99 – NASDAQ) Commercial Vehicle Electrification
COMPANY OVERVIEW
Hyliion Holdings – headquartered in Cedar Park, Texas – is a leading provider of electrified power train solutions targeting the global commercial vehicle industry. Hyliion has two Class 8 electrified power train products (1) a Hybrid electric system that marries proprietary battery pack technology, electric axle, and other components with diesel or compressed natural gas (CNG) engines that can be installed on new or existing trucks and (2) Hypertruck ERX that combines a renewable natural gas (RNG) fueled generator with a battery system powering e-motors and axles. Both products aim to reduce carbon emissions while improving truck performance and lower operating costs. HYLN’s flagship product the Hypertruck ERX importantly leverages existing natural gas refueling infrastructure. Management is currently targeting Hypertruck ERX commercialization starting in 2H23.
HIGHLIGHTS
• Management continues to believe the greatest opportunity for its flagship product – the Hypertruck ERX – is within the U.S. Class 8 long-haul market. ERX – which is currently under development – provides comparable if not better power and torque when compared to a diesel ICE engine and up to 1K miles of range per fuel tank with low to negative total emissions.
• Supermarket chain Wegmans and transportation provider Greenpath Logistics are currently testing the Hypertruck ERX – with management disclosing generally positive feedback from both companies. Over the next twelve months – HYLN expects to produce another 20 units for controlled fleet testing. Management disclosed that the first 200 ERX production slots are currently filled.
• Estimated fuel cost and emission data points were provided by management comparing the Hypertruck ERX relative to battery electric, diesel, and hydrogen powered Class 8 trucks on a 1,500-mile route. ERX fuel costs were estimated at $241 in total for the trip – representing discounts of 45%, 77%, and 88% when compared to diesel, hydrogen and plug-in battery electric vehicles, respectively. ERX’s estimated carbon intensity score of -486 to +90 – which we note is inclusive of the fuel production process – also bested its peers.
• The company also discussed the acquisition of KARNO – from GE – that is a sealed linear generator that produces electricity through flameless oxidation. Notably, the KARNO generator is essentially fuel agnostic – as it can be powered with twenty different fuels (including diesel, natural gas, and hydrogen). In addition to its fuel flexibility – KARNO is mechanically simplistic – with only one moving part and no oil or other required fluids. Management envisions KARNO as the next logical progression in ERX truck development as the company migrates from natural gas to hydrogen powered generators.
• Management reiterated that one area hindering more rapid deployment of battery electric and hydrogen fuel cell commercial vehicles in the US – outside of acquisition cost – is infrastructure. However – there are currently close to 700 RNG/CNG public refueling stations in the U.S. – which we believe could provide HYLN with a first mover advantage assuming Hypertruck ERX proves viable. Notably, 64% of natural gas used in Transportation is derived from renewable sources.
• Given HYLN has $455M of cash/equivalents and long term investments on its balance sheet – with an estimated quarterly cash burn rate of $30M-$35M per quarter – management believes its current liquidity is more than sufficient to bring the company to initial ERX commercialization starting in 2H23. The potential for additional required capital would likely be dependent on the pace at which production is scaled.
• While not disclosed at our conference – management provided on the company’s 3Q22 earnings call an estimated ERX ASP “in the high $300K” range inclusive of a $40K tax credit from the Inflation Adjustment Act. This compares to management’s belief that comparable Class 8 battery electric trucks are currently selling for “mid $400K” and hydrogen fuel cell vehicles in a “$500K-$600K” range.
Matthew Brooklier (914) 921-7724 Gabelli Funds 2022
mbrooklier@gabelli.com
Monro, Inc. (MNRO – $45.97 – NASDAQ) Transition Drives Growth

COMPANY OVERVIEW
Monro, Inc. headquartered in Rochester, NY, is the largest chain of company-operated undercar care facilities in the United States, operating 1,297 stores in thirty-two states. The company operates in the $287 billion “Do-It-For-Me” (DIFM) segment of the $329 billion U.S. Automotive aftermarket industry.
HIGHLIGHTS
• MNRO’s sweet spot are those vehicles aged 6-12 years old. The company is focused on having a 50% mix of tire to service revenue. Going forward, management believes they can augment tire store revenues by providing more services to the customer. Management believes that the company can surpass $1.2 million per store over the next few years relative to approximately $1.0 million per store now. The 20% growth is partially derived from improving profitability and store performance of the bottom 300 stores. With the recent initiatives put in place, the bottom 300 small or underperforming stores were able to drive a 10% comparable store sales in F2Q2023.
• The company generated $120 million in cash over the last six months, which will be a record cash flow year for MNRO. With 130,000 repair locations in the US, MNRO is the largest at ~1,300. This gives the company plenty of runway to invest and continue M&A. The goal is to efficiently incorporate acquisitions going forward.
• New management and new strategy should drive significant efficiencies at MNRO. New CEO, Michael Broderick, has been in the industry for 30 years. Partnerships will be key in both tire and service. MNRO sold a large portion of its tire distribution business and collaborated with ATD (“best” tire retailer in the business) to meet tire demand. This reduces the capital intensity of the business and allows MNRO to source product and meet demand more efficiently. MNRO is also increasing focus on top partnerships with the local parts retailers/distributors to ensure the underlying repair shops have the parts to meet the immediacy of need of the car owner. Historically, shops sourced 75% of parts from non-core partners. Going forward, Mr. Broderick will focus on preferred partnerships to better meet required fill-rates for customers and to improve costs through scale.
• MNRO recently implemented a good, better, best model. MNRO’s “opening” price point immediately drove unit growth improvement. While this has had some impact on topline sales due to the lower price point, the company has been able to bring in more customers through the door and maintain the business. By keeping the customer, they are also able to sell other services, which offsets the loss of topline/gross dollar reduction of a lower-priced tire. The point is not to shock the customer with an expensive service in which they do not return for more work. If a customer does not do business with MNRO, they are doing it elsewhere or they cannot get to work, school pick-ups, etc.
• Industry tailwinds include an older vehicle that requires larger failure-related services such as brakes along with near-term weakness in tire sales that will have to reverse, as you need tires for your car. The company has invested in technicians that will be able to meet electric vehicle demand when that demand enters MNRO’s market. Right now, it is incredibly small portion of repair. Post the 2008 deferral cycle, MNRO saw outsized growth from 2009-2011 which they believe will occur during this cycle and are already seeing in the opening price point categories.
Table 1 Monro, Inc. Earnings Model

Source: Company filings and Gabelli Funds estimates
Table 2 Monro, Inc. PMV Analysis
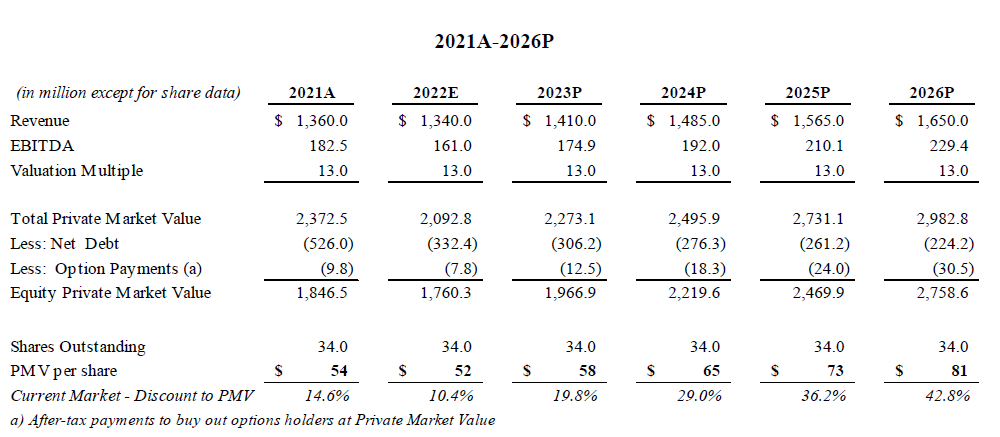
Source: Company filings and Gabelli Funds estimates
A. Carolina Jolly, CFA (914) 921-7762 Gabelli Funds 2022
cjolly@gabelli.com
Motorcar Parts of America (MPAA – $13.31 – NASDAQ) Right Part, Right Place

COMPANY OVERVIEW
Torrance, CA-based Motorcar Parts of America, Inc. is a leading manufacturer, remanufacturer, and distributor of rotating electrical parts including alternators and starters for the automotive aftermarket. As a result of recent acquisitions, MPAA has expanded its product line to include remanufactured undercar components such as steering components, brakes, clutches and wheel hubs. MPAA sells its products predominantly in North America to the largest auto parts retail and traditional warehouse chains and to major automobile manufacturers for both its aftermarket programs and its warranty replacement programs.
HIGHLIGHTS
• MPAA offers 33,300+ SKUs sold in more than 25,000 outlets across the US and Canada. The company has traditionally focused on the $130 billion non-discretionary replacement hard parts categories. New product lines have increased exposure to heavy duty, diagnostics, hybrid and electric vehicle. MPAA covers all part numbers in the effort to fill installer demand and immediacy of need. MPAA provides value via this expansive inventory and product mix, category and inventory management, including business plans for new product lines, pricing strategies, training programs, and more.
• MPAA has been able to focus on categories that are agnostic to electric vehicle growth and has growth opportunities going forward. The launch of the break caliber and brake pad business should drive $300 million of growth simply in those lines of business for an additional 40% of revenue growth over the next few years. MPAA has also invested in EV technology on the OE side. Learnings from these capabilities can be transitioned to other components.
• The last couple of years of margin contraction have been “self-inflicted” due to a massive new product line build out and the footprint transition to Mexico, both of which should drive earnings in the long-term. While building out new product lines will be accretive to long-term growth, there is some additional margin pressure. Further, similar to other companies, MPAA has experienced significant inflationary pressures. However, the company has been successful in passing through some price increases. Going forward, as more price increases go into effect, the company should catch up on some margin and drive margin expansion past 2019 levels.
• Due to the company’s current footprint in Malaysia and Mexico, the company has filled orders better than its competitors have. 8-10 years ago, MPAA had seen problems in China and made the decision to move manufacturing to Mexico. They are significantly less dependent on China and Mexico allows them to manufacture close to the US market with a lower cost structure. The completion of this transition and reduction of duplicative footprints should drive margin improvements this year and going forward.
• The car parc has aged to an average of 12 years and is in its prime for replacement parts. Further, there is no used/new vehicle inventory, which is keeping the vehicles on the road longer, and consumers are investing in their current vehicles. The fact that having a vehicle is more dependable than public transportation is driving longer-term growth. Both DIY and DIFM is expected to grow; however, DIFM is now 60% of share (after a historic focus on DIY) and DIFM is expected to grow faster than DIY. During the last recession, MPAA saw continued solid growth. The fundamentals remain strong for a relatively recession resistant industry.
Table 1 Motorcar Parts of America Earnings Model

Source: Company filings and Gabelli Funds estimates
Table 2 Motorcar Parts of America Analysis

Source: Company filings and Gabelli Funds estimates
A. Carolina Jolly, CFA (914) 921-7762 Gabelli Funds 2022
cjolly@gabelli.com
MP Materials (MP – $34.05 – NASDAQ) Mining For Magnets in Mountain Pass

COMPANY OVERVIEW
MP Materials is the owner and operator of the Mountain Pass Rare Earth Mining and Processing facility, the only integrated site of its kind in the Western Hemisphere. With over 200 employees, MP Materials produces approximately 15% of global rare earth materials, essential for the development of technologies such as defense systems, smartphones, drones, and electric vehicles. It operates a “green” mining and processing facility and is currently one of the lowest‐cost producers of rare earth concentrate. MP plays a leadership role in advocating for a more robust and competitive rare earths industry in the U.S.
HIGHLIGHTS
• With electrification on the rise and automation continuing to increase, MP presented a compelling case as to why demand for rare earth elements would rise considerably over the next decade and beyond. With permanent magnets found in traction motors for EVs and with very little in the way of substitution risk, demand for the elements mined and processed by MP will have to rise.
• Improvements in demand, as well as profitability, have helped drive internally funded investments towards vertical integration. The company has begun its move towards refining operations at its Mountain Pass facility, including roasting capability and product finishing.
• Stage 3, the company’s plan towards metal/alloy and magnet production, has also commenced, with ground broken on a 200,000 sq. foot facility in Texas. The company has also secured long term contracts to supply General Motors with product.
• While the price per metric ton for the company’s rare earth elements have quadrupled over the past 3 years to nearly $13,500, the impact has not resulted in any hesitance by its customer base (in China) for product. With magnets, a very small percentage of the material inputs into electric vehicles and the primary focus the cost of lithium and battery inputs, concerns about rare earth pricing have been negligible.
• With over 90% of the rare earth metal and magnet industry in China, the US government has indicated national security risks arising from the country’s dominance. The US will require a vibrant downstream permanent magnet industry to offset geopolitical risk.
• MP is cash flow positive and currently carries $600 million of net cash on the balance sheet, positioning it well for nearly any macroeconomic environment and allowing the company the flexibility to invest in its Stage 2 and Stage 3 initiatives. Similar to what was said in 2021, increases in both production capabilities along with the prices of rare earth metals has allowed MP to generate substantially more cash flow at an earlier time than otherwise expected. The company has been able to accelerate plans for its In Process Separation of Rare Earth Oxides – phase II in its three-phase plan to be a vertically integrated permanent magnet supplier.
Table 1 MP Materials Earnings Model

Source: Company filings and Gabelli Funds estimates
Table 2 MP Materials Analysis

Source: Company filings and Gabelli Funds estimates
Brian C. Sponheimer (914) 921-8336 Gabelli Funds 2022
bsponheimer@gabelli.com
Myers Industries (MYE- $22.31 – NYSE) Transforming Moldings

COMPANY OVERVIEW
Headquartered in Akron, Ohio, MYE is a leader in the manufacturing of plastic reusable material handling containers and pallets, and plastic fuel tanks as well as the largest distributor of tools, equipment and supplies for the tire, wheel and under-vehicle service industry in the United States. MYE plastic bulk containers replace single-use packaging, reducing waste and improving sustainability. As of December 31, 2021, the Company operated seventeen manufacturing facilities, three sales offices, five distribution centers and three distribution branches located throughout North and Central America; and has approximately 2,725 employees. MYE reports operations in two core segments: Material Handling and Distribution. The Distribution Segment centers on the global distribution of tire repair and retread products. Material Handling and Distribution. In 2021, the Material Handling segment contributed $565 million of revenue while the Distribution segment generated $195 million of revenue.
HIGHLIGHTS
• MYE generated nearly $900 million in TTM revenue. 70% of the business manufactures large format durable plastic moldings that are difficult to source overseas. The remaining 30% of the business distributes automotive parts to tire shops. The company is generally the #1 or #2 manufacturer of the products sold in its respective categories and is known for quality. Over the next few years, management believes they can deliver a 15% EBITDA margin, +300 bps of EBITDA margin expansion from 2021 levels, through organic strategic execution.
• MYE expanded EBITDA margin by ~300 bps YTD 2022. Most of the products operate within an oligopoly allowing for pricing power. New management has focused on operating better within this type of market and drove price increases. This strategy allowed MYE to overcome a difficult inflationary period riddled with supply chain issues better than competitors. While the company has recently seen some easing of the supply chain with cost data from China to North America falling, the impressive margin is from strategic initiatives.
• The aftermarket distribution segment sells everything a tire installer needs to install tires. There are significant strategic execution opportunities for the segment. With nine distribution centers, Myers tire comprises ~10% of its niche market and is focused on leveraging its scale. The company is one of the largest, public companies within its niche market, which enabled them to increase inventory during the supply chain crisis and meet customer demand. This was more difficult for the family owned, private competitors. Further, this segment can extract another 100-150 bps via dynamic pricing tools.
• Electric vehicles (BEVs) remain under 1% of the car parc; however, the heavier weight of a BEV benefits MYE tire supply. Management believes the aftermarket will evolve to adapt to new vehicle technologies.
• With a healthy balance sheet, <1x net debt/EBITDA, and the distribution business as a strong cash on cash return business, MYE has the longer-term opportunity to acquire geographic or technical capability at attractive economics. While the company will remain cautious during the current high interest rate environment, they have a strong team with a history of success that can acquire business at discounted multiples over the next 12-24 months.
Table 1 Myers Industries Earnings Model

Source: Company filings and Gabelli Funds estimates
Table 2 Myers Industries Analysis

Source: Company filings and Gabelli Funds estimates
A. Carolina Jolly, CFA (914) 921-7762 Gabelli Funds 2022
cjolly@gabelli.com
O’Reilly Automotive, Inc. (ORLY – $850.82 – NASDAQ) The Best During Unrest

COMPANY OVERVIEW
O’Reilly Automotive, Inc., headquartered in Springfield, MO, is one of the largest specialty retailers of automotive aftermarket parts, tools, supplies, equipment and accessories in the United States. The company sells to both the DIY (Do-It-Yourself) and DIFM (Do-It-For-Me) markets. As of September 30, 2021, O’Reilly operated 5,910 stores in 47 states.
HIGHLIGHTS
• ORLY has driven significant growth since the company’s inception in 1957. The focus has always been on robust distribution and parts availability. Given its history, ORLY’s distribution model is based on historic data targeted at local markets. Proprietary systems focus on individual store locations that hold 27-28,000 SKUs and have access to millions of parts across the network. This tiered distribution network of 28 distribution centers, 375 hubs, and over 5,900 stores along with superior service levels provides competitive advantages that meet underlying customer needs of immediacy and availability.
• ORLY generated a 5.5% comp for its 3Q2022 driving 3-year SSS growth of 31%. Throughout the supply chain crisis and the last 2-3 years of aftermarket volatility, ORLY has been able to pick up share by providing superior inventory and availability. This share appears to be sticky and partially driving ORLY’s superior results.
• Despite ~10% inflation in costs, ORLY has been able to maintain gross profit margin of 48-49% while pushing through price. ORLY’s customer needs to get a car back on the road to get to work, take kids to school, etc. The success of ORLY’s commercial customer, the shop, is based on having the right parts at the right time. The value proposition is not price. This allows ORLY to take price during periods of inflation. Only a small part of ORLY’s business would be considered discretionary. The company also believes that DIY has normalized after a sharp increase in response stimulus packages and DIY growth is at historic levels.
• ORLY has typically performed well in “recessionary” type environments where there are periods of uncertainty as depicted by a 1.5% and 4.6% comp in 2008 and 2009 respectively. These periods of uncertainty provide more incentive to make repairs where the value proposition of maintaining over buying a vehicle a strong. Further, it has been difficult to buy a car further expanding consumers interest in maintaining their current vehicle.
• Going forward, ORLY believes they can continue to expand in their total addressable market of about $140 billion. The best opportunity is the continued execution of their business model, leveraging leading inventory availability and gaining more of existing customer business, while driving share in a fragmented market. There continues to be attractive opportunities within the US augmented by growth from expansion in Mexico. Within the US, there is whitespace in the Northeast/Mid-Atlantic regions.
• Over the last five years, ORLY generated 24% annual earnings growth on 9% revenue growth. While the company is required to invest in a massive distribution system of inventory that only turns at 1.4x, its competitive moat has led to +24% EBITDA margin that generate ~$2 billion in free cash that is returned to shareholders via repurchases and investments in growth.
Table 1 O’Reilly Earnings Model

Source: Company filings and Gabelli Funds estimates
Table 2 O’Reilly PMV Analysis

Source: Company filings and Gabelli Funds estimates
A. Carolina Jolly, CFA (914) 921-7762 Gabelli Funds 2022
cjolly@gabelli.com
Penske Automotive Group, Inc. (PAG – $125.33 – NYSE) Profit Centers

COMPANY OVERVIEW
Penske Automotive Group, headquartered in Bloomfield Hills, MI, is a diversified international transportation services company that operates automotive and commercial truck dealerships principally in the United States, Canada and Western Europe, and distributes commercial vehicles, diesel engines, gas engines, power systems and related parts and services principally in Australia and New Zealand.
HIGHLIGHTS
• Penske spoke to the strength of its diversified business model that provides flexibility for acquisition and accretive growth. With leading positions in both the US and UK within automotive retail along with a growing and highly profitable commercial dealership group through Premier Truck Group, PAG has several avenues to purchase businesses at attractive valuations when the time is right.
• To this point, the company has seen little to no hit in demand from rising interest rates and other economic crosscurrents. Inventory in the United States of just 4,400 units compared to over 15,000 prior to the pandemic. While the company sees no reason OEMs will reinventory back to pre-pandemic levels, the need for vehicles is clearly there and most orders are still taking months to supply both in the United States and in Europe. Further to that end, with roughly 18 million units of demand displaced between the start of COVID and today, PAG sees demand as sufficiently pent up to offset typical recessionary pressures.
• From an e-commerce perspective, approximately 85-90% of PAG sales start online to some degree, and the company continues to invest in ways to automate its processes in a way that consumers enjoy. While digital transactions are something PAG is capable of, overwhelming consumer preference is to have a portion of the purchase process take place in-store.
• PAG continues to look to source vehicles outside of auction channels in order to make the Used Car value proposition more compelling both from a store and consumer perspective. The company did some testing of higher mileage, older vehicles and found that costs to refurbish were too high and that consumers were left wanting.
• The company is excited about the EV product rollout coming from its most important OEM partners. With BMW, Mercedes, Audi, and Porsche all offering exciting models consumers are seeking in higher volume segments, the company is preparing both from a sales and service perspective. This includes the installation of over 1,500 chargers and human capital training with technicians going through OEM education.
• EVs, while having fewer parts, should provide sufficient Parts and Service revenue as warranty repairs tend to be considerably more costly.
• While no separation of its truck operations is in the cards any time soon, the company is cognizant of its SOTP discount and could be open to strategic valuation surfacing if conditions warrant.
• Similar to AutoNation, PAG believes itself to be structurally more profitable whenever price and per unit profitability for both new and used vehicles normalize.
Table 1 Penske Automotive Group Earnings Model

Source: Company filings and Gabelli Funds estimates
Table 2 Penske Automotive Group PMV Analysis

Source: Company filings and Gabelli Funds estimates
Brian C. Sponheimer (914) 921-8336 Gabelli Funds 2022
bsponheimer@gabelli.com
Piedmont Lithium Inc (PLL – $57.00 – NASDAQ) Lithium ‘Made in the USA’
COMPANY OVERVIEW
Piedmont Lithium, based in Belmont, NC, is a development-stage lithium company with strategic assets in the U.S., Canada, and Africa. The company is working on building a multi-asset, integrated lithium business to provide lithium hydroxide to the electric vehicle and battery manufacturing supply chains. Its main asset is the development of its wholly-owned Carolina Lithium Project in the Carolina Tin-Spodumene Belt of North Carolina. Following the scoping stage and bankable feasibility study of the mine in 2021, Piedmont increased its estimated mineral resources to 44.2Mt at 1.08% Li2O. Piedmont also has a ~35% economic interest in Sayona Quebec, a Canadian lithium project, as well as ~9% of Atlantic Lithium in Ghana, with an earn-in agreement for up to 50% of its Ghana lithium assets to export spodumene to North America. The company redomiciled to the US from Australia in 2021, and moved its primary listing to NASDAQ from the ASX.
HIGHLIGHTS
• Piedmont’s objective is to be among the largest manufacturers of lithium hydroxide (the preferred lithium product for higher-energy, longer-range EV batteries) in North America in order to support the local electric vehicle and battery supply chain. It aims to do so entirely from hard rock lithium resources that the company either owns or has a substantial ownership interest. Leveraging its lithium-rich Carolina land assets, it made several equity investments in Canada and Ghana to ensure geographic and resource diversity in order to achieve that goal. If all projects are successful, Piedmont will have an ample domestic supply chain available with the ability for just in time delivery.
• Since last year’s symposium, the timeline of Piedmont’s projects and its march to profitability has changed, with the potential for new assets coming on line each year for the next several years. Sayona Quebec, a Canadian lithium project, in which Piedmont has a 35% economic interest, recently announced completion of its mineral resource estimate. It could restart spodumene production in first half of 2023, with commercial shipments potentially in Q3 of 2023. PLL has an offtake agreement for 113,000 tonnes per year or 50% of production of spodumene with a contracted ceiling price of $900 per tonne, and the potential for substantial EBITDA generation at current spot prices.
• Piedmont also has an around 9% interest in Atlantic Lithium in Ghana with an earn-in agreement for up to 50% of its Ghana lithium assets; it plans to offtake and export spodumene to the US East Coast and deliver to its future Tennessee lithium plant for conversion. Construction of the Ghana assets is expected to start next year, subject to receipt of a mining license and other statutory requirements. The mineral resource update is expected in Q4, and the definitive feasibility study in 2023, with potential spodumene production in 2024.
• Piedmont recently announced plans for a merchant lithium hydroxide plant in Etowah, TN, where it would produce 30,000 tons of battery-grade lithium hydroxide annually. Development of the plant remains subject to, among other things, permitting and financing, to which the company was recently selected to receive a $141.7 million grant by the US Department of Energy (as part of the 2021 Infrastructure Bill). Pending approvals, Piedmont expects construction to begin mid-2023, with first commercial production at the end of 2025.
• Piedmont is still in the process of obtaining state permitting and local rezoning for its foundational Carolina Project, which, following feasibility studies, would be one of the largest spodumene resources in NA; it appointed Evercore and JPMorgan to seek strategic partners for the project. Pending approvals and full construction, the company expects to extract 242,000 tonnes annually of spodumene concentrate; this volume will feed the conversion plant and produce 30,000 tonnes per year of battery-grade lithium hydroxide (for a total of 60,000 tonnes including the TN plant). At full run-rate, it could generate an estimated EBITDA of ~$600 million annually from the Carolina project alone. Management believes that the location and economics of the Carolina Project position Piedmont to be a low cost producer of lithium hydroxide. Piedmont would like to see the project fully permitted by the end of 2023, with a final investment decision in 1H 2024, and the start of commercial production by year-end 2026.
Wayne C. Pinsent, CFA (914) 921-8352 Gabelli Funds 2022
wpinsent@gabelli.com
Rush Enterprises (RUSHB – $53.21 – NASDAQ) Share and Margin Tailwinds

COMPANY OVERVIEW
Rush Enterprises, Inc. is a full-service, integrated retailer of commercial vehicles and related services in the U.S. and Canada. Through a nationwide network of truck centers, the company sells new – and to a lesser degree – used Class 4-8 vehicles – along with ancillary services including aftermarket parts and repair, financing, lease and rental, and insurance. We estimate the company will earn $6.15 per share on $7.1B of revenue and $535M of adjusted EBITDA in 2022E.
HIGHLIGHTS
• Management recently introduced new long-term financial targets (2027) which includes consolidated revenue of $10B – implying a 7% CAGR when compared to 2022E. We note this is 100bp below management’s targeted CAGR (2017-2022E) of 8% – albeit this rate of growth was positively impacted by the Summit Group acquisition which was the company’s largest to date (adding an estimated $450M of revenue or 150bp of growth). Further – management highlighted expectations to generate a 6% return on sales during this time period – which we note is in-line to slightly below profitability achieved over the last two years.
• Management expressed more bearish market expectations for US Class 8 retail sales in 2023 – at 233K units per ACT –, which represents a meaningful (10% y/y) decline from estimated sales of 258K for the current year. However – US Class 4-7 retail sales are expected at 252K units (versus 231K units a year ago) as the industry plays catch up after prioritizing Class 8 production. This suggests combined Class 4-8 retail sales in the US are down 1% y/y – with potential downside risk given macro concerns.
• The used equipment market – with prices reaching all time new highs this cycle due to new truck production constraints – is likely to continue to moderate per management. RUSHB recently took action to reduce the company’s exposure to used inventory – taking the fleet down from a peak of 2.4K units to 1.2K and marking to market all units as of the end of 3Q22. Management also anticipates record used equipment gross profit margins (18%-19% this cycle) to normalize at 8%-10%.
• Management remains confident in the company’s ability to continue to grow its higher margin Parts and Services segment above market through IT investment, secular trend benefits, and potential acquisitions. Parts and Service revenue will likely grow at a 10% CAGR from 2017-2022E versus an 8% CAGR for consolidated sales – with management surpassing its previous long term target of $2B in total sales by year end. Management’s newly introduced Parts and Service sales target of $3.5B for 2027P implies an 8% CAGR which potentially could prove conservative.
• Management will continue to take a balanced approach to capital deployment and returning cash to shareholders moving forward. This includes continued investment in strategic growth – with a greater % likely steered towards the Parts and Service segment – as well as dealership M&A. RUSHB management targets 5%-10% annual growth in the company’s cash dividend ($0.84 or a 1.6% current return) as well as opportunistic share repurchases – with all in FCF returned to shareholders at 35%-40% of the total generated.
• Looking ahead RUSHB plans to gradually sell BEVs through its dealership locations as customer demand builds – and is looking to install BEV chargers are certain locations. Much of the push to sell and service BEVs within RUSHB’s network will likely be centered around CA, IL (Chicago), and GA (Atlanta) per management.
Table 1 Rush Enterprises Earnings Model

Source: Company filings and Gabelli Funds estimates
Table 2 Rush Enterprises PMV Analysis

Source: Company filings and Gabelli Funds estimates
Matthew Brooklier (914) 921-7724 Gabelli Funds 2022
mbrooklier@gabelli.com
Standard Motor Products (SMP – $39.21 – NYSE) Rev Your Engines

COMPANY OVERVIEW
Standard Motor Products, Inc., located in Long Island City, NY, is a manufacturer and distributor of replacement parts for motor vehicles in the automotive aftermarket industry. The company operates in two segments, Engine Management and Temperature Control and sells its products to warehouse distributors and retail chains, primarily in the United States, Canada, and Latin America, as well as in Europe.
HIGHLIGHTS
• SMP generates over $1.3 billion in sales. ~81% of revenue is derived from the North American aftermarket where DIFM and failure related parts (non-discretionary) are expected to drive growth. SMP operates as a top five supplier for the majority of the large national and smaller regional distributors. Currently, SMP manufactures +60,000 part numbers to provide all the required parts for their DIFM customers along with providing exceptional service with a strong reputation. The supplier provides all of the parts for the cars out there compared to other competitors, which cannot manage a technician’s entire catalog.
• Three-fourths (73%) of SMP’s business is its engine management business, which not only manufactures engine components, but also vehicle sensors and electronics including the fast-growing ADAS, anti-lock braking, and tire sensor categories. A significant portion of the company’s business is directed towards the DIFM segment, which is expected to grow due to the increasing complexity and technical nature of these new vehicle parts. The remaining 27% of sales is the temperature control business, an engine agnostic aftermarket category. The company is committed to developing and growing parts that benefit from more complex/advanced ICE vehicles and the introduction of EV vehicles including: VVT and EVAP components, Diesel NOx sensors, turbochargers, battery current sensors, ABS/Traction control, and LCD displays.
• Over the last 10 years, 40% of capital has been allocated towards M&A. M&A is focused on specialized markets. YTD new channel revenue accounts for 20% of revenue. Specialized products have more stable technology, less competition and highly fragmented end-markets. These lines are either powertrain-neutral or focus on alternative fuel vehicles. A recent acquisition into a young Chinese company focused on electric compressors and provides entry into selling into the EV market in China and North America. Currently, 50% of sales are non-ICE dependent.
• The industry has faced significant supply chain headwinds; however, the company does not resell from Asia, which has enabled them to meet customer demand better than competitors that do. SMP generated 10% growth in the 1H2022 and +15% since 2019 by meeting customer demand during a difficult environment. On top of M&A, good customer relationships and a strong reputation enabled the company to grow with their customers. The company does not believe that customers need to restock at current inventory levels.
• SMP has seen strong willingness by its customers (the big distributors) to accept price increases. The company has been able to generate 27.3% gross profit margin in the 1H2022, which is only 100 bps below 2019 levels despite significant supply chain disruptions and inflationary pressures. Going forward, the shift back to DIFM will support SMP growth along with low new vehicle inventory in the short term.
Table 1 Standard Motor Products Earnings Model

Source: Company filings and Gabelli Funds estimates
Table 2 Standard Motor Private Market Value
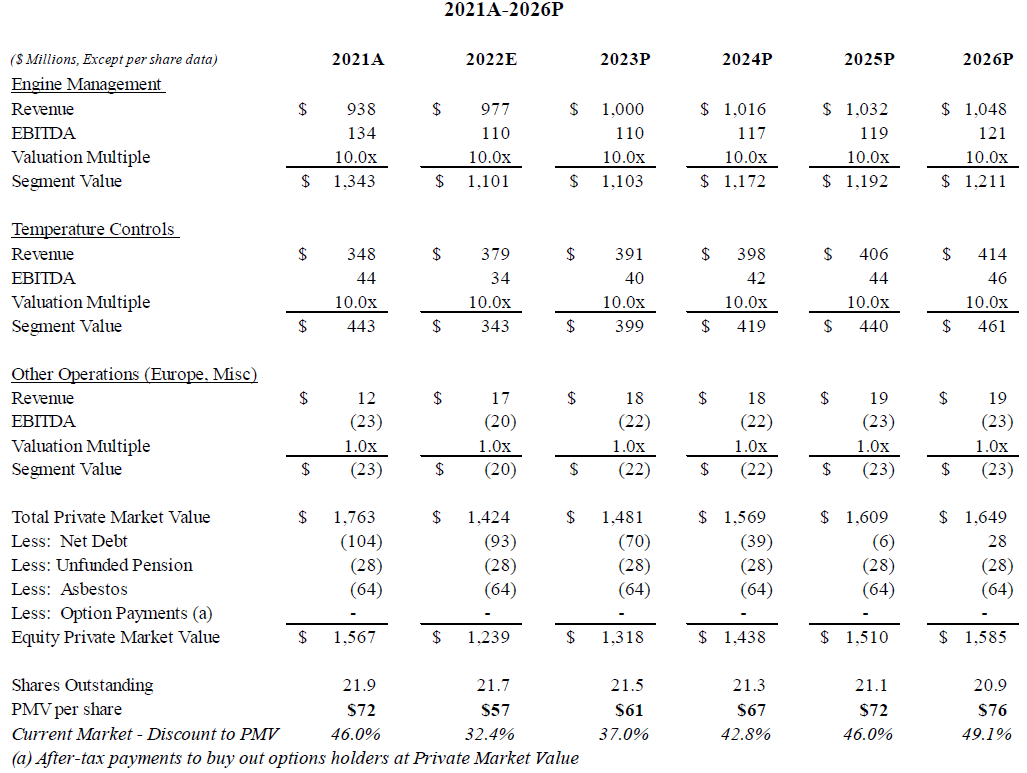
Source: Company filings and Gabelli Funds estimates
A. Carolina Jolly (914) 921-7762 Gabelli Funds 2022
cjolly@gabelli.com
Wallbox (WBX – $5.49 – NYSE) Charged Up
COMPANY OVERVIEW
Wallbox N.V, headquartered in Barcelona, Spain, designs, manufactures, and distributes charging solutions for residential, business, and public use. The company operates around the world with commercial activity in >105 countries and has four manufacturing facilities with >1mm of in-house production capacity. In 2021, WBX earned €72M in sales selling ~129K chargers and operated at a €45M EBITDA loss.
WBX has historically manufactured and sold home chargers but they have recently moved into the DCFC level 3 fast charging space with the recent introduction of their new hypernova and supernova products. WBX has also been introducing new innovative home charging products such as the Quasar bi-directional home charger. WBX went public via SPAC partner Kensington Capital Acquisition Corp in October 2021. The company was founded in 2015 by former Tesla employees Enric Asunción (current CEO) and Eduard Castañeda (current Chief Product Officer).
HIGHLIGHTS
• WBX is well positioned in the home charging market but has also been expanding into other segments with new product launches. On the home charging side, WBX has recently introduced bi-directional charging products, which allows the EV to send power to the home and receive it back, which will ease pressure on the electric grid in times of high demand and allow the customer to take advantage of lower electricity prices in times of lower demand. WBX has also recently introduced DC fast charging products, Supernova and Hypernova. Supernova can charge at powers between 60-150kW and Hypernova can charge at powers from 150-400kW.
• Having in-house manufacturing has been a key advantage for WBX. Not only does this allow WBX to have some of the highest gross margins of publicly traded EV charging companies, but this also allowed WBX to fill customer orders quickly, with disclosing that 90% of orders are delivered in less than 72 hours. WBX has been investing further in ramping up in-house capacity, with their recently built facility in Arlington, Texas bringing capacity to >1mm units.
• WBX has been focused on vertical integration and spoke about this at the conference. The company would like to integrate everything from sourcing, supply, and manufacturing as well as certification, servicing and installation. WBX recently made further progress on this front with their recent acquisition of Coil, which is an installer of home chargers in the United States.
• WBX is trying to position itself as not only an EV charging company, but also an energy management company, and the company spoke about strides they have been making in the energy management space. WBX offers energy management products such as their bidirectional charger as well as “myWallbox” software. WBX has also been making strategic partnerships to further identify themselves as an energy management company. For example, customers are 3x more likely to buy solar panels after the purchase of an EV, so WBX partners with solar companies to become further integrated into the energy management of the customer.
• WBX has a diverse client base, which they also spoke to at the conference. WBX’s customers range from OEM’s, dealers and energy companies to value added distributors, installers, and other enterprises. As WBX expands into the DC fast charging space the company will likely be adding additional channels, for example charge point operators (CPO’s) will likely have a much larger share of WBX’s revenue moving forward.
Jack Haverty (914) 921-8381 Gabelli Funds 2022
jhaverty@gabelli.com
IMPORTANT DISCLOSURES
This whitepaper was prepared by Brian Sponheimer, Carolina Jolly, CFA, Matthew Brooklier, Wayne Pinsent, CFA and Jack Haverty. The examples cited herein are based on public information and we make no representations regarding their accuracy or usefulness as precedent. The Research Analyst’s views are subject to change at any time based on market and other conditions. The information in this report represents the opinions of the individual Research Analyst’s as of the date hereof and is not intended to be a forecast of future events, a guarantee of future results, or investment advice. The views expressed may differ from other Research Analysts or of the Firm as a whole.
As of September 30, 2022, affiliates of GAMCO Investors, Inc. beneficially owned 14.97% of Myers Industries, 10.30% of Rush Enterprises Class B and less than 1% of Class A, 4.32% of Dana, 3.72% of Commercial Vehicle Group, 2.90% of Standard Motor Products, 1.61% of AutoNation, 1.49% of Garrett Motion, 1.16% of Genuine Parts, 1.01% of Monro Muffler, and less than 1% of all companies mentioned.
One of our affiliates serves as an investment adviser to Dana and Genuine Parts or an affiliated entity and has received compensation within the past 12 months for these non-investment banking securities-related services.
This whitepaper is not an offer to sell any security nor is it a solicitation of an offer to buy any security.
Investors should consider the investment objectives, risks, sales charges, and expenses of the fund carefully before investing.
For more information, visit our website at: www.gabelli.com or call: 800-GABELLI
800-422-3554 • 914-921-5000 • Fax 914-921-5098 • info@gabelli.com