– 2024 Review –
In 2024, West Texas Intermediate (WTI) crude prices increased less than 1% and Brent crude prices decreased 4%. Lower production from Saudi Arabia and slower-than-expected growth from the U.S. and Brazil was offset by overproduction from select OPEC+ countries. China demand was flat and growth from the rest of the world was modest.
Despite experiencing another warm winter and LNG export facilities startup delays, natural gas prices increased by 31.8% during 2024. Operators dropped rigs, reduced activity and curtailed production after Henry Hub prices declined under $2 per MMBtu. JKM and TTF prices increased YoY by 23.6% and 31.3%, respectively, due to improved due to growth in Asia, the need to replace Russian pipeline gas, and geopolitical uncertainties.

The S&P Energy Index increased 5.7%, but underperformed the S&P 500 Index, which returned 25.0%. Within the energy sector, natural gas-oriented E&P companies outperformed oil-oriented E&P operators due to optimism about power demand growth. Oil E&P companies continued to focus on shareholder returns and returned a large portion of their free cash flow to shareholders.
The PHLX Oil Service Sector index declined by 11.7%. Large service providers such as SLB and Halliburton were surprised when the Kingdom of Saudi Arabia abandoned plans to increase its maximum sustainable capacity (MSC) to 13.0 million b/d. Saudi Arabia plans to maintain its maximum MSC at 12.0 million b/d. It will allocate additional resources to the Jafurah field and has set a goal of 60% higher gas production by 2030 to meet domestic demand and become a major exporter. Offshore service provider stock prices held up fairly well in the 1H’24 but underperformed in the 2H’24 due to lower demand for rigs coming off contracts. The re-contracting challenge created white spaces on the calendar for many offshore contractors for 2025. E&P operators have delayed new rig contracts due to supply chain issues (such as flexible pipes and FPSO), which will postpone first oil from new wells.

– 2025 Outlook –
The industry environment entering 2025 is unsettled. Unknowns include the Trump administration’s trade policies, the prospect of retaliatory trade wars, potential sanctions on Iran and Venezuela by the administration, the overhang of OPEC’s spare capacity, the potential end to the Russia/Ukraine war, and recent Chinese stimulus actions. During his first term, President Trump publicly chastised the industry during oil price spikes. His administration could intervene if prices rise rapidly.

Similar to 2024, we expect macroeconomic factors to be the primary driver of crude prices in 2025. We remain cautious about crude prices and believe the risks are biased to the downside. Absent geopolitical events or supply disruptions, we project Brent crude prices to trade between $65 and $80 and WTI crude prices to range between $60 and $75 in 2025. For Henry Hub, our range is $3.25-3.75 MMBtu, consistent with the forward curve.
Trump 2.0
President-elect Trump campaigned on the promise to lower inflation. Increasing U.S. crude oil production to lower energy costs is a key component of that pledge. Treasury Secretary-elect Scott Bessent has targeted 3.0 million barrels of oil equivalent per day production growth by 2028.
Reversing Biden’s Energy Policies
We expect Trump’s administration to reduce the industry’s regulatory burden, which will lower compliance costs, reduce production costs, and eliminate the methane emission fee. Trump stated that he would remove the Biden administration’s pause on LNG export permits to non-FTA countries (in place since January 2024) on his first day in office. There are nine projects, representing ~140 mtpa, awaiting either permitting or final investment decision (FID), and another nine projects, accounting for 82.8 mtpa, that have non-FTA authorization expiring soon. In the long term, Trump can encourage energy production by increasing permitting activity on federal lands, increasing offshore lease sales, and decreasing lease and royalty rates.

“Drill, Baby, Drill”
Despite Trump’s pledge to significantly boost drilling and oil production growth, we don’t believe the U.S. will experience a surge in production during Trump’s second term. The shale landscape has changed meaningfully since 2020. First, less capital is available, and project costs have increased significantly due to higher interest rates and inflation. Many financial institutions have either scaled back or exited financing fossil fuel projects. During Trump’s first term, many small and medium-sized oil companies took advantage of low interest rates and available capital to drill, to increase proven reserves, and to grow production. This behavior won’t recur during the second term. Second, oil majors now dominate shale. They tend to run steady drilling programs. Oil majors maintain financial discipline and focus on shareholder returns. For the near term, many operators are guiding to low to mid-single-digit production growth. Third, we project U.S. E&P capital expenditures to decline by ~5% in 2025. Given the high decline rate of shale wells, we believe most of the E&P capital expenditures will go toward replacing declines instead of growing production.
Strategic Petroleum Reserve
Trump wants to refill the Strategic Petroleum Reserve (SPR). The SPR currently stands at ~395 million barrels, compared to ~640 million barrels at the beginning of the Biden administration. Biden released 180 million barrels from the SPR in 2022 to lower consumer gasoline prices. The SPR reached a trough of 346.8 million barrels in July 2023. Biden had enough funding and secured agreements to refill another ~15 million barrels through May 2025. If President Trump wants to buy additional barrels for the SPR after May, Congress will have to approve the funds.

Modify the Inflation Reduction Act (IRA)
Trump had repeatedly expressed his disdain for and desire to terminate the “Green New Deal.” For example, Trump declared that no new offshore wind farms would be built during his administration. Trump hopes to rescind all unspent funds under the Inflation Reduction Act (IRA) and use them for his priorities, such as a tax cut or an increase in defense spending. Major oil companies, a key Trump constituency, are beneficiaries of IRA funding for various low-carbon technology investments, including carbon capture, renewable fuels, and clean hydrogen. For example, Occidental Petroleum received a $1 billion DOE grant and supports the 45Q tax credits for its Direct Air Capture project. ExxonMobil benefits from the 45V tax credit for its sizeable hydrogen facility in Baytown, TX.
Any changes to the IRA will require congressional approval. We believe a full repeal of the IRA is unlikely. Eighteen House Republicans have expressed their support for maintaining parts of the IRA bill. Given the Republican’s slim majority (five seats currently), it will be difficult for Trump to modify the IRA. As a compromise, we expect some of the IRA’s tax credits will be modified (most likely via budget reconciliation). For example, maintaining the solar tax credit but modifying it to expire four years earlier (in 2028 vs. 2032) would allow Trump to reclaim around $50 billion in savings. We do not expect any changes to the 45Q tax credit, given the Republican’s historical support for CCUS. It is possible that the qualification deadline for credits may be extended as the utilization of CO2 (which currently receives a lower credit) has been viewed more favorably.
Global Crude Oil Supply vs. Demand
In our base case scenario, we project 2025 global demand to grow by ~800,000 b/d. Demand growth will be driven by higher consumption in emerging markets (mainly India and the Middle East), growth in petrochemicals, and improved demand for distillates and jet fuel.
- We estimate U.S. demand will remain unchanged at ~21.0 million b/d as growth in jet fuel, distillates, and petrochemicals offsets lower demand for transportation fuel (primarily due to increased mileage efficiency). The refilling of the SPR may provide an additional source of demand.
- We expect India’s crude demand to grow by 200,000 b/d to 5.8 million b/d. Increased economic activity and consumer consumption growth are driving higher distillates, jet fuel, and transportation fuel usage.
- Our forecast for China is growth of 300,000 b/d (to 16.5 million b/d), driven by new refineries and petrochemicals. Demand may be negatively impacted by the increased market share of electric vehicles and LNG trucks. New tariffs by the Trump administration could hinder China’s economic recovery. Unless China can achieve 5% GDP growth or more, crude demand growth will be less than 1.0 million b/d.

We project global supply growth of ~1.2 million b/d, driven by the U.S., Canada, Guyana, and Brazil.
- We estimate U.S. crude production will grow by ~300,000 b/d, with shale growth of 200,000 b/d. The benefit from longer laterals and production efficiencies will be partially offset by the lower yields of shale wells and lower rig utilization. We expect a ~90,000 b/d increase in Gulf of Mexico production as new projects are brought online.
- Guyana is currently producing ~650,000 b/d. In late 2025, ExxonMobil/Hess is expected to bring online its fourth development, Yellowtail. This development will increase Guyana’s production to over 900,000 b/d.
- Brazil continues to develop its offshore resources. In 2025, three FPSO with a combined nameplate capacity of 590,000 b/d are expected to commence production. Brazilian production is projected to grow from 3.3 million b/d in 2024 to 3.7 million b/d in 2025.
- We project Canadian production to increase by nearly 300,000 b/d driven by the launch of the 600,000 b/d Trans Mountain (TMX) pipeline expansion in 2024.
OPEC/OPEC+ Production
OPEC+ (consisting of OPEC, Russia and nine other countries) is producing ~40.5 million b/d, which include 9.0 million b/d from Saudi Arabia and 9.0 million b/d from Russia.
At its annual meeting in December, OPEC+ announced that the group will maintain its voluntary cuts of 2.0 million b/d through the end of 2026. Additionally, the nine countries (Saudi Arabia, the UAE, Kuwait, Iraq, Algeria, Oman, Kazakhstan, Gabon, and Russia) that voluntarily reduced their production by 1.65 million b/d (first announced in April 2023) will also extend their reductions until the end of 2026. Finally, eight countries (Saudi Arabia, UAE, Russia, Iraq, Kuwait, Kazakhstan, Algeria, and Oman) who volunteered to lower their production by an additional ~2.2 million b/d (initially announced in November 2023) also announced that they intend to extend their voluntary reduction. Initially, these voluntary cuts were to be returned to the market in October 2024. However, the eight countries agreed to postpone the return of these barrels to the end of 1Q’25 due to demand uncertainty. These barrels will now be returned to the market over 18 months beginning in April 2025 (or ~105,000 b/d per month).

We believe the cohesion within OPEC+ could be tested in 2025. Despite the group insisting that all members agree with the Declaration of Cooperation (signed in April 2020) and would adhere to their production quotes, four countries (the UAE, Kazakhstan, Iraq, and Russia) overproduced throughout 2024. These overproducers combined with Iranian barrels will test Saudi Arabia’s willingness to prop up crude prices by ceding market share. A change in policy could result in a return of the almost 2.0 million b/d the Saudis are currently withholding from the market. This scenario could cause oil prices to decline into the low-to mid-$50s for two-to-three quarters as the market absorbs the increased supply. By punishing the overproducers, the Saudis could reassert control of the crude oil market. Lower oil prices will slow drilling and completion activity worldwide, temporarily pause exploration and development activities, and pause new supply coming onto the market.
The lower prices in this scenario would reduce the rate of inflation and stimulate global consumption. While the short-term impact would be negative for energy companies, the higher demand and lower supply could trigger a multi-year bull market. The Saudis may accept two to three quarters of pain for two to three years of prosperity.
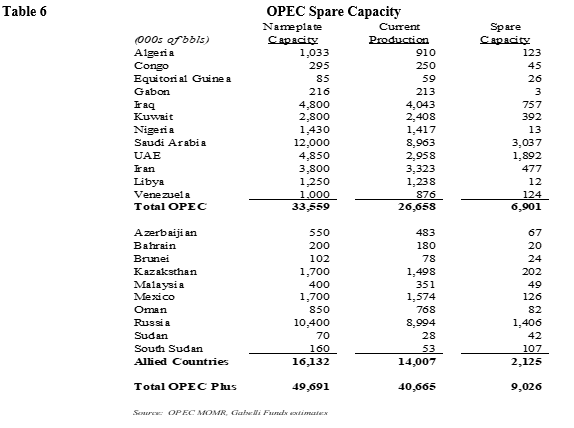
OPEC/OPEC+ Spare Capacity
OPEC’s estimated spare capacity is ~6.9 million b/d. This excess capacity will allow OPEC to manage crude price increases. OPEC does not want excessively high crude prices, which can cause a recession, decrease demand for crude and crude products, and encourage the development and acceleration of electrification and other alternative energy sources.
China
China’s crude oil consumption (16.2 million b/d) was unchanged in 2024, compared to 2023. Growth in petrochemicals was offset by lower consumption of both distillates and gasoline. Before the pandemic, China accounted for 40% of global oil demand growth. China’s use of the barrel is shifting from transportation fuels to petrochemicals. The petrochemical sector now accounts for 18% of the crude product demand, compared to 11% prior to the pandemic. The mix of transportation fuels (gasoline and diesel) is currently 34%, which compares to 39% in 2019. The lower mix of transportation fuels is not due entirely to lower consumer spending.

We believe China’s oil demand has been impacted by both cyclical and structural factors. A cyclical decline in demand will eventually correct, but the structural demand reduction engineered by China’s leadership will not be reversed. The population decline and rapidly shifting demographics will exacerbate the demand impact from the structural changes. China’s real estate sector drove the cyclical decline in 2024. The lower construction activity depressed diesel demand. Diesel demand should rebound with an increase in construction activity.

The Chinese government incentivized truck owners with subsidies ranging between 30,000-80,000 yuan ($4,200-11,200) to upgrade or scrap their diesel trucks for low-emissions trucks that are fueled by LNG, compressed natural gas, fuel cells, or power batteries. LNG truck sales doubled in 1H’24 to 108,000. In 2024, LNG trucks represented 900,000 units out of the 8.0 million total heavy trucks on the road. For 2025, the LNG units are projected to exceed 1.0 million units. It is estimated that LNG trucks reduced diesel demand by ~200,000 b/d.

The Chinese government also provided heavy incentives for purchases of electric vehicles. Beginning in July of 2024, consumers received a $2,800 subsidy for scrapping an older car and replacing it with an EV. The increase in July was a doubling of initial subsidy, which was introduced in April of 2024. The increased subsidy contributed to September’s growth in auto sales, which increased year-over-year to 2.13 million from 2.04 million vehicles. YTD vehicle sales through September increased by 1.9%. Sales of electric vehicles and plug-in hybrids, which increased by 50.9% year-over-year, accounted for ~52% of overall sales. The estimated impact of EV substitution for ICE vehicle was ~125k b/d.

Iran
Iran produces 3.3 million b/d of crude, of which it exports 1.7 million b/d. For 2025, some market participants have forecast an elimination of Iranian supply due to sanctions by the Trump administration. We don’t believe new sanctions will have any impact on the global crude supply. In his first term, President Trump ensured that supply wouldn’t be disrupted by the imposition of sanctions through a five-month grace period for buyers of Iranian crude. It will be no different this time. Prior to any attempts to enforce sanctions, we expect Trump to encourage OPEC+ to replace the Iranian barrels. OPEC+ may not respond favorably to this type of proposal. Saudi Arabia and the UAE have recently normalized relations with Iran and will not want to engage in a tit-for-tat deal against it. These normalized relationships are the reason why the Houthis are not currently attacking them with missiles.
Even if Trump successfully implements sanctions, we don’t expect a significant decline in Iranian oil exports. Iran utilizes its own fleet of dark ships to transport its cargo to three countries, most notably China. Further, Iran has completely circumvented the dollar clearing system for its oil trade, and it does not access western P&I for fleet insurance, since it self-insures nearly all of its oil and some of its product cargoes.

Natural Gas
The natural gas market enters 2025 with improving fundamentals driven by new LNG export facilities and power growth.

The U.S. natural gas market is on the cusp of another cycle of demand growth, driven by LNG exports and rising electricity consumption. The U.S. had ~15 bcf/d of nameplate LNG in service at the end of 2024, with another 12 bcf/d of additional capacity under construction or pending FID. The second wave of LNG would increase U.S. global market share to ~35% by 2030. There is also another 10 bcf/d of incremental capacity that has DOE permit approval and could move forward. Based on projects under construction, U.S. LNG export capacity is set to increase by about 85% over the next five years, adding ~11 bcf/d of incremental natural gas demand. Further FIDs would be additive to this growth. In 2025, about 3.1 bcf/d of new LNG export capacity will be online, led by Cheniere’s Corpus Christi Stage 3 and Venture Global’s Plaquemines.

Following 15 to 20 years of stagnant demand, a new electricity growth cycle has begun. The growth drivers are new data centers, generative artificial intelligence, onshoring of manufacturing, coal plant retirements, and the broader trend of electrification. Natural gas demand from power producers is expected to increase by 30-50% through 2030. A slowdown in wind and solar projects could contribute to faster growth in natural gas demand. A full repeal of the IRA could add up to ~5 bcf/d of incremental demand by 2030.

Global LNG Dynamics Remains Favorable
Global LNG demand grew ~ 3.2% in 2024 to 414 million tons per annum (mtpa). Demand is projected to grow an additional 5% in 2025 to ~ 435 mtpa. Asia will remain the primary driver of incremental demand. Europe’s substitution of Russian piped gas with LNG is expected to increase in 2025 as the current transit contract between Russia and Ukraine expired at the end of 2024. The transit deal expiry will result in a deficit of 15 bcm (~11 mtpa) of natural gas supply.

Longer term, global LNG demand is expected to grow 3% annually through 2040 to ~685 mtpa. Chinese imports are projected to increase from ~ 71 mtpa in 2023 to 135 mtpa by 2032. South and Southeast Asia are expected to drive global LNG demand growth beyond 2032.
We estimate ~175 mtpa of global capacity additions between 2024 and 2030. Key project delays have tempered the rate of supply growth over the next few years. Approximately 50 mtpa of capacity that was originally slated for startup in 2025 and 2026 has been delayed. Notably, Golden Pass (~18 mtpa) in the U.S. had been delayed by one year due to a contractor bankruptcy filing. Qatar’s North Field East/South project (33 mpta) ramped up at a slower-than-expected rate.
E&P Global Capex
Our 2025 global E&P capex forecast is $424.8 billion, up 0.2% YoY.

- We project North America E&P spending is expected to decline by 3.2%. This forecast assumes spending by the majors declines by 3.0% and U.S. independents and privates reduce spending by 10%.
- We estimate International spending is expected to grow by 1.5%. We expect spending in the Middle East and Latin America to increase by 5.0% and 7.5%, respectively. We project spending in Europe to decline by 5.0% and the rest of the world to remain unchanged compared to 2024.
Themes for the E&P Sector in 2025
- Favor natural gas operators over oil operators. We believe natural gas prices are too low currently to incentivize supply to meet the upcoming demand surge. As natural gas prices rise, many natural gas operators will benefit and generate improved earnings and higher free cash flow. Once this scenario takes hold, we expect natural gas E&P companies to return cash to shareholders via increasing dividends and share repurchases. We believe the risk for oil prices is biased to the downside.
- Maintain capital discipline. Despite Trump’s pledge to increase production, most public E&P operators will maintain capital discipline and shareholder payouts. They will remain focused on technology-driven productivity, cost savings, and achieving acquisition synergy targets. Our conversations with operators indicate that most producers are budgeting for maintenance level or low production growth.
- Free cash flow generation. Even if crude prices average $60/bbl, E&P companies should still generate healthy free cash flow in 2025. E&P profits will benefit from declining oilfield service prices (primarily OCTG, sand, and diesel fuel). Over the past few years, the energy sector’s capital allocation framework shifted from low-return production growth to improving returns on investment, generating free cash flow, and returning cash to shareholders. Shareholder returns include fixed dividends, variable dividends, and share repurchases. We expect capital allocation priorities to remain unchanged in 2025.
- Capital efficiency. E&P companies are drilling on more tier 3 and tier 4 acreages. These acreages produce more natural gas and less oil. As a result, operators must work harder by drilling and completing longer laterals or more wells to keep oil production flat. Producers with higher quality acreages will outperform those who have more tier 2 and tier 3 acreages.
- Deals, deals, and more deals. Over the past two years, energy sector M&A has exceeded $300 billion. We expect further consolidating transactions in 2025, though at a slower pace. The regulatory environment will likely improve under the Trump administration. Regulators should be more amenable to larger scale deals. Over time, we expect consolidation to lead to fewer but higher-quality E&P companies. U.S. majors will remain the primary consolidators.
Themes for Oilfield Service and Equipment Sector in 2025
- U.S. rig count likely to increase after two years of decline. The U.S. rig count has declined for two consecutive years from ~745 rigs at the beginning of 2023 to ~590 currently. The current fleet consists of ~480 rigs drilling for oil and ~100 rigs for natural gas. Given the expected increase in natural gas demand, we don’t believe the 100 natural gas rigs will be sufficient to maintain current production. If natural gas demand accelerates, there are not enough deployed rigs to support the higher demand. For example, the Haynesville basin has 30 natural gas rigs working, well below ~70 rigs needed to maintain production. We don’t believe the natural gas rig count required to grow production will rebound to the 2013 level of ~450, but it is likely higher than 100.
- Prospect for a better frac market. Just as we believe we may be near a rig count bottom, we may also be near the bottom for completion or frac activity. Completion activity should follow the increase in rig count with a six-week lag. The pressure-pumping industry has consolidated, with the top five players controlling about 75% of the supply. These companies remain disciplined with pricing and new supply additions. New fleets, primarily e-frac or Tier 4 DGB, are replacing older fleets, such as Tier 2 diesel, and are not incremental to industry supply. Lead time for new equipment remains around nine to twelve months, and large pads require increased horsepower. Therefore, any increase in completion activity will tighten industry supply, which will lead to higher prices and profits.
- International E&P capex. Driven by the Middle East/North Africa National Oil Companies (NOCs) and Asia, we expect continued growth in international activity. Latin America will be mixed as stable activity in Guyana and increased offshore activity in Brazil offsetsuncertainties in Mexico. Saudi Arabia is reallocating resources from oil to natural gas. The UAE plans to increase its oil capacity to 5.0 million b/d by the end of 2026 from 4.85 million b/d currently. In November 2024, PEMEX froze new contracts with service providers due to its approximately $20 billion of debt. For 2025, the Mexican government reduced PEMEX’s budget by 7.5% to $22.75 billion. Mexico is producing ~1.8 million b/d but production has been declining for decades. Argentina provides upside. Argentina President Javier Milei’s policy to deregulate the country had been received favorably and improved economic growth. Natural gas production is booming in the Vaca Muerta shale basin, but pipeline capacity limits the basin’s potential.
- Offshore activity is in a holding pattern. Due to supply chain constraints (notably for flexible pipes and FPSO deliveries), offshore operators are in a wait-and-see mode. 2024 subsea awards are expected to be around 230-250 trees (compared to expectations of over 300 trees coming into the year) vs. 264 in 2023 and 348 in 2022. 2025 subsea trees are projected to rebound to 280. Offshore FID totaled $75 billion in 2024 (compared to projections of $150 billion or more coming into the year). Wood Mackenzie now estimates 2025 FIDs to total ~$90 billion, down from its previous estimate of $160 billion just three months ago. Several large project FID projects have been pushed out to 2026, including Qatar’s North Field West ($20B), Petrobras’ Sergipe-Alagoas ($8B), and Pemex/Talos Zama ($6B).
- Profitable but volatile. Despite the declining rig count and frac spreads, day rates for high-specification land rigs and pricing for contract pressure pumping work have remained relatively stable compared to prior cycles. Land rig contractors have idled rigs rather than provide deep discounts. Like land rig contractors, pressure companies have idled spreads rather than accept low prices and low returns on their capital investments. The transition to electrification has helped frac companies to maintain price discipline. Many of the new electric spreads were deployed with three-year contracts and fixed prices. Offshore rig contractors will experience some white space on their calendar as rigs that came off contract in 2024 remain uncontracted. Nevertheless, the rig contractors’ backlog should enable them to continue to generate earnings and robust FCF. Subsea equipment providers are benefiting from higher prices during the bid process. All these factors should allow many oilfield service and equipment companies to weather the current soft patch in activity.
- Free Cash Flow Generation and shareholder return. Investors continue to favor companies that generate free cash flow and return it to shareholders. Several companies have shareholder return programs in place. SLB plans to return a minimum of 50% of its FCF via dividends and share repurchases. Similarly, Halliburton intends to return at least 50% of its FCF. Other companies with shareholder return plans include TechnipFMC, Helmerich & Payne, Patterson-UTI Energy, and Liberty Energy. We expect OFS companies to maintain their focus on returning cash to shareholders in 2025.
- M&A among suppliers. Last year, Diamond Offshore was acquired by Noble Corporation and Dril-Quip merged with Innovex International. We believe M&A activity will continue in the oilfield service and equipment sector in 2025 as OFS providers need scale up to service the larger E&P operators. Subscale companies that can benefit from M&A include Weatherford Int’l, RPC, Core Laboratories, Seadrill and Helix. Potential acquirers include Halliburton, Expro Group Holdings, Profrac Holding, and Transocean.
Simon T. Wong, CFA
914-921-5125
swong@gabelli.com
ONE CORPORATE CENTER RYE, NY 10580 Gabelli Funds TEL (914) 921-5100
This whitepaper was prepared by Simon T. Wong. The examples cited herein are based on public information and we make no representations regarding their accuracy or usefulness as precedent. The Research Analyst’s views are subject to change at any time based on market and other conditions. The information in this report represent the opinions of the individual Research Analyst’s as of the date hereof and is not intended to be a forecast of future events, a guarantee of future results, or investments advice. The views expressed may differ from other Research Analyst or of the Firm as a whole.
As of September 30, 2024, affiliates of GAMCO Investors, Inc. beneficially owned 4.3% of Innovex and less than 1% of all other companies mentioned.
This whitepaper is not an offer to sell any security nor is it a solicitation of an offer to buy any security.
Investors should consider the investment objectives, risks, sales charges and expense of the fund carefully before investing.
For more information, visit our website at: www.gabelli.com or call: 800-GABELLI
800-422-3554 • 914-921-5000 • Fax 914-921-5098 • info@gabelli.com